
Potassium Spraying Preharvest and Nanocoating Postharvest Improve the Quality and Extend the Storage Period for Acid Lime (Citrus aurantifolia Swingle) Fruits


Abstract
:1. Introduction
2. Materials and Methods
2.1. Reagents, Chemicals and Microbial Media
2.2. Fruits
2.3. Treatments
2.3.1. Preharvest Treatment
2.3.2. Postharvest Treatments
2.4. Preparation of Nanocoating
2.4.1. Biosynthesis of ZnONPs
2.4.2. Nanocoating Formulation
2.4.3. Nanocoating Characterizations
2.5. Fruit Analyses
2.5.1. Fruit Decay
2.5.2. Physical Characteristics
Fruit Weight
Fruit Length and Fruit Diameter
Fruit Volume
Fruit Firmness
Fruit Juice Volume
2.5.3. Fruit Chemical Characteristics
Total Soluble Solids
Titratable Acidity
Ascorbic Acid Content
2.5.4. Fruit Weight Loss
2.6. Statistical Analysis
3. Results
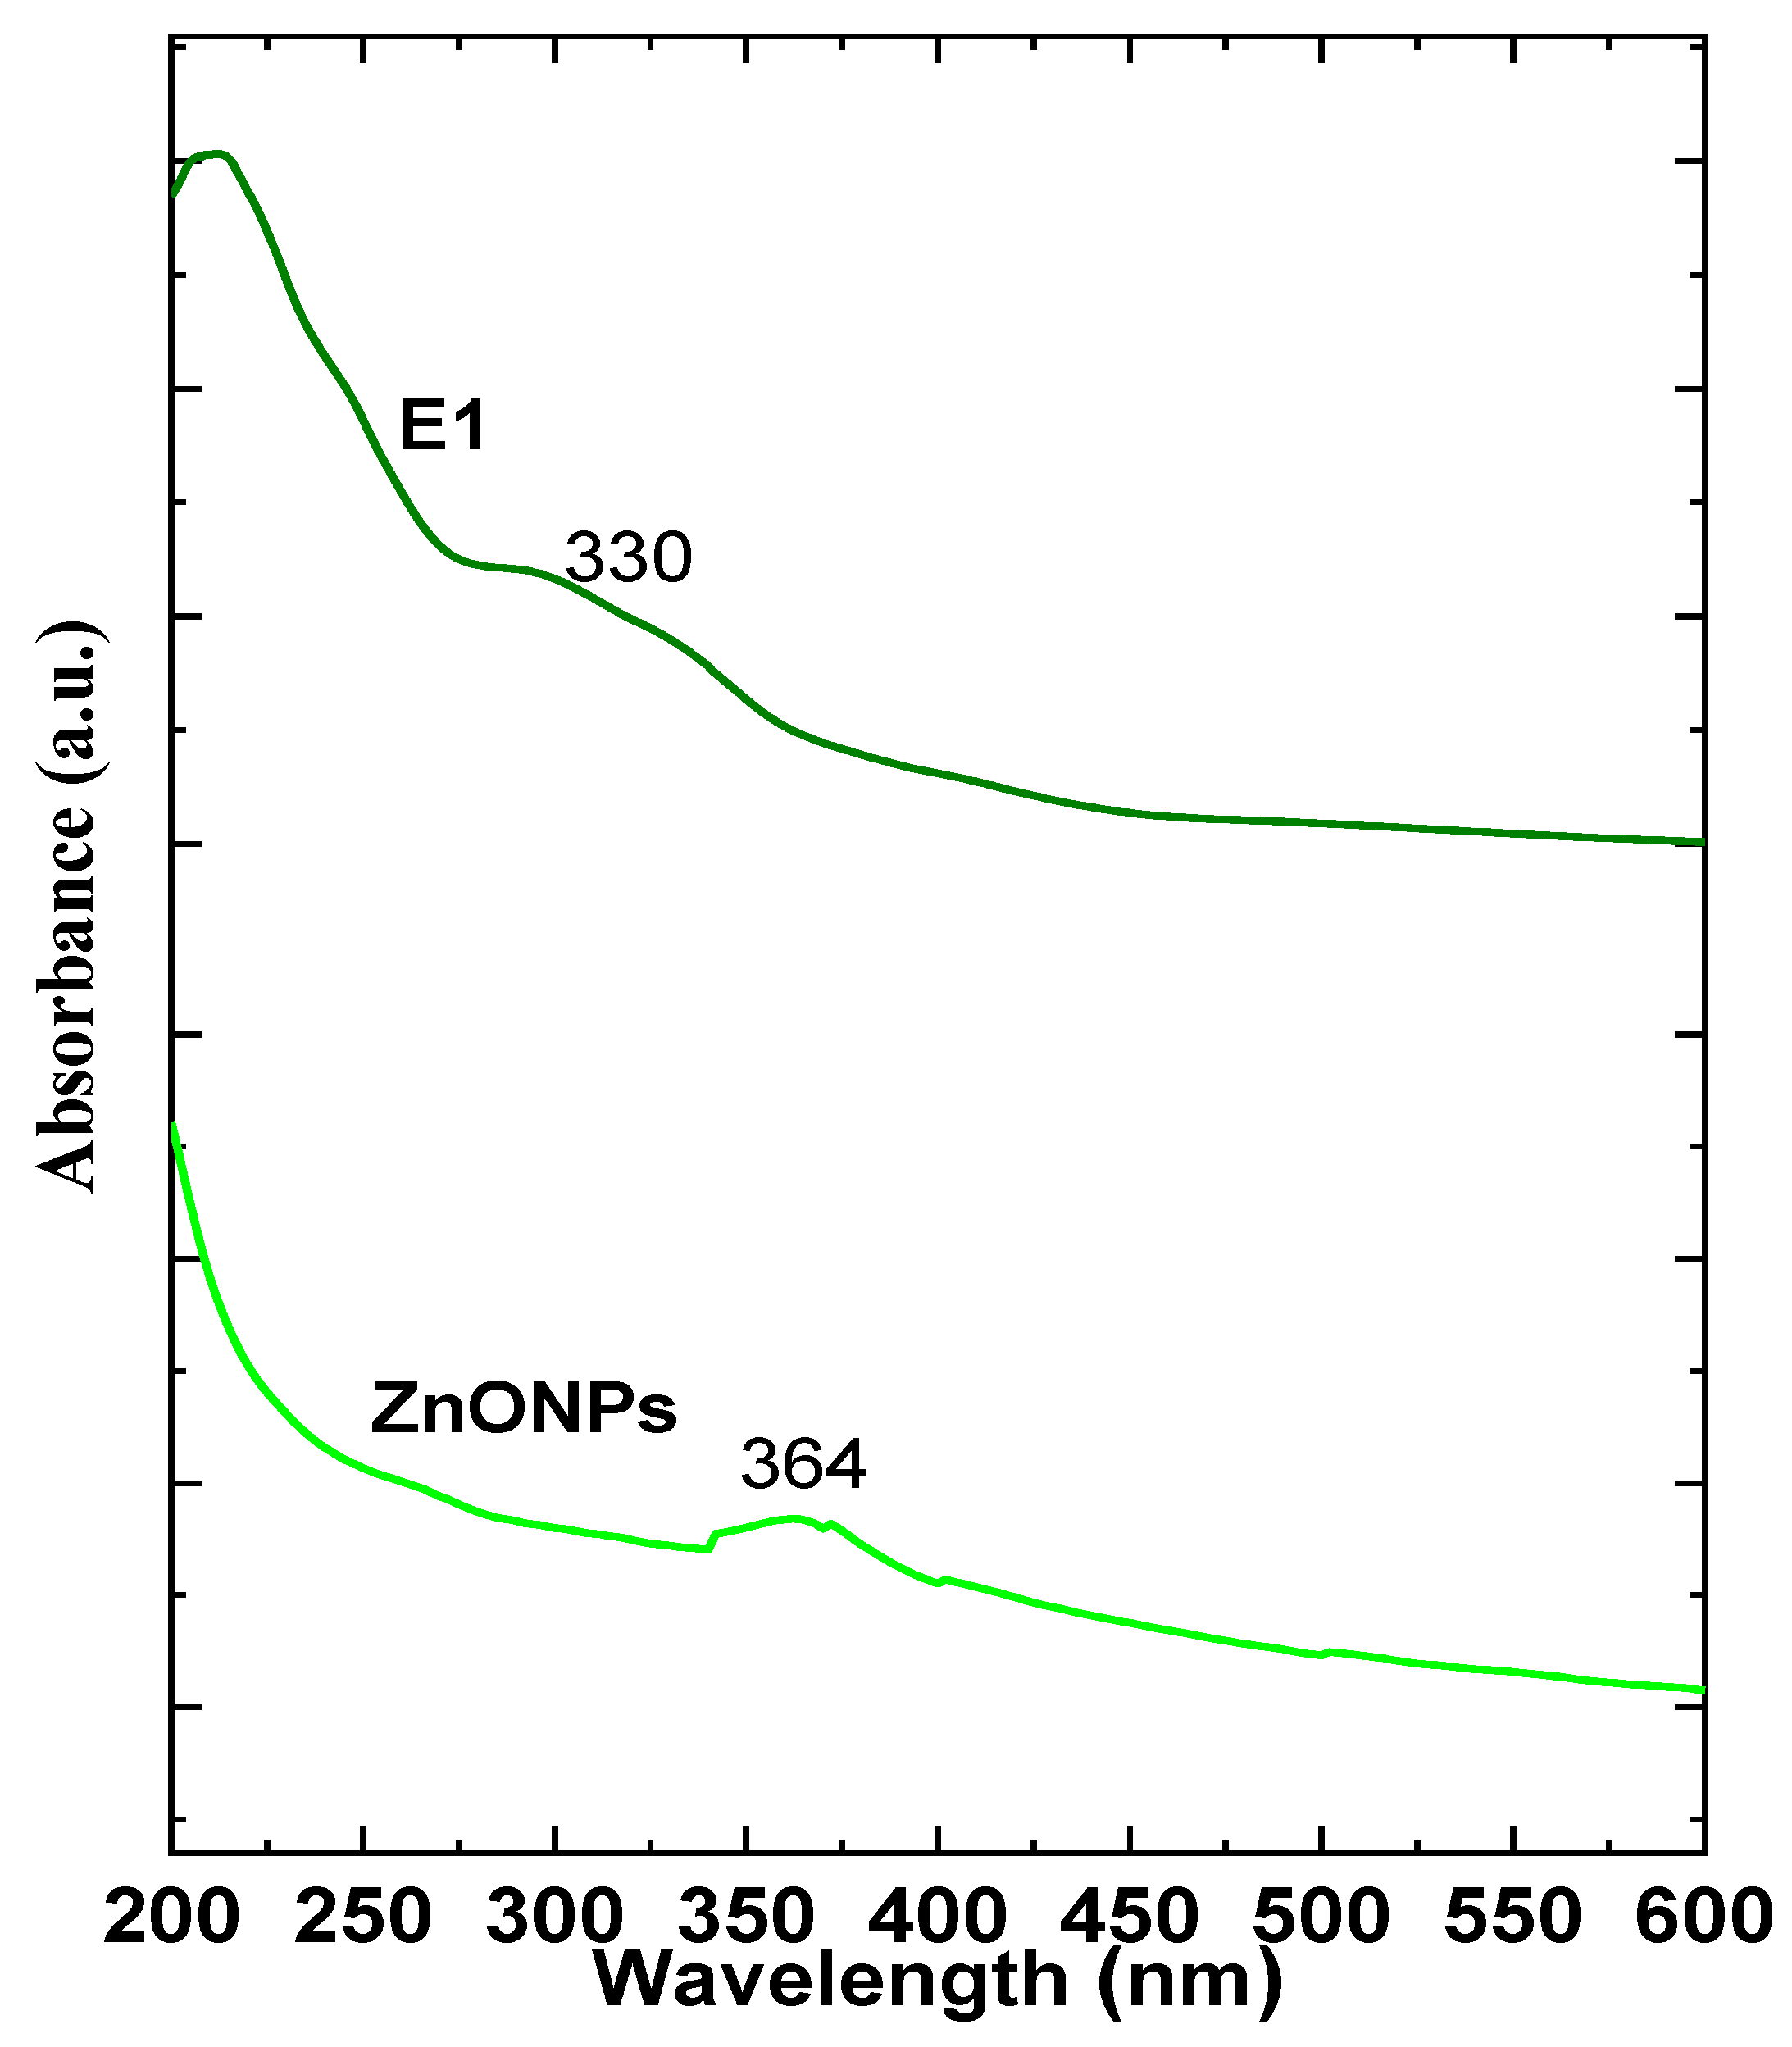
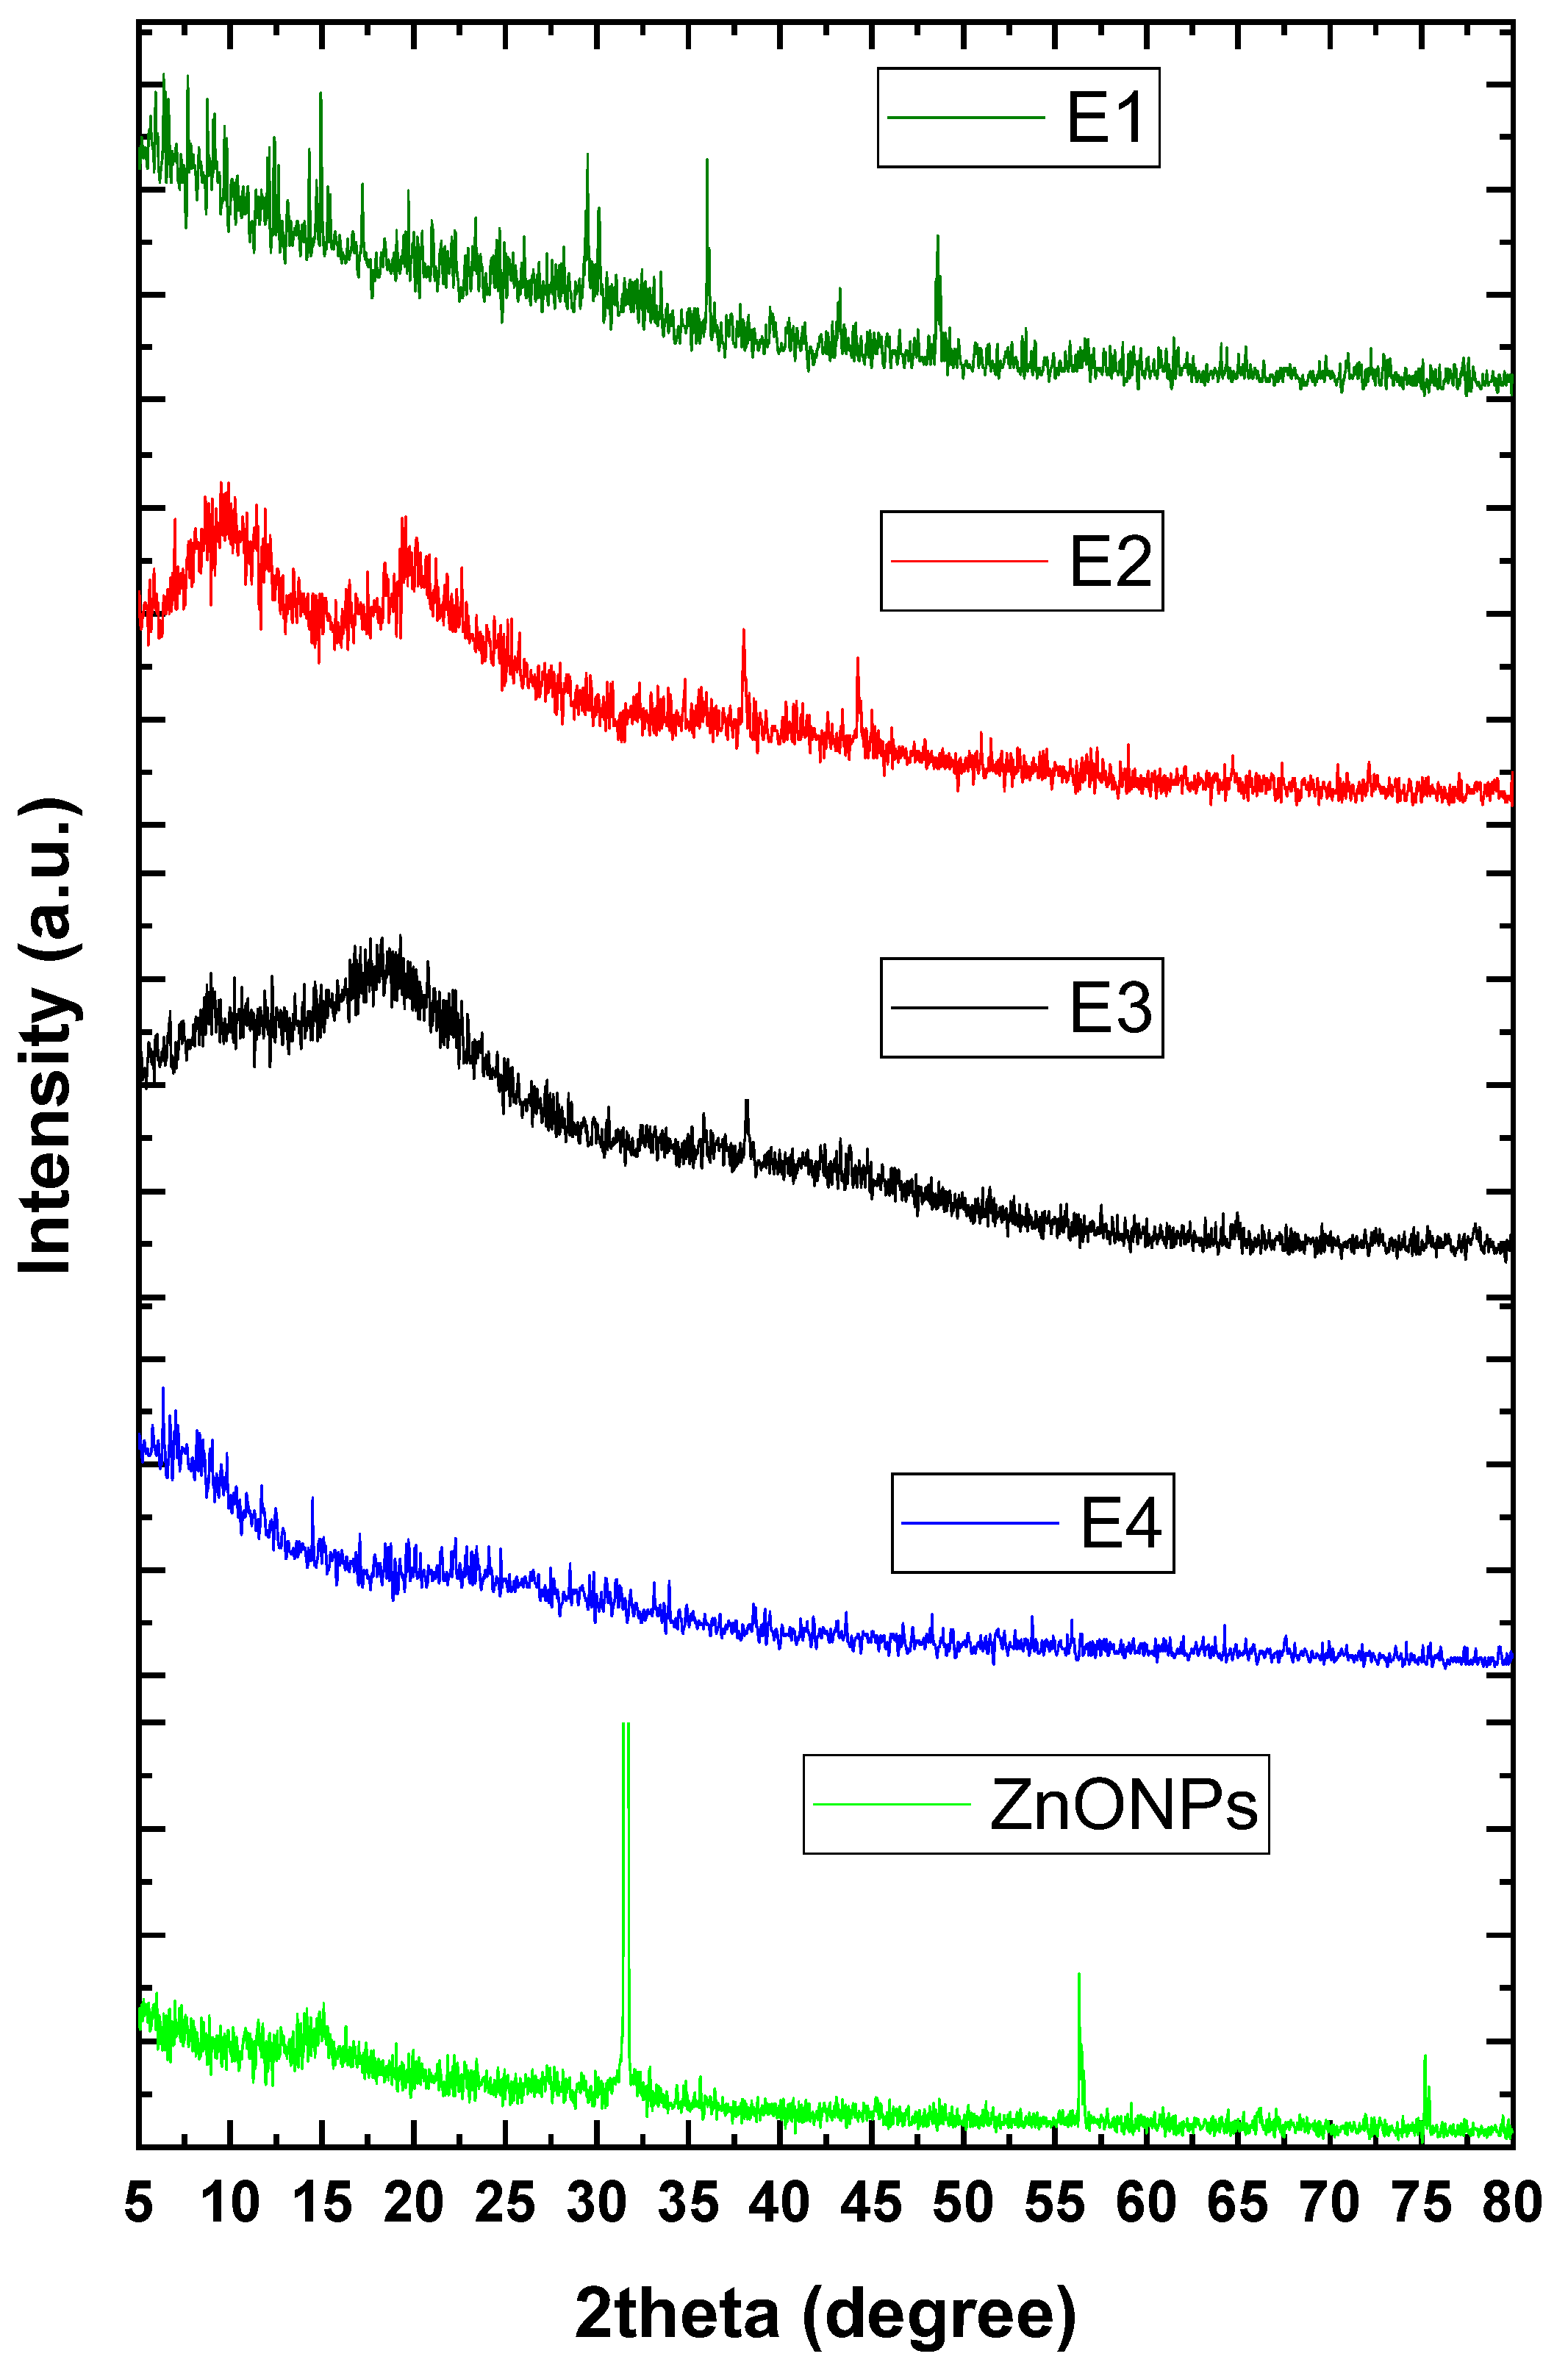
3.1. Nanocoating Characterizations
3.1.1. Physicochemical Analysis
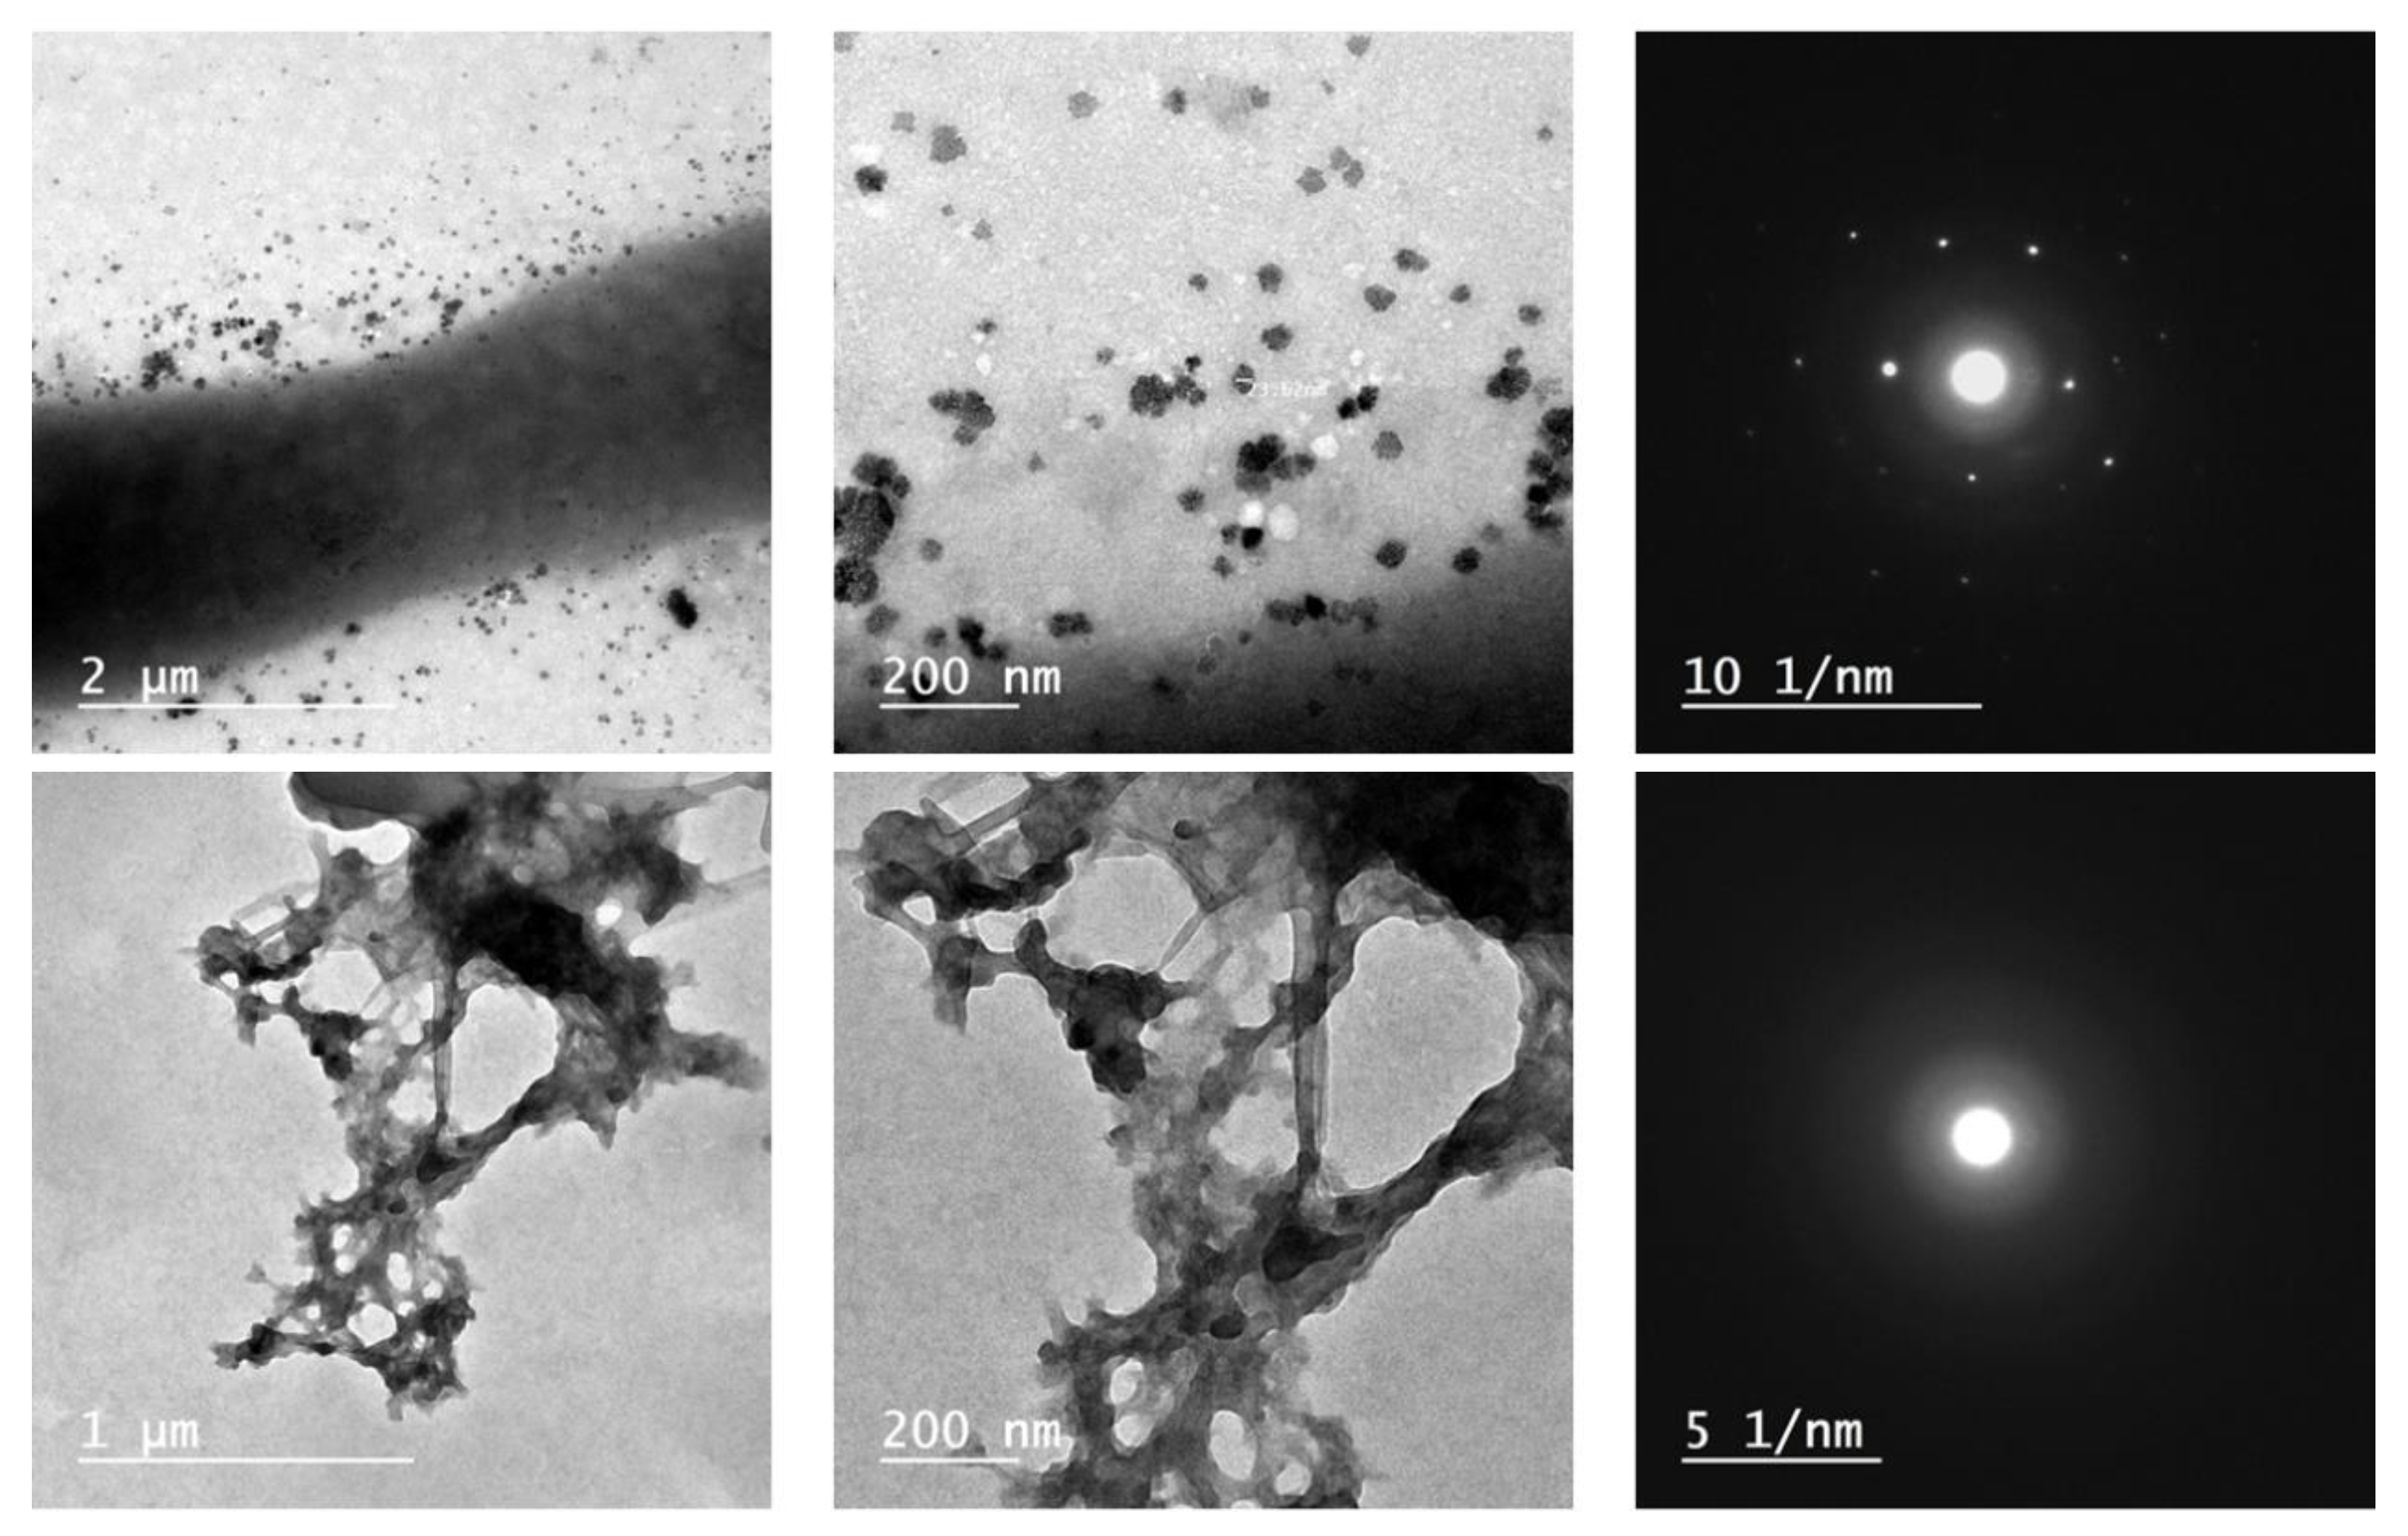
3.1.2. Topography
3.2. Postharvest Fruit Characteristics
3.2.1. Fruit Decay
3.2.2. Fruit Physical Characteristics
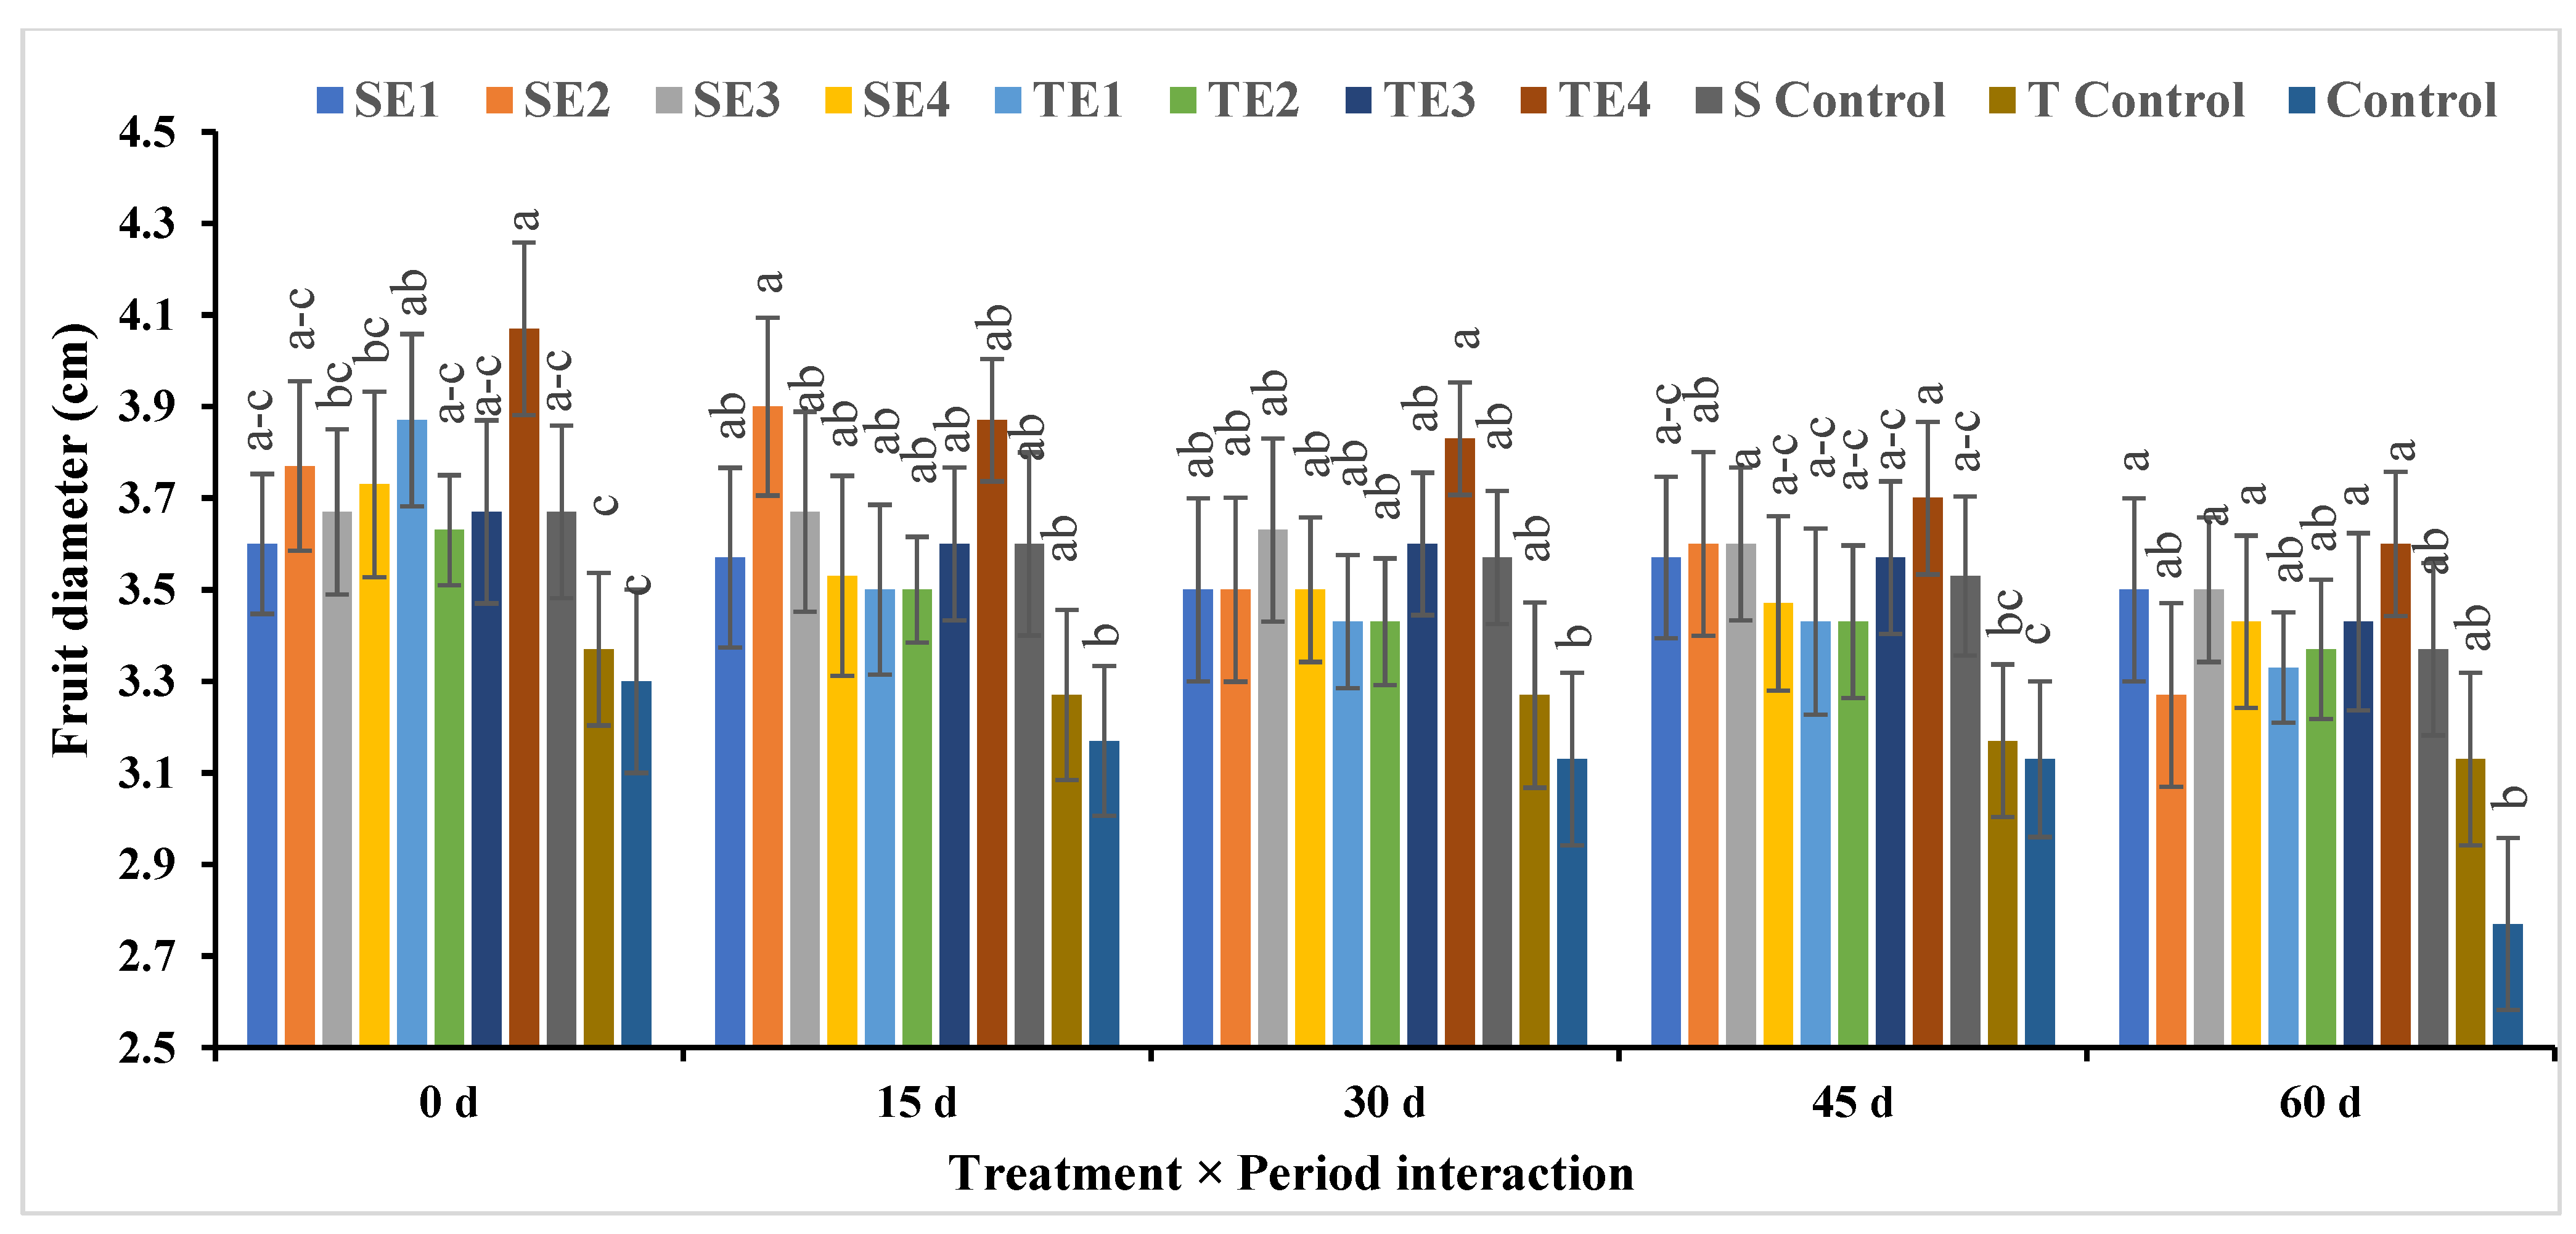
Fruit Length and Fruit Diameter
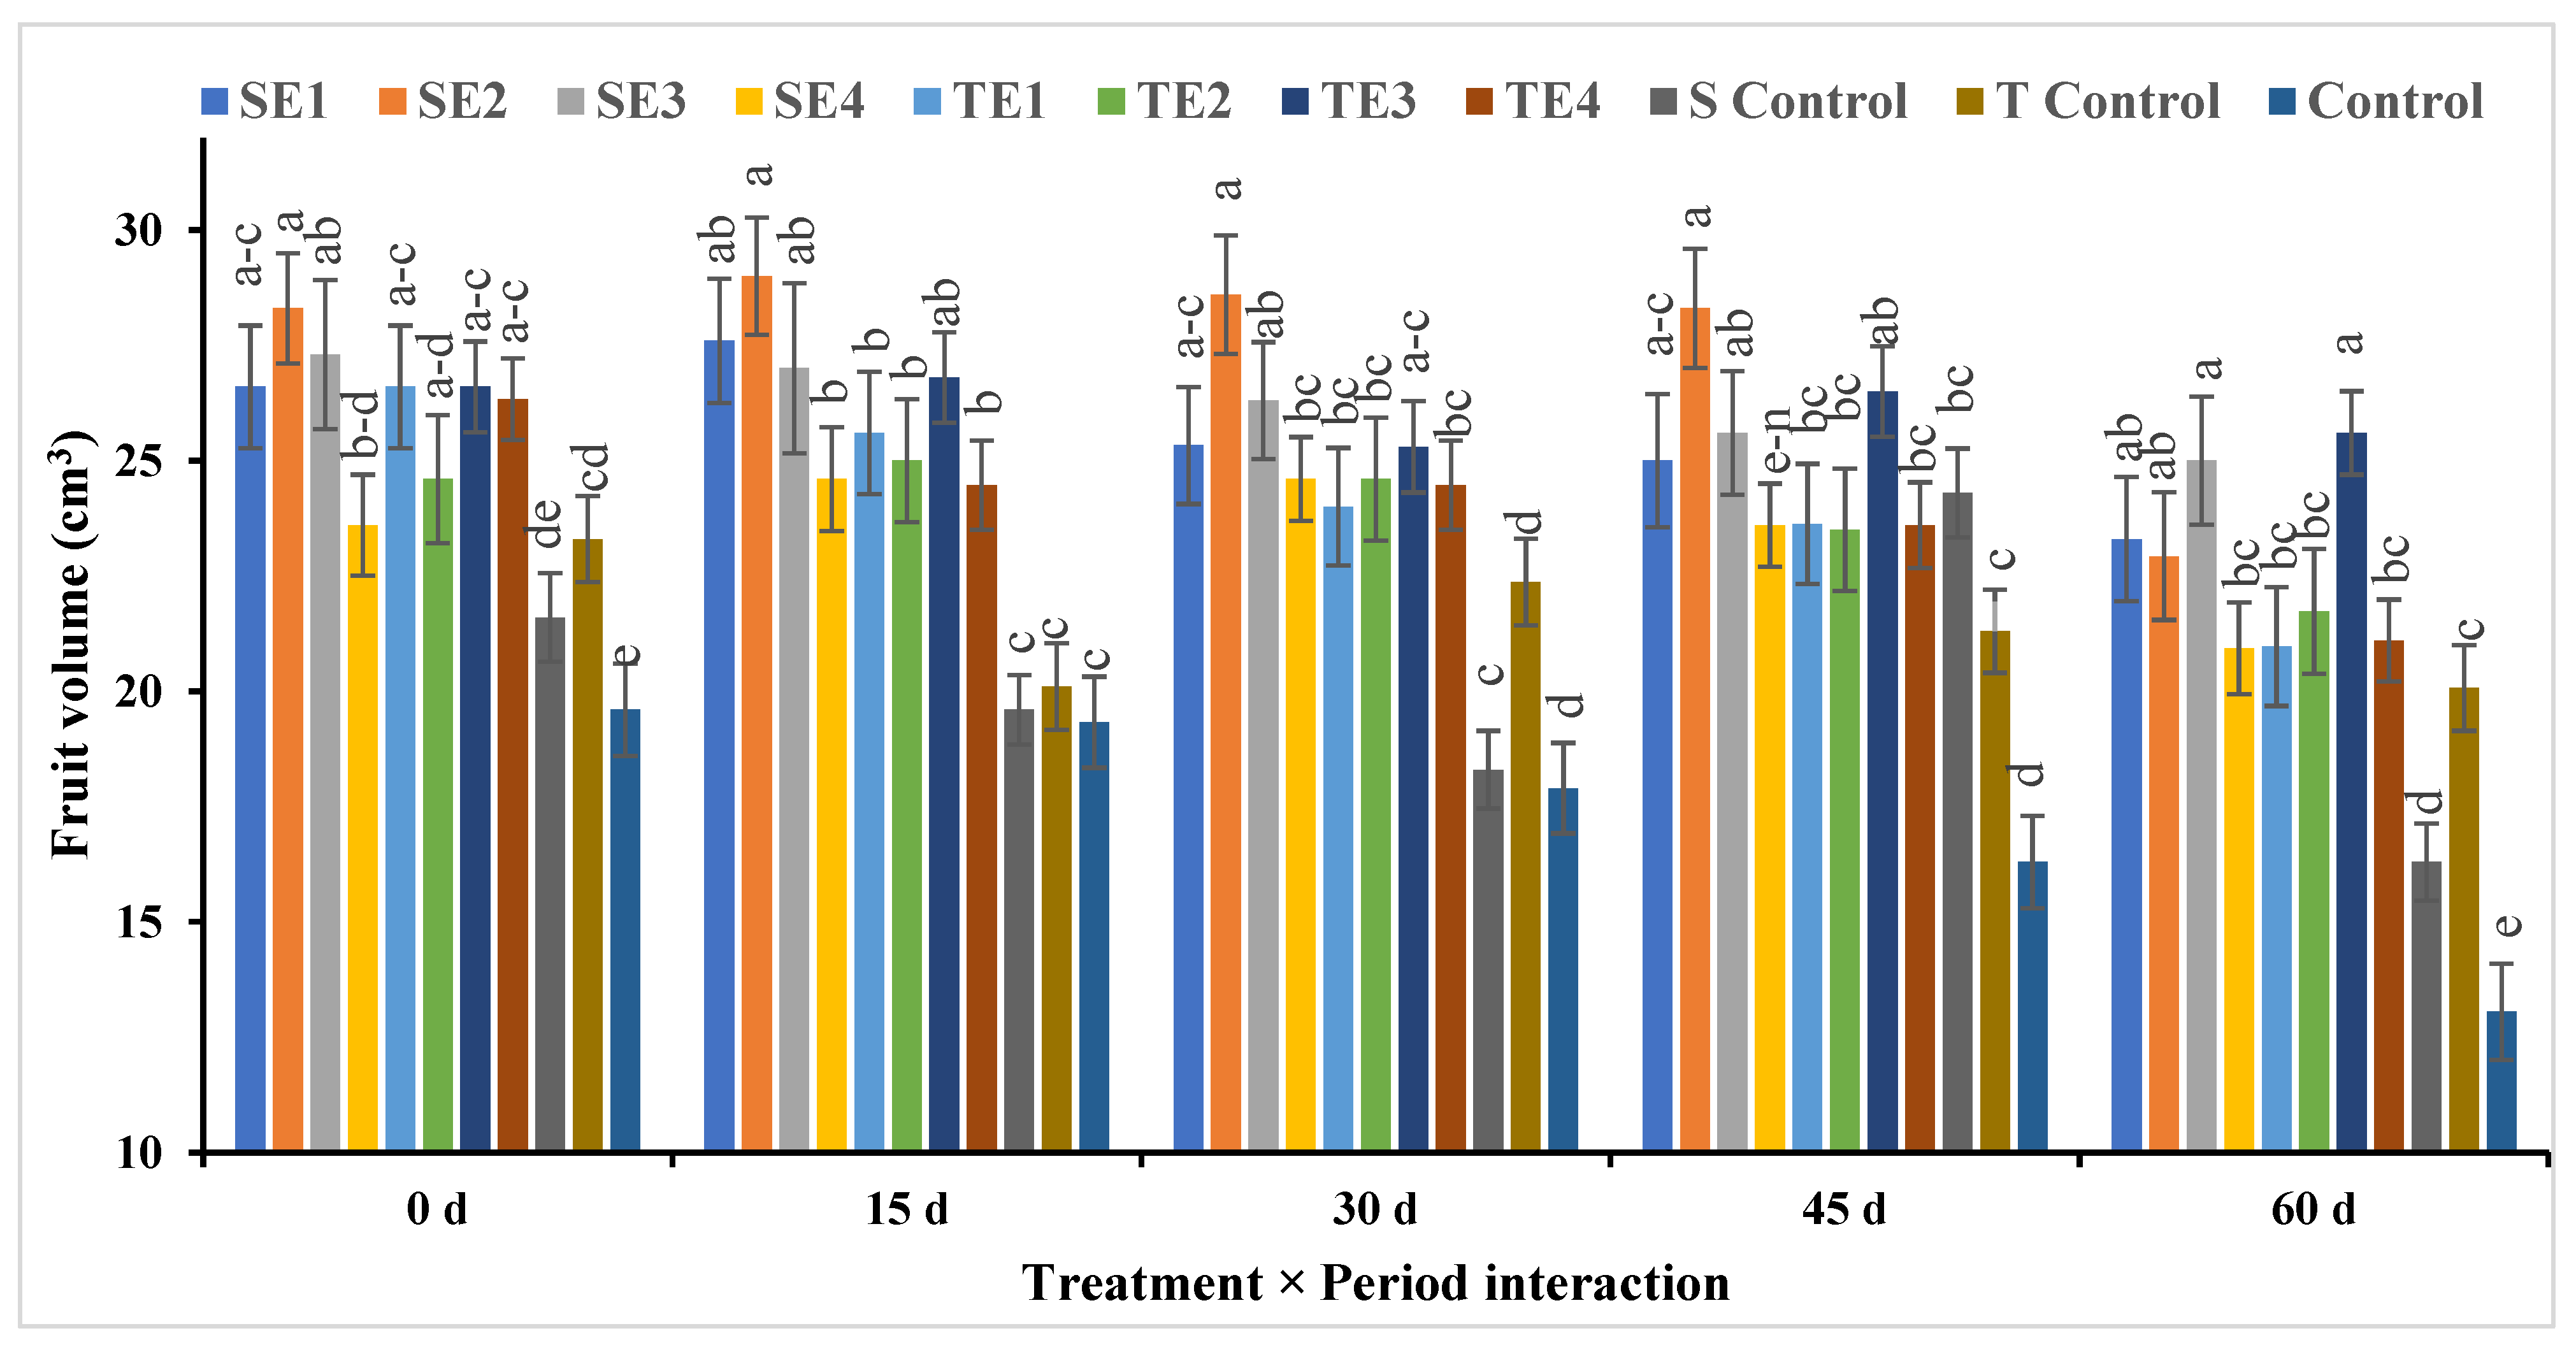
Fruit Volume and Fruit Weight
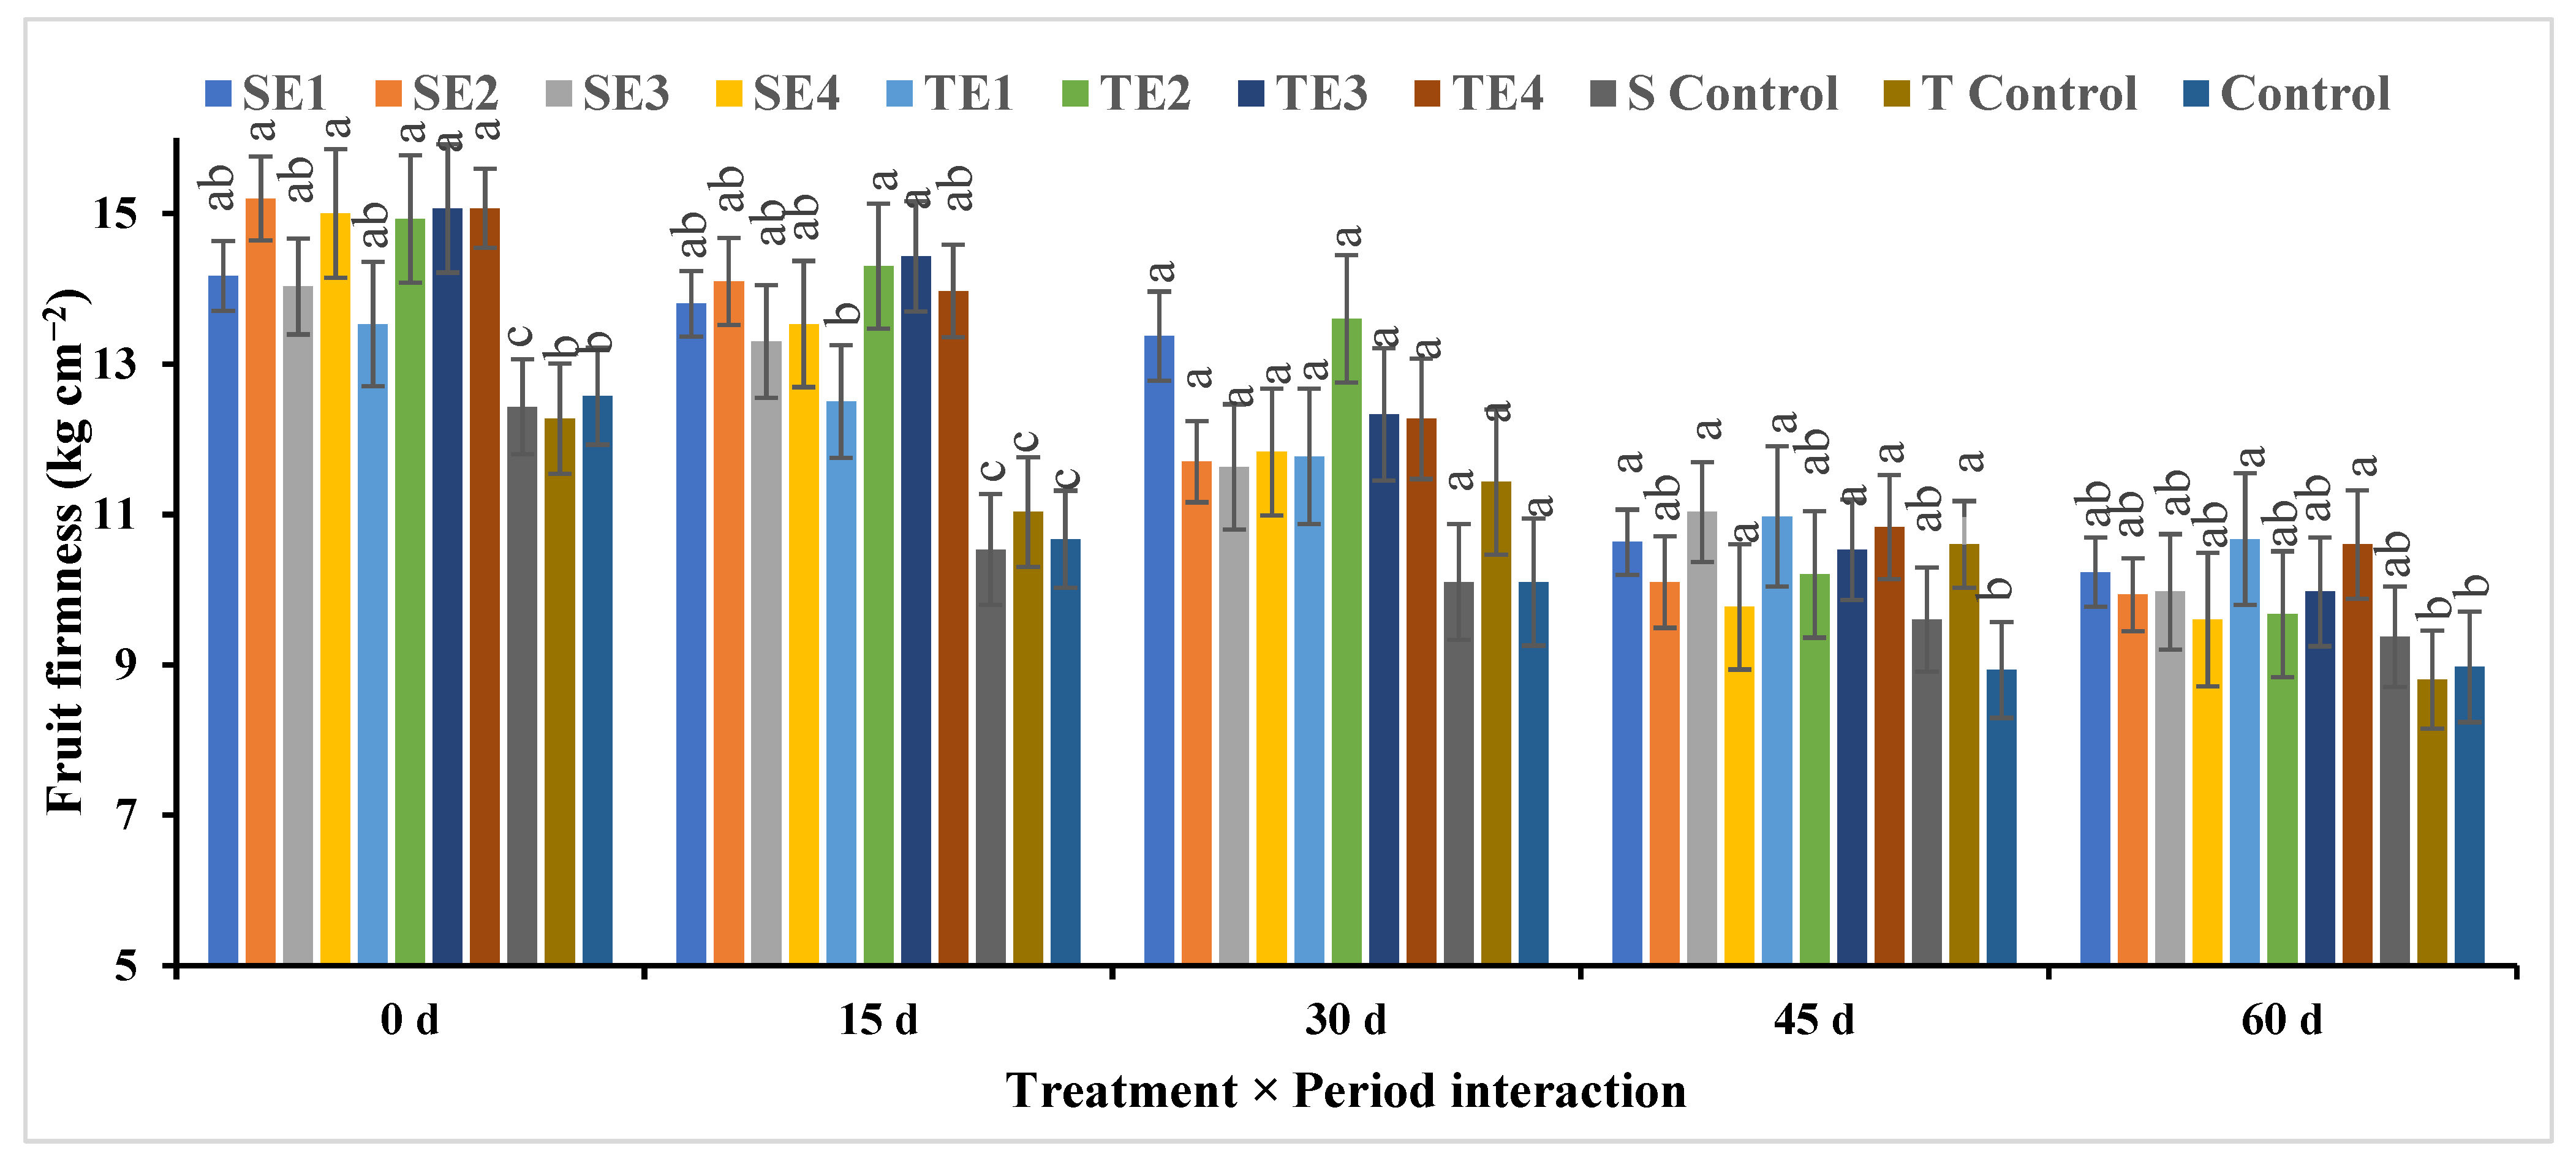
Fruit Firmness
Fruit Juice Volume
3.2.3. Fruit Chemical characteristics
Total Soluble Solids and Titratable Acidity
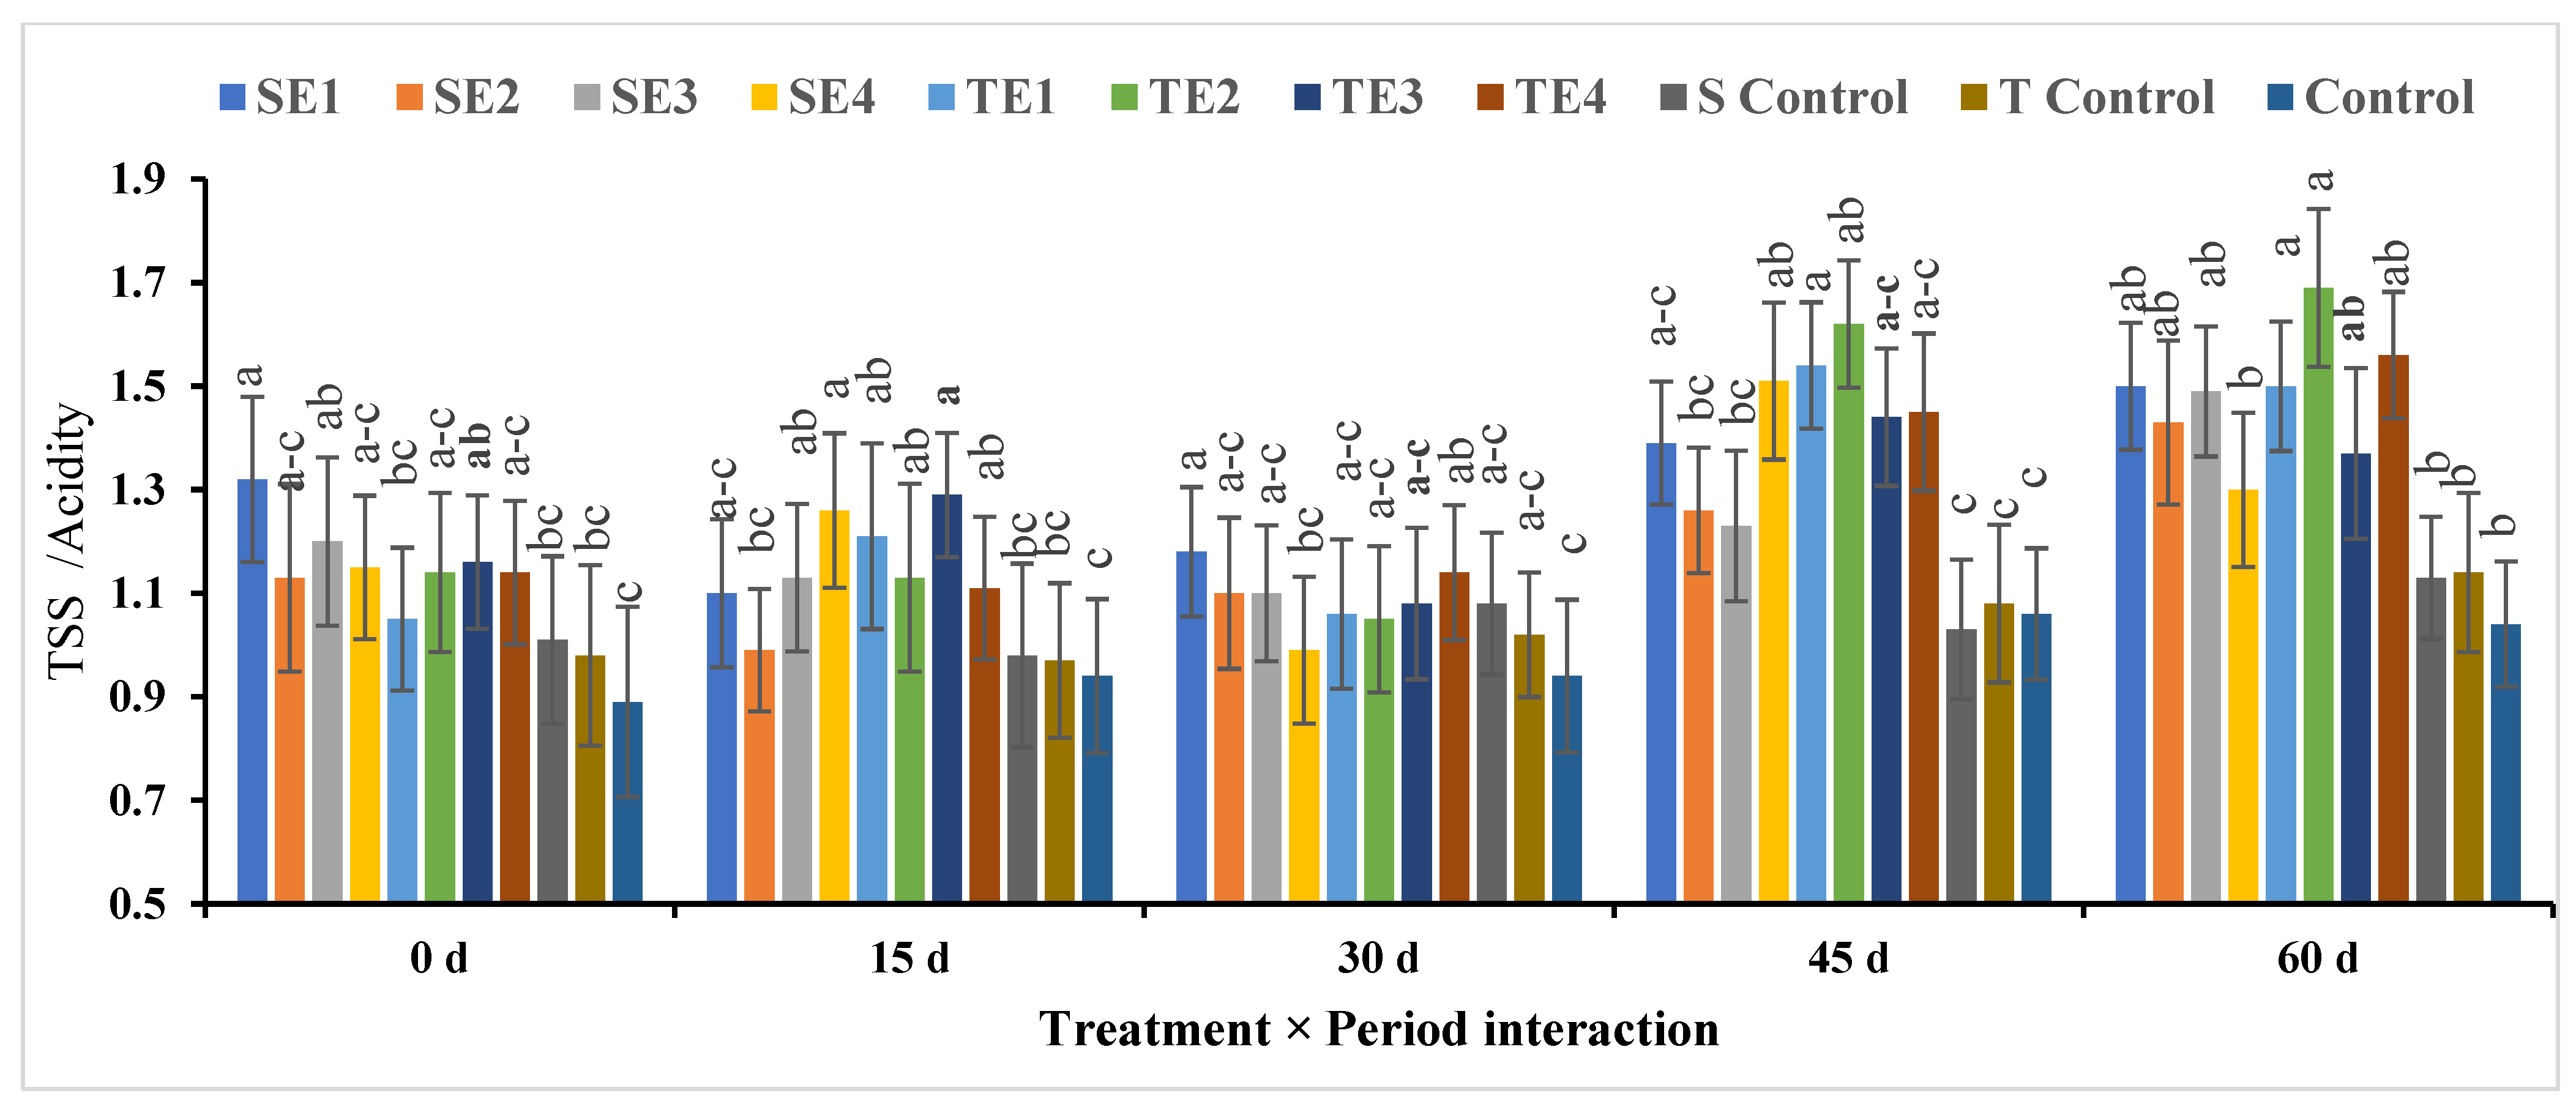
TSS/Acidity
Vitamin C Content
3.3. Fruit Weight Loss
4. Discussion
4.1. Nanocoating Characterizations
4.1.1. Physicochemical Analysis
4.1.2. Topographical Analysis
4.2. Fruit Physical Characteristics
4.3. Fruit Chemical Characteristics
5. Conclusions
Author Contributions
Funding
Data Availability Statement
Acknowledgments
Conflicts of Interest
Abbreviations
| S or T | Spraying materials in the field |
| S | Potassium thiosulfate (1.75 cm3/L) three times (May, June, and July) |
| T | Potassium tartrate (2 g/L) three times (May, June, and July) |
| E | Postharvest dipping extracts |
| E1 | Nanocoating |
| E2 | CMC (carboxy methyl cellulose) |
| E3 | Gum arabic (GA) |
| E4 | CMC + GA |
| SE1 | Spraying with potassium thiosulfate preharvest and nanocoating dipping postharvest. |
| SE2 | Spraying with potassium thiosulfate preharvest and CMC (carboxy methyl cellulose) dipping postharvest. |
| SE3 | Spraying with potassium thiosulfate preharvest and gum arabic (GA) dipping postharvest. |
| SE4 | Spraying with potassium thiosulfate preharvest and CMC + GA dipping postharvest. |
| TE1 | Spraying with potassium tartrate preharvest and Nanocoating dipping postharvest. |
| TE2 | Spraying with potassium tartrate preharvest and CMC (carboxy methyl cellulose) dipping postharvest. |
| TE3 | Spraying with potassium tartrate preharvest and gum arabic (GA) dipping pos-harvest. |
| TE4 | Spraying with potassium tartrate preharvest and CMC + GA dipping postharvest. |
| S Control | Spraying with potassium thiosulfate preharvest and water dipping postharvest. |
| T Control | Spraying with potassium tartrate preharvest and water dipping postharvest. |
| Control | Spraying with distilled water preharvest and water dipping postharvest. |
References
- Schimmenti, E.; Borsellino, V.; Galati, A. Growth of citrus production among the Euro-Mediterranean countries: Political implications and empirical findings. Span. J. Agric. Res. 2013, 11, 561–577. [Google Scholar] [CrossRef]
- Hasanin, M.S.; Hashem, A.H.; Abu Hashish, H.M.; Abdelraof, M. A novel pressed coal from citrus and cooking oil wastes using fungi. Bioresour. Bioprocess. 2022, 9, 95. [Google Scholar] [CrossRef]
- Rivera-Cabrera, F.; Ponce-Valadez, M.; Sanchez, F.; Villegas-Monter, A.; Perez-Flores, L. Acid limes. A review. Fresh Prod. 2010, 4, 116–122. [Google Scholar]
- Zekri, M.; Obreza, T. Potassium (K) for Citrus Trees; Document SL381. UF/IFAS Extension; Institute of Food and Agricultural Sciences (IFAS), University of Florida: Gainesville, FL, USA, 2013. [Google Scholar] [CrossRef]
- Sekhon, B.S. Food nanotechnology—An overview. Nanotechnol. Sci. Appl. 2010, 3, 1–15. [Google Scholar] [PubMed]
- Tesser, R.; Vitiello, R.; Russo, V.; Turco, R.; Di Serio, M.; Lin, L.; Li, C. Oleochemistry products. In Industrial Oil Plant: Application Principles and Green Technologies; Springer: Singapore, 2020; pp. 201–268. [Google Scholar] [CrossRef]
- Elsayed, N.; Hasanin, M.S.; Abdelraof, M. Utilization of olive leaves extract coating incorporated with zinc/selenium oxide nanocomposite to improve the postharvest quality of green beans pods. Bioact. Carbohydr. Diet. Fibre 2022, 28, 100333. [Google Scholar] [CrossRef]
- Hasanin, M.S. Cellulose-Based Biomaterials: Chemistry and Biomedical Applications. Starch-Stärke 2022, 74, 2200060. [Google Scholar] [CrossRef]
- Kontogiorgos, V. Stabilisers. In Encyclopedia of Dairy Sciences, 3rd ed.; McSweeney, P.L.H., McNamara, J.P., Eds.; Academic Press: Oxford, UK, 2022; pp. 689–694. [Google Scholar] [CrossRef]
- Ban, Z.; Chen, F.; Liu, L.; Zhang, S.; Wang, L.; Wang, H.; Wang, L.; Zhu, Y. Gliadin nanoparticles stabilized by sodium carboxymethyl cellulose as carriers for improved dispersibility, stability and bacteriostatic activity of Natamycin. Food Biosci. 2023, 53, 102575. [Google Scholar] [CrossRef]
- Williams, P.A.; Phillips, G.O. Gum arabic. In Handbook of Hydrocolloids; Elsevier: Amsterdam, The Netherlands, 2021; pp. 627–652. [Google Scholar]
- Ali, B.H.; Ziada, A.; Blunden, G.J.F. Biological effects of gum arabic: A review of some recent research. Food Chem. Toxicol. 2009, 47, 1–8. [Google Scholar] [CrossRef]
- Abidi, S.; Trabelsi, A.B.H.; Boudhrioua, N. Pyrolysis of lemon peel waste in a fixed-bed reactor and characterization of innovative pyrolytic products. J. Mater. Cycles Waste Manag. 2023, 25, 235–248. [Google Scholar] [CrossRef]
- Khalil, R.K.; Sharaby, M.R.; Abdelrahim, D.S. Novel active edible food packaging films based entirely on citrus peel wastes. Food Hydrocoll. 2023, 134, 107961. [Google Scholar] [CrossRef]
- Barbhuiya, R.I.; Singha, P.; Asaithambi, N.; Singh, S.K. Ultrasound-assisted rapid biological synthesis and characterization of silver nanoparticles using pomelo peel waste. Food Chem. 2022, 385, 132602. [Google Scholar] [CrossRef] [PubMed]
- EL-Moslamy, H.; Shokry, H.; Rezk, H.; Abdel-Fattah, R. Bioprocess strategies and characterization of anti-multidrug resistant human pathogens copper/copper oxide nanoparticles from citrus peel waste extracts. J. Nanomater. Mol. Nanotechnol. 2017, 13, 21–23. [Google Scholar]
- Elizondo-Villarreal, N.; Verástegui-Domínguez, L.; Rodríguez-Batista, R.; Gándara-Martínez, E.; Alcorta-García, A.; Martínez-Delgado, D.; Rodríguez-Castellanos, E.A.; Vázquez-Rodríguez, F.; Gómez-Rodríguez, C. Green Synthesis of Magnetic Nanoparticles of Iron Oxide Using Aqueous Extracts of Lemon Peel Waste and Its Application in Anti-Corrosive Coatings. Materials 2022, 15, 8328. [Google Scholar] [CrossRef] [PubMed]
- Smaoui, S.; Chérif, I.; Hlima, H.B.; Khan, M.U.; Rebezov, M.; Thiruvengadam, M.; Sarkar, T.; Shariati, M.A.; Lorenzo, J.M. Zinc oxide nanoparticles in meat packaging: A systematic review of recent literature. Food Packag. Shelf Life 2023, 36, 101045. [Google Scholar] [CrossRef]
- Hasanin, M.S.; Youssef, A.M. Ecofriendly bioactive film doped CuO nanoparticles based biopolymers and reinforced by enzymatically modified nanocellulose fibers for active packaging applications. Food Packag. Shelf Life 2022, 34, 100979. [Google Scholar] [CrossRef]
- Bortolon, L.; Gianello, C.; Welter, S.; Almeida, R.; Giasson, E. Simultaneous extraction of phosphorus, potassium, calcium and magnesium from soils and potassium recommendations for crops in Southern Brazil. Pedosphere 2011, 21, 365–372. [Google Scholar] [CrossRef]
- Liu, J.; Kang, Y.; Yin, S.; Song, B.; Wei, L.; Chen, L.; Shao, L. Zinc oxide nanoparticles induce toxic responses in human neuroblastoma SHSY5Y cells in a size-dependent manner. Int. J. Nanomed. 2017, 12, 8085–8099. [Google Scholar] [CrossRef]
- Cunniff, P.; Washington, D. Official methods of analysis of AOAC international. J. AOAC Int. 1997, 80, 127A. [Google Scholar]
- Snedecor, G.; Cochran, W. Statistical Methods, 6th ed.; Oxford and IBH Publishing Co.: Calcutta, India, 1994. [Google Scholar]
- Hasanin, M.; Taha, N.F.; Abdou, A.R.; Emara, L.H. Green decoration of graphene oxide Nano sheets with gelatin and gum Arabic for targeted delivery of doxorubicin. Biotechnol. Rep. 2022, 34, e00722. [Google Scholar] [CrossRef]
- Abdelhameed, R.M.; Hasanin, M.S.; Hashem, A.H. Carboxymethyl cellulose/sulfur-functionalized Ti-based MOF composite: Synthesis, characterization, antimicrobial, antiviral and anticancer potentiality. Discov. Nano 2023, 18, 75. [Google Scholar] [CrossRef]
- Hasanin, M.; Swielam, E.M.; Atwa, N.A.; Agwa, M.M. Novel design of bandages using cotton pads, doped with chitosan, glycogen and ZnO nanoparticles, having enhanced antimicrobial and wounds healing effects. Int. J. Biol. Macromol. 2022, 197, 121–130. [Google Scholar] [CrossRef]
- Wu, S.; Zhang, C.; Li, M.; Tan, Q.; Sun, X.; Pan, Z.; Deng, X.; Hu, C. Effects of potassium on fruit soluble sugar and citrate accumulations in Cara Cara navel orange (Citrus sinensis L. Osbeck). Sci. Hortic. 2021, 283, 110057. [Google Scholar] [CrossRef]
- Vijay, V.; Dalal, R.; Beniwal, B.; Saini, H. Effect of foliar application of potassium and its spray schedule on yield and yield parameters of sweet orange (Citrus sinensis Osbeck) cv. Jaffa. J. Appl. Nat. Sci. 2017, 9, 786–790. [Google Scholar] [CrossRef]
- Sajid, M.; Haq, S.U.; Jan, A.; Noor, F.; Ali, Q.S.; Alam, M.; Zaman, A.; Shah, F.A.; Mosa, W.F.; Abada, H.S. Effect of foliar application with potassium nitrate and copper sulfate on fruit yield and quality of pear (Pyrus communis L.) trees. Int. J. Fruit Sci. 2022, 22, 759–768. [Google Scholar] [CrossRef]
- Hamza, A.; Bamouh, A.; El Guilli, M.; Bouabid, R. Response of Clementine citrus var. Cadoux Foliar Potassium Fertilization; Effects on Fruit Production and Quality; International Potash Institute (IPI): Basel, Switzerland, 2012; pp. 8–15. [Google Scholar]
- Yadav, D.; Singh, S.; Singh, S. Effect of foliar application of potassium compounds on yield and quality of ber (Zizyphus mauritiana Lam.) cv. Banarasi Karaka. Int. J. Res. Appl. Nat. Soc. Sci. 2014, 2, 89–92. [Google Scholar]
- Alva, A.K.; Mattos, D., Jr.; Paramasivam, S.; Patil, B.; Dou, H.; Sajwan, K.S. Potassium management for optimizing citrus production and quality. Int. J. Fruit Sci. 2006, 6, 3–43. [Google Scholar] [CrossRef]
- Amjad, M.; Akhtar, J.; Haq, M.A.U.; Imran, S.; Jacobsen, S.-E. Soil and foliar application of potassium enhances fruit yield and quality of tomato under salinity. Turk. J. Biol. 2014, 38, 208–218. [Google Scholar] [CrossRef]
- Mokhtarzadeh, Z.; Shahsavar, A.R. Effects of gibberellic acid, potassium nitrate and calcium sulfate on pomegranate fruit splitting and fruit characteristics. Agric. Conspec. Sci. 2020, 85, 237–245. [Google Scholar]
- Xiao, J.; Peng, S.; Hua, H.; Jiang, L. Effects of calcium nitrate and IAA on calcium concentration and quality of Satsuma mandarin fruit. Guoshu Xuebao 2005, 22, 211–215. [Google Scholar]
- Marschner, H. Marschner’s Mineral Nutrition of Higher Plants; Academic Press: Cambridge, MA, USA, 2011. [Google Scholar]
- Bhat, M.; Ahsan, H.; Banday, F.; Dar, M.; Wani, A.I.; Hassan, G. Effect of harvest dates, pre harvest calcium sprays and storage period on physico-chemical characteristics of pear cv. Bartlett. J. Agric. Res. Dev. 2012, 2, 101–106. [Google Scholar]
- Kumar, J.; Kumar, R.; Rai, R.; Mishra, D. Response of ‘Pant Prabhat’ guava trees to foliar sprays of zinc, boron, calcium and potassium at different plant growth stages. Bioscan 2015, 10, 495–498. [Google Scholar]
- Bhavya, H. Effect of Foliar Silicic Acid and Boron in Bangalore Blue Grapes; University of Agricultural Sciences, GKVK: Karnataka, India, 2010. [Google Scholar]
- Vijay, V.; Dalal, R.; Beniwal, B.; Saini, H. Impact of foliar application of potassium and its spray schedule on yield and quality of sweet orange (Citrus sinensis) cv. Jaffa. J. Appl. Nat. Sci. 2016, 8, 1893–1898. [Google Scholar] [CrossRef]
- Prasad, B.; Dimri, D.; Bora, L. Effect of pre-harvest foliar spray of calcium and potassium on fruit quality of Pear cv. Pathernakh. Sci. Res. Essays 2015, 10, 376–380. [Google Scholar]
- Amina, T.H.; Afzal, M.; Ashraf, T.; Nawaz, S. Optimization and determination of doses of phosphorus and potassium for Citrus reticulata (Blanco) under the agro-climatic conditions of Sargodha, Pakistan: Effect on yield and fruit quality of citrus. Acta Sci. Agri. 2018, 2, 48–55. [Google Scholar]
- Zhang, W.; Zhang, X.; Wang, Y.; Zhang, N.; Guo, Y.; Ren, X.; Zhao, Z. Potassium fertilization arrests malate accumulation and alters soluble sugar metabolism in apple fruit. Biol. Open 2018, 7, bio024745. [Google Scholar] [CrossRef]
- Shen, C.; Shi, X.; Xie, C.; Li, Y.; Yang, H.; Mei, X.; Xu, Y.; Dong, C. The change in microstructure of petioles and peduncles and transporter gene expression by potassium influences the distribution of nutrients and sugars in pear leaves and fruit. J. Plant Physiol. 2019, 232, 320–333. [Google Scholar] [CrossRef]
- Van Dang, L.; Phuong Ngoc, N.; Hung, N.N. Effects of Foliar Fertilization on Nutrient Uptake, Yield, and Fruit Quality of Pomelo (Citrus grandis Osbeck) Grown in the Mekong Delta Soils. Int. J. Agron. 2022, 2022, 7903796. [Google Scholar] [CrossRef]


| Chemical Characteristics | Physical Characteristics | |||||||||||||
|---|---|---|---|---|---|---|---|---|---|---|---|---|---|---|
| pH | Ece (ds/m) | Ca2+ | Mg2+ | Na+ | K+ | Co3− | HCO3− | Cl− | SO4− | Fe | Zn | Mn | Clay, % | 65.20 |
| In soil paste | Soluble cations, SC (meq/L) | Soluble anions, SA (meq/L) | DTPA extractable (mg/kg soil) | Silt, % | 13.50 | |||||||||
| Sand, % | 21.40 | |||||||||||||
| 7.46 | 3.08 | 10.84 | 1.25 | 6.03 | 1.23 | 1.70 | 1.20 | 6.46 | 9.08 | 76.0 | 21.0 | 27.2 | Texture | clay |
| Period (P; Days) | ||||||
|---|---|---|---|---|---|---|
| Treatment | 0 | 15 | 30 | 45 | 60 | Mean (Treat.) |
| SE1 | 0.00 | 0.00 | 5.15ef ± 0.91 | 10.91f ± 1.21 | 30.44c ± 1.11 | 9.30G ± 3.84 |
| SE2 | 0.00 | 0.00 | 3.74fg ± 0.53 | 10.48f ± 1.71 | 20.89e ± 1.86 | 7.02HI ± 2.55 |
| SE3 | 0.00 | 0.00 | 1.65g ± 0.31 | 10.27f ± 0.45 | 21.64e ± 1.39 | 6.71I ± 2.93 |
| SE4 | 0.00 | 0.00 | 6.21def ± 0.60 | 15.10de ± 0.97 | 18.77e ± 1.60 | 8.01H ± 4.55 |
| TE1 | 0.00 | 0.00 | 6.42def ± 0.41 | 14.37e ± 0.63 | 26.60d ± 1.60 | 9.48G ± 3.89 |
| TE2 | 0.00 | 0.00 | 8.72d ± 0.65 | 26.21c ± 1.26 | 30.65c ± 1.87 | 13.12E ± 3.25 |
| TE3 | 0.00 | 0.00 | 8.63d ± 1.04 | 30.41b ± 1.15 | 34.61b ± 1.65 | 14.73D ± 4.04 |
| TE4 | 0.00 | 0.00 | 7.16de ± 0.75 | 17.48d ± 1.02 | 30.12c ± 1.45 | 10.95F ± 3.67 |
| S Control | 0.00 | 0.00 | 19.40b ± 1.10 | 36.26a ± 1.76 | 45.61a ± 1.55 | 20.25B ± 3.85 |
| T Control | 0.00 | 0.00 | 13.76c ± 1.35 | 27.42c ± 1.20 | 44.28a ± 1.77 | 17.09C ± 4.52 |
| Control | 0.00 | 0.00 | 23.44a ± 1.00 | 37.49a ± 1.76 | 45.60a ± 1.19 | 21.31A ± 3.27 |
| Mean (P) ** | 0.00 | 0.00 | 9.48C ± 1.61 | 21.49B ± 1.90 | 31.75A ± 2.58 | |
| Significance | P0 = ND | P15 = ND | P30 = ** | P45 = ** | P60 = ** | Treat. = ** |
| Period (P; Days) | ||||||
|---|---|---|---|---|---|---|
| Treatment | 0 | 15 | 30 | 45 | 60 | Mean (Treat.) |
| SE1 | 4.07a ± 0.25 | 3.90a ± 0.23 | 3.60a ± 0.26 | 3.73a ± 0.30 | 3.53a ± 0.29 | 3.77AB ± 0.24 |
| SE2 | 4.10a ± 0.11 | 3.83a ± 0.12 | 4.10a ± 0.21 | 3.53a ± 0.22 | 3.47a ± 0.24 | 3.81A ± 0.36 |
| SE3 | 4.03a ± 0.15 | 4.13a ± 015 | 3.87a ± 0.22 | 3.70a ± 0.22 | 3.73a ± 0.22 | 3.87A ± 0.38 |
| SE4 | 3.83a–c ± 0.12 | 3.83a ± 0.12 | 3.70a ± 0.28 | 3.67a ± 0.32 | 3.23a ± 0.30 | 3.65BC ± 0.34 |
| TE1 | 4.07a ± 0.15 | 3.80a ± 0.20 | 3.60a ± 0.26 | 3.47a ± 0.27 | 3.17a ± 0.31 | 3.62BC ± 0.29 |
| TE2 | 3.83a–c ± 0.14 | 3.67a ± 0.15 | 3.63a ± 0.32 | 3.60a ± 0.22 | 3.58a ± 0.26 | 3.66BC ± 0.32 |
| TE3 | 3.90ab ± 0.10 | 3.73a ± 0.15 | 3.60a ± 0.17 | 3.53a ± 0.18 | 3.20a ± 0.20 | 3.59CD ± 0.27 |
| TE4 | 3.95ab ± 0.15 | 3.70a ± 0.10 | 3.67a ± 0.20 | 3.50a ± 0.24 | 3.47a ± 0.22 | 3.66BC ± 0.26 |
| S Control | 3.50c ± 0.24 | 3.47a ± 0.21 | 3.43a ± 0.15 | 3.50a ± 0.12 | 3.43a ± 0.23 | 3.47DE ± 0.37 |
| T Control | 3.63bc ± 0.21 | 3.57a ± 0.16 | 3.47a ± 0.15 | 3.43a ± 0.12 | 3.33a ± 0.21 | 3.49DE ± 0.35 |
| Control | 3.53c ± 0.12 | 3.47a ± 0.15 | 3.43a ± 0.21 | 3.40a ± 0.20 | 3.13a ± 0.25 | 3.39F ± 0.20 |
| Mean (P) ** | 3.86A ± 0.24 | 3.74B ± 0.23 | 3.65B ± 0.25 | 3.54C ± 0.21 | 3.39D ± 0.28 | |
| Significance | P0 = * | P15 = NS | P30 = NS | P45 = NS | P60 = NS | Treat. = ** |
| Period (P; Days) | ||||||
|---|---|---|---|---|---|---|
| Treatment | 0 | 15 | 30 | 45 | 60 | Mean (Treat.) |
| SE1 | 27.87b ± 0.42 | 25.94cd ± 0.70 | 25.62b ± 0.61 | 25.53b ± 0.71 | 24.22a ± 0.90 | 25.84C ± 1.55 |
| SE2 | 28.72a ± 0.85 | 28.80a ± 0.60 | 27.77a ± 0.52 | 27.43a ± 0.48 | 22.23b ± 0.77 | 26.99A ± 3.20 |
| SE3 | 27.71ab ± 0.50 | 27.09b ± 0.72 | 27.35a ± 0.59 | 25.34b ± 0.45 | 24.63a ± 1.00 | 26.41B ± 1.53 |
| SE4 | 24.80fg ± 0.56 | 24.62f ± 0.61 | 24.42cd ± 0.70 | 22.99c ± 0.93 | 19.35c ± 1.10 | 23.23E ± 2.27 |
| TE1 | 27.67cd ± 0.47 | 25.70c–e ± 0.70 | 23.83d ± 0.76 | 21.41d ± 1.02 | 17.47d ± 0.70 | 23.05E ± 3.67 |
| TE2 | 27.00c ± 0.77 | 26.43bc ± 0.78 | 26.05b ± 0.76 | 25.50b ± 0.90 | 25.48a ± 0.46 | 26.09BC ± 2.53 |
| TE3 | 25.93de ± 0.55 | 25.36d–f ± 0.70 | 25.07bc ± 0.73 | 23.17c ± 1.00 | 21.80b ± 0.70 | 24.27D ± 3.19 |
| TE4 | 25.49ef ± 0.40 | 25.18ef ± 0.54 | 23.68d ± 0.56 | 21.22d ± 1.07 | 20.48c ± 0.75 | 23.19E ± 2.37 |
| S Control | 23.65g ± 0.60 | 23.27g ± 0.56 | 20.82e ± 0.87 | 20.66d ± 0.46 | 19.31c ± 0.95 | 21.53F ± 2.08 |
| T Control | 21.72h ± 0.45 | 21.40h ± 0.66 | 19.04f ± 0.71 | 18.91e ± 1.10 | 17.03d ± 0.94 | 19.62G ± 3.16 |
| Control | 18.42i ± 0.52 | 18.32i ± 0.40 | 17.20g ± 0.48 | 16.77f ± 0.72 | 13.37e ± 0.87 | 16.81H ± 3.54 |
| Mean (P) ** | 25.26A ± 2.91 | 24.73B ± 2.19 | 23.70C ± 3.46 | 22.63D ± 3.11 | 20.49E ± 3.30 | |
| Significance | P0 = ** | P15 = ** | P30 = ** | P45 = ** | P60 = ** | Treat. = ** |
| Period (P; Days) | ||||||
|---|---|---|---|---|---|---|
| Treatments | 0 | 15 | 30 | 45 | 60 | Mean (Treat.) |
| SE1 | 12.17bc ± 0.40 | 13.00ab ± 0.43 | 11.00c ± 0.60 | 11.33de ± 0.27 | 10.33ab ± 0.52 | 11.57C ± 0.30 |
| SE2 | 14.33a ± 0.46 | 13.67a ± 0.42 | 13.36a ± 0.34 | 13.00b ± 0.26 | 9.39bc ± 0.30 | 12.86A ± 0.43 |
| SE3 | 13.93a ± 0.36 | 13.97a ± 0.26 | 13.37a ± 0.36 | 14.11a ± 0.18 | 9.33b–d ± 0.40 | 12.94A ± 0.50 |
| SE4 | 11.00d ± 0.40 | 11.60c ± 0.33 | 11.69bc ± 0.36 | 12.00cd ± 0.27 | 7.67ef ± 0.52 | 10.79D ± 0.45 |
| TE1 | 12.67b ± 0.40 | 13.00ab ± 0.42 | 12.33ab ± 0.34 | 11.00ef ± 0.30 | 8.53c–e ± 0.73 | 11.52C ± 0.48 |
| TE2 | 11.67cd ± 0.46 | 8.78d ± 0.44 | 8.67d ± 0.60 | 10.31f ± 0.16 | 8.31de ± 0.50 | 9.554E ± 0.38 |
| TE3 | 13.03b ± 0.46 | 11.33c ± 0.46 | 12.33a–c ± 0.33 | 12.67bc ± 0.27 | 11.67a ± 0.25 | 12.21B ± 0.32 |
| TE4 | 11.70cd ± 0.40 | 12.00bc ± 0.48 | 11.33bc ± 0.56 | 10.69ef ± 0.34 | 9.31b–d ± 0.50 | 11.01D ± 0.30 |
| S Control | 11.11d ± 0.30 | 11.11c ± 0.37 | 9.67d ± 0.69 | 8.98g ± 0.30 | 6.53f ± 0.35 | 9.48E ± 0.47 |
| T Control | 11.00d ± 0.33 | 11.17c ± 0.28 | 9.00d ± 0.40 | 7.80h ± 0.32 | 7.33ef ± 0.29 | 9.26E ± 0.43 |
| Control | 9.67e ± 0.41 | 7.67d ± 0.24 | 6.00e ± 0.60 | 5.67i ± 0.27 | 4.98g ± 0.50 | 6.80F ± 0.48 |
| Mean (P) ** | 12.03A ± 0.65 | 11.57B ± 0.44 | 10.79C ± 0.70 | 10.69C ± 0.43 | 8.54D ± 0.63 | |
| Significance | P0 = ** | P15 = ** | P30 = ** | P45 = ** | P60 = ** | Treat. = ** |
| Period (P; Days) | ||||||
|---|---|---|---|---|---|---|
| Treatment | 0 | 15 | 30 | 45 | 60 | Mean (Treat.) |
| SE1 | 7.87a ± 0.23 | 7.63a ± 0.33 | 8.17a ± 0.33 | 7.67ab ± 0.18 | 8.27a ± 0.42 | 7.92AD ± 0.39 |
| SE2 | 7.70a ± 0.40 | 7.83a ± 0.38 | 7.80bc ± 0.34 | 7.77ab ± 0.41 | 7.87a ± 0.42 | 7.79BC ± 0.34 |
| SE3 | 7.77a ± 0.37 | 7.80a ± 0.40 | 7.63c ± 0.38 | 7.23b ± 0.28 | 8.00a ± 0.38 | 7.69DE ± 0.34 |
| SE4 | 7.67a ± 0.33 | 8.17a ± 0.31 | 7.57c ± 0.43 | 7.57ab ± 0.32 | 7.80a ± 0.45 | 7.75CE ± 0.35 |
| TE1 | 7.53a ± 0.32 | 7.97a ± 0.33 | 7.60c ± 0.22 | 8.20ab ± 0.48 | 8.00a ± 0.50 | 7.86BE ± 0.38 |
| TE2 | 7.93a ± 0.35 | 8.00a ± 0.43 | 8.07a ± 0.35 | 8.20ab ± 0.38 | 8.07a ± 0.46 | 7.99AB ± 0.38 |
| TE3 | 7.73a ± 0.38 | 7.50a ± 0.32 | 7.57c ± 0.33 | 8.50a ± 0.26 | 8.63a ± 0.43 | 7.99AB ± 0.28 |
| TE4 | 7.97a ± 0.22 | 8.20a ± 0.22 | 7.93bc ± 0.28 | 8.43a ± 0.32 | 8.33a ± 0.40 | 8.17A ± 0.32 |
| S Control | 8.07a ± 0.32 | 8.07a ± 0.54 | 7.77bc ± 0.12 | 7.50ab ± 0.29 | 7.30a ± 0.40 | 7.74CE ± 0.38 |
| T Control | 7.73a ± 0.41 | 7.80a ± 0.21 | 7.20d ± 0.18 | 7.53ab ± 0.17 | 7.73a ± 0.47 | 7.60E ± 0.31 |
| Control | 7.10a ± 0.35 | 6.87b ± 0.33 | 6.67e ± 0.18 | 7.23b ± 0.28 | 6.83a ± 0.38 | 6.94F ± 0.33 |
| Mean (P) * | 7.63B ± 0.46 | 7.80AB ± 0.30 | 7.63B ± 0.42 | 7.80AB ± 0.35 | 7.89A ± 0.39 | |
| Significance | P0 = NS | P15 = * | P30 = ** | P45 = * | P60 = NS | Treat. = ** |
| Period (P; Days) | ||||||
|---|---|---|---|---|---|---|
| Treatment | 0 | 15 | 30 | 45 | 60 | Mean (Treat.) |
| SE1 | 5.97c ± 0.11 | 6.93a–d ± 0.18 | 6.93a ± 0.15 | 5.55cd ± 0.22 | 5.61a ± 0.20 | 6.23B ± 0.29 |
| SE2 | 6.83a–c ± 0.15 | 7.89a–c ± 0.21 | 7.10a ± 0.30 | 6.19a–c ± 0.15 | 5.50a ± 0.25 | 6.70B ± 0.22 |
| SE3 | 6.53bc ± 0.18 | 6.93a–d ± 0.26 | 6.93a ± 0.23 | 5.97bc ± 0.26 | 5.50a ± 0.21 | 6.37B ± 0.27 |
| SE4 | 6.74a–c ± 0.22 | 6.53cd ± 0.21 | 7.68a ± 0.26 | 5.12cd ± 0.29 | 6.02a ± 0.32 | 6.42B ± 0.24 |
| TE1 | 7.23a–c ± 0.52 | 6.63b–d ± 0.26 | 7.17a ± 0.30 | 4.80d ± 0.21 | 5.44a ± 0.29 | 6.25B ± 0.29 |
| TE2 | 6.98a–c ± 0.15 | 7.17a–d ± 0.29 | 7.68a ± 0.26 | 5.18cd ± 0.29 | 4.48a ± 0.27 | 6.30B ± 0.38 |
| TE3 | 6.72a–c ± 0.32 | 5.87d ± 0.26 | 7.04a ± 0.30 | 6.10bc ± 0.29 | 6.40a ± 0.21 | 6.43B ± 0.29 |
| TE4 | 7.04a–c ± 0.27 | 7.62a–c ± 0.24 | 7.17a ± 0.21 | 5.89b–d ± 0.30 | 5.44a ± 0.29 | 6.63B ± 0.20 |
| S Control | 7.96ab ± 0.22 | 8.30a ± 0.34 | 7.19a ± 0.27 | 7.25a ± 0.23 | 6.44a ± 0.26 | 7.43A ± 0.31 |
| T Control | 7.89ab ± 0.21 | 8.17ab ± 0.23 | 7.06a ± 0.20 | 7.02ab ± 0.26 | 6.85a ± 0.25 | 7.40A ± 0.28 |
| Control | 8.04a ± 0.24 | 8.23ab ± 0.27 | 7.13a ± 0.20 | 6.89ab ± 0.23 | 6.72a ± 0.25 | 7.40A ± 0.20 |
| Mean (P) ** | 7.08A ± 0.23 | 7.30A ± 0.28 | 7.19A ± 0.20 | 6.00B ± 0.26 | 5.86B ± 0.25 | |
| Significance | P0 = * | P15 = * | P30 = NS | P45 = * | P60 = NS | Treat. = ** |
| Period (P; Days) | ||||||
|---|---|---|---|---|---|---|
| Treatment | 0 | 15 | 30 | 45 | 60 | Mean (Treat.) |
| SE1 | 56.53ab ± 2.82 | 54.19c ± 1.61 | 65.33a ± 2.10 | 47.73cd ± 1.86 | 39.47b ± 1.93 | 52.65A ± 2.70 |
| SE2 | 62.93a ± 2.87 | 59.41bc ± 1.90 | 57.81bc ± 2.40 | 44.80de ± 1.85 | 49.60a ± 2.26 | 54.91A ± 2.39 |
| SE3 | 55.73ab ± 2.94 | 54.51c ± 1.95 | 53.33c ± 2.60 | 52.80ab ± 2.57 | 38.40b ± 2.26 | 50.95A ± 2.54 |
| SE4 | 56.85ab ± 2.76 | 64.00ab ± 2.40 | 46.93d ± 1.60 | 50.13bc ± 2.87 | 37.33b ± 2.10 | 51.05A ± 3.19 |
| TE1 | 49.65b ± 2.87 | 46.13d ± 1.91 | 46.24d ± 1.80 | 41.07e ± 1.46 | 38.93b ± 1.70 | 44.41B ± 2.28 |
| TE2 | 55.25ab ± 2.00 | 56.85c ± 1.90 | 57.33bc ± 2.03 | 44.80de ± 1.86 | 37.60b ± 1.41 | 50.37A ± 2.74 |
| TE3 | 62.67a ± 1.11 | 66.29a ± 1.64 | 59.15b ± 1.85 | 54.93ab ± 2.41 | 35.20bc ± 1.40 | 55.65A ± 2.99 |
| TE4 | 62.19a ± 1.91 | 58.13c ± 1.84 | 62.08ab ± 1.20 | 55.47a ± 2.10 | 35.20bc ± 2.95 | 54.61A ± 3.13 |
| S Control | 50.93b ± 2.90 | 42.13d ± 1.30 | 36.80f ± 1.40 | 29.33g ± 2.77 | 27.73d ± 2.61 | 37.39C ± 2.94 |
| T Control | 33.65c ± 2.10 | 27.73f ± 1.95 | 37.33f ± 1.45 | 31.20g ± 2.20 | 29.33cd ± 2.62 | 31.85D ± 1.83 |
| Control | 34.88c ± 2.80 | 34.13e ± 1.12 | 41.07ef ± 2.66 | 36.27f ± 1.78 | 26.13d ± 2.70 | 34.50CD ± 2.05 |
| Mean (P) ** | 52.84A ± 2.09 | 51.23A ± 2.41 | 51.22A ± 1.98 | 44.41B ± 1.93 | 35.90C ± 1.41 | |
| Significance | P0 = ** | P15 = ** | P30 = ** | P45 = ** | P60 = ** | Treat. = ** |
Disclaimer/Publisher’s Note: The statements, opinions and data contained in all publications are solely those of the individual author(s) and contributor(s) and not of MDPI and/or the editor(s). MDPI and/or the editor(s) disclaim responsibility for any injury to people or property resulting from any ideas, methods, instructions or products referred to in the content. |
© 2023 by the authors. Licensee MDPI, Basel, Switzerland. This article is an open access article distributed under the terms and conditions of the Creative Commons Attribution (CC BY) license (https://creativecommons.org/licenses/by/4.0/).
Share and Cite
Beheiry, H.R.; Hasanin, M.S.; Abdelkhalek, A.; Hussein, H.A.Z. Potassium Spraying Preharvest and Nanocoating Postharvest Improve the Quality and Extend the Storage Period for Acid Lime (Citrus aurantifolia Swingle) Fruits. Plants 2023, 12, 3848. https://doi.org/10.3390/plants12223848
Beheiry HR, Hasanin MS, Abdelkhalek A, Hussein HAZ. Potassium Spraying Preharvest and Nanocoating Postharvest Improve the Quality and Extend the Storage Period for Acid Lime (Citrus aurantifolia Swingle) Fruits. Plants. 2023; 12(22):3848. https://doi.org/10.3390/plants12223848
Chicago/Turabian StyleBeheiry, Hamada R., Mohamed S. Hasanin, Amr Abdelkhalek, and Hamdy A. Z. Hussein. 2023. "Potassium Spraying Preharvest and Nanocoating Postharvest Improve the Quality and Extend the Storage Period for Acid Lime (Citrus aurantifolia Swingle) Fruits" Plants 12, no. 22: 3848. https://doi.org/10.3390/plants12223848
APA StyleBeheiry, H. R., Hasanin, M. S., Abdelkhalek, A., & Hussein, H. A. Z. (2023). Potassium Spraying Preharvest and Nanocoating Postharvest Improve the Quality and Extend the Storage Period for Acid Lime (Citrus aurantifolia Swingle) Fruits. Plants, 12(22), 3848. https://doi.org/10.3390/plants12223848