
Isolation and Identification of 12-Deoxyphorbol Esters from Euphorbia resinifera Berg Latex: Targeted and Biased Non-Targeted Identification of 12-Deoxyphorbol Esters by UHPLC-HRMSE

 , and
, and
Abstract
:1. Introduction
2. Results and Discussion
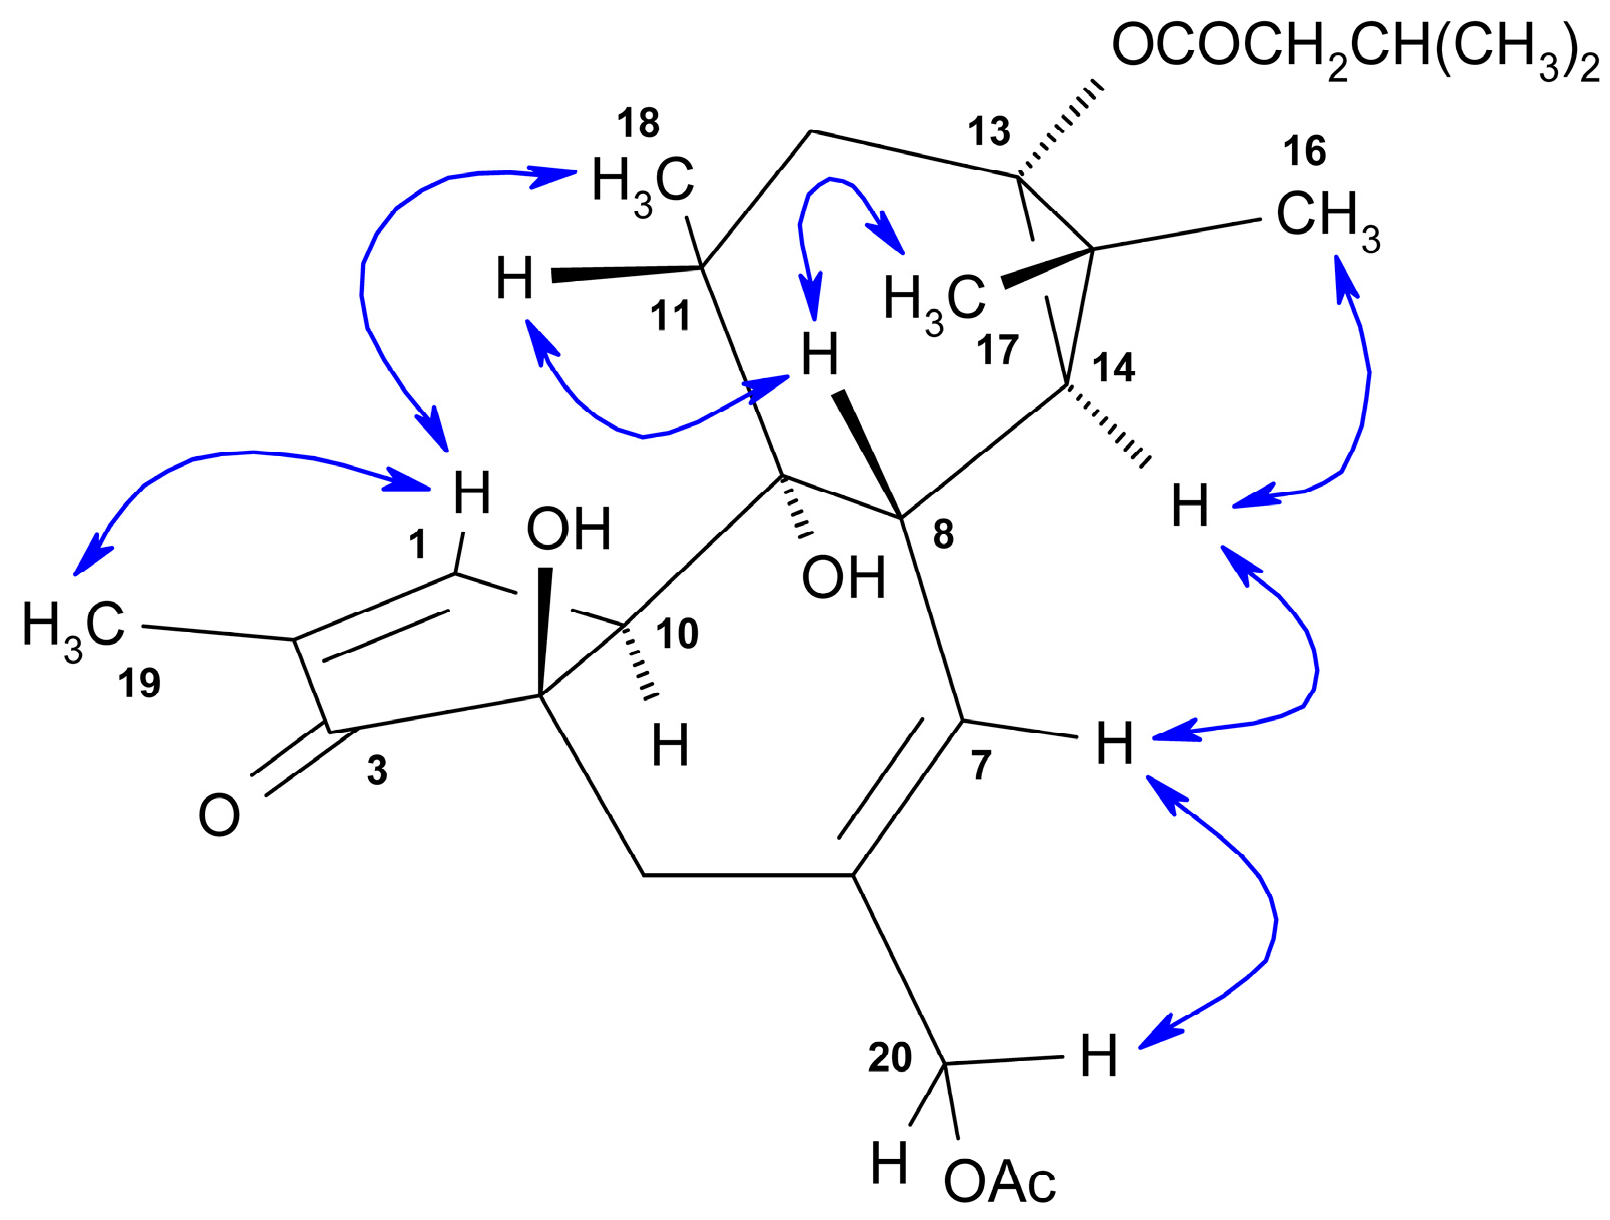
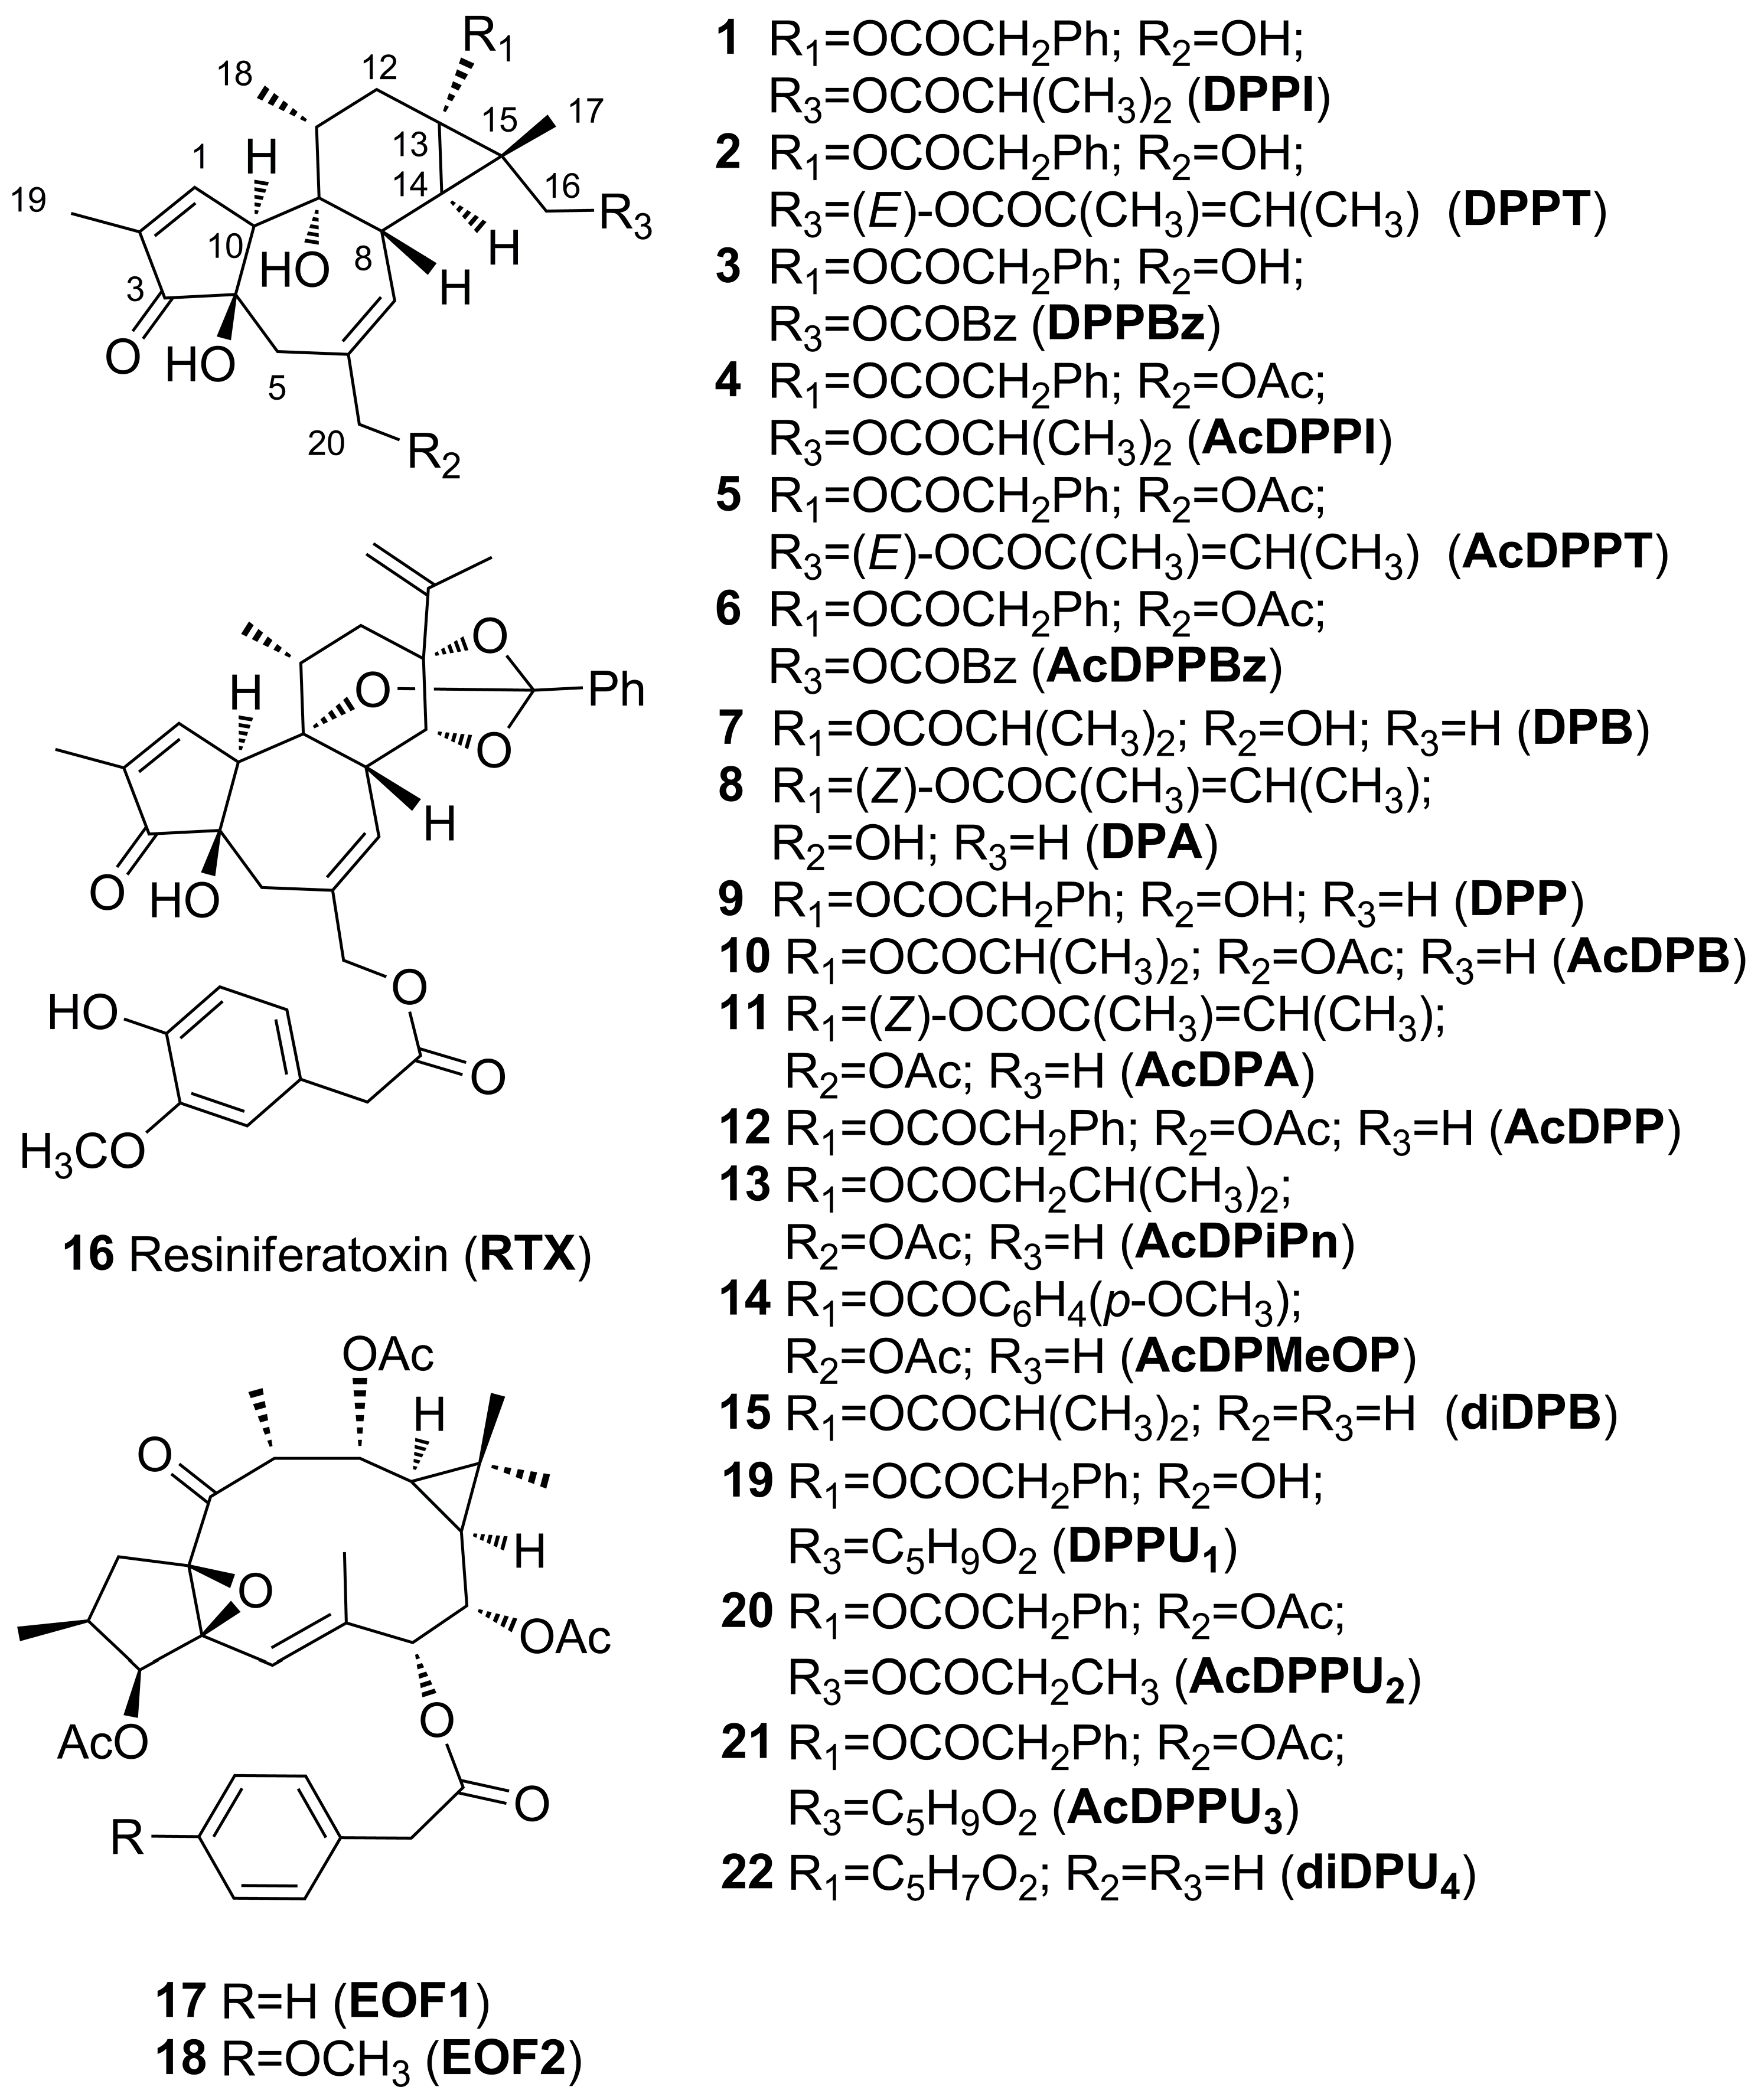
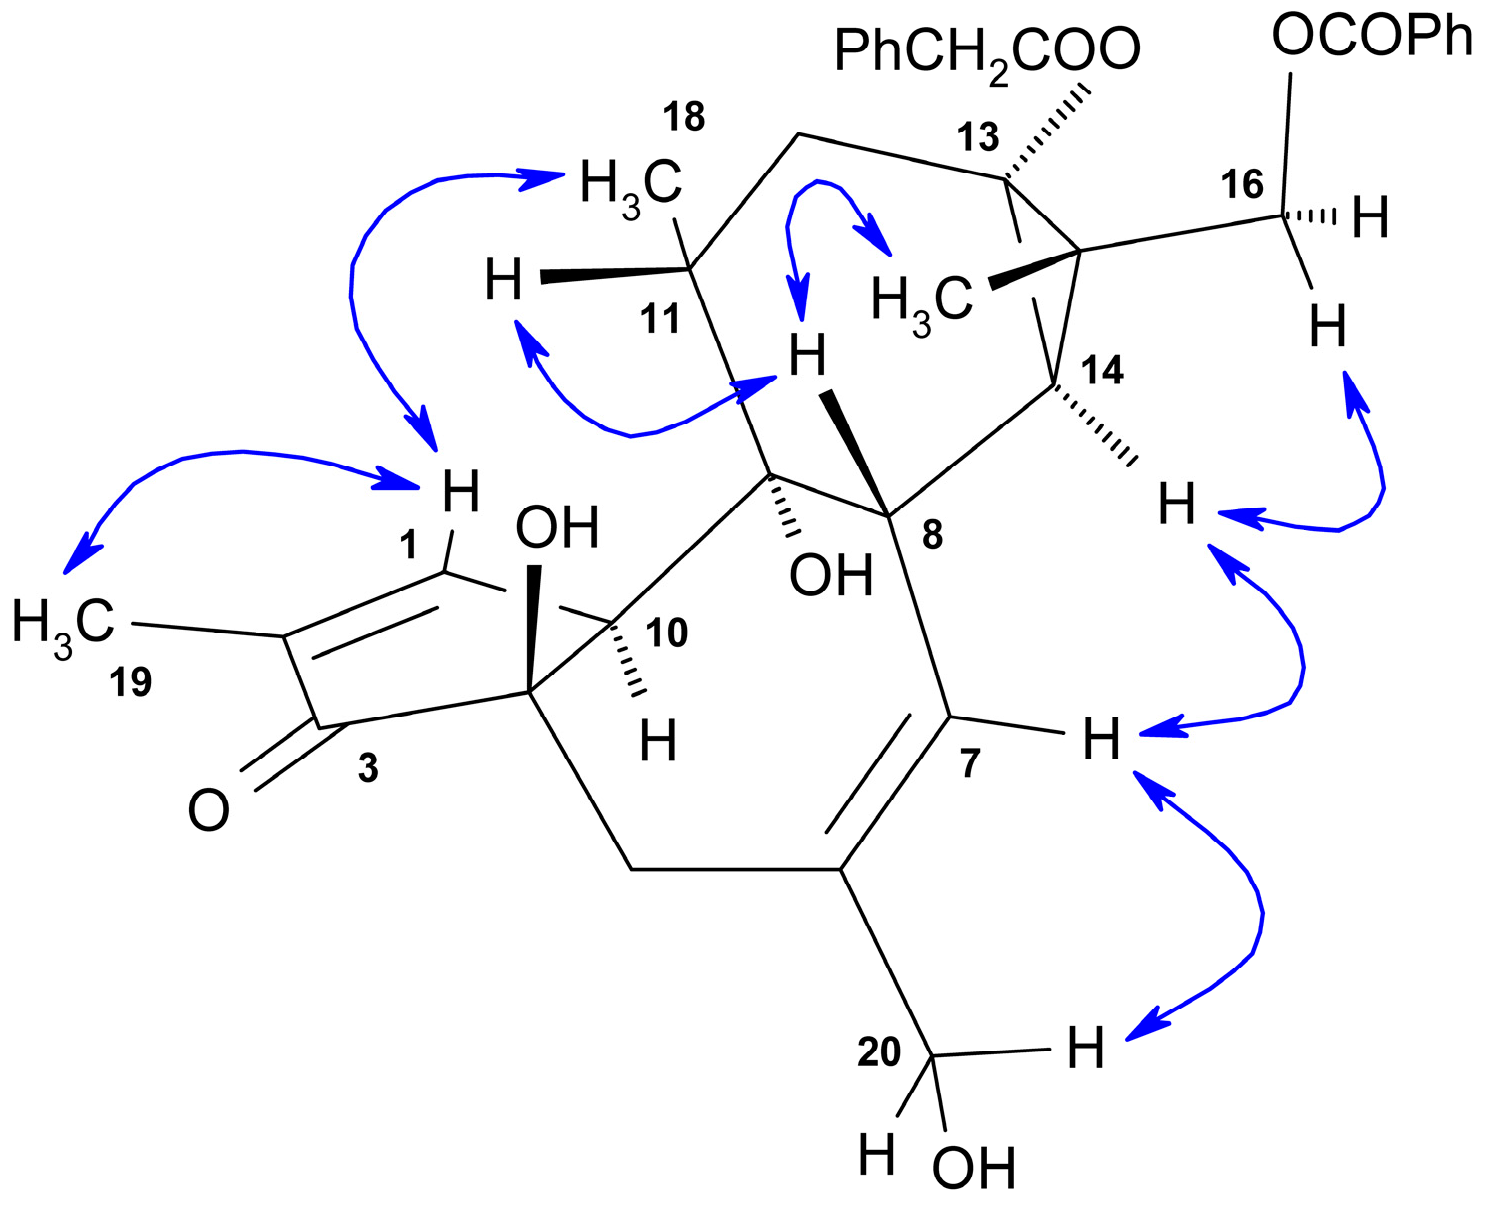
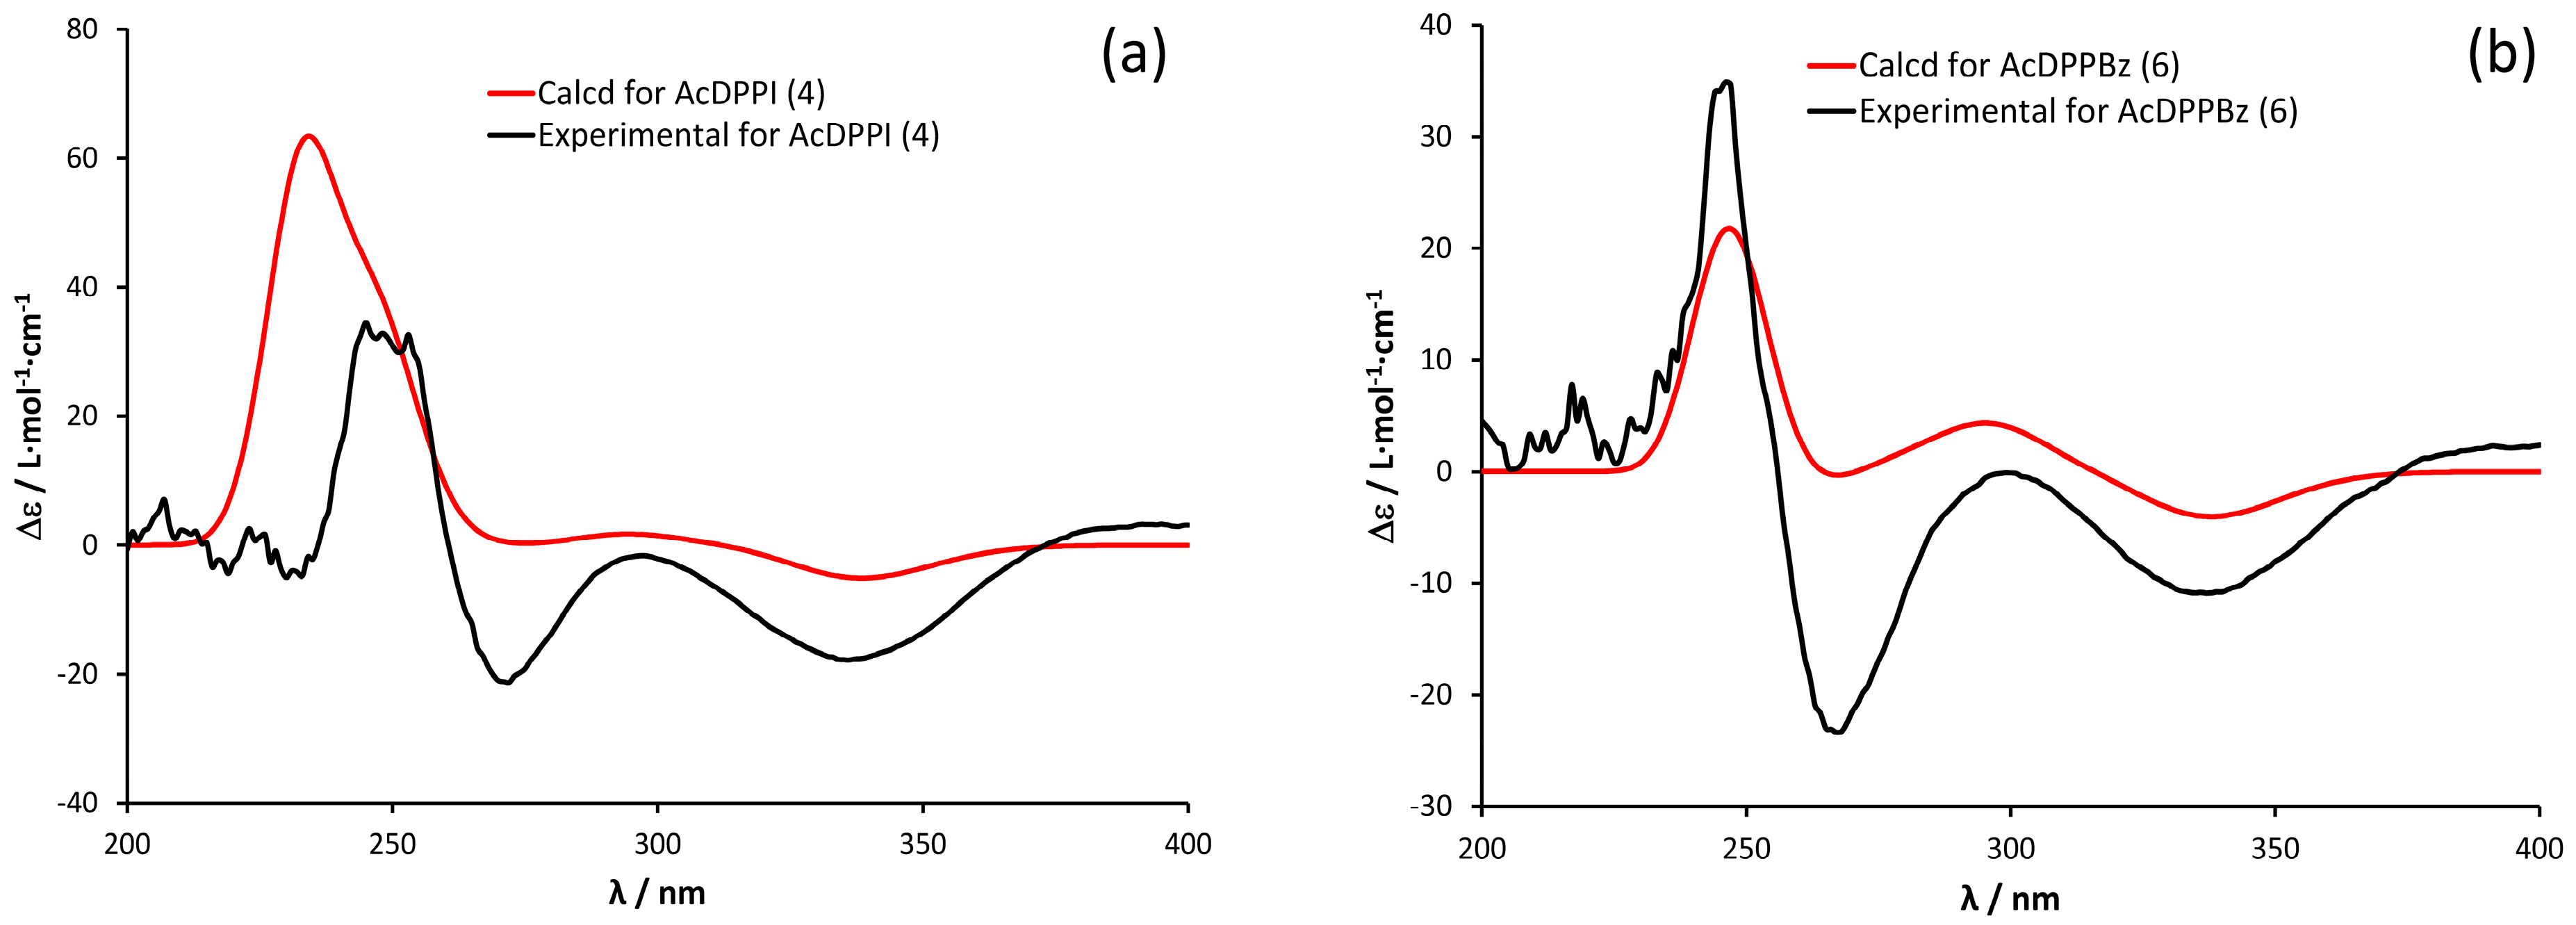
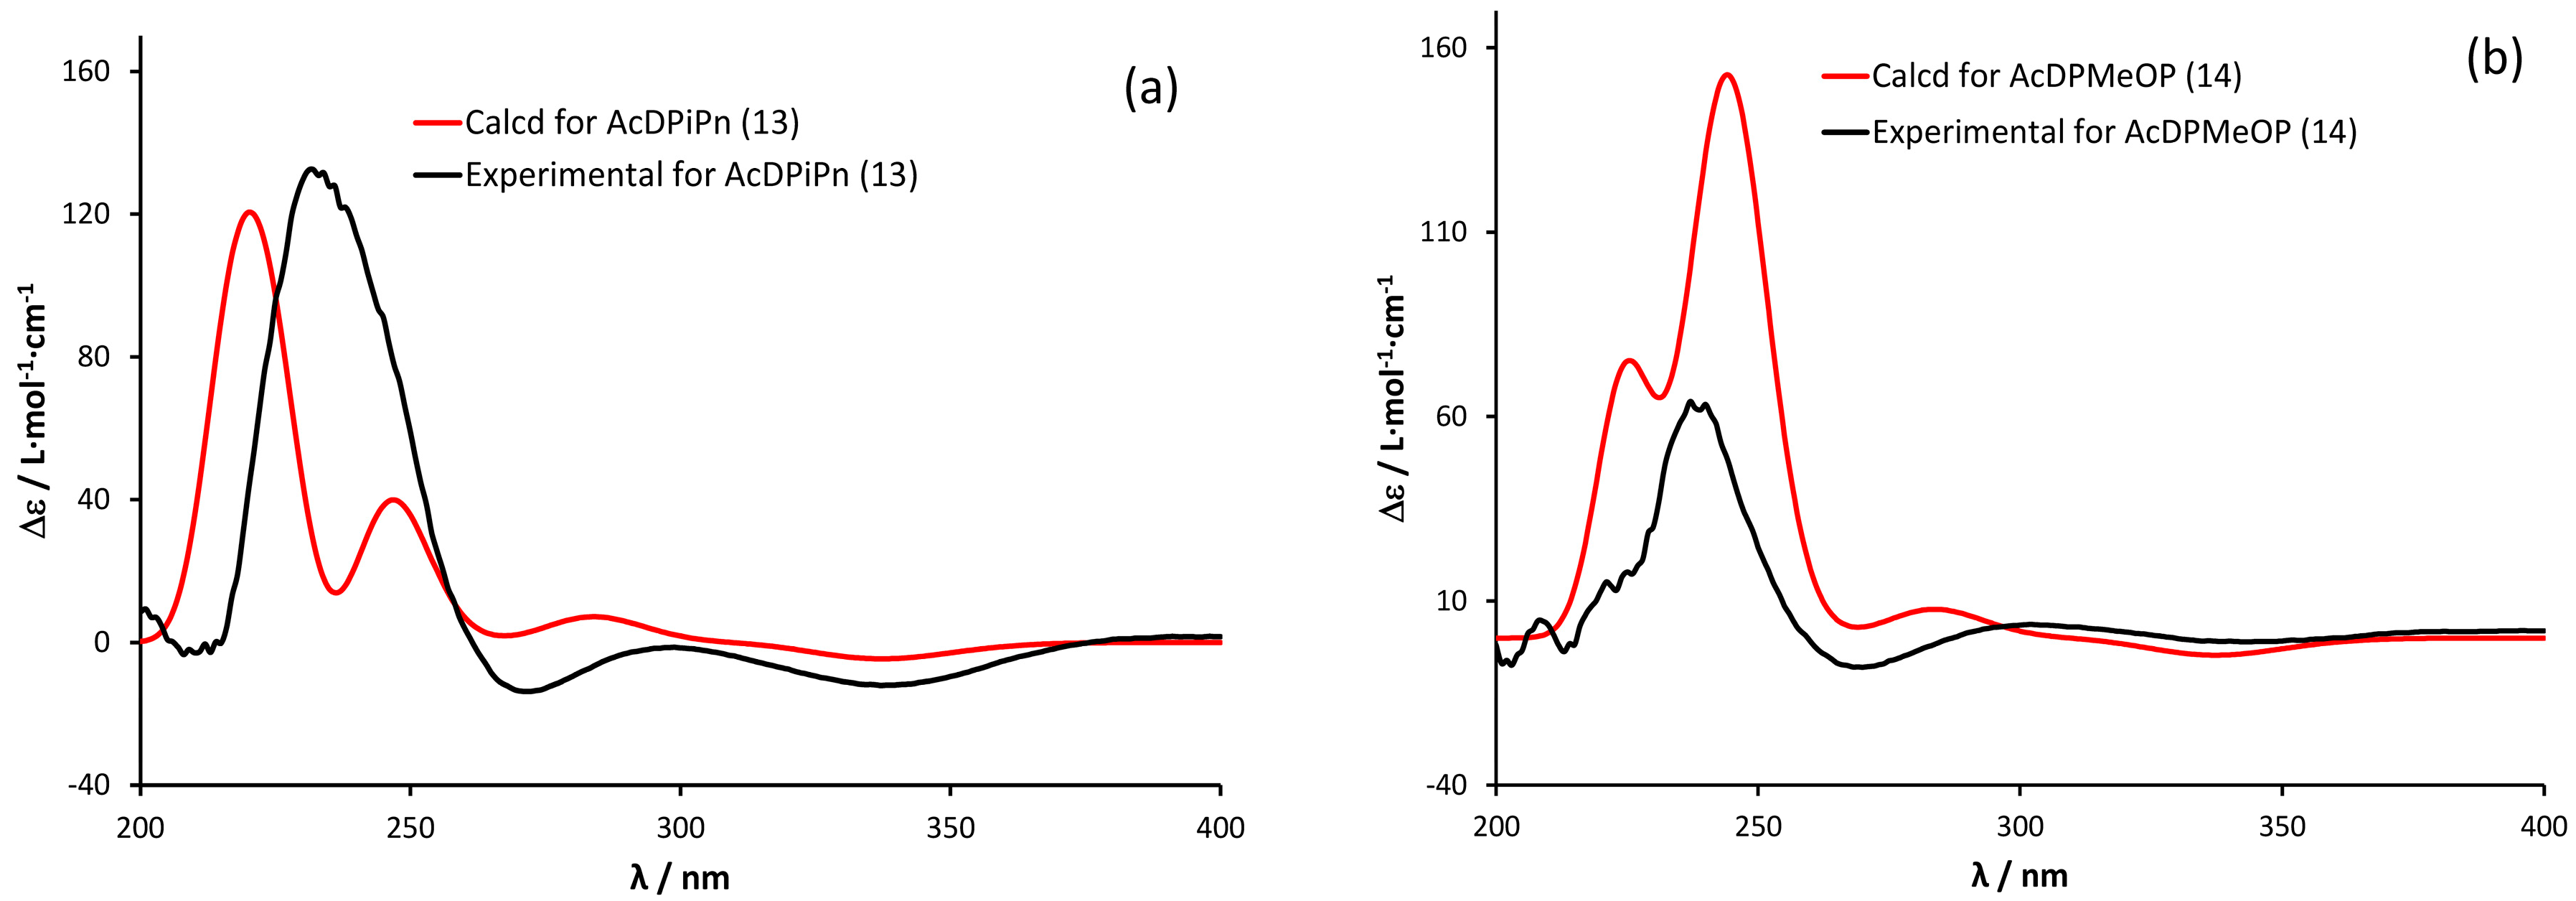
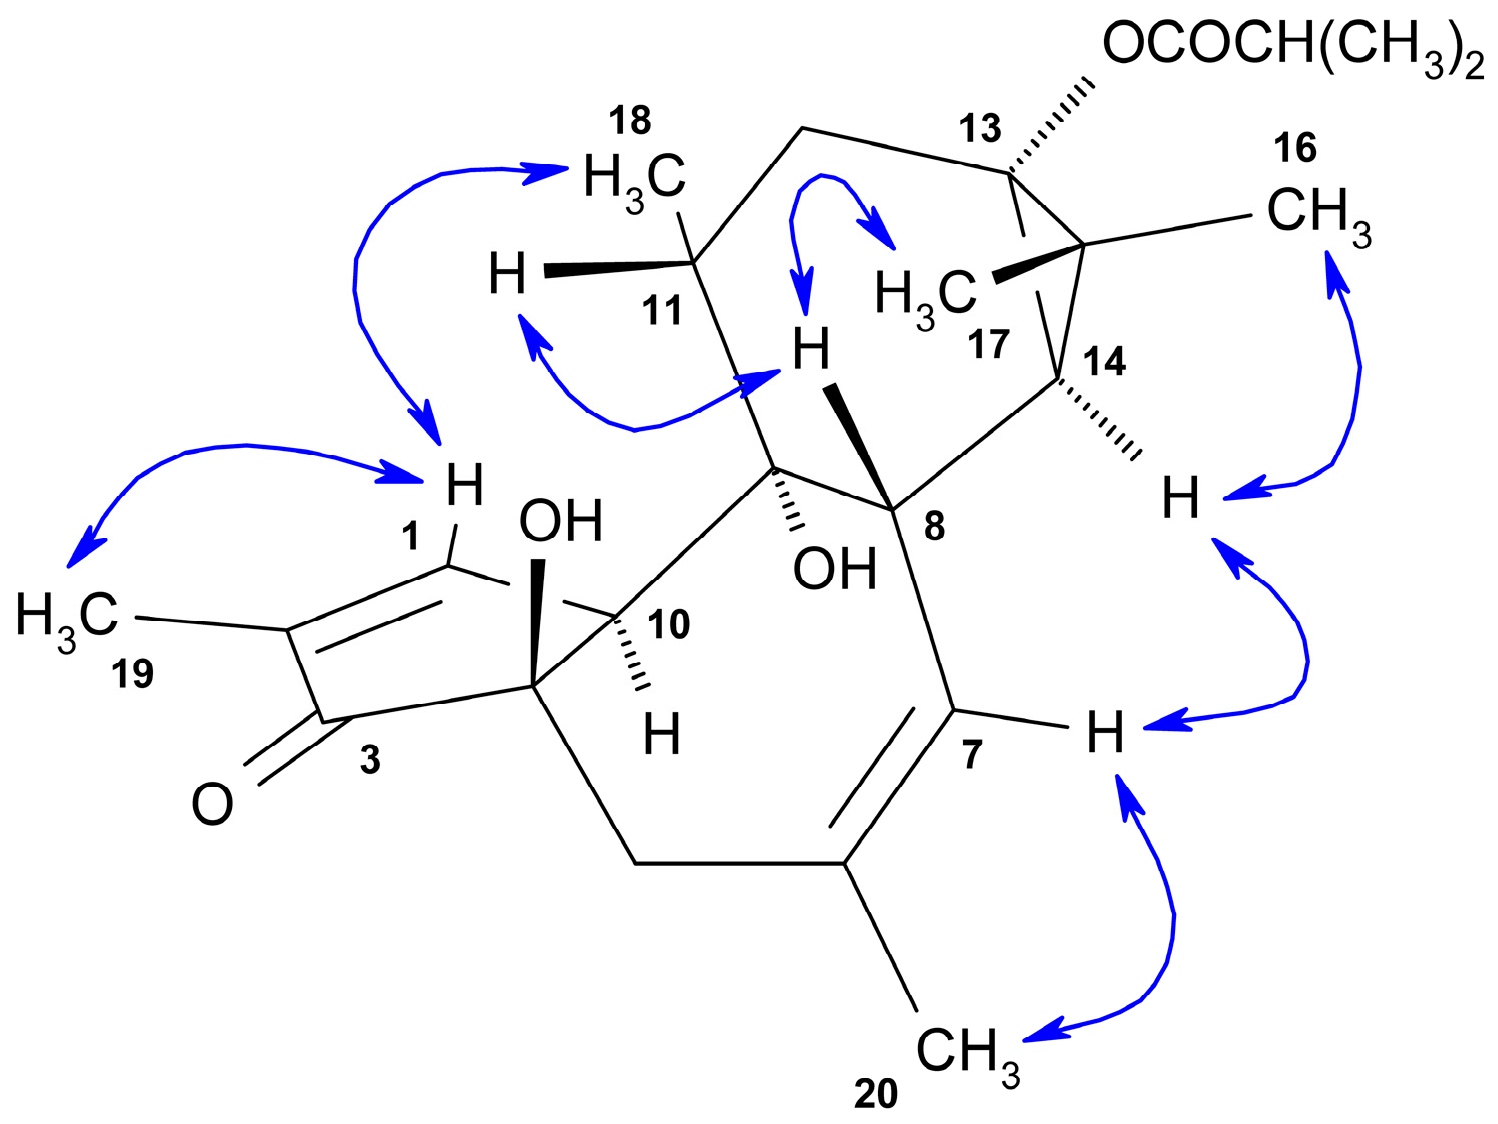
2.1. Structural Elucidation of Isolated Diterpenes

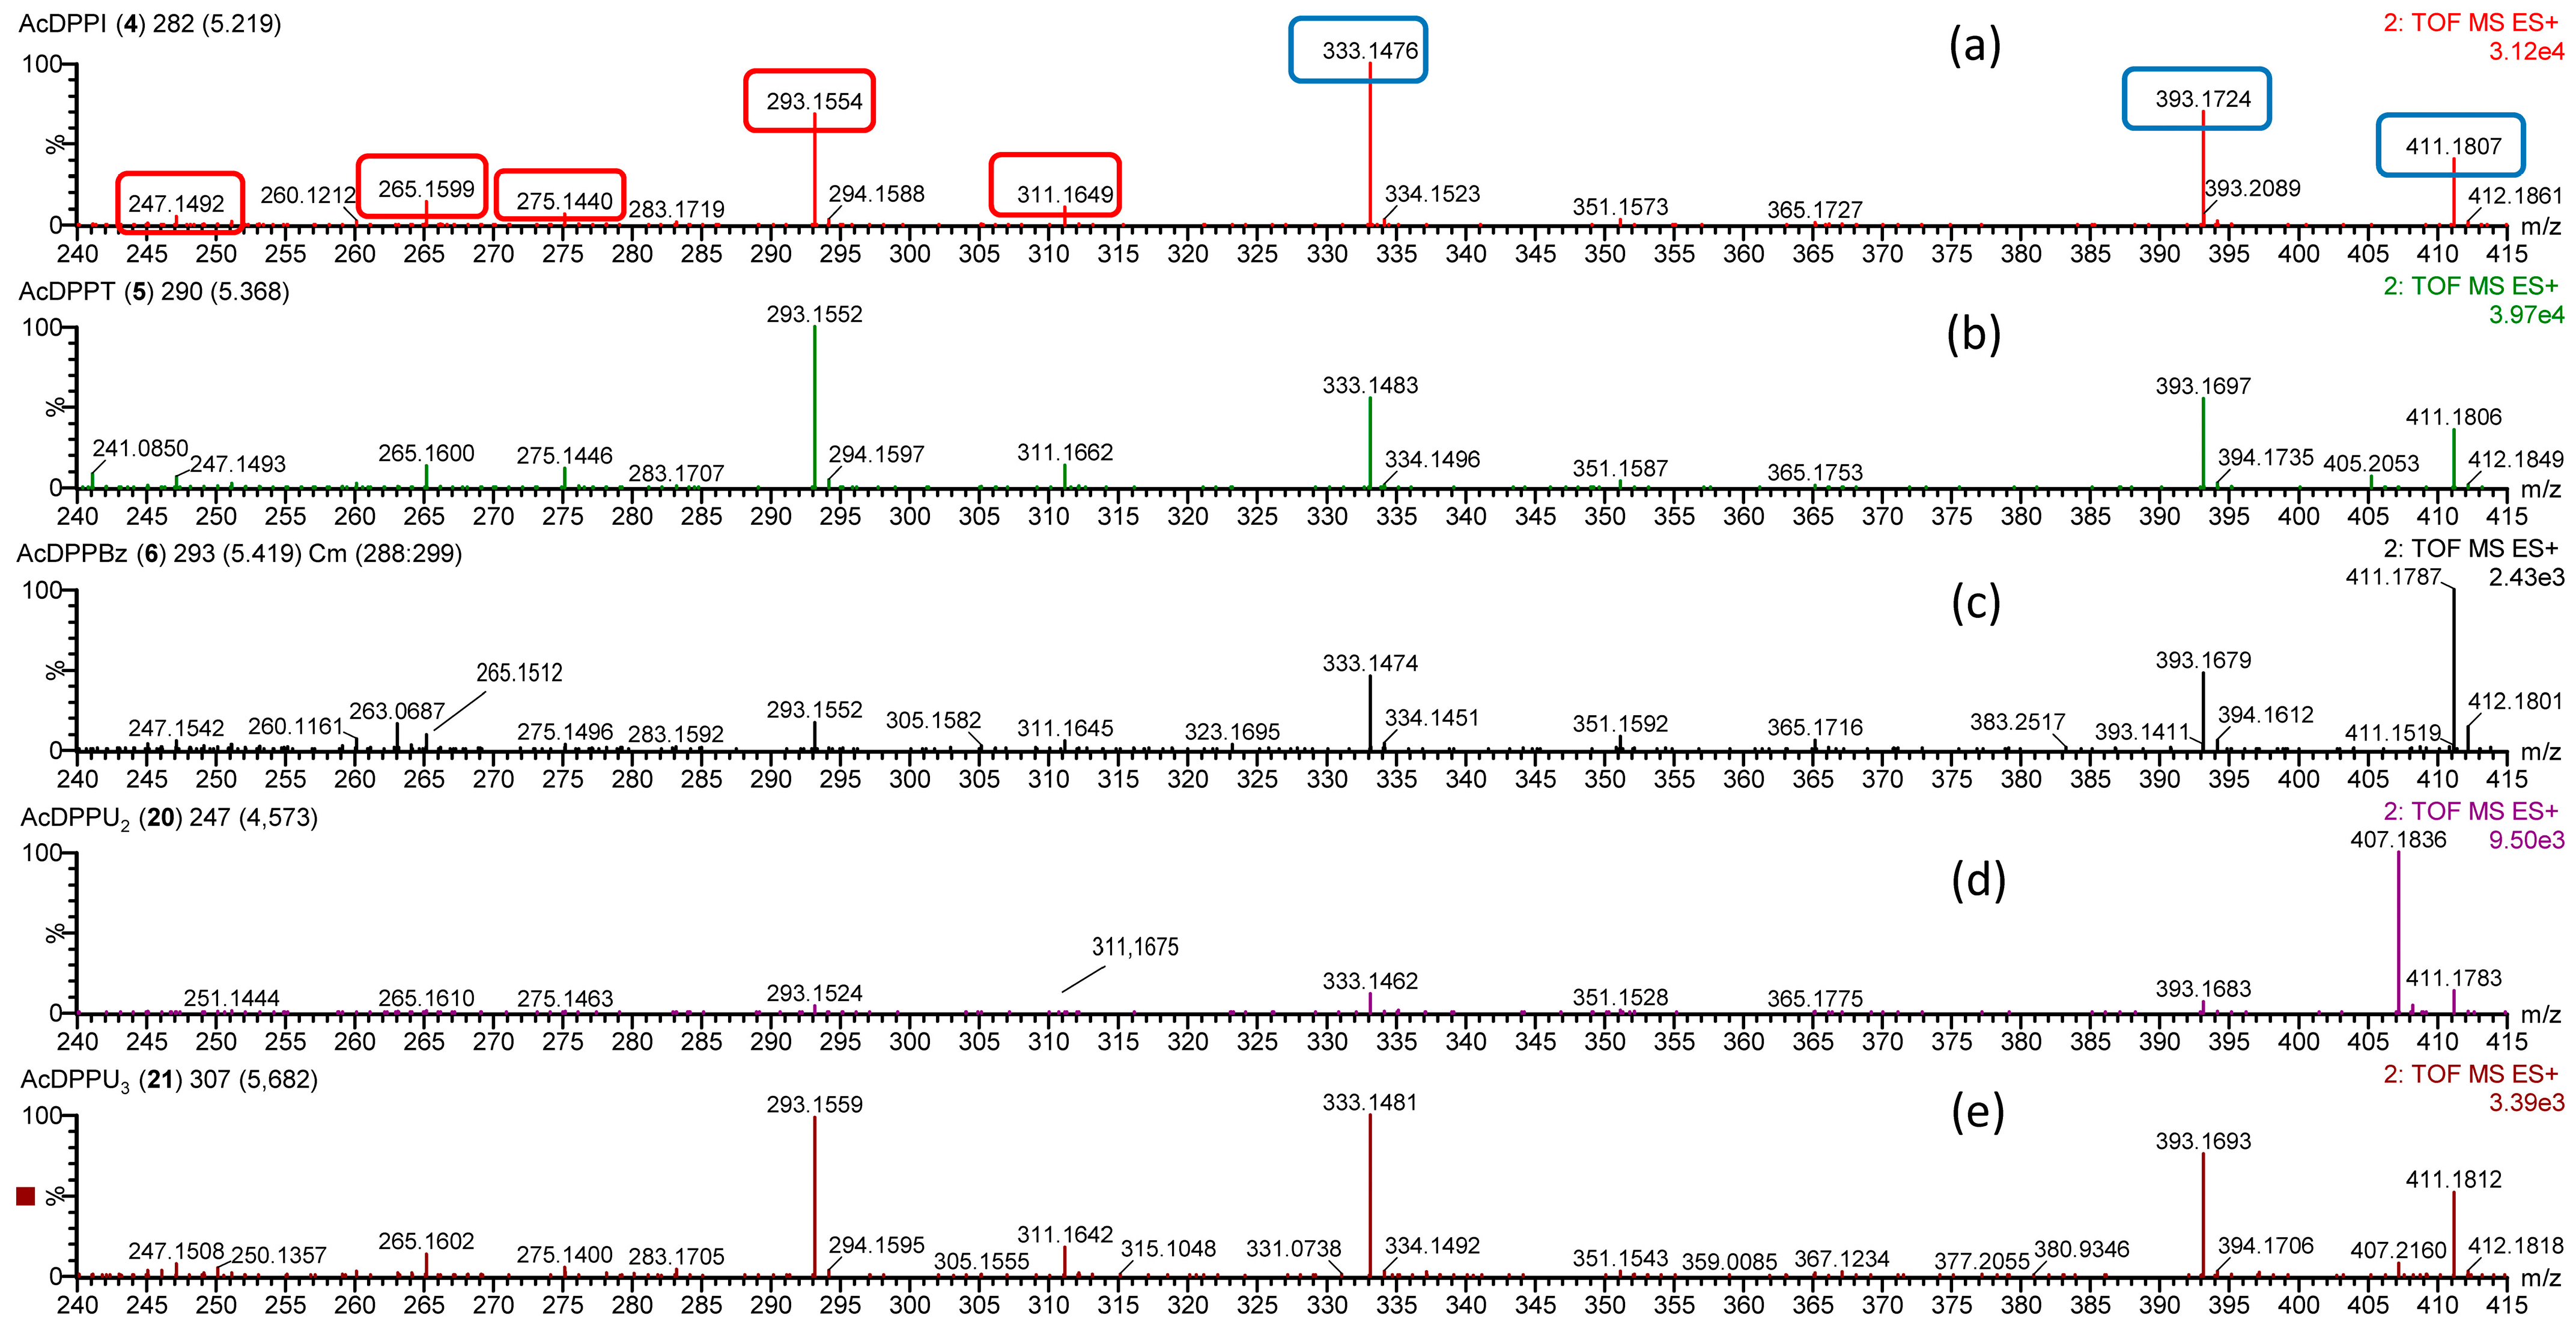
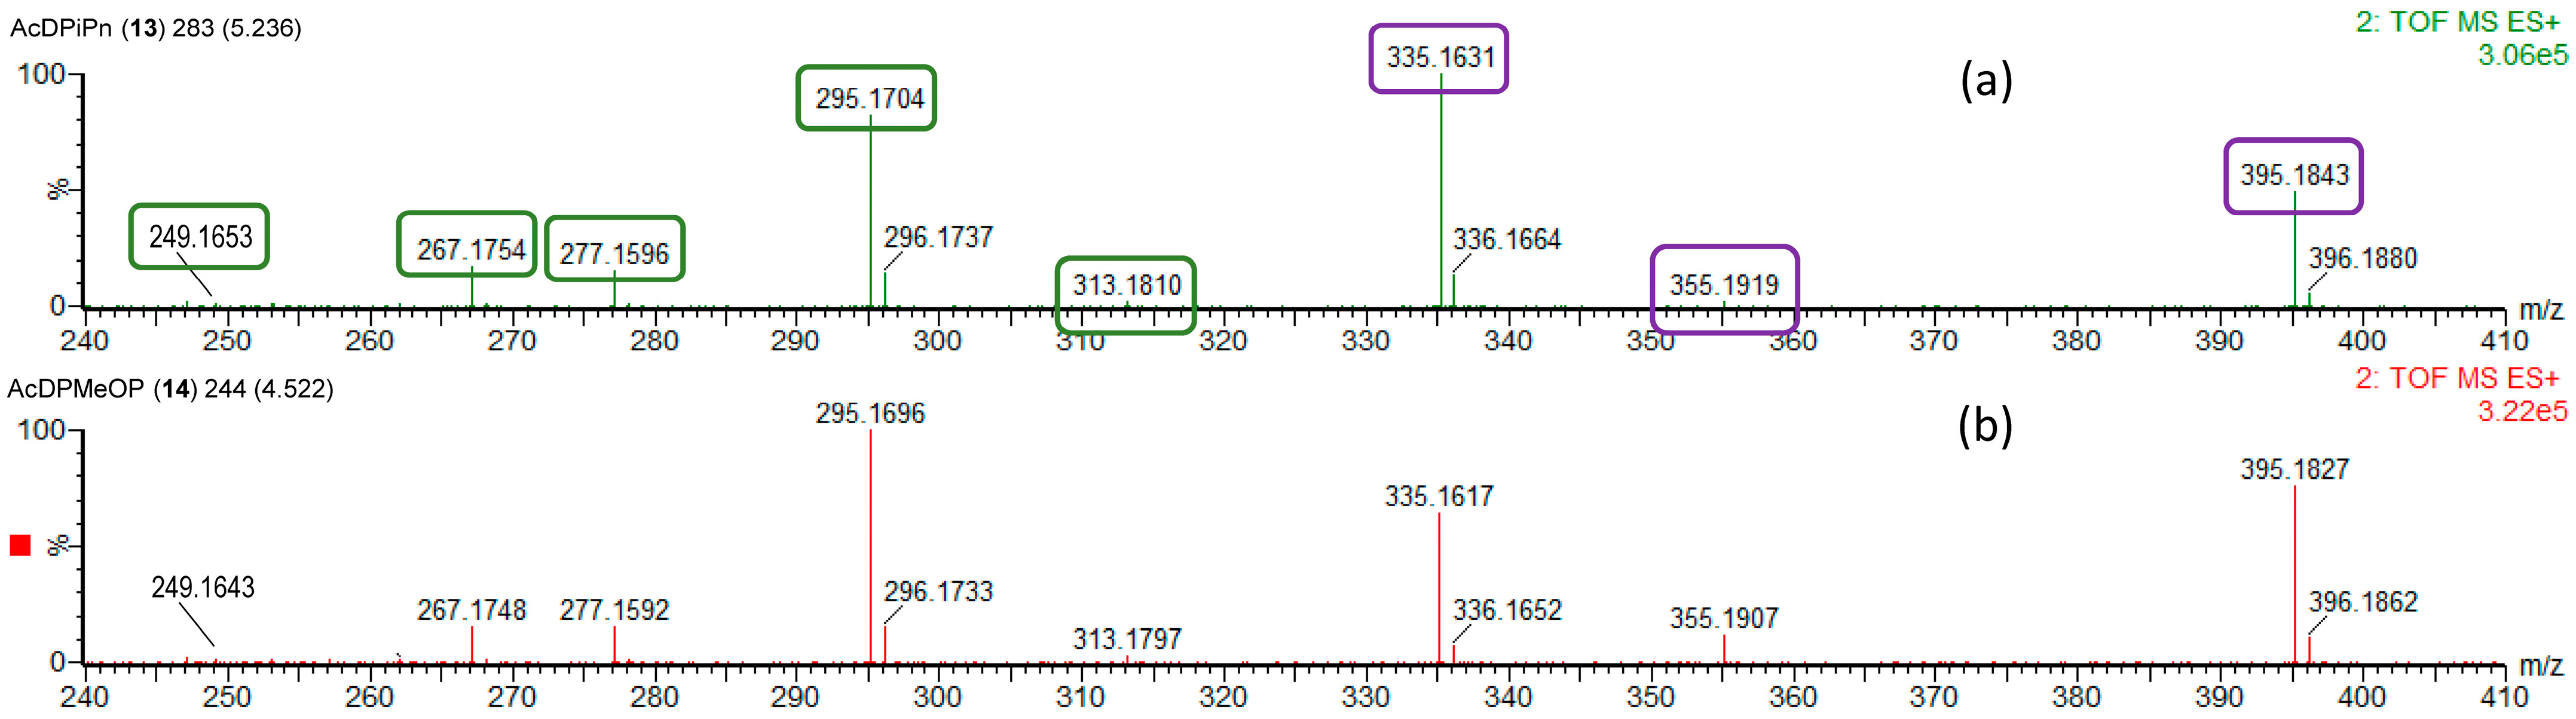
2.2. Identification of 12-Deoxyphorbol Derivatives by UHPLC-HRMSE: Targeted and Biased Non-Targeted Analysis
- A.
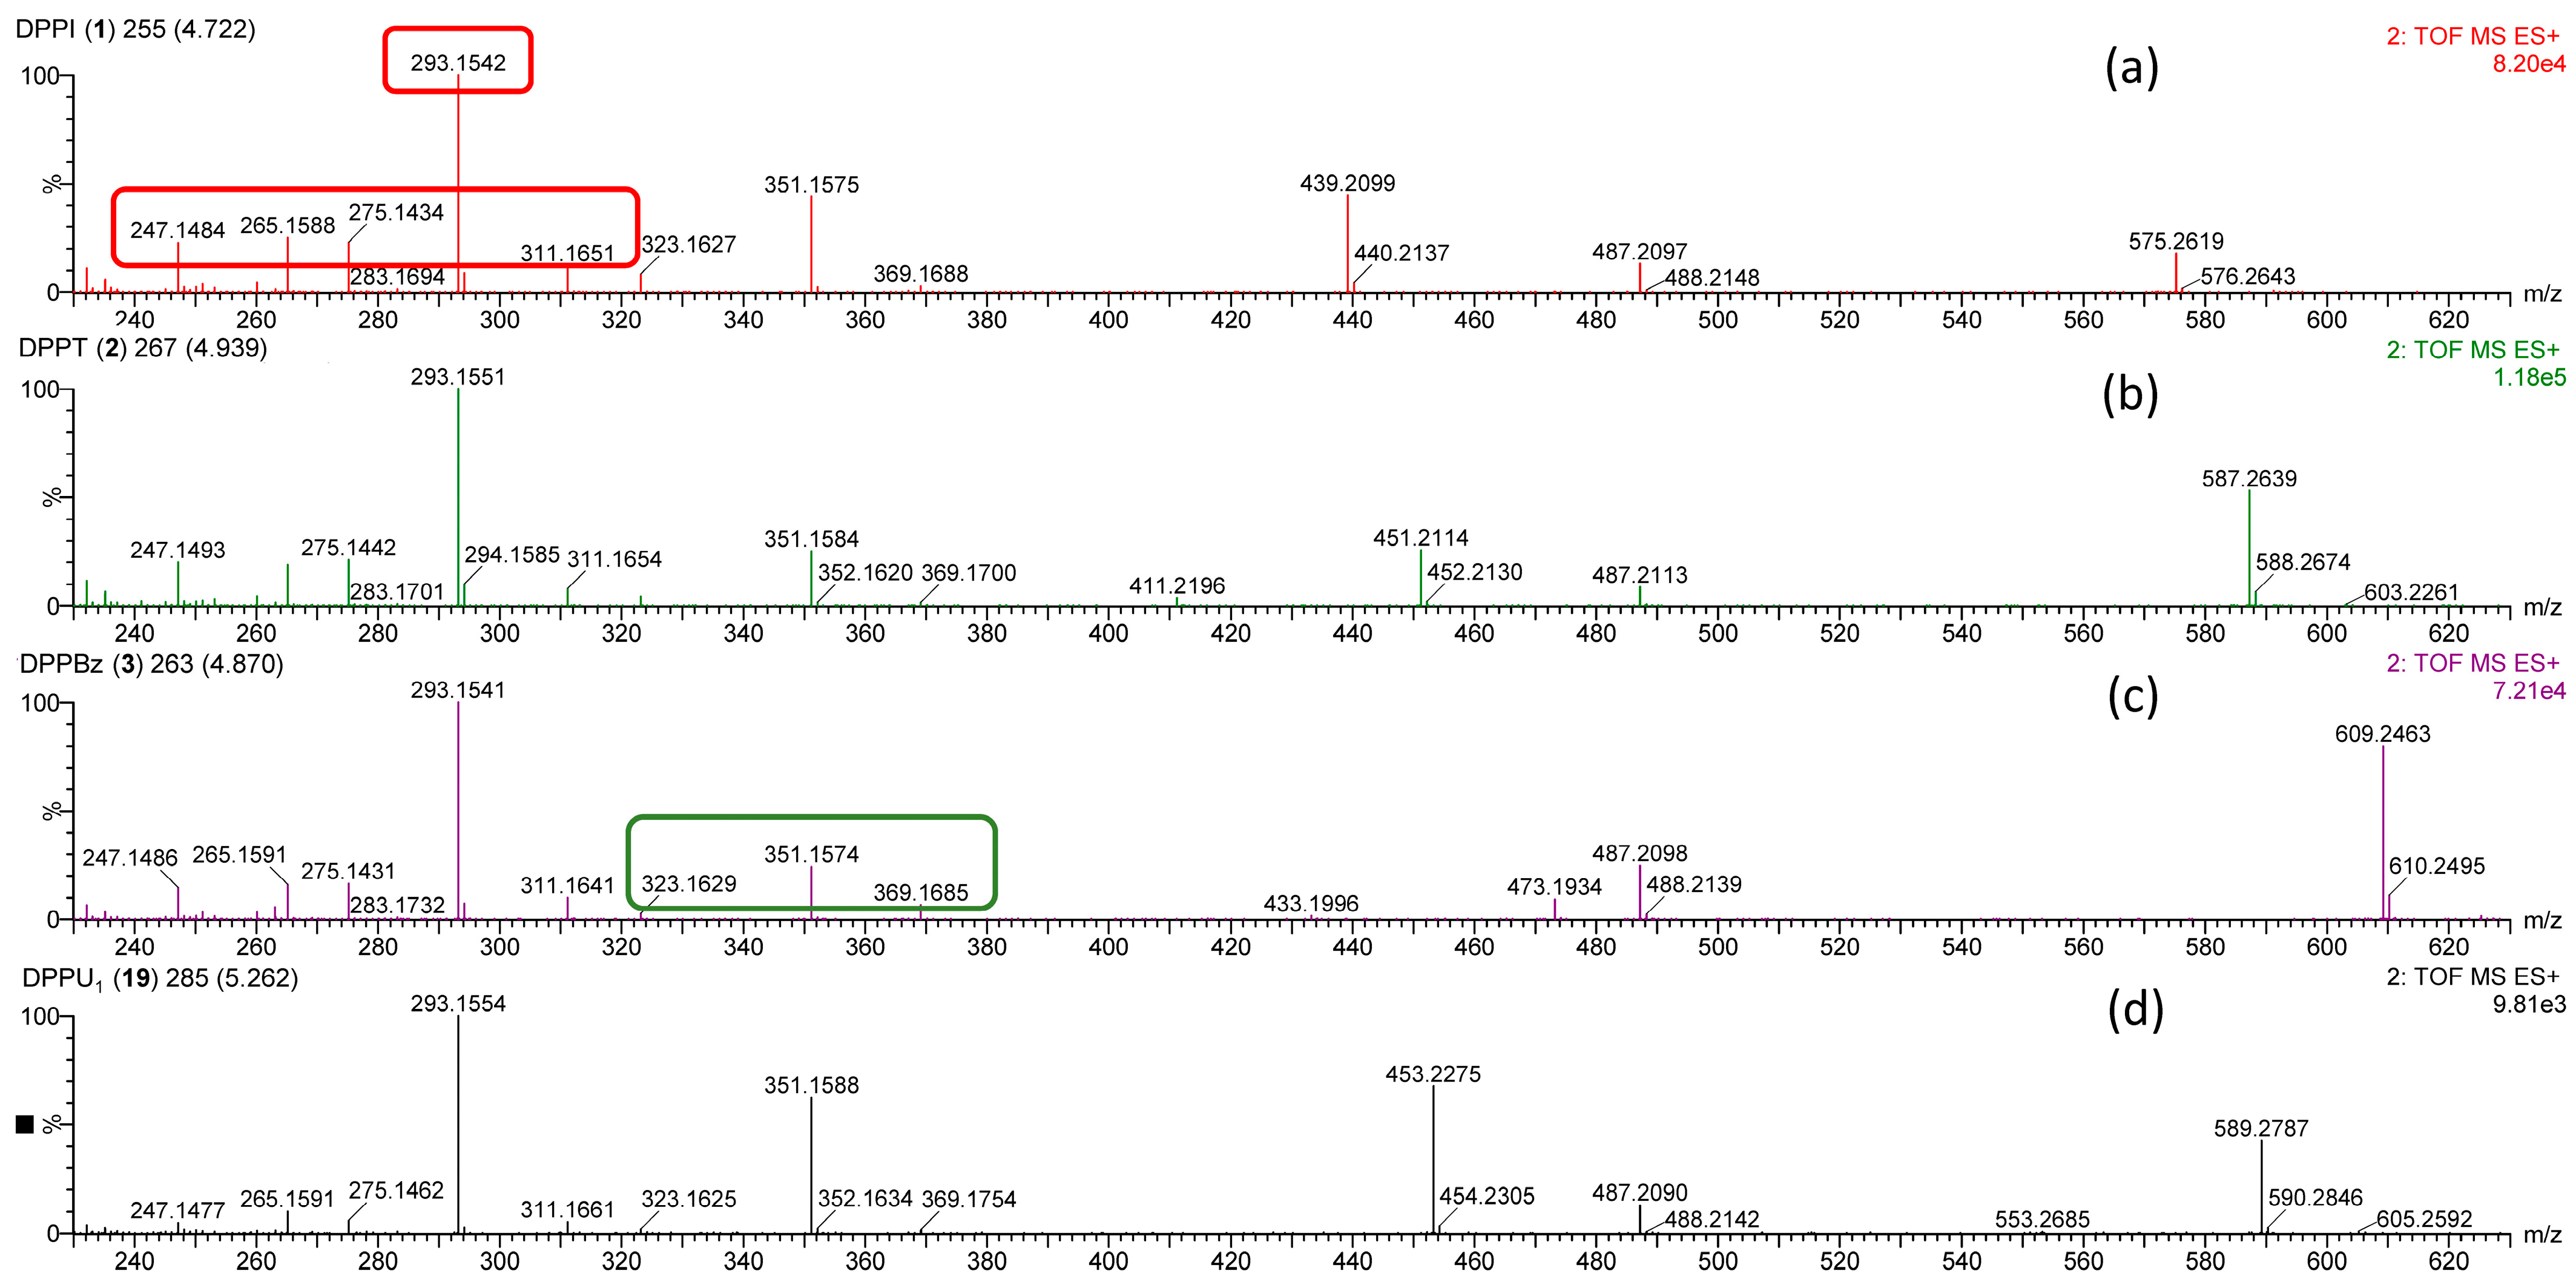
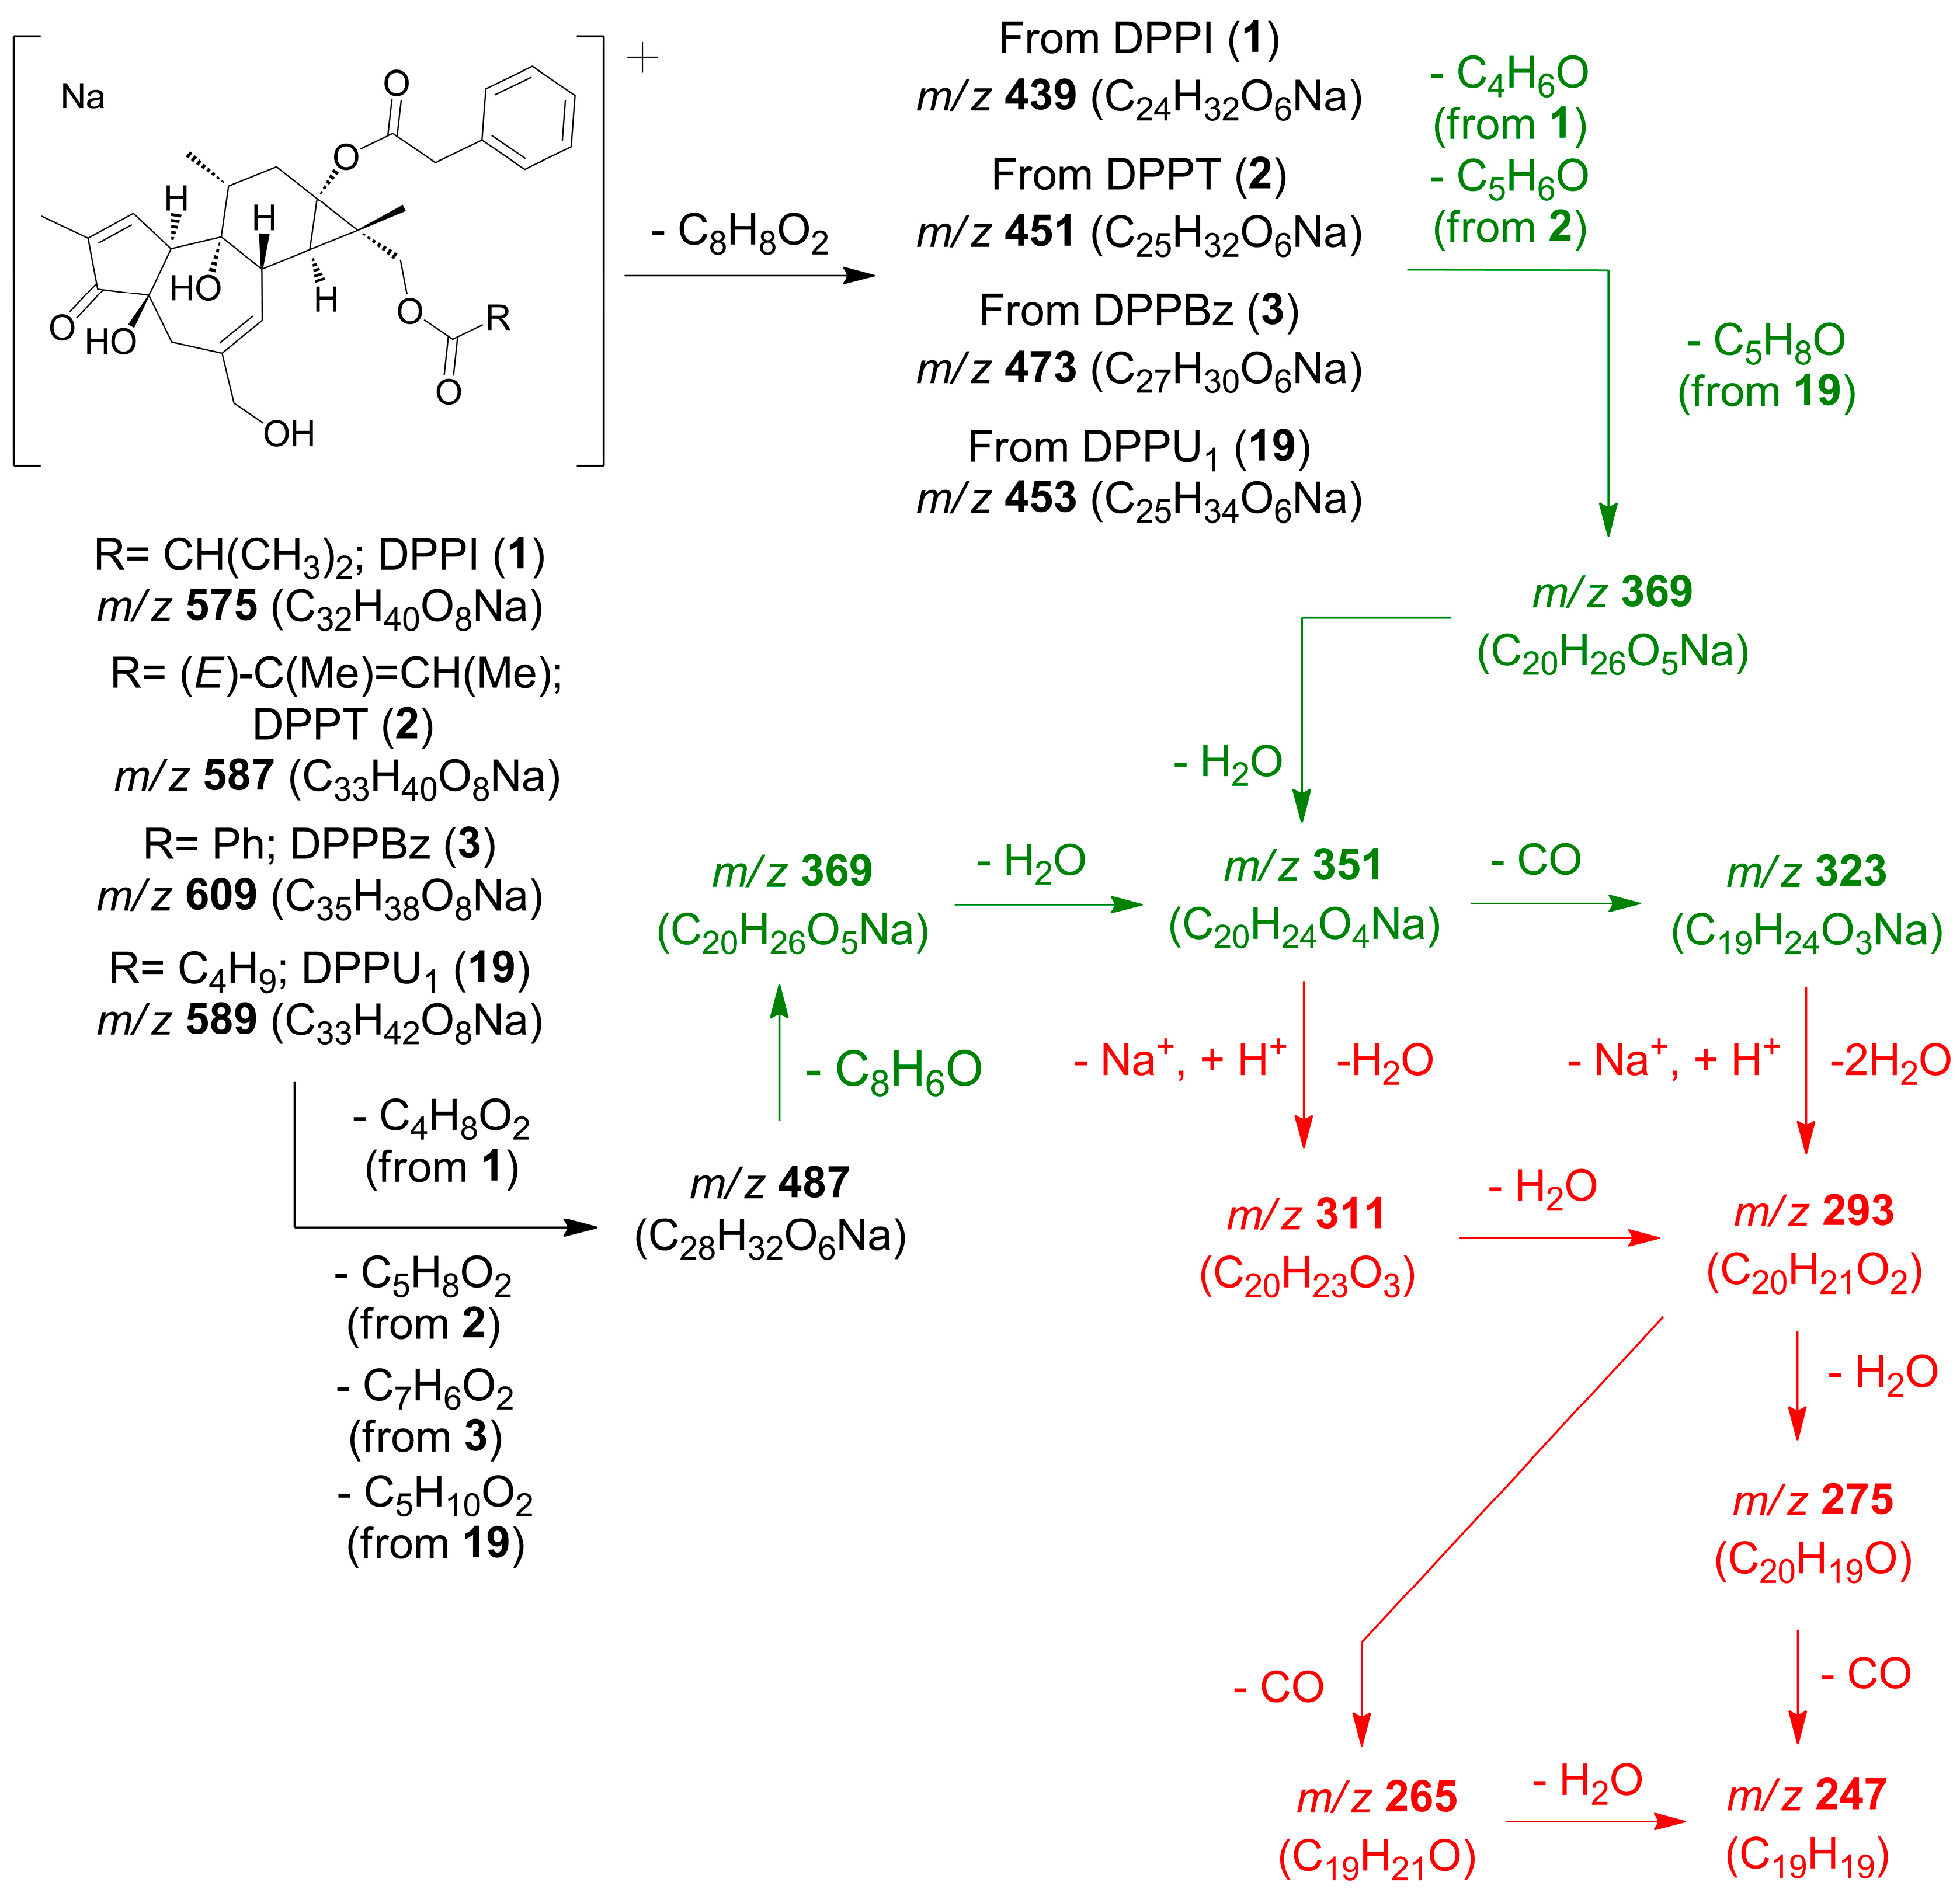
- 12-Deoxy-16-hydroxyphorbol 13,16-diacyl derivatives (1–3) (Scheme 1).
- B.
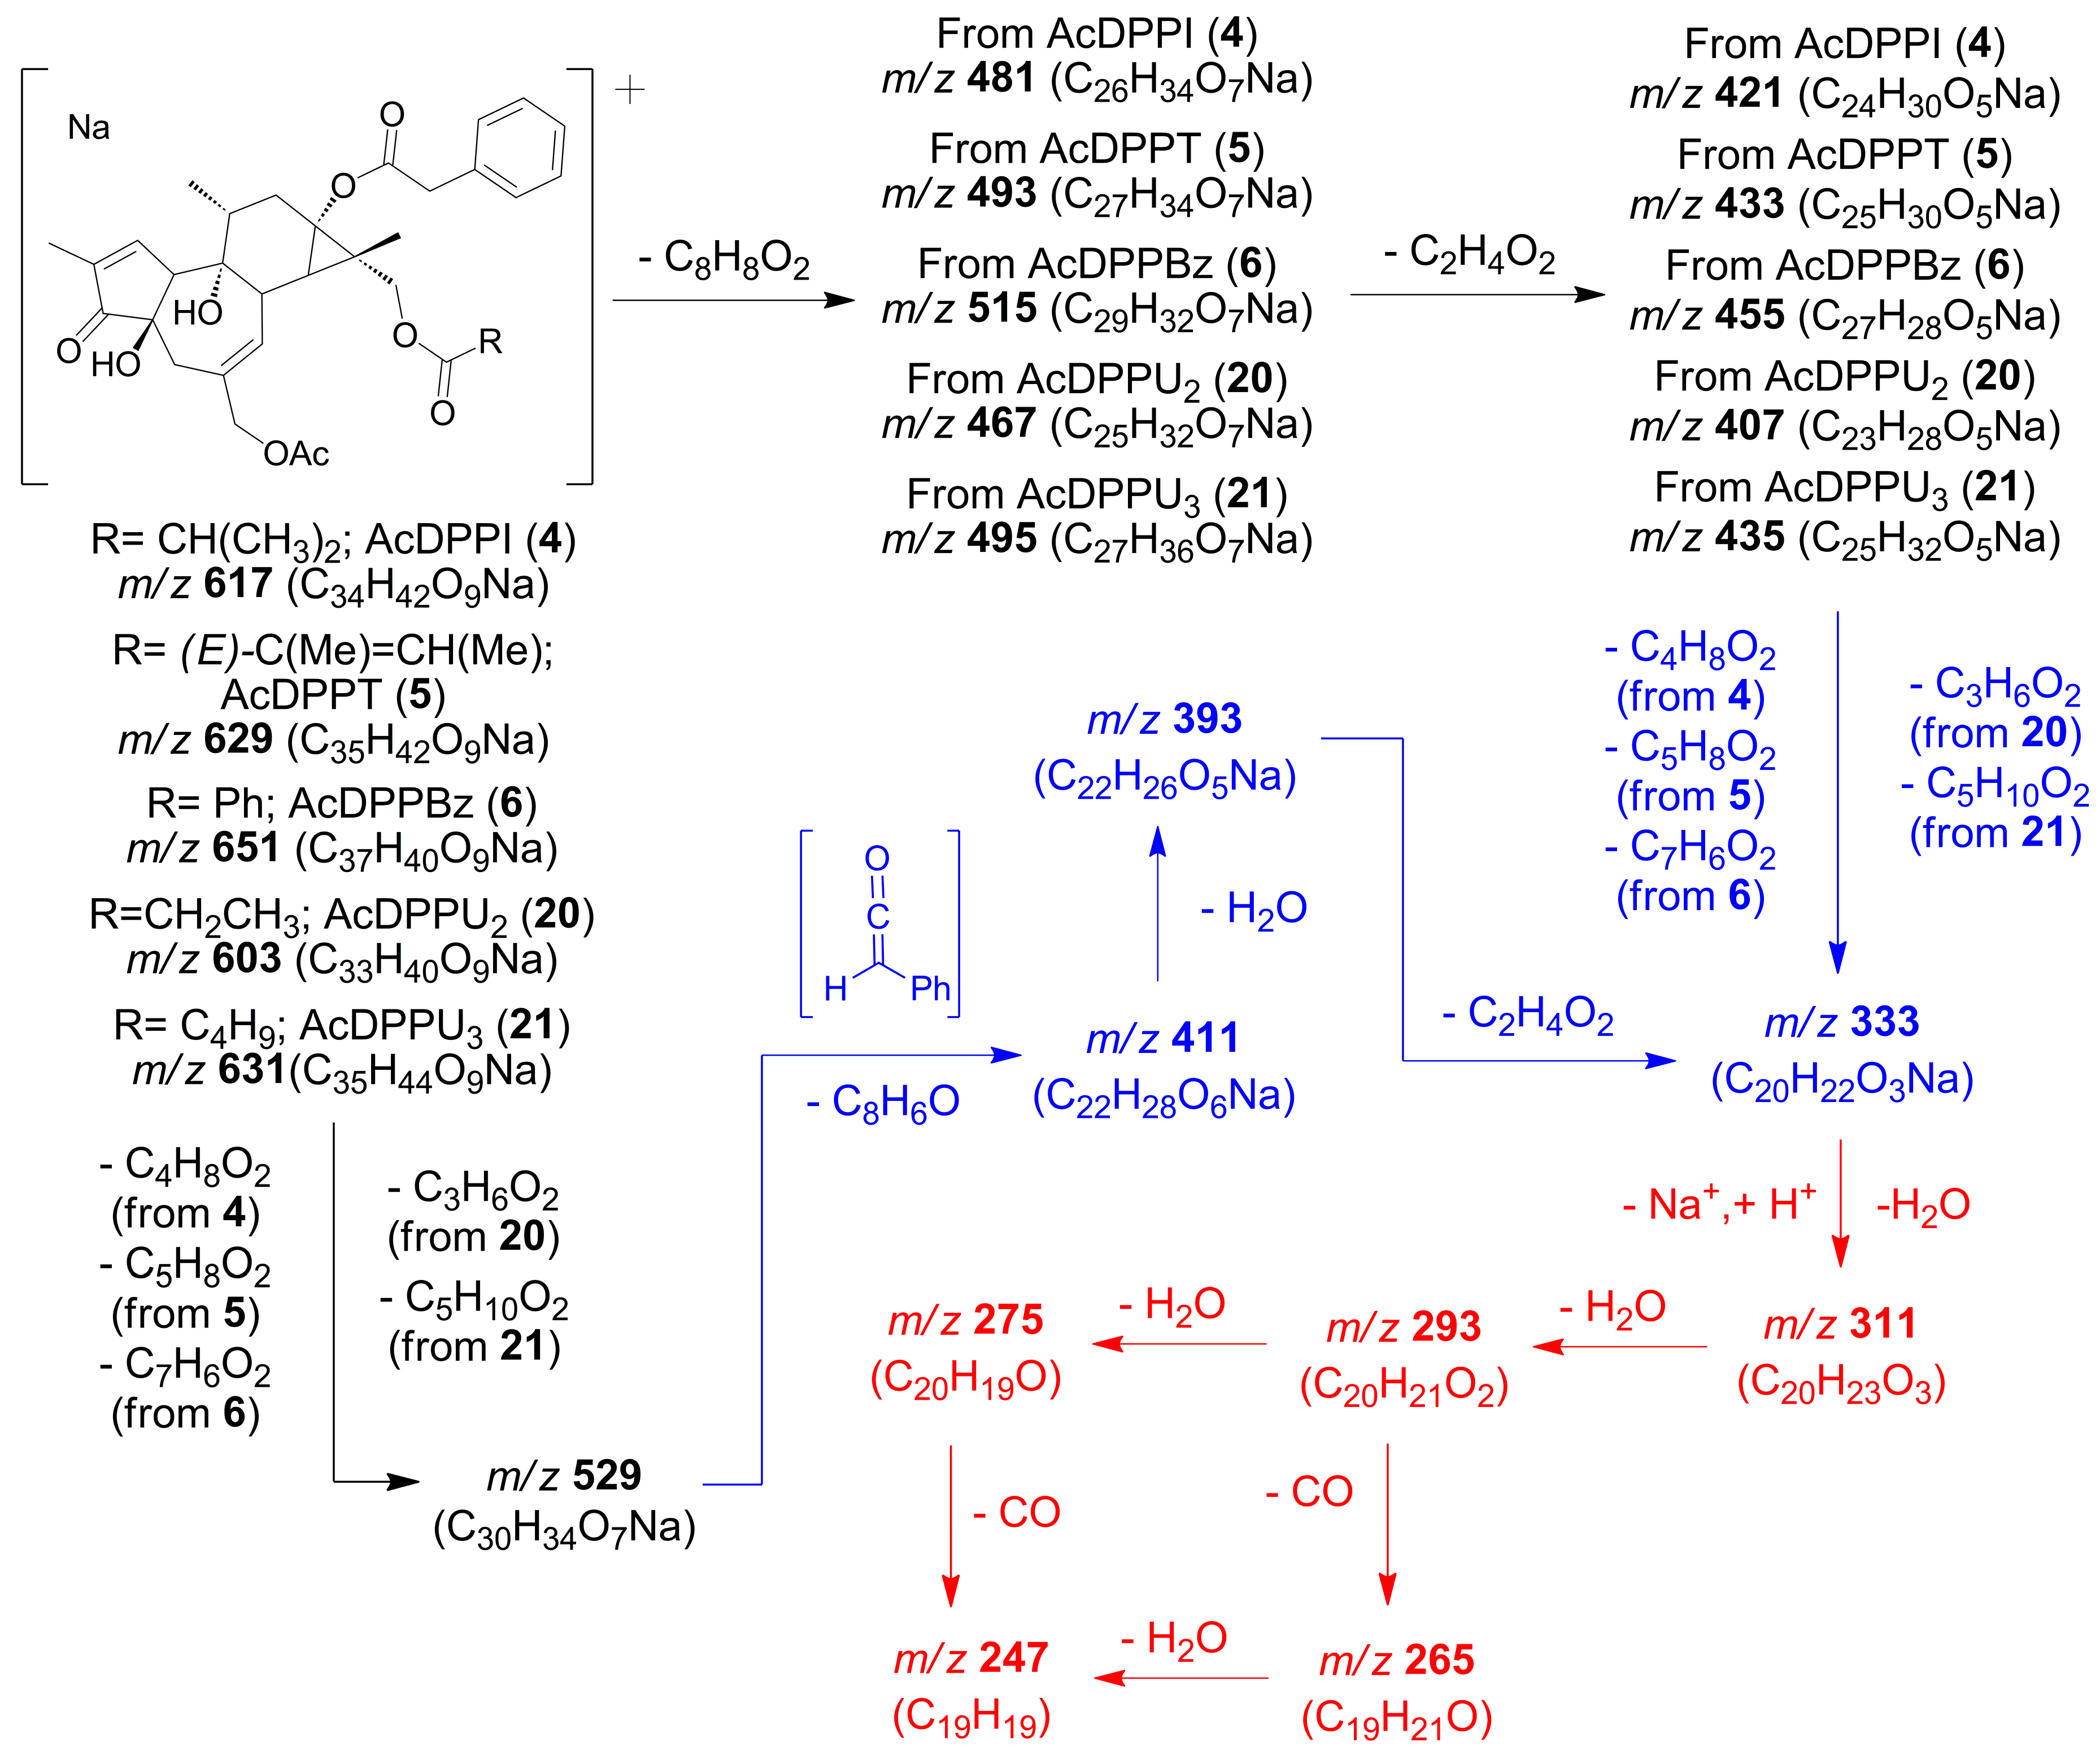
- 12-Deoxy-16-hydroxyphorbol 20-acetate 13,16-diacyl derivatives (4–6) (Scheme 2).
- C.
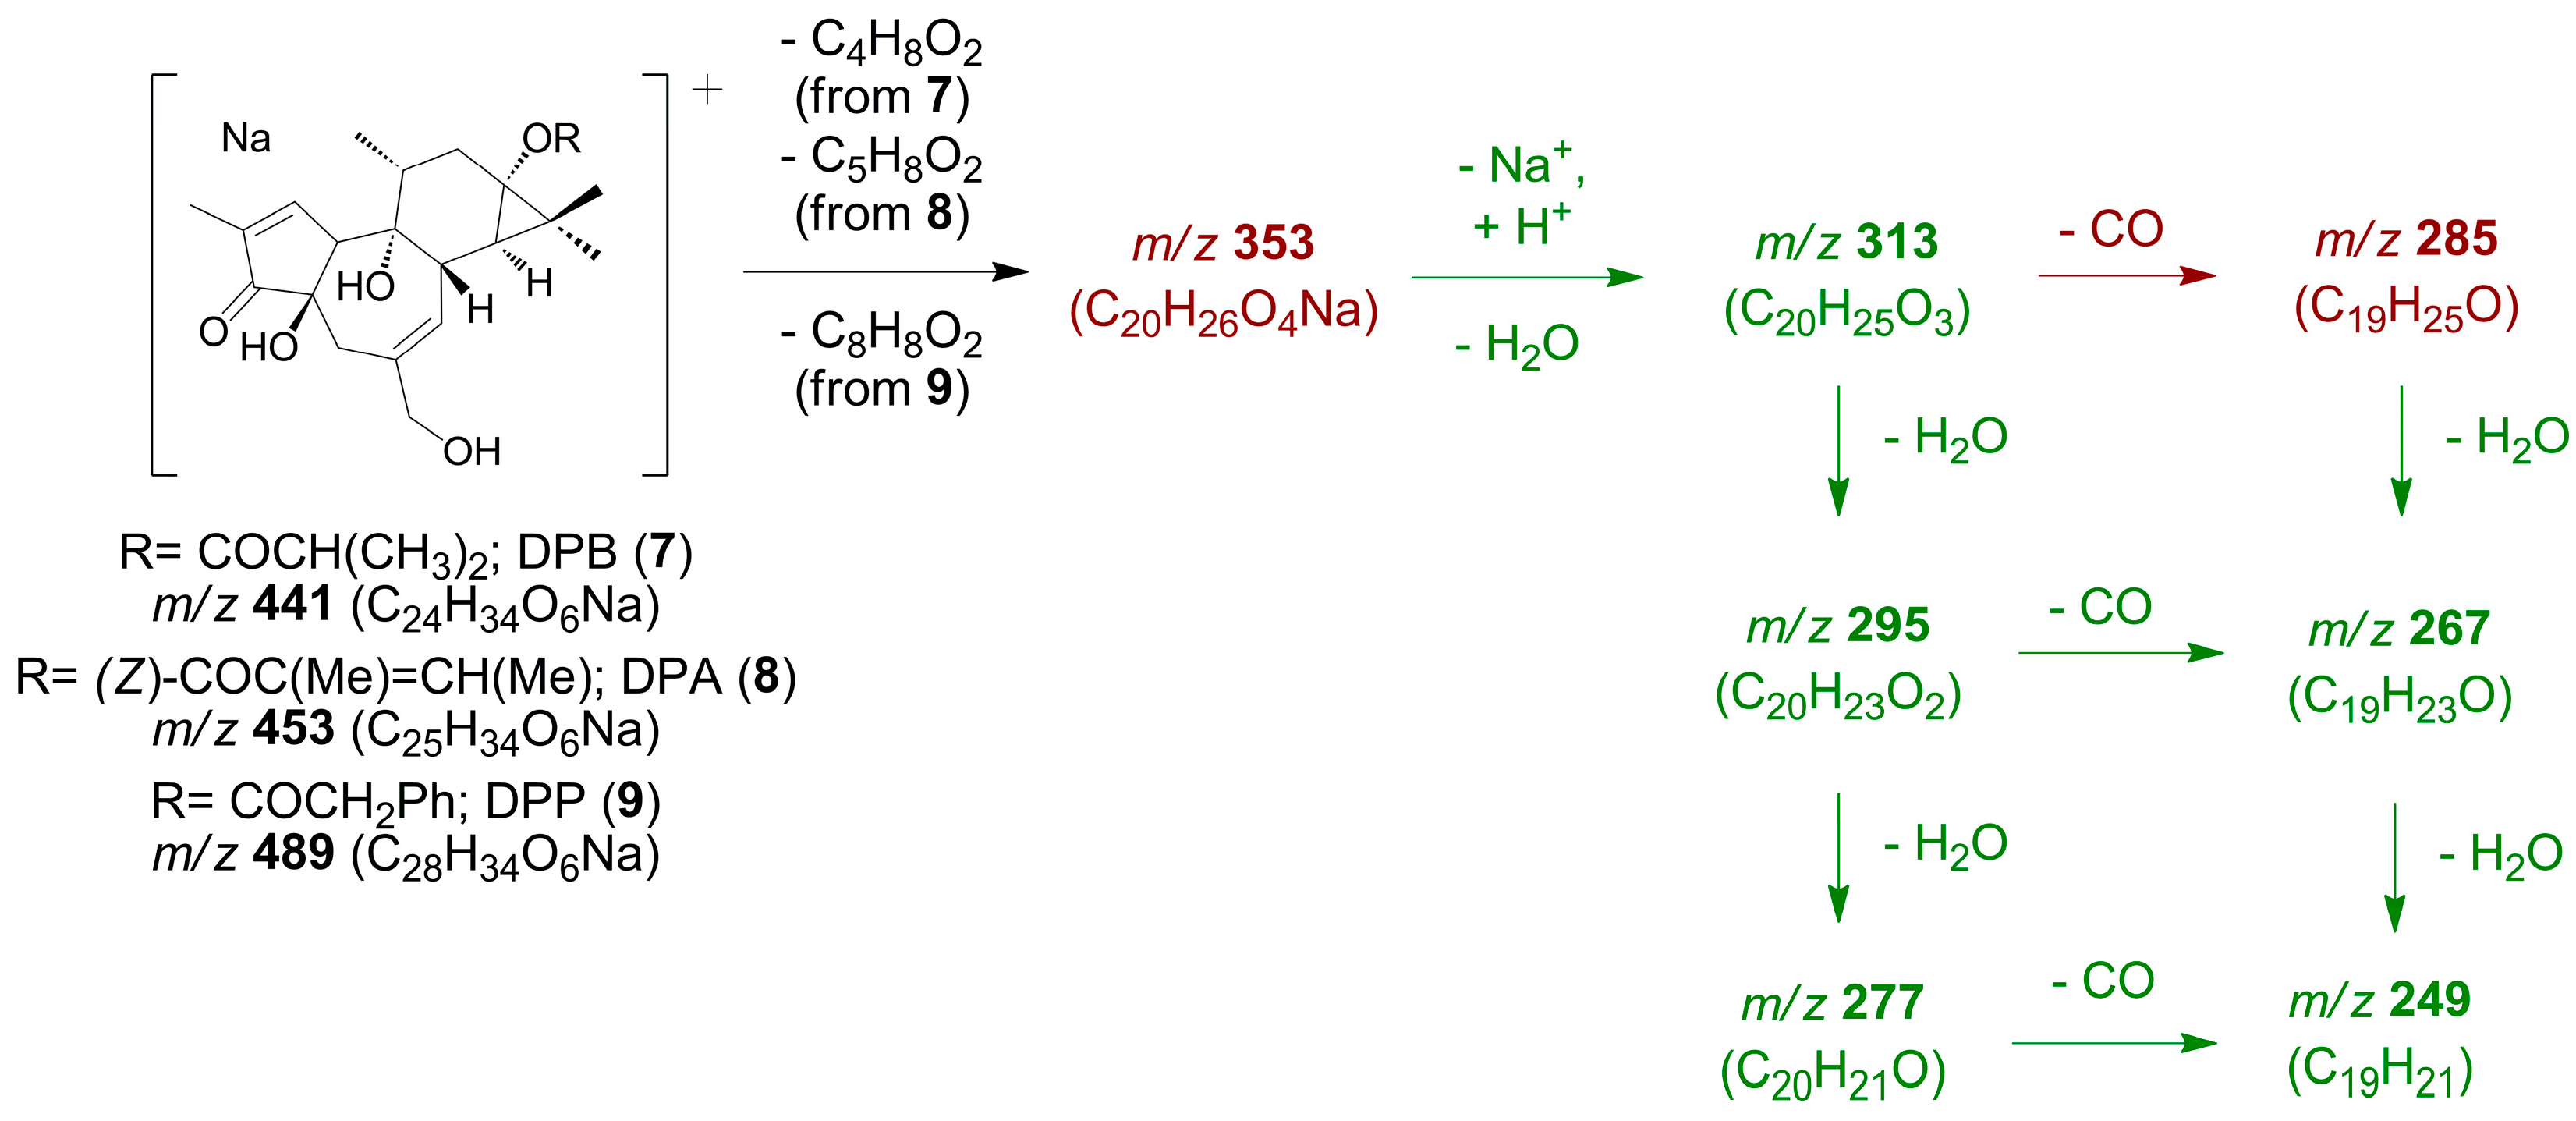
- 12-Deoxyphorbol 13-acyl derivatives (7–9) (Scheme 3).
- D.
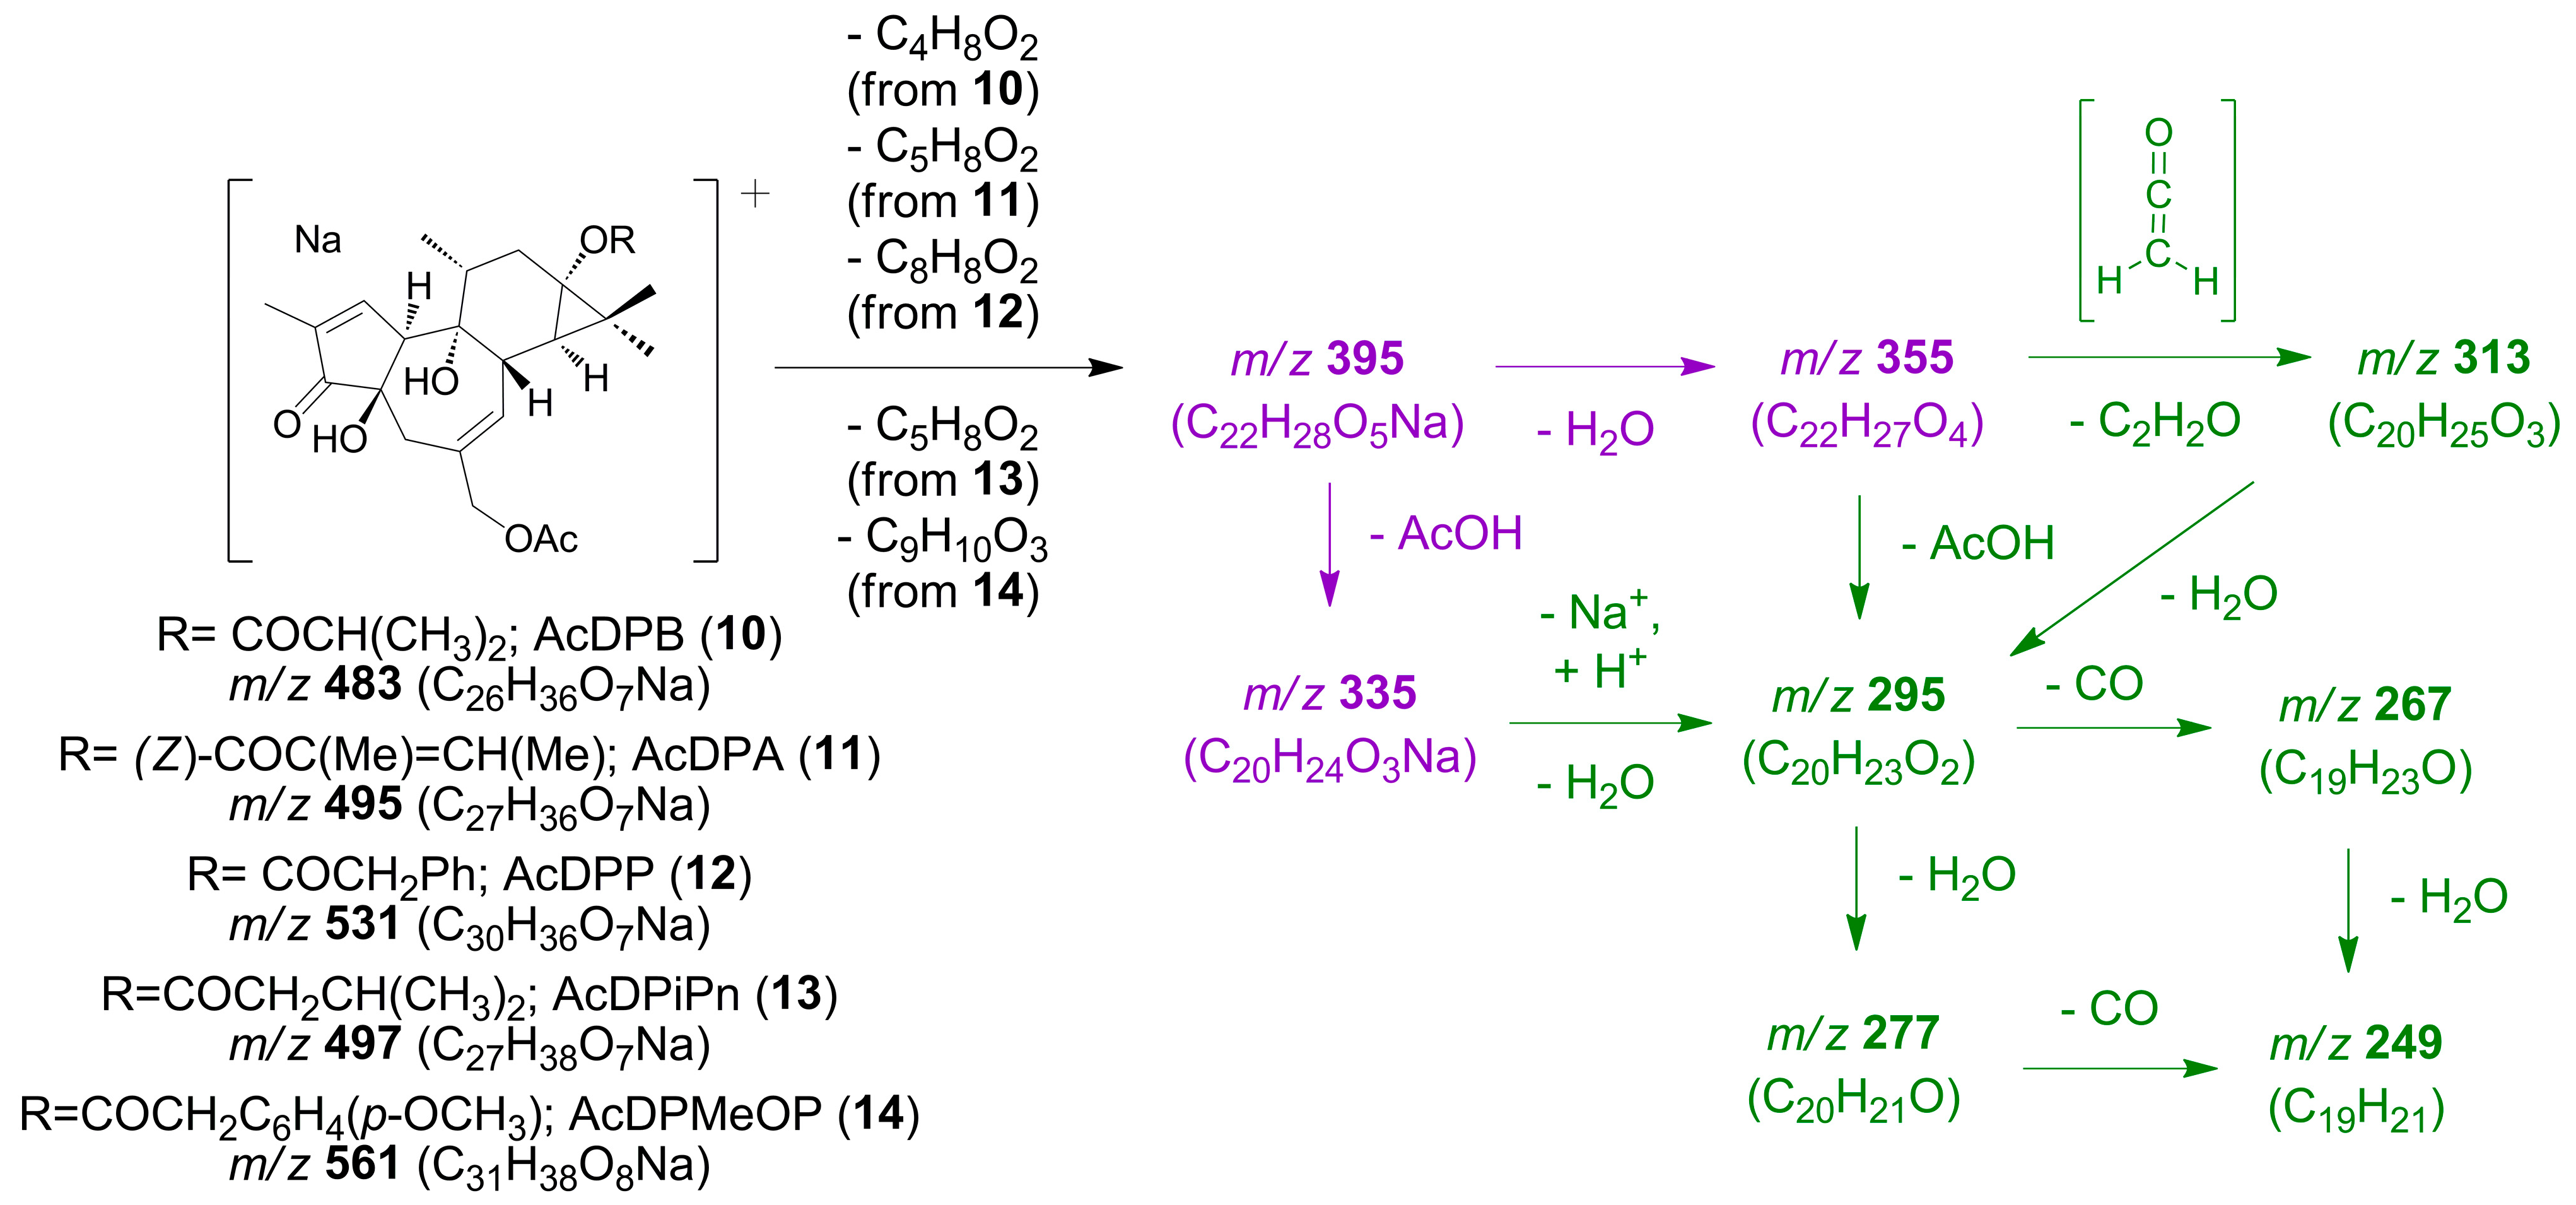
- 12-Deoxyphorbol 20-acetate 13-acyl derivatives (10–14) (Scheme 4).
- E.
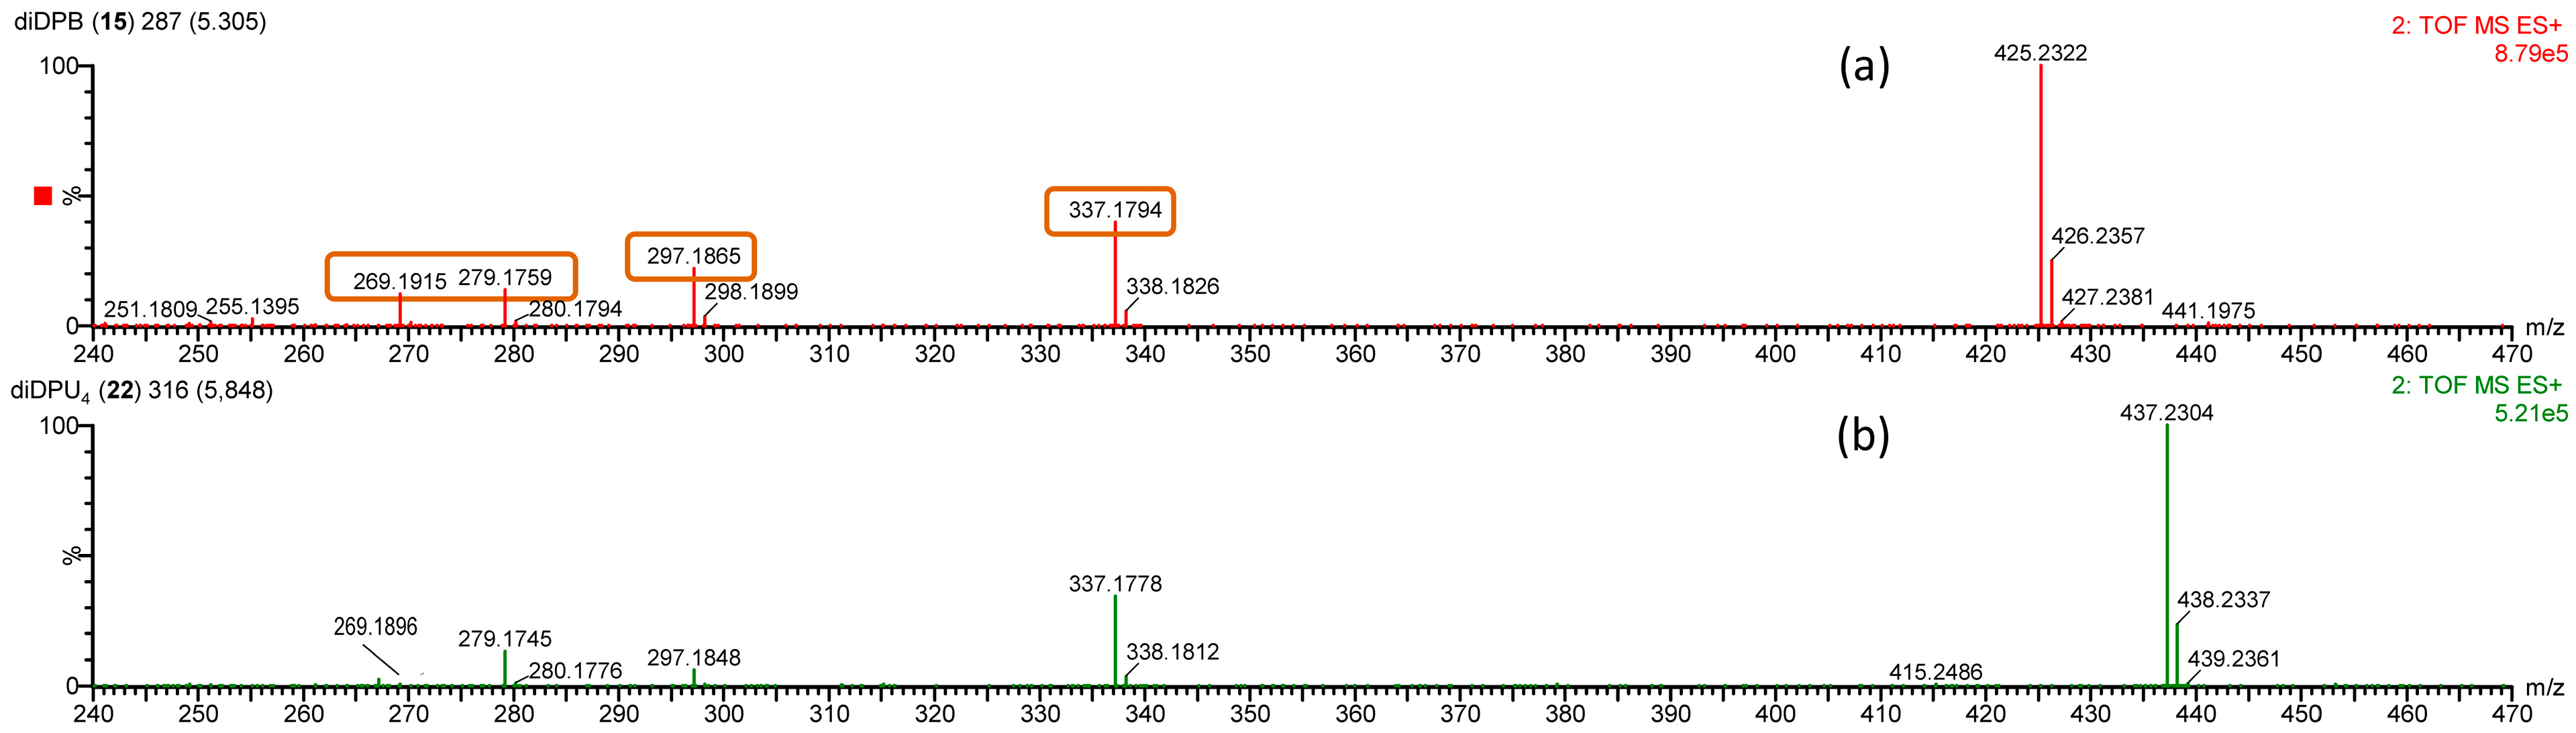
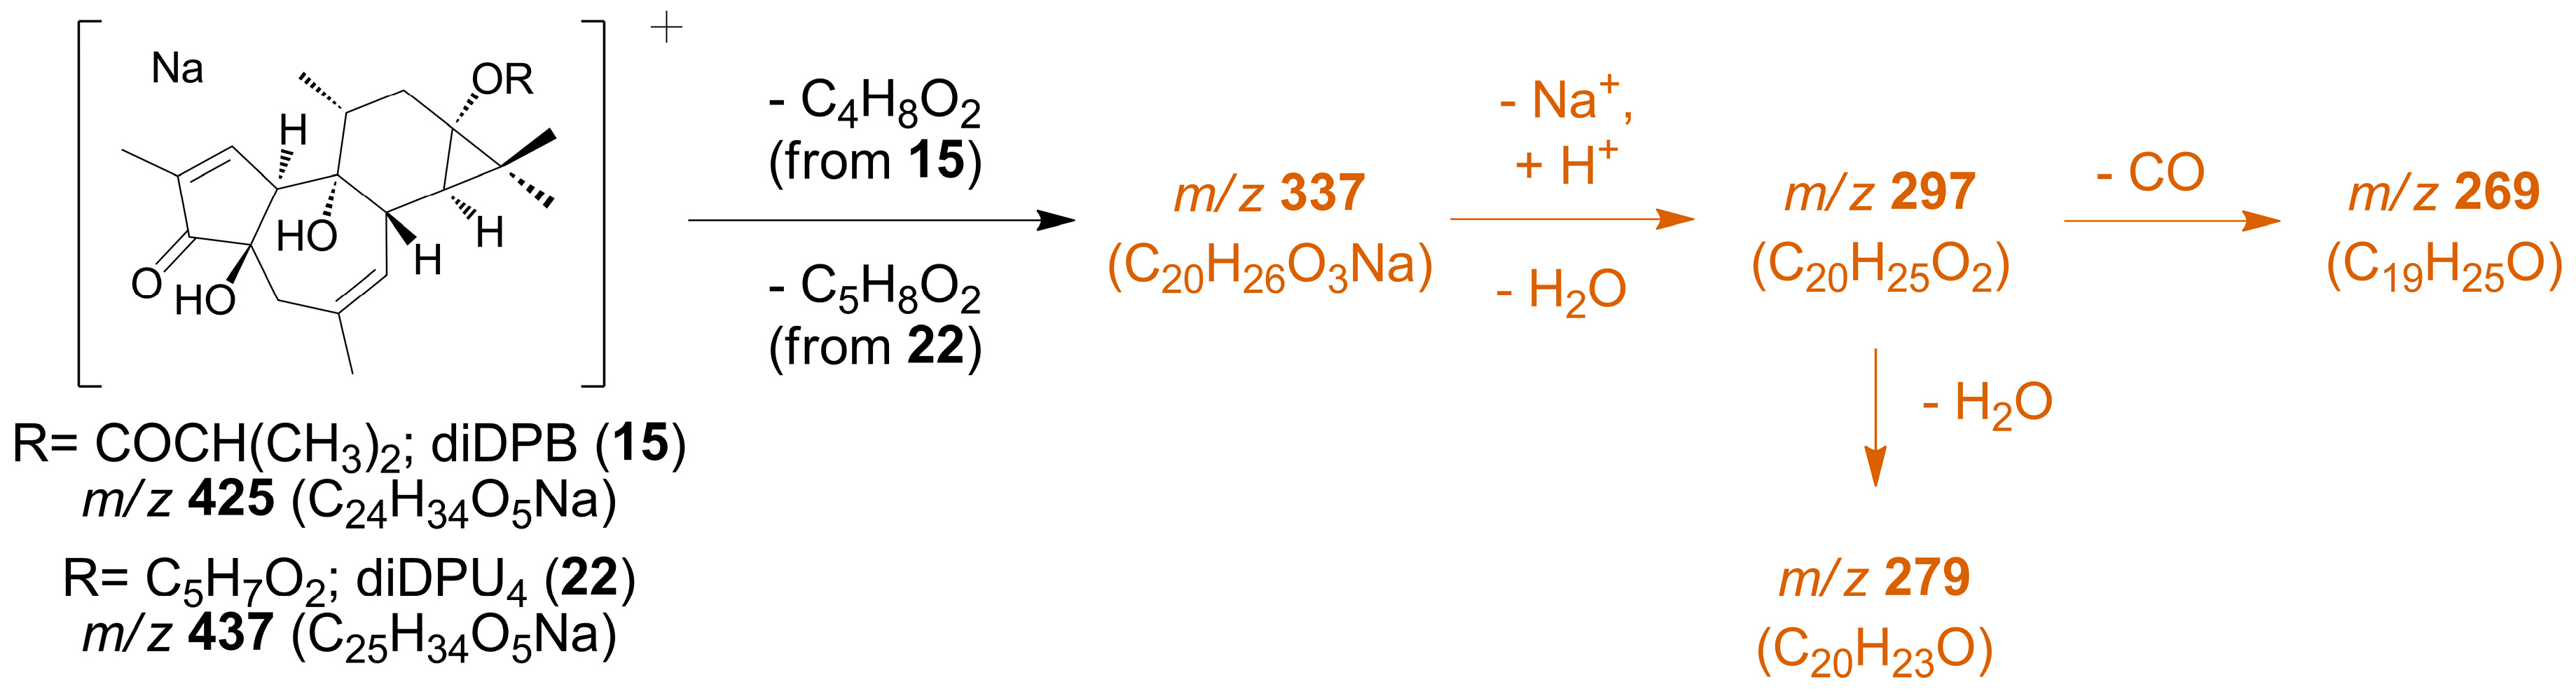
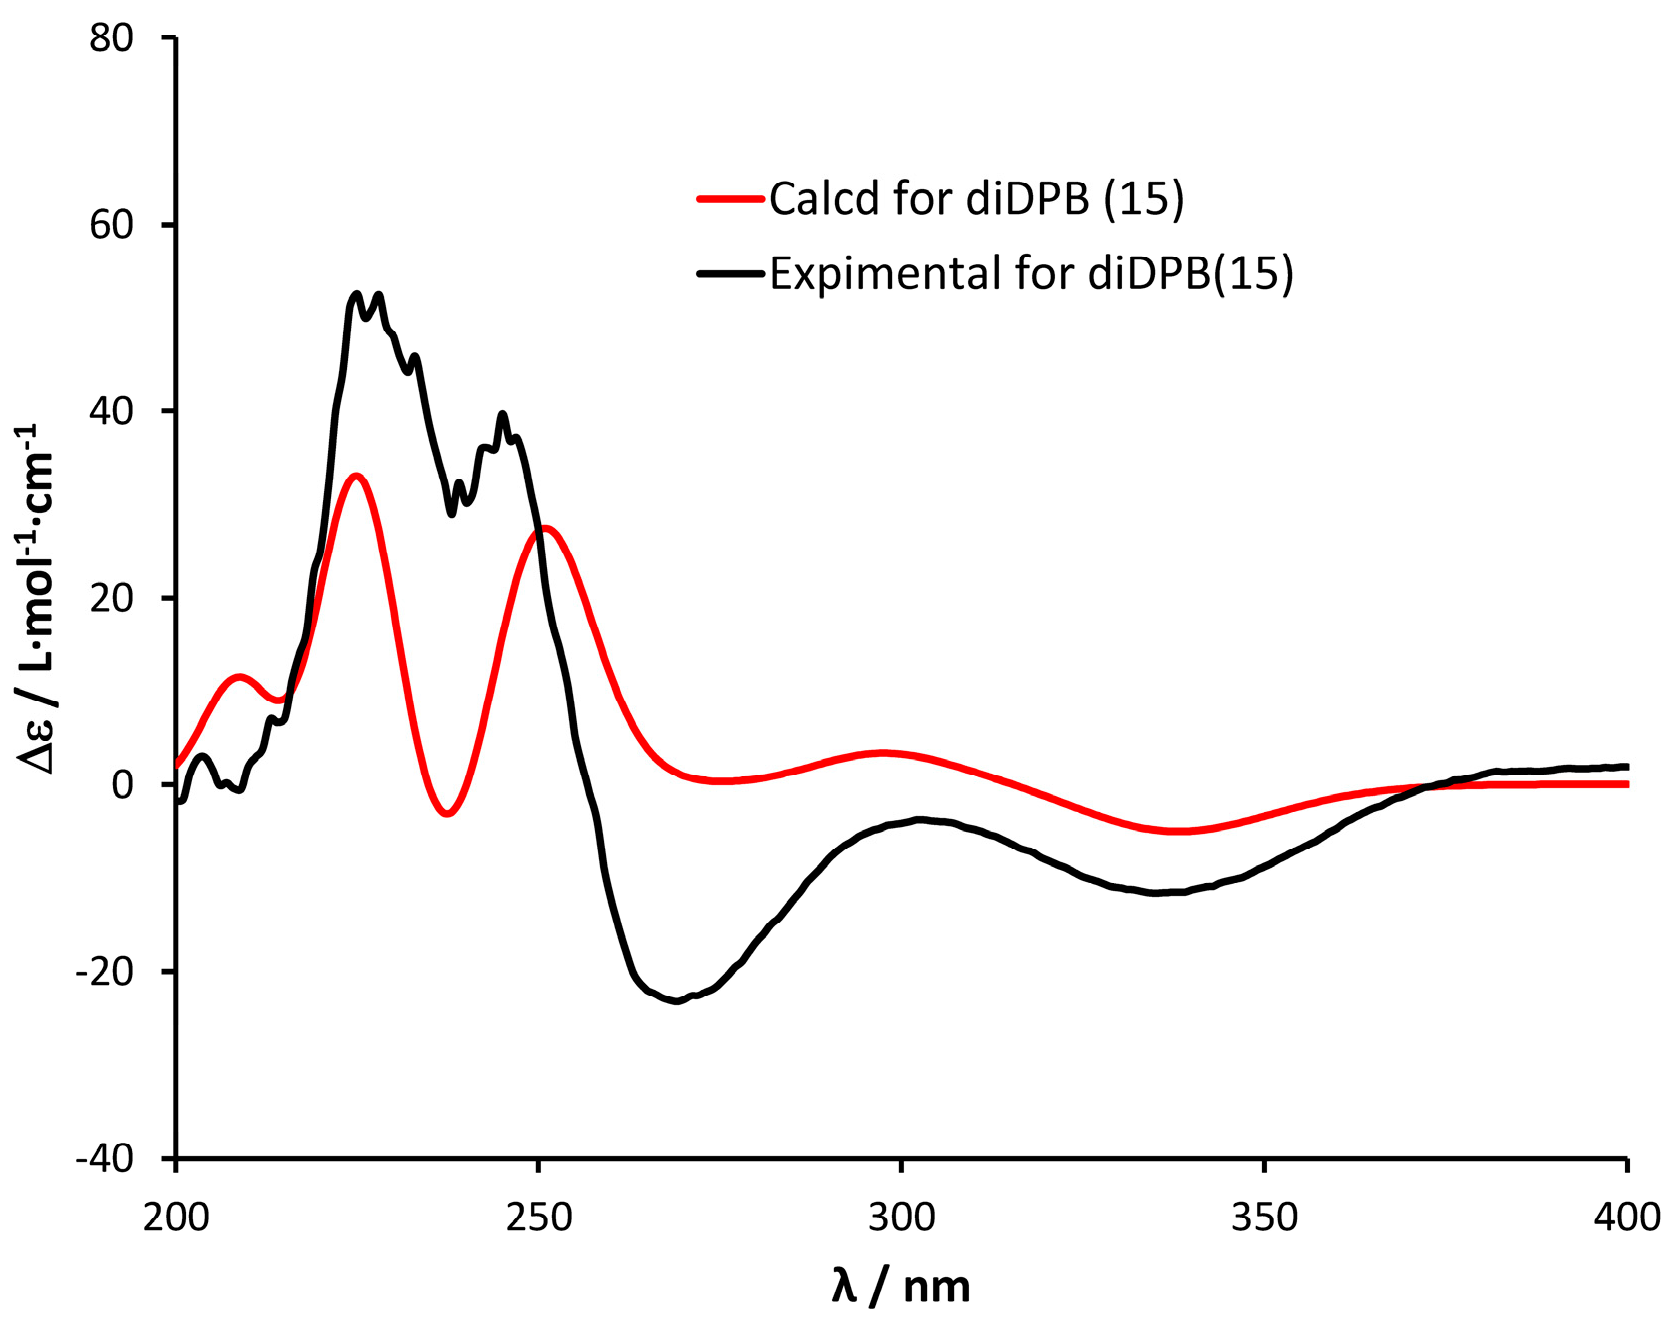
- 12,20-Dideoxyphorbol 13-acyl derivatives (15) (Scheme 5).
3. Materials and Methods
3.1. General Experimental Procedures
3.2. UHPLC-HRMSE Analysis Conditions
3.3. Plant Material
3.4. Extraction and Isolation
3.5. UHPLC-HRMSE Identification of 12-Deoxyphorbol Esters from E. resinifera
4. Conclusions
Supplementary Materials
Author Contributions
Funding
Data Availability Statement
Acknowledgments
Conflicts of Interest
References
- Ernst, M.; Grace, O.M.; Saslis-Lagoudakis, C.H.; Nilsson, N.; Simonsen, H.T.; Rønsted, N. Global medicinal uses of Euphorbia L. (Euphorbiaceae). J. Ethnopharmacol. 2015, 176, 90–101. [Google Scholar] [CrossRef] [PubMed]
- Vasas, A.; Hohmann, J. Euphorbia Diterpenes: Isolation, Structure, Biological Activity, and Synthesis (2008–2012). Chem. Rev. 2014, 114, 8579–8612. [Google Scholar] [CrossRef] [PubMed]
- Shi, Q.-W.; Su, X.-H.; Kiyota, H. Chemical and Pharmacological Research of the Plants in Genus Euphorbia. Chem. Rev. 2008, 108, 4295–4327. [Google Scholar] [CrossRef] [PubMed]
- Su, J.-C.; Cheng, W.; Song, J.-G.; Zhong, Y.-L.; Huang, X.-J.; Jiang, R.-W.; Li, Y.-L.; Li, M.-M.; Ye, W.-C.; Wang, Y. Macrocyclic Diterpenoids from Euphorbia helioscopia and Their Potential Anti-inflammatory Activity. J. Nat. Prod. 2019, 82, 2818–2827. [Google Scholar] [CrossRef]
- Esposito, M.; Nim, S.; Nothias, L.-F.; Gallard, J.-F.; Rawal, M.K.; Costa, J.; Roussi, F.; Prasad, R.; Di Pietro, A.; Paolini, J.; et al. Evaluation of Jatrophane Esters from Euphorbia spp. as Modulators of Candida albicans Multidrug Transporters. J. Nat. Prod. 2017, 80, 479–487. [Google Scholar] [CrossRef] [PubMed]
- Reis, M.A.; Ahmed, O.B.; Spengler, G.; Molnar, J.; Lage, H.; Ferreira, M.-J.U. Exploring Jolkinol D Derivatives to Overcome Multidrug Resistance in Cancer. J. Nat. Prod. 2017, 80, 1411–1420. [Google Scholar] [CrossRef]
- Jadranin, M.; Pešić, M.; Aljančić, I.S.; Milosavljević, S.M.; Todorović, N.M.; Podolski-Renić, A.; Banković, J.; Tanić, N.; Marković, I.; Vajs, V.E.; et al. Jatrophane diterpenoids from the latex of Euphorbia dendroides and their anti-P-glycoprotein activity in human multi-drug resistant cancer cell lines. Phytochemistry 2013, 86, 208–217. [Google Scholar] [CrossRef]
- Ezzanad, A.; Gómez-Oliva, R.; Escobar-Montaño, F.; Díez-Salguero, M.; Geribaldi-Doldan, N.; Dominguez-Garcia, S.; Botubol-Ares, J.M.; de los Reyes, C.; Durán-Patrón, R.; Nunez-Abades, P.; et al. Phorbol Diesters and 12-Deoxy-16-hydroxyphorbol 13,16-Diesters Induce TGFα Release and Adult Mouse Neurogenesis. J. Med. Chem. 2021, 64, 6070–6084. [Google Scholar] [CrossRef]
- Domínguez-García, S.; Geribaldi-Doldán, N.; Gómez-Oliva, R.; Ruiz, F.A.; Carrascal, L.; Bolívar, J.; Verástegui, C.; Garcia-Alloza, M.; Macías-Sánchez, A.J.; Hernández-Galán, R.; et al. A novel PKC activating molecule promotes neuroblast differentiation and delivery of newborn neurons in brain injuries. Cell Death Dis. 2020, 11, 262. [Google Scholar] [CrossRef]
- Murillo-Carretero, M.; Geribaldi-Doldán, N.; Flores-Giubi, E.; García-Bernal, F.; Navarro-Quiroz, E.A.; Carrasco, M.; Macías-Sánchez, A.J.; Herrero-Foncubierta, P.; Delgado-Ariza, A.; Verástegui, C.; et al. ELAC (3,12-di-O-acetyl-8-O-tigloilingol), a plant-derived lathyrane diterpene, induces subventricular zone neural progenitor cell proliferation through PKCβ activation. Br. J. Pharmacol. 2017, 174, 2373–2392. [Google Scholar] [CrossRef]
- Geribaldi-Doldán, N.; Flores-Giubi, E.; Murillo-Carretero, M.; García-Bernal, F.; Carrasco, M.; Macías-Sánchez, A.J.; Domínguez-Riscart, J.; Verástegui, C.; Hernández-Galán, R.; Castro, C. 12-deoxyphorbols promote adult neurogenesis by inducing neural progenitor cell proliferation via PKC activation. Int. J. Neuropsychopharmacol. 2016, 19, pyv085. [Google Scholar] [CrossRef]
- Zhao, N.-D.; Ding, X.; Song, Y.; Yang, D.-Q.; Yu, H.-L.; Adelakun, T.A.; Qian, W.-D.; Zhang, Y.; Di, Y.-T.; Gao, F.; et al. Identification of ingol and rhamnofolane diterpenoids from Euphorbia resinifera and their abilities to induce lysosomal biogenesis. J. Nat. Prod. 2018, 81, 1209–1218. [Google Scholar] [CrossRef] [PubMed]
- Fattorusso, E.; Lanzotti, V.; Taglialatela-Scafati, O.; Tron, G.C.; Appendino, G. Bisnorsesquiterpenoids from Euphorbia resinifera Berg. and an expeditious procedure to obtain resiniferatoxin from its fresh latex. Eur. J. Org. Chem. 2002, 71–78. [Google Scholar] [CrossRef]
- Chipeaux, C.; de Person, M.; Burguet, N.; Billette de Villemeur, T.; Rose, C.; Belmatoug, N.; Héron, S.; Le Van Kim, C.; Franco, M.; Moussa, F. Optimization of ultra-high pressure liquid chromatography—Tandem mass spectrometry determination in plasma and red blood cells of four sphingolipids and their evaluation as biomarker candidates of Gaucher’s disease. J. Chromatogr. A 2017, 1525, 116–125. [Google Scholar] [CrossRef] [PubMed]
- de Souza Figueiredo, F.; Celano, R.; de Sousa Silva, D.; das Neves Costa, F.; Hewitson, P.; Ignatova, S.; Piccinelli, A.L.; Rastrelli, L.; Guimarães Leitão, S.; Guimarães Leitão, G. Countercurrent chromatography separation of saponins by skeleton type from Ampelozizyphus amazonicus for off-line ultra-high-performance liquid chromatography/high resolution accurate mass spectrometry analysis and characterisation. J. Chromatogr. A 2017, 1481, 92–100. [Google Scholar] [CrossRef]
- Qi, H.; Feng, F.; Zhai, J.; Chen, F.; Liu, T.; Zhang, F.; Zhang, F. Development of an analytical method for twelve dioscorea saponins using liquid chromatography coupled to Q-Exactive high resolution mass spectrometry. Talanta 2019, 191, 11–20. [Google Scholar] [CrossRef] [PubMed]
- Vaclavik, L.; Krynitsky, A.J.; Rader, J.I. Targeted analysis of multiple pharmaceuticals, plant toxins and other secondary metabolites in herbal dietary supplements by ultra-high performance liquid chromatography–quadrupole-orbital ion trap mass spectrometry. Anal. Chim. Acta 2014, 810, 45–60. [Google Scholar] [CrossRef]
- Zhang, J.-Y.; Zhang, Q.; Li, N.; Wang, Z.-J.; Lu, J.-Q.; Qiao, Y.-J. Diagnostic fragment-ion-based and extension strategy coupled to DFIs intensity analysis for identification of chlorogenic acids isomers in Flos Lonicerae Japonicae by HPLC-ESI-MSn. Talanta 2013, 104, 1–9. [Google Scholar] [CrossRef]
- Nothias-Scaglia, L.-F.; Schmitz-Afonso, I.; Renucci, F.; Roussi, F.; Touboul, D.; Costa, J.; Litaudon, M.; Paolini, J. Insights on profiling of phorbol, deoxyphorbol, ingenol and jatrophane diterpene esters by high performance liquid chromatography coupled to multiple stage mass spectrometry. J. Chromatogr. A 2015, 1422, 128–139. [Google Scholar] [CrossRef]
- Tang, Q.; Su, Z.; Han, Z.; Ma, X.; Xu, D.; Liang, Y.; Cao, H.; Wang, X.; Qu, X.; Hoffman, A.; et al. LC–MS method for detecting prostratin in plant extracts and identification of a high-yielding population of Euphorbia fischeriana. Phytochem. Lett. 2012, 5, 214–218. [Google Scholar] [CrossRef]
- Zhang, L.; Shu, X.; Ding, A.; Yu, L.; Tang, Y.; Duan, J.; Shang, E.; Shen, X. LC–DAD–ESI-MS–MS Separation and Chemical Characterization of the Inflammatory Fraction of the Roots of Euphorbia kansui. Chromatographia 2009, 70, 805–810. [Google Scholar] [CrossRef]
- Bicchi, C.; Appendino, G.; Cordero, C.; Rubiolo, P.; Ortelli, D.; Veuthey, J.-L. HPLC-UV and HPLC-positive-ESI-MS analysis of the diterpenoid fraction from caper spurge (Euphorbia lathyris) seed oil. Phytochem. Anal. 2001, 12, 255–262. [Google Scholar] [CrossRef] [PubMed]
- Zhao, H.-D.; Lu, Y.; Yan, M.; Chen, C.-H.; Morris-Natschke, S.L.; Lee, K.-H.; Chen, D.-F. Rapid Recognition and Targeted Isolation of Anti-HIV Daphnane Diterpenes from Daphne genkwa Guided by UPLC-MSn. J. Nat. Prod. 2020, 83, 134–141. [Google Scholar] [CrossRef]
- Chow, S.; Fletcher, M.T.; Mckenzie, R.A. Analysis of Daphnane Orthoesters in Poisonous Australian Pimelea Species by Liquid Chromatography−Tandem Mass Spectrometry. J. Agric. Food Chem. 2010, 58, 7482–7487. [Google Scholar] [CrossRef] [PubMed]
- Zhang, S.; Zhang, F.; Li, X.; Dong, W.; Wen, L.; Wang, S. Evaluation of Daphne genkwa diterpenes: Fingerprint and quantitative analysis by high performance liquid chromatography. Phytochem. Anal. 2007, 18, 91–97. [Google Scholar] [CrossRef] [PubMed]
- Plumb, R.S.; Johnson, K.A.; Rainville, P.; Smith, B.W.; Wilson, I.D.; Castro-Perez, J.M.; Nicholson, J.K. UPLC/MSE; a new approach for generating molecular fragment information for biomarker structure elucidation. Rapid Commun. Mass Spectrom. 2006, 20, 1989–1994. [Google Scholar] [CrossRef]
- Hergenhahn, M.; Kusumoto, S.; Hecker, E. On the active principles of the spurge family (Euphorbiaceae). V. Extremely skin-irritant and moderately tumor-promoting diterpene esters from Euphorbia resinifera Berg. J. Cancer Res. Clin. Oncol. 1984, 108, 98–109. [Google Scholar] [CrossRef]
- Li, X.-C.; Ferreira, D.; Ding, Y. Determination of Absolute Configuration of Natural Products: Theoretical Calculation of Electronic Circular Dichroism as a Tool. Curr. Org. Chem. 2010, 14, 1678–1697. [Google Scholar] [CrossRef]
- Lu, Y.; Huang, Y.-S.; Chen, C.-H.; Akiyama, T.; Morris-Natschke, S.L.; Cheng, Y.-Y.; Chen, I.-S.; Yang, S.-Z.; Chen, D.-F.; Lee, K.-H. Anti-HIV tigliane diterpenoids from Reutealis trisperma. Phytochemistry 2020, 174, 112360. [Google Scholar] [CrossRef]
- Hergenhahn, M.; Fuerstenberger, G.; Opferkuch, H.J.; Adolf, W.; Mack, H.; Hecker, E. Biological assays for irritant tumor-initiating and -promoting activities. I. Kinetics of the irritant response in relation to the initiation-promoting activity of polyfunctional diterpenes representing tigliane and some daphnane types. J. Cancer Res. Clin. Oncol. 1982, 104, 31–39. [Google Scholar] [CrossRef]
- Sosath, S.; Ott, H.H.; Hecker, E. Irritant principles of the spurge family (Euphorbiaceae). XIII. Oligocyclic and macrocyclic diterpene esters from latexes of some Euphorbia species utilized as source plants of honey. J. Nat. Prod. 1988, 51, 1062–1074. [Google Scholar] [CrossRef]
- Tsai, J.-Y.; Redei, D.; Forgo, P.; Li, Y.; Vasas, A.; Hohmann, J.; Wu, C.-C. Isolation of Phorbol Esters from Euphorbia grandicornis and Evaluation of Protein Kinase C- and Human Platelet-Activating Effects of Euphorbiaceae Diterpenes. J. Nat. Prod. 2016, 79, 2658–2666. [Google Scholar] [CrossRef] [PubMed]
- Fatope, M.O.; Zeng, L.; Ohayaga, J.E.; Shi, G.; McLaughlin, J.L. Selectively Cytotoxic Diterpenes from Euphorbia poisonii. J. Med. Chem. 1996, 39, 1005–1008. [Google Scholar] [CrossRef] [PubMed]
- Evans, F.J.; Schmidt, R.J. Two new toxins from the latex of Euphorbia poisonii. Phytochemistry 1976, 15, 333–335. [Google Scholar] [CrossRef]
- Hergenhahn, M.; Adolf, W.; Hecker, E. Resiniferatoxin and other esters of novel polyfunctional diterpenes from Euphorbia resinifera and unispina. Tetrahedron Lett. 1975, 16, 1595–1598. [Google Scholar] [CrossRef]
- Kulyal, P.; Tiwari, U.K.; Shukla, A.; Gaur, A.K. Chemical constituents isolated from seed oil of Jatropha curcas. Asian J. Chem. 2011, 23, 2939–2942. [Google Scholar]
- Snatzke, G.; Hruban, L.; Snatzke, F.; Schmidt, R.; Hecker, E. Chiroptical Properties of Phorbol-12, 13, 20-triacetate and Some Other Phorbol Derivatives. Isr. J. Chem. 1976, 15, 46–56. [Google Scholar] [CrossRef]
- Otsuki, K.; Li, W. Tigliane and daphnane diterpenoids from Thymelaeaceae family: Chemistry, biological activity, and potential in drug discovery. J. Nat. Med. 2023, 77, 625–643. [Google Scholar] [CrossRef]
- Adolf, W.; Sorg, B.; Hergenhahn, M.; Hecker, E. Structure-activity relations of polyfunctional diterpenes of the daphnane type. I. Revised structure for resiniferatoxin and structure-activity relations of resiniferonol and some of its esters. J. Nat. Prod. 1982, 45, 347–354. [Google Scholar] [CrossRef]
- Ibáñez, M.; Sancho, J.V.; Bijlsma, L.; van Nuijs, A.L.N.; Covaci, A.; Hernández, F. Comprehensive analytical strategies based on high-resolution time-of-flight mass spectrometry to identify new psychoactive substances. TrAC Trends Anal. Chem. 2014, 57, 107–117. [Google Scholar] [CrossRef]
- Pasin, D.; Cawley, A.; Bidny, S.; Fu, S. Current applications of high-resolution mass spectrometry for the analysis of new psychoactive substances: A critical review. Anal. Bioanal. Chem. 2017, 409, 5821–5836. [Google Scholar] [CrossRef]
- Schymanski, E.L.; Jeon, J.; Gulde, R.; Fenner, K.; Ruff, M.; Singer, H.P.; Hollender, J. Identifying Small Molecules via High Resolution Mass Spectrometry: Communicating Confidence. Environ. Sci. Technol. 2014, 48, 2097–2098. [Google Scholar] [CrossRef] [PubMed]
- Schmidt, R.J.; Evans, F.J. Candletoxins A and B, 2 new aromatic esters of 12-deoxy-16-hydroxy-phorbol, from the irritant latex of Euphorbia poisonii Pax. Experientia 1977, 33, 1197–1198. [Google Scholar] [CrossRef] [PubMed]
- Hill, A.W.; Mortishire-Smith, R.J. Automated assignment of high-resolution collisionally activated dissociation mass spectra using a systematic bond disconnection approach. Rapid Commun. Mass Spectrom. 2005, 19, 3111–3118. [Google Scholar] [CrossRef]


| Compound | Observed m/z (%) | Calculated m/z | Δm (mDa) | Elemental Composition | Annotation |
|---|---|---|---|---|---|
| DPPBz (3) | 609.2463 (80) | 609.2464 | −0.1 | C35H38O8Na | [M + Na]+ |
| 487.2098 (25) | 487.2097 | +0.1 | C28H32O6Na | [M − C7H6O2 + Na]+ | |
| 473.1934 (9) | 473.1940 | −0.6 | C27H30O6Na | [M − C8H8O2 + Na]+ | |
| 369.1685 (7) | 369.1678 | +0.7 | C20H26O5Na | [M − C8H8O2 − C7H6O2 + Na]+ | |
| 351.1574 (24) | 351.1572 | +0.2 | C20H24O4Na | [M − C7H6O2 − C8H8O − H2O + Na]+ | |
| 323.1629 (2) | 323.1623 | +0.6 | C19H24O3Na | [M − C7H6O2 − C8H8O − H2O − CO + Na]+ | |
| 311.1641 (10) | 311.1647 | −0.6 | C20H23O3 | [M − C7H6O2 − C8H8O − 2H2O + H]+ | |
| 293.1541 (100) | 293.1542 | −0.1 | C20H21O2 | [M − C7H6O2 − C8H8O − 3H2O + H]+ | |
| 275.1431 (16) | 275.1436 | −0.5 | C20H19O | [M − C7H6O2 − C8H8O − 4H2O + H]+ | |
| 265.1591 (16) | 265.1592 | −0.1 | C19H21O | [M − C7H6O2 − C8H8O − 3H2O − CO + H]+ | |
| 247.1486 (14) | 247.1487 | −0.1 | C19H19 | [M − C7H6O2 − C8H8O − 4H2O − CO + H]+ | |
| DPPU1 (19) | 589.2787 (42) | 589.2777 | +1.0 | C33H42O8Na | [M + Na]+ |
| 487.2090 (13) | 487.2097 | −0.7 | C28H32O6Na | [M − C5H10O2 + Na]+ | |
| 453.2275 (68) | 453.2253 | +2.2 | C25H34O6Na | [M − C8H8O2 + Na]+ | |
| 369.1754 (2) | 369.1678 | +7.6 | C20H26O5Na | [M − C8H8O2 − C5H8O + Na]+ | |
| 351.1588 (62) | 351.1572 | +1.6 | C20H24O4Na | [M − C8H8O2 − C5H8O − H2O + Na]+ | |
| 323.1625 (2) | 323.1623 | +0.2 | C19H24O3Na | [M − C8H8O2 − C5H8O − H2O − CO + Na]+ | |
| 311.1661 (5) | 311.1647 | +1.4 | C20H23O3 | [M − C8H8O2 − C5H8O − 2H2O + H]+ | |
| 293.1554 (100) | 293.1542 | +1.2 | C20H21O2 | [M − C8H8O2 − C5H8O − 3H2O + H]+ | |
| 275.1462 (6) | 275.1436 | +2.6 | C20H19O | [M − C8H8O2 − C5H8O − 4H2O + H]+ | |
| 265.1591 (10) | 265.1592 | −0.1 | C19H21O | [M − C8H8O2 − C5H8O − 3H2O − CO + H]+ | |
| 247.1477 (5) | 247.1487 | −1.0 | C19H19 | [M − C8H8O2 − C5H8O − 4H2O − CO + H]+ |
| Pos. | 3 * | 4 * | 5 * | 6 * |
|---|---|---|---|---|
| δH (J in Hz) | δH (J in Hz) | δH (J in Hz) | δH (J in Hz) | |
| 1 | 7.54 m | 7.52 m | 7.53 m | 7.54 m |
| 5 | 2.52 d (19.1) | 2.53 c | 2.54 d (19.0) | 2.55 d (19.1) |
| 2.43 d (19.1) | 2.34 d (18.9) | 2.34 d (19.0) | 2.35 d (19.1) | |
| 7 | 5.60 brd (5.6) | 5.65 dd (5.8, 2.3) | 5.66 dd (5.6, 2.2) | 5.69 brd (5.5) |
| 8β | 3.13 t (5.6) | 3.10 d | 3.11 f | 3.14 h |
| 10α | 3.17 t (2.6) | 3.12 d | 3.13 f | 3.16 h |
| 11β | 2.05 m | 2.02 e | 2.02 g | 2.05 m |
| 12 | 2.21 dd (14.9, 7.0) | 2.12 dd (14.8, 7.1) | 2.15 dd (14.8, 7.0) | 2.20 dd (15.0, 7.0) |
| 1.60 dd (14.9, 11.1) | 1.56 dd (14.8, 10.9) | 1.57 dd (14.8, 10.9) | 1.60 dd (15.0, 11.0) | |
| 14α | 1.24 d (5.6) | 1.17 d (5.8) | 1.18 d (5.7) | 1.27 d (5.6) |
| 16α | 4.35 d (11.4) | 4.08 d (11.3) | 4.14 d (11.4) | 4.35 d (11.4) |
| 4.00 d (11.4) | 3.86 d (11.3) | 3.86 d (11.4) | 4.03 d (11.4) | |
| 17β | 1.22 s | 1.13 s | 1.14 s | 1.22 s |
| 18 | 0.90 d (7.0) | 0.88 d (6.5) | 0.88 d (6.5) | 0.90 d (6.6) |
| 19 | 1.74 dd (2.8, 1.4) | 1.75 dd (2.4, 1.4) | 1.74 dd (2.9, 1.4) | 1.74 dd (2.9, 1.4) |
| 20 | 3.94 d (13.4) 3.90 d (13.4) | 4.46 s | 4.47 s | 4.47 s |
| COCH3 | 2.01 s e | 2.01 s g | 2.01 s | |
| 2′ | 3.61 s | 3.63 s | 3.62 s | 3.62 s |
| 4′–8′ | 7.19–7.14 5H | 7.33–7.20 5H | 7.32–7.19 5H | 7.19–7.12 5H |
| 2″ | 2.53 c | - | - | |
| 3″ | 8.00 a | 1.15 d (7.0) ** | 6.84 m | 8.00 i |
| 4″ | 7.48 b | 1.14, d (7.0) ** | 1.81 s | 7.49 j |
| 5″ | 7.62 tt (7.4, 1.3) | - | 1.80 d (6.8) | 7.62 tt (7.4, 1.3) |
| 6″ | 7.48 b | - | - | 7.49 j |
| 7″ | 8.00 a | - | - | 8.00 i |
| Position | 3 * | 4 * | 5 * | 6 * | 13 ** | 14 * | 15 ** |
|---|---|---|---|---|---|---|---|
| δC | δC | δC | δC | δC | δC | δC | |
| 1 | 160.9 | 160.6 | 160.6 | 160.6 | 160.8 | 160.8 | 161.1 |
| 2 | 134.9 a | 134.96 b | 135.02 d | 135.0 | 134.9 | 134.9 | 134.8 |
| 3 | 210.6 | 210.2 | 210.2 | 210.2 | 210.3 | 210.3 | 210.8 |
| 4 | 74.8 | 74.5 | 74.5 | 74.5 | 74.6 | 74.6 | 74.9 |
| 5 | 38.6 | 39.0 | 39.0 | 39.1 | 39.1 | 39.0 | 42.9 |
| 6 | 142.5 | 137.5 | 137.5 | 137.5 | 137.2 | 137.1 | 138.0 |
| 7 | 129.7 † | 133.4 | 133.4 | 133.3 | 134.4 | 134.3 | 129.3 |
| 8 | 39.8 | 39.6 | 39.6 | 39.6 | 40.3 | 40.3 | 40.1 |
| 9 | 77.7 | 77.6 | 77.6 | 77.6 | 77.6 | 77.5 | 77.8 |
| 10 | 57.2 | 56.9 | 57.2 | 57.2 | 57.2 | 57.2 | 57.3 |
| 11 | 37.5 | 37.4 | 37.4 | 37.5 | 37.5 | 37.5 | 37.4 |
| 12 | 33.1 | 32.9 | 33.1 | 33.1 | 33.1 | 32.97 h | 33.1 |
| 13 | 65.2 | 65.1 | 65.1 | 65.2 | 65.0 | 65.4 | 65.0 |
| 14 | 31.6 | 31.5 | 31.4 | 31.4 | 33.1 | 33.0 h | 33.6 |
| 15 | 28.3 | 28.4 | 28.3 | 28.4 | 24.2 | 24.7 | 24.3 |
| 16 | 71.1 | 70.2 | 70.5 e | 71.0 | 23.5 | 23.3 i | 23.5 |
| 17 | 11.8 | 11.7 | 11.8 | 11.9 | 15.8 | 15.8 i | 15.9 |
| 18 | 18.9 | 18.9 | 18.9 | 18.9 | 19.0 | 19.0 | 19.07 |
| 19 | 10.2 | 10.2 | 10.2 | 10.2 | 10.2 | 10.2 | 10.2 |
| 20 | 68.3 | 70.5 | 70.6 e | 70.6 | 70.7 | 70.7 | 25.8 |
| COCH3 | - | 172.7 | 172.6 | 172.6 | 172.6 | 172.6 | - |
| COCH3 | - | 20.7 | 20.8 | 20.8 | 20.8 | 20.8 | - |
| 1′ | 175.2 | 175.2 | 175.1 | 175.1 | 176.9 | 175.7 | 180.6 |
| 2′ | 42.4 | 42.3 | 42.3 | 42.4 | 44.4 | 41.5 | 35.4 |
| 3′ | 135.0 a | 134.99 b | 134.94 d | 134.8 | 27.0 | 127.1 | 19.11 j |
| 4′ | 130.4 | 130.5 | 130.4 | 130.3 | 22.8 g | 131.4 § | 19.14 j |
| 5′ | 129.7 † | 129.7 | 129.6 | 129.6 ‡ | 22.7 g | 115.0 # | - |
| 6′ | 128.4 | 128.3 | 128.2 | 128.2 | - | 160.6 | - |
| 7′ | 129.7 † | 129.7 | 129.6 | 129.6 ‡ | - | 115.0 # | - |
| 8′ | 130.4 | 130.5 | 130.4 | 130.3 | - | 131.4 § | - |
| Ph-OCH3 | - | - | - | - | - | 55.7 | - |
| 1″ | 167.9 | 178.6 | 169.5 | 167.9 | - | - | - |
| 2″ | 131.7 | 35.2 | 129.7 | 131.6 | - | - | - |
| 3″ | 130.7 | 19.37 c | 138.7 | 130.6 | - | - | - |
| 4″ | 129.7 † | 19.42 c | 14.4 f | 129.6 ‡ | - | - | - |
| 5″ | 134.3 | - | 12.2 f | 134.2 | - | - | - |
| 6″ | 129.7 † | - | - | 129.6 ‡ | |||
| 7″ | 130.7 | 130.6 |
| Compound | Observed m/z (%) | Calculated m/z | Δm (mDa) | Elemental Composition | Annotation |
|---|---|---|---|---|---|
| AcDPPI (4) | 617.2755 (2) | 617.2727 | +2.8 | C34H42O9Na | [M + Na]+ |
| 529.2220 (18) | 529.2202 | +1.8 | C30H34O7Na | [M − C4H8O2 + Na]+ | |
| 481.2222 (37) | 481.2202 | +2.0 | C26H34O7Na | [M − C8H8O2 + Na]+ | |
| 421.2007 (100) | 421.1991 | +1.6 | C24H30O5Na | [M − C8H8O2 − C2H4O + Na]+ | |
| 411.1807 (11) | 411.1784 | +2.3 | C22H28O6Na | [M − C4H8O2 − C8H6O + Na]+ | |
| 393.1724 (18) | 393.1678 | +4.6 | C22H26O5Na | [M − C4H8O2 − C8H6O − H2O + Na]+ | |
| 333.1476 (26) | 333.1467 | +0.9 | C20H22O3Na | [M − C4H8O2 − C8H6O − H2O − C2H4O2 + Na]+ | |
| 311.1649 (3) | 311.1647 | +0.2 | C20H23O3 | [M − C8H8O2 − C2H4O − C4H8O2 − H2O + H]+ | |
| 293.1554 (18) | 293.1542 | +1.2 | C20H21O2 | [M − C8H8O2 − C2H4O − C4H8O2 − 2H2O + H]+ | |
| 275.1440 (2) | 275.1436 | +0.4 | C20H19O | [M − C8H8O2 − C2H4O − C4H8O2 − 3H2O + H]+ | |
| 265.1599 (4) | 265.1592 | +0.7 | C19H21O | [M − C8H8O2 − C2H4O − C4H8O2 − 2H2O − CO + H]+ | |
| 247.1492 (1) | 247.1487 | +0.5 | C19H19 | [M − C8H8O2 − C2H4O − C4H8O2 − 3H2O − CO + H]+ | |
| AcDPPT (5) | 629.2745 (4) | 629.2727 | +1.8 | C35H42O9Na | [M + Na]+ |
| 529.2225 (41) | 529.2202 | +2.3 | C30H34O7Na | [M − C5H8O2 + Na]+ | |
| 493.2221 (34) | 493.2202 | +1.9 | C27H34O7Na | [M − C8H8O2 + Na]+ | |
| 433.2011 (100) | 433.1991 | +2.0 | C25H30O5Na | [M − C8H8O2 − C2H4O + Na]+ | |
| 411.1806 (16) | 411.1784 | +2.2 | C22H28O6Na | [M − C5H8O2 − C8H6O + Na]+ | |
| 393.1697 (25) | 393.1678 | +1.9 | C22H26O5Na | [M − C5H8O2 − C8H6O − H2O + Na]+ | |
| 333.1483 (25) | 333.1467 | +1.6 | C20H22O3Na | [M − C5H8O2 − C8H6O − H2O − C2H4O2 + Na]+ | |
| 311.1662 (6) | 311.1647 | +1.5 | C20H23O3 | [M − C8H8O2 − C2H4O − C5H8O2 − H2O + H]+ | |
| 293.1552 (44) | 293.1542 | +1.0 | C20H21O2 | [M − C8H8O2 − C2H4O − C5H8O2 − 2H2O + H]+ | |
| 275.1446 (5) | 275.1436 | +1.0 | C20H19O | [M − C8H8O2 − C2H4O − C5H8O2 − 3H2O + H]+ | |
| 265.1600 (6) | 265.1592 | +0.8 | C19H21O | [M − C8H8O2 − C2H4O − C5H8O2 − 2H2O − CO + H]+ | |
| 247.1446 (5) | 247.1487 | −4.1 | C19H19 | [M − C8H8O2 − C2H4O − C5H8O2 − 3H2O − CO + H]+ | |
| AcDPPBz (6) | 651.2601 (100) | 651.2570 | +3.1 | C37H40O9Na | [M + Na]+ |
| 529.2211 (87) | 529.2202 | +0.9 | C30H34O7Na | [M − C7H6O2 + Na]+ | |
| 515.2083 (17) | 515.2046 | +3.7 | C29H32O7Na | [M − C8H8O2 + Na]+ | |
| 455.1880 (34) | 455.1834 | +4.6 | C27H28O5Na | [M − C8H8O2 − C2H4O + Na]+ | |
| 411.1787 (52) | 411.1784 | +0.3 | C22H28O6Na | [M − C7H6O2 − C8H6O + Na]+ | |
| 393.1679 (25) | 393.1678 | +0.1 | C22H26O5Na | [M − C7H6O2 − C8H6O − H2O + Na]+ | |
| 333.1474 (24) | 333.1467 | +0.7 | C20H22O3Na | [M − C7H6O2 − C8H6O − H2O − C2H4O2 + Na]+ | |
| 311.1645 (3) | 311.1647 | −0.2 | C20H23O3 | [M − C8H8O2 − C2H4O − C7H6O2 − H2O + H]+ | |
| 293.1552 (9) | 293.1542 | +1.0 | C20H21O2 | [M − C8H8O2 − C2H4O − C7H6O2 − 2H2O + H]+ | |
| 275.1496 (2) | 275.1436 | +6.0 | C20H19O | [M − C8H8O2 − C2H4O − C7H6O2 − 3H2O + H]+ | |
| 265.1512 (5) | 265.1592 | −8.0 | C19H21O | [M − C8H8O2 − C2H4O − C7H6O2 − 2H2O − CO + H]+ | |
| 247.1542 (3) | 247.1487 | +5.5 | C19H19 | [M − C8H8O2 − C2H4O − C7H6O2 − 3H2O − CO + H]+ |
| Compound | Observed m/z (%) | Calculated m/z | Δm (mDa) | Elemental Composition | Annotation |
|---|---|---|---|---|---|
| AcDPiPn (13) | 497.2527 (100) | 497.2515 | +1.2 | C27H38O7Na | [M + Na]+ |
| 395.1843 (17) | 395.1834 | +0.9 | C22H28O5Na | [M − C5H10O2 + Na]+ | |
| 355.1919 (0.6) | 355.1909 | +0.1 | C22H27O4 | [M − C5H10O2 − H2O + H]+ | |
| 335.1631 (34) | 335.1623 | +0.8 | C20H24O3Na | [M − C5H10O2 − AcOH + Na]+ | |
| 313.1810 (1) | 313.1804 | +0.6 | C20H25O3 | [M − C5H10O2 − H2O − C3H2O + H]+ | |
| 295.1704 (28) | 295.1698 | +0.6 | C20H23O2 | [M − C5H10O2 − AcOH − H2O + H]+ | |
| 277.1599 (5) | 277.1592 | +0.4 | C20H21O | [M − C5H10O2 − AcOH − 2H2O + H]+ | |
| 267.1754 (6) | 267.1749 | +0.5 | C19H23O | [M − C5H10O2 − AcOH − H2O − CO + H]+ | |
| 249.1653 (0.4) | 249.1643 | +1.0 | C19H21 | [M − C5H10O2 − AcOH − 2H2O − CO + H]+ | |
| AcDPMeOP (14) | 561.2455 (100) | 561.2464 | −0.9 | C31H38O8Na | [M + Na]+ |
| 395.1827 (26) | 395.1834 | −0.7 | C22H28O5Na | [M − C9H10O3 + Na]+ | |
| 355.1907 (4) | 355.1909 | −0.2 | C22H27O4 | [M − C9H10O3 − H2O + H]+ | |
| 335.1617 (22) | 335.1623 | −0.6 | C20H24O3Na | [M − C9H10O3 − AcOH + Na]+ | |
| 313.1797 (1) | 313.1804 | −0.7 | C20H25O3 | [M − C9H10O3 − H2O − C3H2O + H]+ | |
| 295.1696 (35) | 295.1698 | −0.2 | C20H23O2 | [M − C9H10O3 − AcOH − H2O + H]+ | |
| 277.1592 (5) | 277.1592 | +0.0 | C20H21O | [M − C9H10O3 − AcOH − 2H2O + H]+ | |
| 267.1748 (5) | 267.1749 | −0.1 | C19H23O | [M − C9H10O3 − AcOH − H2O − CO + H]+ | |
| 249.1643 (0.4) | 249.1643 | +0.0 | C19H21 | [M − C9H10O3 − AcOH − 2H2O − CO + H]+ |
| Pos. | 13 * | 14 * | 15 * |
|---|---|---|---|
| δH (J in Hz) | δH (J in Hz) | δH (J in Hz) | |
| 1 | 7.54 m | 7.52 m | 7.54 m |
| 5 | 2.54 d (19.1) | 2.54 d (19.0) | 2.51 d (19.1) |
| 2.37 d (19.1) | 2.37 d (19.0) | 2.20 d (19.1) | |
| 7 | 5.69 bd (5.7) | 5.66 d (5.6) | 5.33 d (5.2) |
| 8β | 3.08 brs | 3.08 t (5.6) | 3.01 t (5.7) |
| 10α | 3.13 t (2.6) | 3.13 t (2.9) | 3.16 brs |
| 11β | 2.03 a | 2.00 c | 2.00 m |
| 12 | 2.09 dd (14.5, 7.0) | 2.09 dd (14.4, 6.8) | 2.09 dd (14.3, 6.9) |
| 1.54 dd (14.5, 10.8) | 1.52 dd (14.4, 10.6) | 1.48 dd (14.3, 10.5) | |
| 14α | 0.86 d (5.7) | 0.86 d (5.6) | 0.78 d (5.6 Hz) |
| 16α | 1.18 s | 1.18 s | 1.18 s |
| 17β | 1.07 s | 1.07 s | 1.07 s |
| 18 | 0.89 d (6.6) | 0.90 d (6.4) | 0.87 d (6.2) |
| 19 | 1.73 m | 1.74 dd (2.9, 1.4) | 1.74 m |
| 20 | 4.48 s | 4.48 s | 1.73 m |
| COCH3 | 2.02 s a | 2.02 s c | - |
| 2′ | 2.21 d (7.2) | 3.56 s | 2.55 hept (7.0) |
| 3′ | 2.08 a | - | 1.15 d (7.0) f |
| 4′ | 0.96 d (6.9) b | 6.86 d (8.4) d | 1.15 d (7.0) f |
| 5′ | 0.96 d (6.9) b | 7.18 d (8.4) e | - |
| 6′ | - | - | - |
| 7′ | - | 7.18 d (8.4) e | - |
| 8′ | - | 6.86 d (8.4) d | - |
| 9′ | - | 3.77 (s) | - |
| Compound | Observed m/z (%) | Calculated m/z | Δm (mDa) | Elemental Composition | Annotation |
|---|---|---|---|---|---|
| diDPB (15) | 425.2322 (100) | 425.2304 | +1.8 | C24H34O5Na | [M + Na]+ |
| 337.1794 (40) | 337.1780 | +1.4 | C20H26O3Na | [M − C4H8O2 + Na]+ | |
| 297.1865 (22) | 297.1855 | +1.0 | C20H25O2 | [M − C4H8O2 − H2O + H]+ | |
| 279.1759 (14) | 279.1749 | +1.0 | C20H23O | [M − C4H8O2 − 2H2O + H]+ | |
| 269.1915 (12) | 269.1905 | +1.0 | C19H25O | [M − C4H8O2 − H2O − CO + H]+ | |
| diDPU4 (22) | 437.2304 (100) | 437.2304 | +0.0 | C25H34O5Na | [M + Na]+ |
| 337.1778 (34) | 337.1780 | −0.2 | C20H26O3Na | [M − C5H8O2 + Na]+ | |
| 297.1848 (6) | 297.1855 | −0.7 | C20H25O2 | [M − C5H8O2 − H2O + H]+ | |
| 279.1745 (13) | 279.1749 | −0.4 | C20H23O | [M − C5H8O2 − 2H2O + H]+ | |
| 269.1896 (13) | 269.1905 | −0.9 | C19H25O | [M − C5H8O2 − H2O − CO + H]+ |
| Entry | Fraction * | Component | r. t. ** | Figure † |
|---|---|---|---|---|
| 1 | F | AcDPB (10) | 4.41–4.52 | Figure S31a |
| 2 | AcDPA (11) | 5.05 | Figure S31b | |
| 3 | AcDPP (12) | 4.62 | Figure S31c | |
| 4 | AcDPiPn (13) | 5.18 | Figure S31d | |
| 5 | G-6 | AcDPPBz (6) | 5.55 | Figure S32a |
| 6 | AcDPMeOP (14) | 4.46 | Figure S33a | |
| 7 | diDPB (15) | 5.59 | Figure S34a | |
| 8 | G-7 | AcDPPI (4) | 5.20 | Figure S35a |
| 9 | AcDPPT (5) | 5.35 | Figure S35b | |
| 10 | AcDPPBz (6) | 5.53 | Figure S35c | |
| 11 | AcDPP (12) | 4.57 | Figure S36a | |
| 12 | AcDPMeOP (14) | 4.39 | Figure S36b | |
| 13 | AcDPPU2 (20) | 4.54 | Figure S35d | |
| 14 | diDPU4 (22) | 5.85 | Figure S37a | |
| 15 | G-8 | AcDPPI (4) | 5.18 | Figure S38a |
| 16 | AcDPPT (5) | 5.35 | Figure S38b | |
| 17 | AcDPP (12) | 4.57 | Figure S39a | |
| 18 | AcDPPU3 (21) | 5.68 | Figure S38c | |
| 19 | G-9 | DPPI (1) | 4.70 | Figure S40a |
| 20 | DPPT (2) | 4.89 | Figure S40b | |
| 21 | DPPBz (3) | 5.04 | Figure S40c | |
| 22 | DPB (7) | 3.73–3.80 | Figure S41a | |
| 23 | DPA (8) | 4.39 | Figure S41b | |
| 24 | DPP (9) | 3.98 | Figure S41c | |
| 25 | DPPU1 (19) | 5.27 | Figure S40d |
| Compound | Observed m/z (%) | Calculated m/z | Δm (mDa) | Elemental Composition | Annotation |
|---|---|---|---|---|---|
| AcDPPU2 (20) | 603.2540 (4) | 603.2570 | −3.0 | C33H40O9Na | [M + Na]+ |
| 529.2205 (29) | 529.2202 | +0.3 | C30H34O7Na | [M − C3H6O2 + Na]+ | |
| 467.2045 (24) | 467.2046 | −0.1 | C25H32O7Na | [M − C8H8O2 + Na]+ | |
| 407.1836 (100) | 407.1834 | +0.2 | C23H28O5Na | [M − C8H8O2 − C2H4O2 + Na]+ | |
| 411.1783 (14) | 411.1784 | −0.1 | C22H28O6Na | [M − C3H6O2 − C8H6O + Na]+ | |
| 393.1683 (7) | 393.1678 | +0.5 | C22H26O5Na | [M − C3H6O2 − C8H6O − H2O + Na]+ | |
| 333.1462 (12) | 333.1467 | −0.5 | C20H22O3Na | [M − C8H8O2 − C2H4O2 − C3H6O2 + Na]+ | |
| 311.1675 (1) | 311.1647 | +2.8 | C20H23O3 | [M − C8H8O2 − C2H4O − C3H6O2 − H2O + H]+ | |
| 293.1524 (4) | 293.1542 | −1.8 | C20H21O2 | [M − C8H8O2 − C2H4O − C3H6O2 − 2H2O + H]+ | |
| 275.1463 (1) | 275.1436 | +2.7 | C20H19O | [M − C8H8O2 − C2H4O − C3H6O2 − 3H2O + H]+ | |
| 265.1610 (1) | 265.1592 | +1.8 | C19H21O | [M − C8H8O2 − C2H4O − C3H6O2 − 2H2O − CO + H]+ | |
| AcDPPU3 (21) | 631.2911 (3) | 631.2883 | +2.8 | C35H44O9Na | [M + Na]+ |
| 529.2214 (18) | 529.2202 | +1.2 | C30H34O7Na | [M − C5H10O2 + Na]+ | |
| 495.2373 (33) | 495.2359 | +1.4 | C27H36O7Na | [M − C8H8O2 + Na]+ | |
| 435.2162 (100) | 435.2147 | +1.5 | C25H32O5Na | [M − C8H8O2 − C2H4O + Na]+ | |
| 411.1812 (7) | 411.1784 | +2.8 | C22H28O6Na | [M − C5H10O2 − C8H6O + Na]+ | |
| 393.1683 (10) | 393.1678 | +0.5 | C22H26O5Na | [M − C5H10O2 − C8H6O − H2O + Na]+ | |
| 333.1481 (4) | 333.1467 | +1.4 | C20H22O3Na | [M − C5H10O2 − C8H6O − H2O − C2H4O2 + Na]+ | |
| 311.1642 (2) | 311.1647 | −0.5 | C20H23O3 | [M − C8H8O2 − C2H4O − C5H10O2 − H2O + H]+ | |
| 293.1559 (13) | 293.1542 | +1.7 | C20H21O2 | [M − C8H8O2 − C2H4O − C5H10O2 − 2H2O + H]+ | |
| 275.1400 (1) | 275.1436 | −3.6 | C20H19O | [M − C8H8O2 − C2H4O − C5H10O2 − 3H2O + H]+ | |
| 265.1602 (2) | 265.1592 | +1.0 | C19H21O | [M − C8H8O2 − C2H4O − C5H10O2 − 2H2O − CO + H]+ | |
| 247.1508 (1) | 247.1487 | +2.1 | C19H19 | [M − C8H8O2 − C2H4O − C5H10O2 − 3H2O − CO + H]+ |
Disclaimer/Publisher’s Note: The statements, opinions and data contained in all publications are solely those of the individual author(s) and contributor(s) and not of MDPI and/or the editor(s). MDPI and/or the editor(s) disclaim responsibility for any injury to people or property resulting from any ideas, methods, instructions or products referred to in the content. |
© 2023 by the authors. Licensee MDPI, Basel, Switzerland. This article is an open access article distributed under the terms and conditions of the Creative Commons Attribution (CC BY) license (https://creativecommons.org/licenses/by/4.0/).
Share and Cite
Ezzanad, A.; De los Reyes, C.; Macías-Sánchez, A.J.; Hernández-Galán, R. Isolation and Identification of 12-Deoxyphorbol Esters from Euphorbia resinifera Berg Latex: Targeted and Biased Non-Targeted Identification of 12-Deoxyphorbol Esters by UHPLC-HRMSE. Plants 2023, 12, 3846. https://doi.org/10.3390/plants12223846
Ezzanad A, De los Reyes C, Macías-Sánchez AJ, Hernández-Galán R. Isolation and Identification of 12-Deoxyphorbol Esters from Euphorbia resinifera Berg Latex: Targeted and Biased Non-Targeted Identification of 12-Deoxyphorbol Esters by UHPLC-HRMSE. Plants. 2023; 12(22):3846. https://doi.org/10.3390/plants12223846
Chicago/Turabian StyleEzzanad, Abdellah, Carolina De los Reyes, Antonio J. Macías-Sánchez, and Rosario Hernández-Galán. 2023. "Isolation and Identification of 12-Deoxyphorbol Esters from Euphorbia resinifera Berg Latex: Targeted and Biased Non-Targeted Identification of 12-Deoxyphorbol Esters by UHPLC-HRMSE" Plants 12, no. 22: 3846. https://doi.org/10.3390/plants12223846
APA StyleEzzanad, A., De los Reyes, C., Macías-Sánchez, A. J., & Hernández-Galán, R. (2023). Isolation and Identification of 12-Deoxyphorbol Esters from Euphorbia resinifera Berg Latex: Targeted and Biased Non-Targeted Identification of 12-Deoxyphorbol Esters by UHPLC-HRMSE. Plants, 12(22), 3846. https://doi.org/10.3390/plants12223846