
Multivariate Genome-Wide Association Study of Concentrations of Seven Elements in Seeds Reveals Four New Loci in Russian Wheat Lines

 ,
,
Abstract
:1. Introduction
2. Material and Methods
2.1. Wheat Lines
2.2. Genotyping and Quality Control
2.3. Phenotyping
2.4. GWAS Analysis
2.5. Functional Annotation
2.6. Verification of Known Loci
3. Results
3.1. Concentration of Elements in Grain
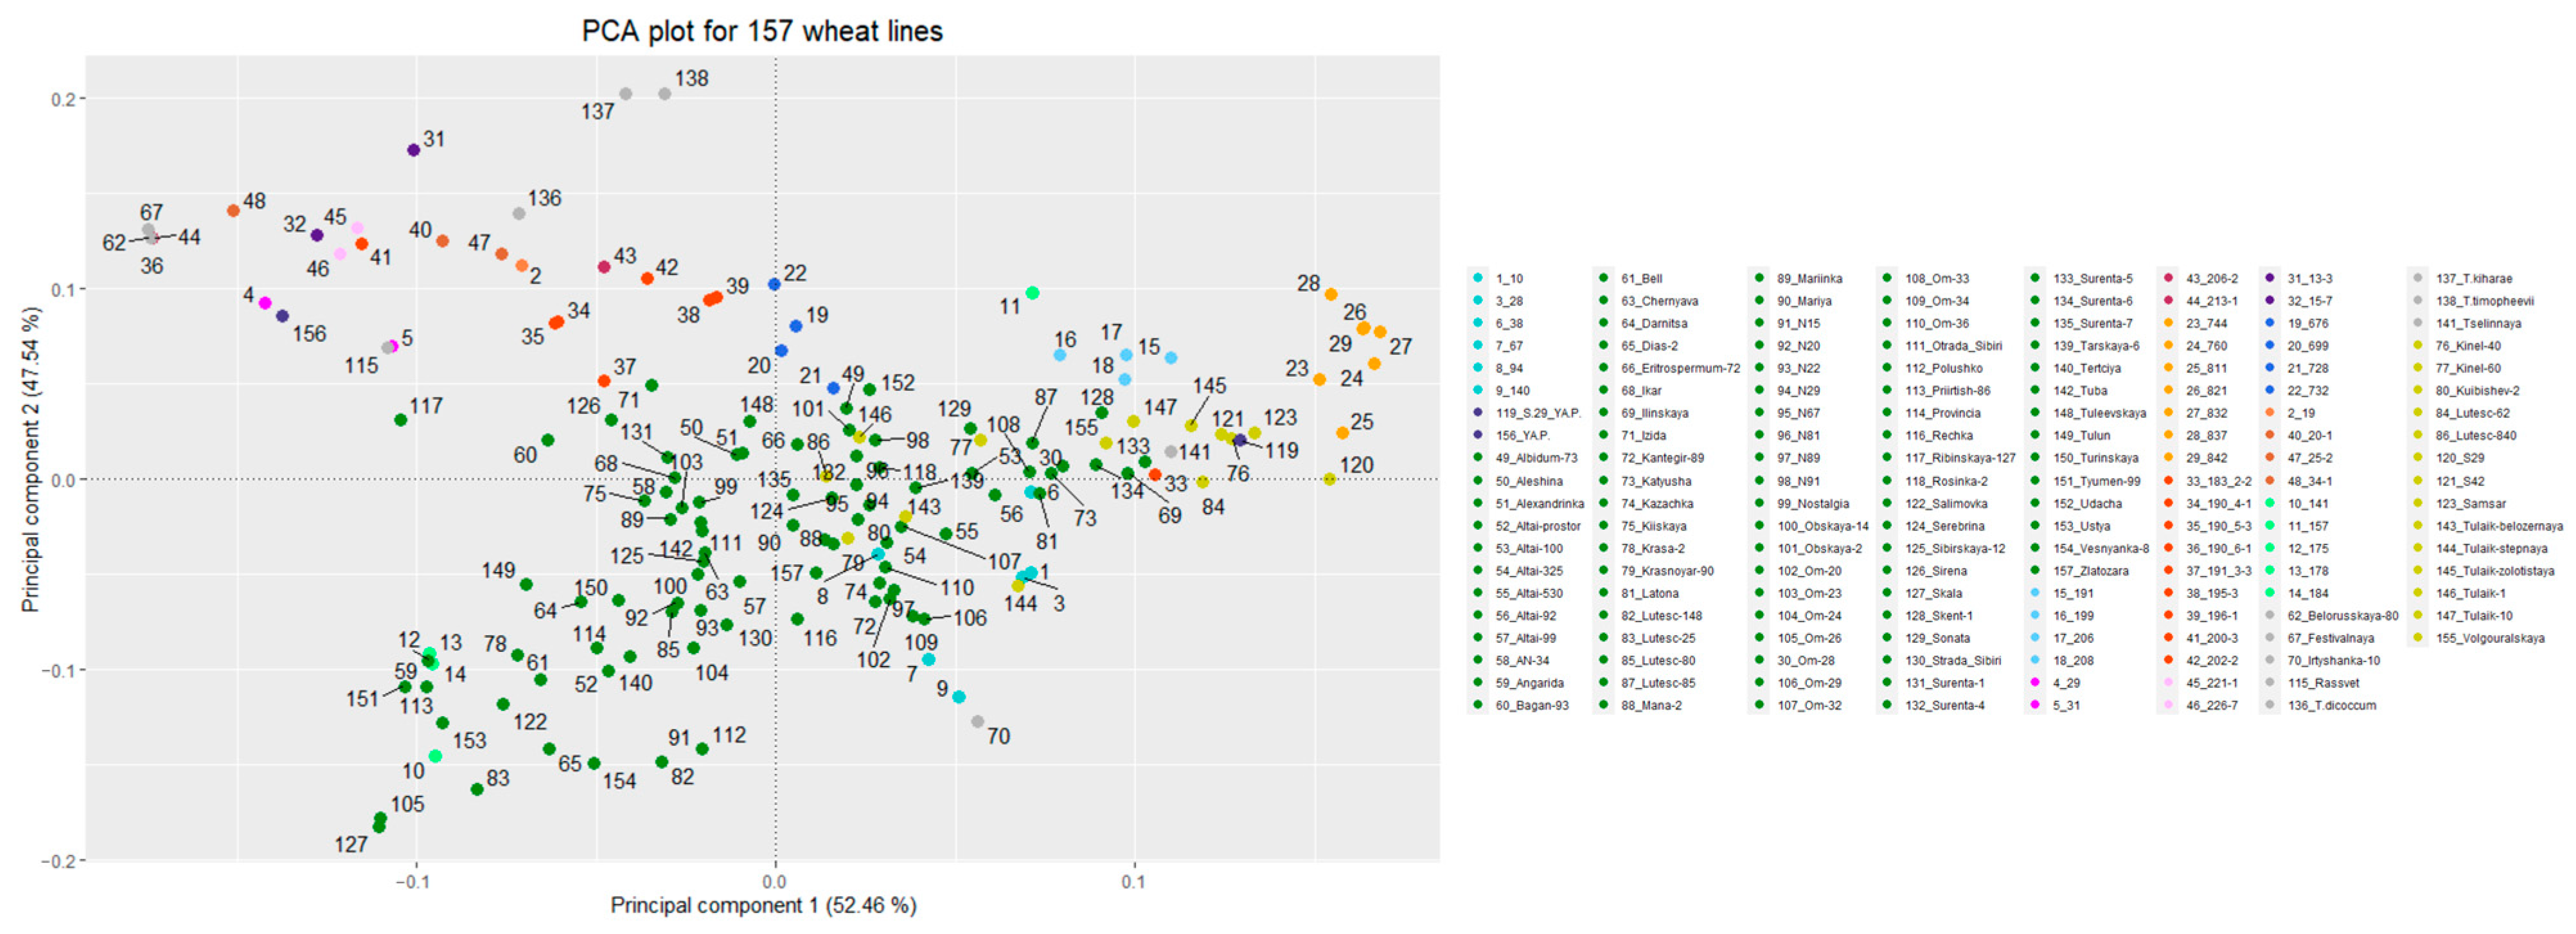
3.2. Genetic Structure of the Studied Populations/Lines
3.3. GWAS of the Concentrations of Seven Elements
3.4. Functional Annotation of Discovered Loci
3.5. Replication of Known Loci
4. Discussion
Supplementary Materials
Author Contributions
Funding
Data Availability Statement
Acknowledgments
Conflicts of Interest
References
- Walkowiak, S.; Gao, L.; Monat, C.; Haberer, G.; Kassa, M.T.; Brinton, J.; Ramirez-Gonzalez, R.H.; Kolodziej, M.C.; Delorean, E.; Thambugala, D.; et al. Multiple Wheat Genomes Reveal Global Variation in Modern Breeding. Nature 2020, 588, 277–283. [Google Scholar] [CrossRef]
- Athiyannan, N.; Abrouk, M.; Boshoff, W.H.P.; Cauet, S.; Rodde, N.; Kudrna, D.; Mohammed, N.; Bettgenhaeuser, J.; Botha, K.S.; Derman, S.S.; et al. Long-Read Genome Sequencing of Bread Wheat Facilitates Disease Resistance Gene Cloning. Nat. Genet. 2022, 54, 227–231. [Google Scholar] [CrossRef] [PubMed]
- Kumar, J.; Mishra, A.; Kumar, A.; Kaur, G.; Sharma, H.; Kaur, S.; Sharma, S.; Devi, K.; Garg, M.; Pandey, A.K.; et al. Whole Genome Re-Sequencing of Indian Wheat Genotypes for Identification of Genomic Variants for Grain Iron and Zinc Content. Mol. Biol. Rep. 2022, 49, 7123–7133. [Google Scholar] [CrossRef] [PubMed]
- Liu, Z.; Xin, M.; Qin, J.; Peng, H.; Ni, Z.; Yao, Y.; Sun, Q. Temporal Transcriptome Profiling Reveals Expression Partitioning of Homeologous Genes Contributing to Heat and Drought Acclimation in Wheat (Triticum aestivum L.). BMC Plant Biol. 2015, 15, 152. [Google Scholar] [CrossRef]
- Poretti, M.; Sotiropoulos, A.G.; Graf, J.; Jung, E.; Bourras, S.; Krattinger, S.G.; Wicker, T. Comparative Transcriptome Analysis of Wheat Lines in the Field Reveals Multiple Essential Biochemical Pathways Suppressed by Obligate Pathogens. Front. Plant Sci. 2021, 12, 720462. [Google Scholar] [CrossRef] [PubMed]
- Prasad, G.; Mittal, S.; Kumar, A.; Chauhan, D.; Sahu, T.K.; Kumar, S.; Singh, R.; Yadav, M.C.; Singh, A.K. Transcriptome Analysis of Bread Wheat Genotype KRL3-4 Provides a New Insight Into Regulatory Mechanisms Associated With Sodicity (High PH) Tolerance. Front. Genet. 2022, 12, 782366. [Google Scholar] [CrossRef]
- Sun, C.; Dong, Z.; Zhao, L.; Ren, Y.; Zhang, N.; Chen, F. The Wheat 660K SNP Array Demonstrates Great Potential for Marker-assisted Selection in Polyploid Wheat. Plant Biotechnol. J. 2020, 18, 1354–1360. [Google Scholar] [CrossRef]
- Rimbert, H.; Darrier, B.; Navarro, J.; Kitt, J.; Choulet, F.; Leveugle, M.; Duarte, J.; Rivière, N.; Eversole, K.; on behalf of The International Wheat Genome Sequencing Consortium; et al. High Throughput SNP Discovery and Genotyping in Hexaploid Wheat. PLoS ONE 2018, 13, e0186329. [Google Scholar] [CrossRef]
- Muhu-Din Ahmed, H.G.; Sajjad, M.; Zeng, Y.; Iqbal, M.; Habibullah Khan, S.; Ullah, A.; Nadeem Akhtar, M. Genome-Wide Association Mapping through 90K SNP Array for Quality and Yield Attributes in Bread Wheat against Water-Deficit Conditions. Agriculture 2020, 10, 392. [Google Scholar] [CrossRef]
- Liu, J.; Wu, B.; Singh, R.P.; Velu, G. QTL Mapping for Micronutrients Concentration and Yield Component Traits in a Hexaploid Wheat Mapping Population. J. Cereal Sci. 2019, 88, 57–64. [Google Scholar] [CrossRef]
- Velu, G.; Singh, R.P.; Crespo-Herrera, L.; Juliana, P.; Dreisigacker, S.; Valluru, R.; Stangoulis, J.; Sohu, V.S.; Mavi, G.S.; Mishra, V.K.; et al. Genetic Dissection of Grain Zinc Concentration in Spring Wheat for Mainstreaming Biofortification in CIMMYT Wheat Breeding. Sci. Rep. 2018, 8, 13526. [Google Scholar] [CrossRef] [PubMed]
- Cu, S.T.; Guild, G.; Nicolson, A.; Velu, G.; Singh, R.; Stangoulis, J. Genetic Dissection of Zinc, Iron, Copper, Manganese and Phosphorus in Wheat (Triticum aestivum L.) Grain and Rachis at Two Developmental Stages. Plant Sci. 2020, 291, 110338. [Google Scholar] [CrossRef] [PubMed]
- Wang, W.; Guo, H.; Wu, C.; Yu, H.; Li, X.; Chen, G.; Tian, J.; Deng, Z. Identification of Novel Genomic Regions Associated with Nine Mineral Elements in Chinese Winter Wheat Grain. BMC Plant Biol. 2021, 21, 311. [Google Scholar] [CrossRef]
- Krishnappa, G.; Rathan, N.D.; Sehgal, D.; Ahlawat, A.K.; Singh, S.K.; Singh, S.K.; Shukla, R.B.; Jaiswal, J.P.; Solanki, I.S.; Singh, G.P.; et al. Identification of Novel Genomic Regions for Biofortification Traits Using an SNP Marker-Enriched Linkage Map in Wheat (Triticum aestivum L.). Front. Nutr. 2021, 8, 669444. [Google Scholar] [CrossRef] [PubMed]
- Tong, J.; Zhao, C.; Sun, M.; Fu, L.; Song, J.; Liu, D.; Zhang, Y.; Zheng, J.; Pu, Z.; Liu, L.; et al. High Resolution Genome Wide Association Studies Reveal Rich Genetic Architectures of Grain Zinc and Iron in Common Wheat (Triticum aestivum L.). Front. Plant Sci. 2022, 13, 840614. [Google Scholar] [CrossRef]
- Rathan, N.D.; Krishna, H.; Ellur, R.K.; Sehgal, D.; Govindan, V.; Ahlawat, A.K.; Krishnappa, G.; Jaiswal, J.P.; Singh, J.B.; Sv, S.; et al. Genome-Wide Association Study Identifies Loci and Candidate Genes for Grain Micronutrients and Quality Traits in Wheat (Triticum aestivum L.). Sci. Rep. 2022, 12, 7037. [Google Scholar] [CrossRef]
- Krishnappa, G.; Khan, H.; Krishna, H.; Kumar, S.; Mishra, C.N.; Parkash, O.; Devate, N.B.; Nepolean, T.; Rathan, N.D.; Mamrutha, H.M.; et al. Genetic Dissection of Grain Iron and Zinc, and Thousand Kernel Weight in Wheat (Triticum aestivum L.) Using Genome-Wide Association Study. Sci. Rep. 2022, 12, 12444. [Google Scholar] [CrossRef]
- Wang, J.; Shi, X.; Zhou, Z.; Qin, M.; Wang, Y.; Li, W.; Yang, P.; Wu, Z.; Lei, Z. Genetic Dissection of Grain Iron Concentration in Hexaploid Wheat (Triticum aestivum L.) Using a Genome-Wide Association Analysis Method. PeerJ 2022, 10, e13625. [Google Scholar] [CrossRef]
- Morgounov, A.; Li, H.; Shepelev, S.; Ali, M.; Flis, P.; Koksel, H.; Savin, T.; Shamanin, V. Genetic Characterization of Spring Wheat Germplasm for Macro-, Microelements and Trace Metals. Plants 2022, 11, 2173. [Google Scholar] [CrossRef]
- Hatoum, A.S.; Colbert, S.M.C.; Johnson, E.C.; Huggett, S.B.; Deak, J.D.; Pathak, G.A.; Jennings, M.V.; Paul, S.E.; Karcher, N.R.; Hansen, I.; et al. Multivariate Genome-Wide Association Meta-Analysis of over 1 Million Subjects Identifies Loci Underlying Multiple Substance Use Disorders. Nat. Ment. Health 2023, 1, 210–223. [Google Scholar] [CrossRef]
- Macri, M.; Luigi-Sierra, M.G.; Guan, D.; Delgado, J.V.; Alvarez, J.F.; Amills, M.; Martínez, A.M. Univariate and Multivariate Genome-wide Association Studies for Hematological Traits in Murciano-Granadina Goats. Anim. Genet. 2023, 54, 491–499. [Google Scholar] [CrossRef] [PubMed]
- Ruotsalainen, S.E.; Partanen, J.J.; Cichonska, A.; Lin, J.; Benner, C.; Surakka, I.; FinnGen; Reeve, M.P.; Palta, P.; Salmi, M.; et al. An Expanded Analysis Framework for Multivariate GWAS Connects Inflammatory Biomarkers to Functional Variants and Disease. Eur. J. Hum. Genet. 2021, 29, 309–324. [Google Scholar] [CrossRef]
- Udosen, B.; Soremekun, O.; Kamiza, A.; Machipisa, T.; Cheickna, C.; Omotuyi, O.; Soliman, M.; Wélé, M.; Nashiru, O.; Chikowore, T.; et al. Meta-Analysis and Multivariate GWAS Analyses in 77,850 Individuals of African Ancestry Identify Novel Variants Associated with Blood Pressure Traits. Int. J. Mol. Sci. 2023, 24, 2164. [Google Scholar] [CrossRef] [PubMed]
- Zlobin, A.S.; Nikulin, P.S.; Volkova, N.A.; Zinovieva, N.A.; Iolchiev, B.S.; Bagirov, V.A.; Borodin, P.M.; Aksenovich, T.I.; Tsepilov, Y.A. Multivariate Analysis Identifies Eight Novel Loci Associated with Meat Productivity Traits in Sheep. Genes 2021, 12, 367. [Google Scholar] [CrossRef]
- Leonova, I.N.; Skolotneva, E.S.; Orlova, E.A.; Orlovskaya, O.A.; Salina, E.A. Detection of Genomic Regions Associated with Resistance to Stem Rust in Russian Spring Wheat Varieties and Breeding Germplasm. Int. J. Mol. Sci. 2020, 21, 4706. [Google Scholar] [CrossRef] [PubMed]
- Kiseleva, A.A.; Shcherban, A.B.; Leonova, I.N.; Frenkel, Z.; Salina, E.A. Identification of New Heading Date Determinants in Wheat 5B Chromosome. BMC Plant Biol. 2016, 16, 8. [Google Scholar] [CrossRef]
- Wang, S.; Wong, D.; Forrest, K.; Allen, A.; Chao, S.; Huang, B.E.; Maccaferri, M.; Salvi, S.; Milner, S.G.; Cattivelli, L.; et al. Characterization of Polyploid Wheat Genomic Diversity Using a High-density 90 000 Single Nucleotide Polymorphism Array. Plant Biotechnol. J. 2014, 12, 787–796. [Google Scholar] [CrossRef]
- Purcell, S.; Neale, B.; Todd-Brown, K.; Thomas, L.; Ferreira, M.A.R.; Bender, D.; Maller, J.; Sklar, P.; De Bakker, P.I.W.; Daly, M.J.; et al. PLINK: A Tool Set for Whole-Genome Association and Population-Based Linkage Analyses. Am. J. Hum. Genet. 2007, 81, 559–575. [Google Scholar] [CrossRef]
- Yang, J.; Lee, S.H.; Goddard, M.E.; Visscher, P.M. GCTA: A Tool for Genome-Wide Complex Trait Analysis. Am. J. Hum. Genet. 2011, 88, 76–82. [Google Scholar] [CrossRef]
- Willer, C.J.; Li, Y.; Abecasis, G.R. METAL: Fast and Efficient Meta-Analysis of Genomewide Association Scans. Bioinformatics 2010, 26, 2190–2191. [Google Scholar] [CrossRef]
- Zhu, Z.; Zhang, F.; Hu, H.; Bakshi, A.; Robinson, M.R.; Powell, J.E.; Montgomery, G.W.; Goddard, M.E.; Wray, N.R.; Visscher, P.M.; et al. Integration of Summary Data from GWAS and EQTL Studies Predicts Complex Trait Gene Targets. Nat. Genet. 2016, 48, 481–487. [Google Scholar] [CrossRef] [PubMed]
- Cunningham, F.; Allen, J.E.; Allen, J.; Alvarez-Jarreta, J.; Amode, M.R.; Armean, I.M.; Austine-Orimoloye, O.; Azov, A.G.; Barnes, I.; Bennett, R.; et al. Ensembl 2022. Nucleic Acids Res. 2022, 50, D988–D995. [Google Scholar] [CrossRef] [PubMed]
- The UniProt Consortium. UniProt: The Universal Protein Knowledgebase. Nucleic Acids Res. 2017, 45, D158–D169. [Google Scholar] [CrossRef] [PubMed]
- Thomas, P.G.; Campbell, M.J.; Kejariwal, A.; Thomas, P.; Karlak, B.; Daverman, R.; Diemer, K.; Muruganujan, A.; Narechania, A. PANTHER: A Library of Protein Families and Subfamilies Indexed by Function. Genome Res. 2003, 13, 2129–2141. [Google Scholar] [CrossRef]

| Element | 2018 | 2019 |
|---|---|---|
| Ca | 0.66 (0.052) | 0.51 (0.059) |
| Cu | 0.80 (0.034) | 0.80 (0.032) |
| Fe | 0.87 (0.024) | 0.75 (0.040) |
| K | 0.72 (0.048) | 0.838 (0.030) |
| Mg | 0.74 (0.043) | 0.55 (0.058) |
| Mn | 0.83 (0.029) | 0.79 (0.033) |
| Zn | 0.83 (0.028) | 0.67 (0.047) |
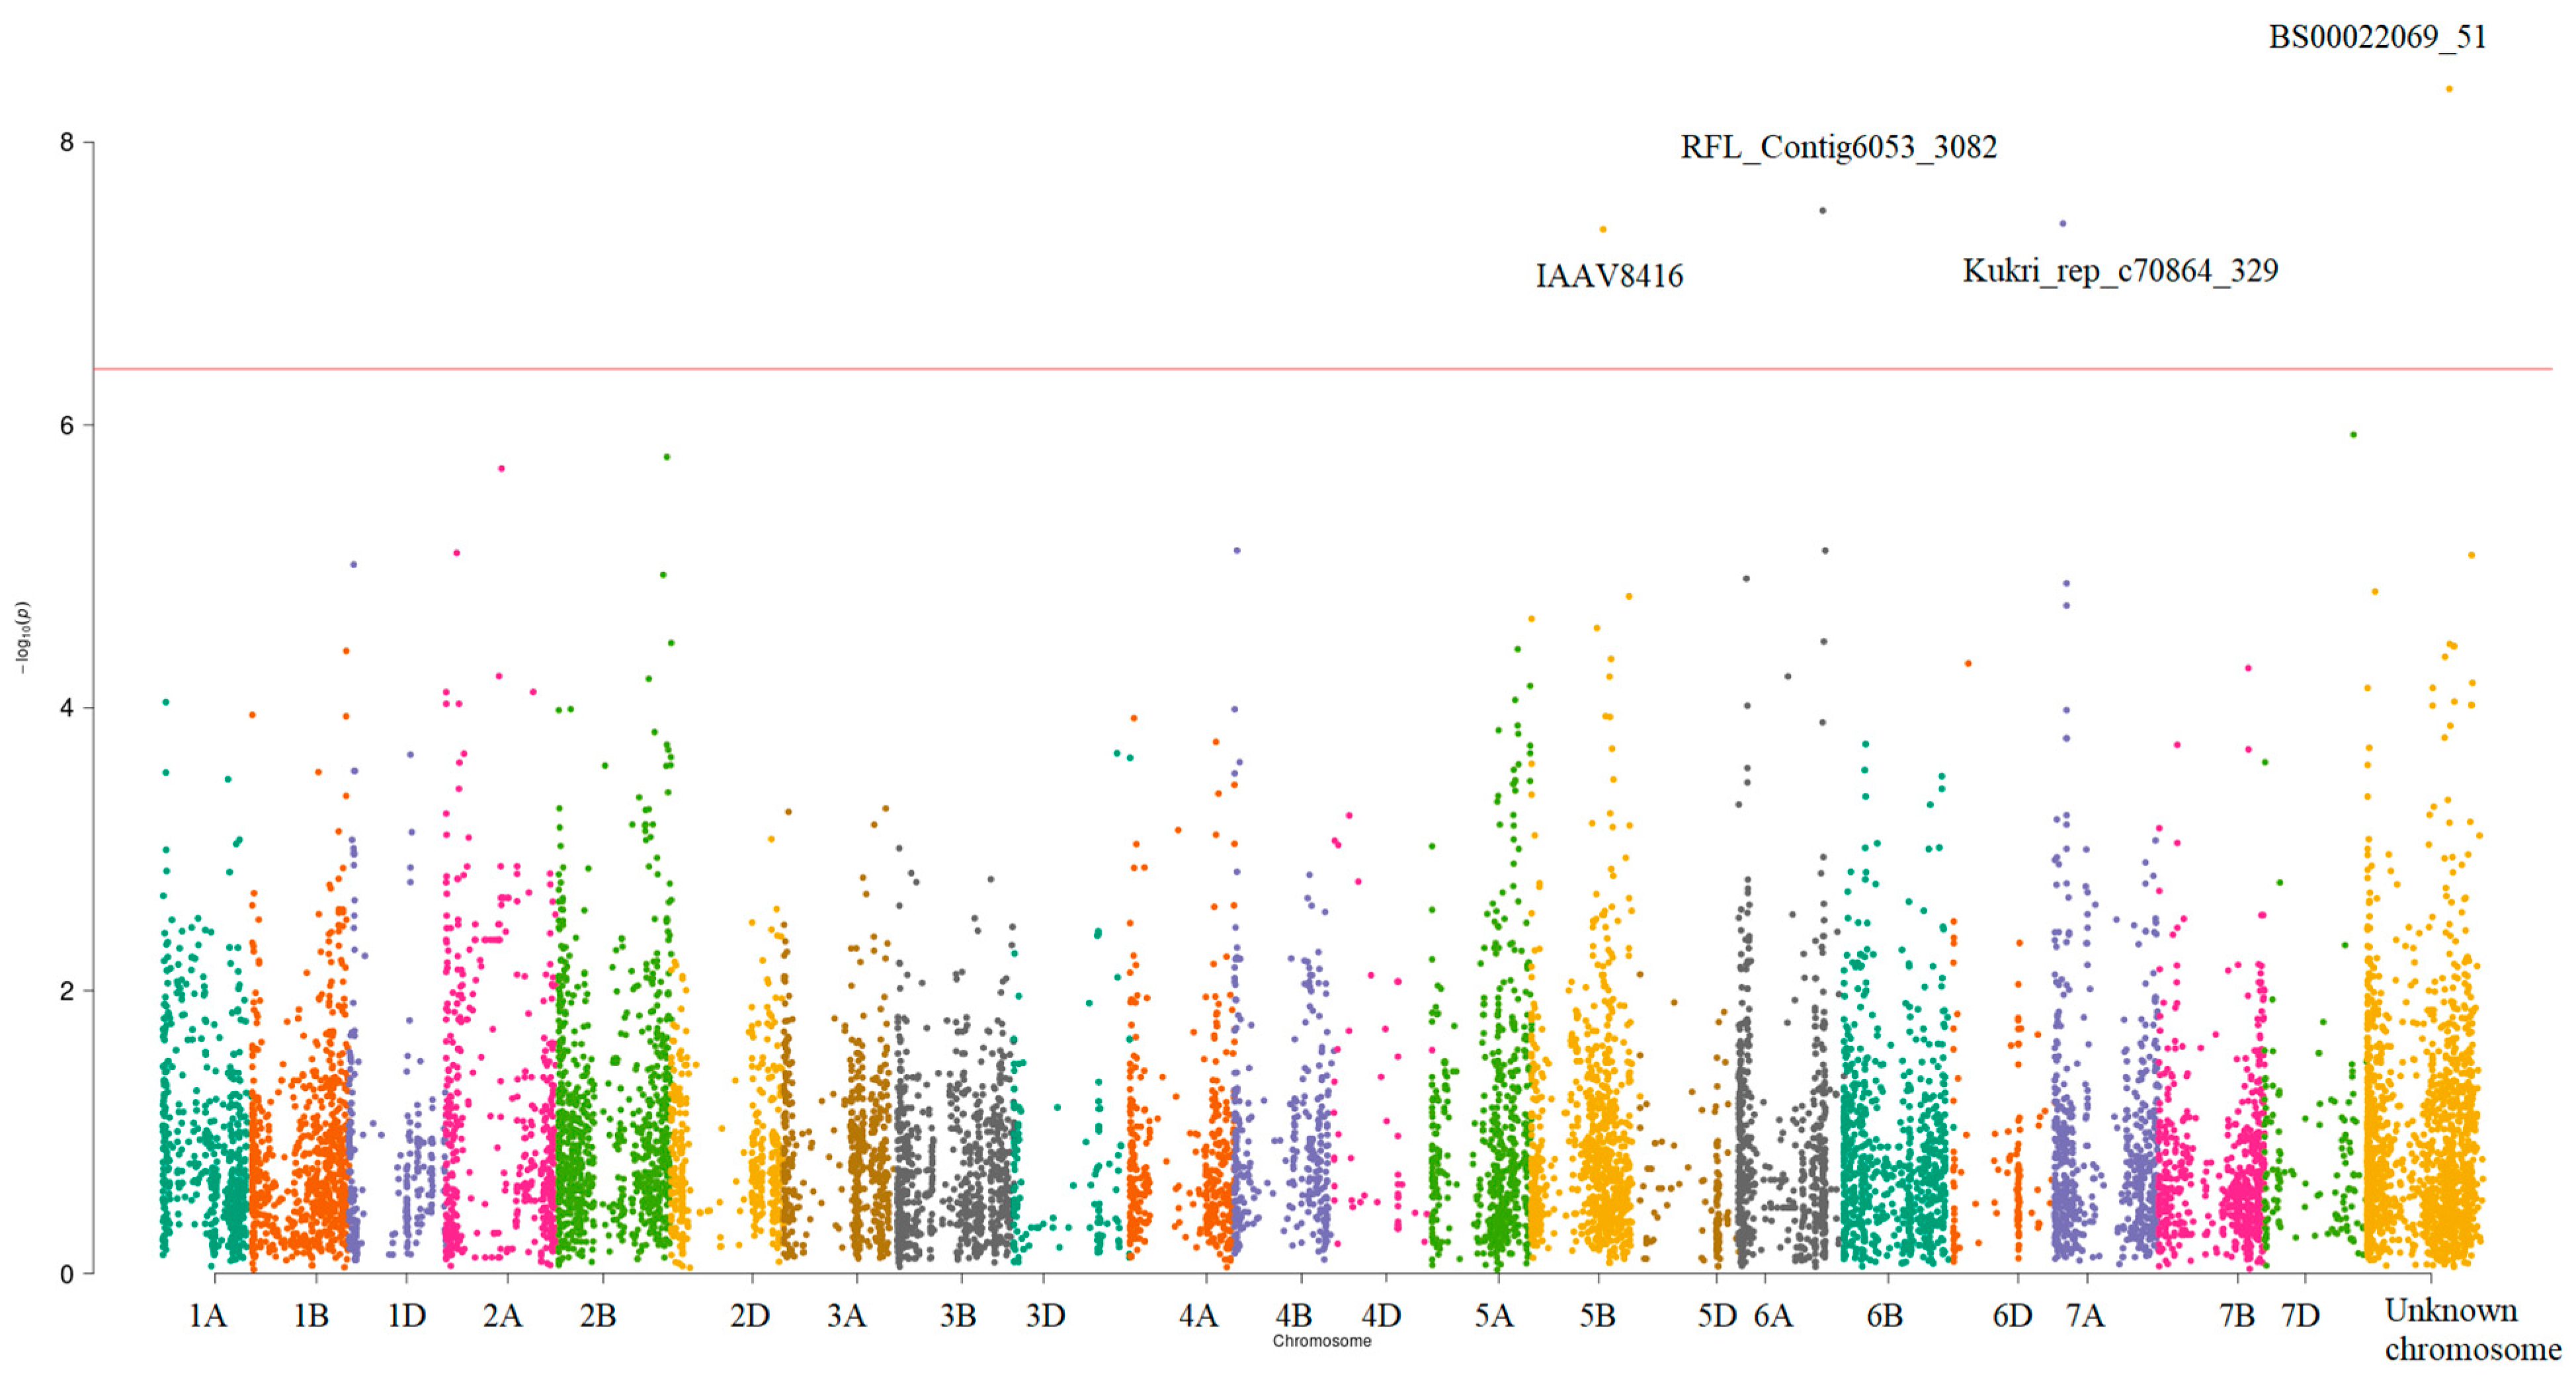
| Marker Name | Chromosome | Positive/Negative Alleles | Position | The Most Significant p-Value | Variance Explained by SNP, % | Significant Traits | The Nearest Gene |
|---|---|---|---|---|---|---|---|
| BS00022069_51 | Unknown * | A/C | 582104154 | 5.40 × 10⁻⁹ | 5.75 | Ca and K, K | TraesCS5A02G384200 ** |
| RFL_Contig6053_3082 | 6A | C/T | 597790267 | 3.05 × 10⁻⁸ | 5.22 | Fe and Mn | TraesCS6A02G375400 |
| Kukri_rep_c70864_329 | 7A | C/T ** | 57873213 | 3.76 × 10⁻⁸ | 5.18 | All traits | TraesCS7A02G094800 |
| IAAV8416 | 5B | T/C *** | 509487915 | 4.13 × 10⁻⁸ | 5.22 | Fe and Mn | TraesCS5B02G325400 |
Disclaimer/Publisher’s Note: The statements, opinions and data contained in all publications are solely those of the individual author(s) and contributor(s) and not of MDPI and/or the editor(s). MDPI and/or the editor(s) disclaim responsibility for any injury to people or property resulting from any ideas, methods, instructions or products referred to in the content. |
© 2023 by the authors. Licensee MDPI, Basel, Switzerland. This article is an open access article distributed under the terms and conditions of the Creative Commons Attribution (CC BY) license (https://creativecommons.org/licenses/by/4.0/).
Share and Cite
Potapova, N.A.; Timoshchuk, A.N.; Tiys, E.S.; Vinichenko, N.A.; Leonova, I.N.; Salina, E.A.; Tsepilov, Y.A. Multivariate Genome-Wide Association Study of Concentrations of Seven Elements in Seeds Reveals Four New Loci in Russian Wheat Lines. Plants 2023, 12, 3019. https://doi.org/10.3390/plants12173019
Potapova NA, Timoshchuk AN, Tiys ES, Vinichenko NA, Leonova IN, Salina EA, Tsepilov YA. Multivariate Genome-Wide Association Study of Concentrations of Seven Elements in Seeds Reveals Four New Loci in Russian Wheat Lines. Plants. 2023; 12(17):3019. https://doi.org/10.3390/plants12173019
Chicago/Turabian StylePotapova, Nadezhda A., Anna N. Timoshchuk, Evgeny S. Tiys, Natalia A. Vinichenko, Irina N. Leonova, Elena A. Salina, and Yakov A. Tsepilov. 2023. "Multivariate Genome-Wide Association Study of Concentrations of Seven Elements in Seeds Reveals Four New Loci in Russian Wheat Lines" Plants 12, no. 17: 3019. https://doi.org/10.3390/plants12173019
APA StylePotapova, N. A., Timoshchuk, A. N., Tiys, E. S., Vinichenko, N. A., Leonova, I. N., Salina, E. A., & Tsepilov, Y. A. (2023). Multivariate Genome-Wide Association Study of Concentrations of Seven Elements in Seeds Reveals Four New Loci in Russian Wheat Lines. Plants, 12(17), 3019. https://doi.org/10.3390/plants12173019