Article

Influence of Fertilization on Growth and Lead Content of Pepper under Lead Stress

College of Resources and Environment Sciences, Xinjiang Agricultural University, Urumqi 830052, China
*
Author to whom correspondence should be addressed.
Plants 2023, 12(16), 2960; https://doi.org/10.3390/plants12162960
Submission received: 12 July 2023 / Revised: 4 August 2023 / Accepted: 7 August 2023 / Published: 16 August 2023

Abstract

:
To investigate the effect of fertilization on Pb content in vegetables, pepper was planted in L1645 (the 5 influencing factors are fertilizers (N, P, K), organic fertilizers (sheep manure) and Pb2+; the 4 levels are blank, low, medium and high; a total of 16 treatments) pot orthogonal experiment. The effects of fertilizers on the growth and Pb content in various parts of pepper under Pb stress were analyzed. The results showed that: (1) The Pb content in pepper fruit ranged from 0.011 mg·kg−1 to 0.085 mg·kg−1, which did not exceed the limit value (0.1 mg·kg−1) in the National Standard for Food Safety-Limit of Contaminants in Food (GB2762-2017); (2) The effect order of fertilization on pepper fruit weight was P2O5 > sheep manure > N > K2O; The horizontal combination of factors that promoted the maximum fruit weight of pepper was N (0.15 g·kg−1), P2O5 (0.225 g·kg−1), K2O (0.15 g·kg−1) and sheep manure (9 g·kg−1); (3) The order of fertilizer effects on Pb content in pepper fruit was Pb2+ > K2O > N = sheep manure > P2O5; the factor level combination that resulted in the maximum Pb content in pepper fruits was N (0.15 g·kg−1), P2O5 (0 g·kg−1), K2O (0.45 g·kg−1), sheep manure (6 g·kg−1) and Pb2+ (350 mg·kg−1); (4) Based on the soil fertility characteristics of Urumqi, the recommended optimal fertilizer application rate was: high phosphorus fertilizer P2O5 (495 kg·hm−2), low-level potassium fertilizer K2O (330 kg·hm−2), medium-level nitrogen fertilizer N (660 kg·hm−2) (or low-level nitrogen fertilizer N (330 kg·hm−2) + high-level organic manure sheep manure (19,800 kg·hm−2), which can achieve high yield while ensuring that the Pb content in the fruits does not exceed the standard. Strengthening control of effective and reasonable fertilization methods in Urumqi agricultural land is helpful to reduce the Pb content in vegetables.

1. Introduction

Soil is the basis for plant growth, and the soil-plant system is the basic structural unit of the biosphere, which provides strong productivity for human beings. Soil is often limited by a low level of available nutrients, so fertilization is often necessary to replenish them. But, fertilization can introduce heavy metals into the soil [1]. Excessive use of fertilizers can lead to a decrease in soil pH, increase the availability of natural heavy metal lead (Pb) in soil, cause harm to soil physical properties, and then affect plant growth and development [2]. Lead from anthropogenic sources typically builds up mostly in the top layer of soil, and as depth increases, its concentration declines and only limited amounts of the lead in soil are thought to be soluble and hence available for plant uptake because of its high binding [3]. Due to the detrimental effects on soil microbiology, food safety and crop growth, lead accumulation in soils is a severe concern in agricultural production [4]. Lead’s speciation in soil has a significant impact on its bioavailability and, consequently, its toxicity to plants and microorganisms [5]. Studies have found that even short-term exposure of plants to the toxic effects of the heavy metal lead can lead to a significant reduction in their microbial activity; to counteract these effects, many plants and microorganisms have evolved detoxification mechanisms using organic colloidal components [6,7,8].
Nitrogen fertilizer is the most widely used fertilizer in agricultural production and plant cultivation, and can directly affect plant yield and quality. Through the root box test, it was found that ammonium nitrogen fertilizer could reduce the pH value of the foundation soil, improve the activity of Pb in the rhizosphere soil, and promote the absorption of Pb by maize, while the effect of nitrate nitrogen is the opposite [9]. Phosphorus is the second macronutrient necessary for plant growth. Existing studies indicate that phosphorus compounds could reduce the absorption of Pb by plants by enhancing the adsorption and complexation of soil colloid surfaces, on the other hand, the application of ammonium phosphorus fertilizer and calcium-phosphorus fertilizer would reduce soil pH value, and the decrease of pH value would increase the solubility and mobility of heavy metals, improve their bioavailability and toxicity, and promote the absorption of heavy metals by plants [10]. Potassium is also one of the essential nutrient elements for plant growth, mainly used to improve crop quality [11]. The research showed that K+ could compete with Pb2+ for adsorption sites on the surface of soil particles to increase the content of water-soluble and exchangeable Pb, thus increasing the content of its available state [12,13]. Organic fertilizer can not only improve soil fertility but also affect the form of heavy metals in soil and their absorption by plants [14,15]. Studies have shown that both the available Pb content and wheat absorption were significantly negatively correlated with the application of organic fertilizer, while the available Pb content in soil was significantly positively correlated with the amount of Pb absorbed by wheat [15,16]. The application of organic fertilizer could inhibit the absorption of Pb in soil by wheat [17]. Therefore, it is of great significance for the safe and sustainable development of agricultural products to understand the effects of nitrogen, phosphorus, potassium and organic fertilizers on the content of heavy metals in soil and plants [18,19].
Urumqi is the most distant inland city from the ocean in the world, with an average altitude of 680~920 m. It has a semi-arid continental climate with a large temperature difference between day and night, abundant solar and thermal resources, and its terrain and soil types are suitable for growing vegetables, rice and other crops [20]. The research showed that the average contents of Cd, Pb and Hg in farmland soil in Urumqi exceed the soil background value in Urumqi, of which the Pb content (24.83 mg·kg−1) is about the soil background value (17.95 mg·kg−1) 1.4 times, which has not yet exceeded the limit requirements in the “Evaluation Standards for Environmental Quality of Edible Agricultural Products Origin” (HJ 332-2006) (Pb ≤ 50 mg·kg−1), and is far lower than the “Soil Environmental Quality” (GB 15618-2018) The control standards (6.5 < pH ≤ 7.5, Pb ≤ 120 mg·kg−1) but there have been occurrences of Pb exceeding the standard in locally produced vegetables in Urumqi [21]. The previous data of our research group showed that when the lead content in the soil of Urumqi did not exceed the standard, improper fertilization would lead to excessive lead in the edible part of the radish. Therefore, exploring the effect of fertilization on the growth and Pb content of vegetables in Urumqi City can provide the theoretical basis for safe and reasonable fertilization. In this study, the common solanaceous vegetable pepper was taken as the object, and the effects of different levels of nitrogen, phosphorus and potassium fertilizer and organic fertilizer on the growth and Pb content of pepper under Pb stress were studied by pot orthogonal experiment in the shed [22].

2. Materials and Methods

2.1. Test Materials

The pepper variety tested was the improved pig large intestine (PLI) produced by Xi an Qinshu Agriculture Company(Xi’an, Shaanxi Province, China). The tested soil was chernozem soil purchased from Mingzhu Flower Market, Urumqi City (The soil comes from the soil of agricultural land around Urumqi City and is mainly used for planting fruits and vegetables), and the organic fertilizer was pure sheep dung fermented at high temperature from Bafang Zehui Company(Xi’an, Shaanxi Province, China). The basic physical and chemical properties of soil and organic manure (sheep manure) were shown in Table 1. The nitrogen fertilizer used in the experiment was urea (N 46%), the phosphate fertilizer was calcium triple superphosphate (P2O5 52%), the potassium fertilizer was potassium sulphate (K2O 54%), and Pb was added as an external compound Pb(NO3)2 (containing Pb2+ 62%).

2.2. Experimental Design

An orthogonal experiment L1645 (5 factors, 4 levels, a total of 16 treatments) was used to design and analyze the effects of the combined action of four fertilizers and Pb2+ on the Pb absorption of PLI. The five factors were N, P205, K2O, sheep manure and Pb2+. The four levels are blank, low, medium and high. The experiment is done by adding fertilizers and compounds to the soil. The five influencing factors in the experiment were added to the soil in the form of fertilizers and compounds. The orthogonal experimental design is shown in Table 2.
In this experiment, potted plants were used. In order to avoid the interference of rainwater, the experiment was carried out in the greenhouse behind the Agricultural Building of Xinjiang Agricultural University. The seedlings were raised on 7 April 2022, and a total of 48 flower pots were treated in 16 groups (3 repetitions in each group) on 14 May. 7 kg of soil were respectively loaded into the pots, and the corresponding fertilizer and Pb(NO3)2 of each treatment were evenly mixed into the soil according to Table 2 (the fertilizer was applied in the form of base fertilizer (60%) + top fertilizer (40%), and Pb(NO3)2 was applied at one time during the application of base fertilizer), and 1 L of distilled water was poured and left to stand. On 25 May, the PLI seedlings were transplanted into each flower pot, and one PLI was transplanted in each flower pot. Irrigation was carried out with distilled water. The irrigation amount was 1 L/pot every 5 days, and a total of 22 irrigations were carried out until harvest. The PLI received uniform natural light during the growing period and was harvested on 9 September 2022. Soil pH was measured after the PLI was harvested (Soil pH was extracted using a soil-water ratio of 2.5:1 and determined by a pH meter (Mettler Toledo FE28-Standard)).

2.3. Measurements and Methods

After harvesting the PLI, the plant height of the PLI was measured with a tape measure and the number of fruits was recorded. Then the PLI was divided into four parts: root, stem, leaf and fruit. The samples were rinsed and washed with deionized water 2–3 times, the surface moisture was dried, and the samples were weighed fresh. The plant samples were then dried at 105 °C for 30 min, dried in an oven at around 65 °C, ground and sieved, and stored for later use.
The total Pb content of plant and soil samples was determined by System 5000 graphite furnace atomic absorption spectrometer. The content of total nitrogen was determined by Kjeldahl method, the content of total phosphorus was determined by molybdenum-antimony colorimetric method, and the content of total potassium was determined by flame photometry. The organic matter content was heated by potassium bichromate. The available phosphorus content was determined by sodium bicarbonate extraction and molybdenum-antimony sulfate resistance colorimetric method. The content of available potassium was determined by ammonium acetate extraction and flame photometer method.

2.4. Data Analysis

Microsoft Excel 2010, IBM SPSS Statistics 25.0 and Orthogonal Design Assistant II v3.1 were used for statistical analysis of the data. Pb content was calculated as fresh weight, with Mean ± SD value. Plot with Origin 2018 and Sigmaplot 10.0 software.

3. Results

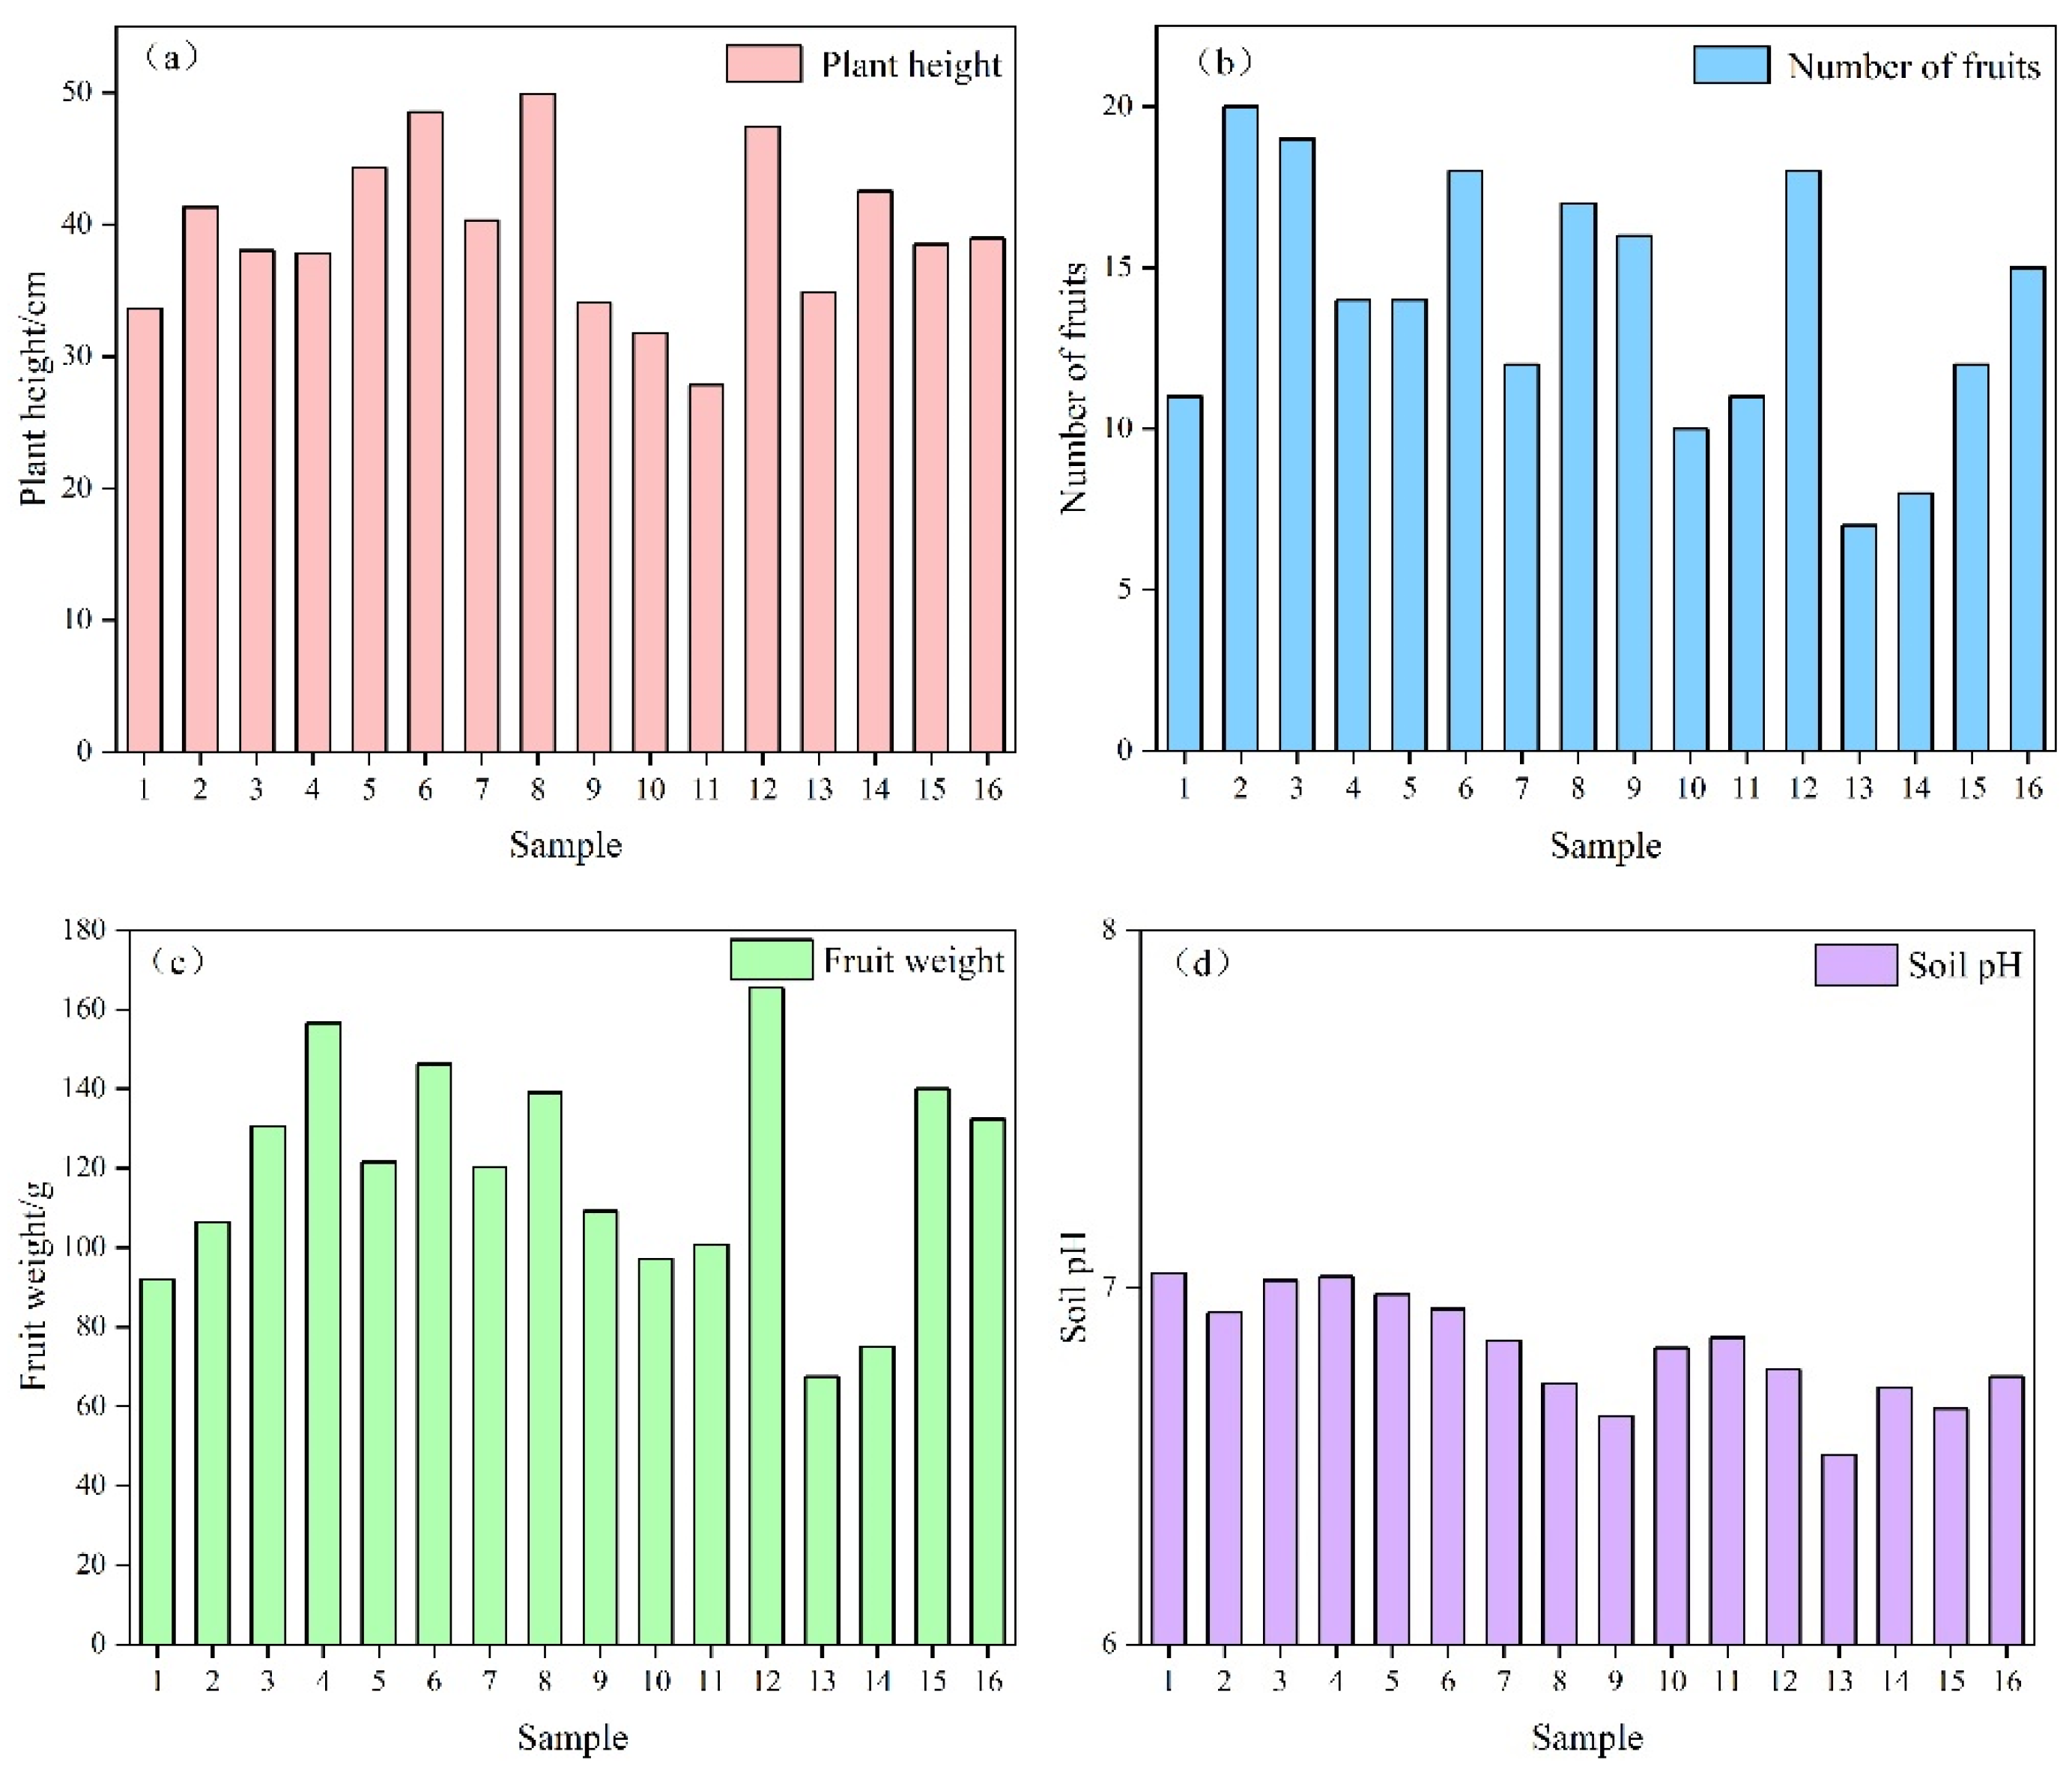
3.1. Effects of Fertilization on Plant Height and Fruit Weight of PLI under Pb Stress

As can be seen from Figure 1, The highest PLI plant height in the 8th group was 49.87 cm, while the lowest PLI plant height in the 11th group was 27.83 cm; the highest number of PLI fruits in the 2nd group was 20, and the lowest number of PLI fruits in the 13th group was 7; the highest PLI fruit weight in the 12th group was 165.47 g, and the lowest PLI fruit weight in the 13th group was 67.50 g. Most of the soil pH was weakly acidic except for groups 1, 3 and 4.
According to Table 3, the factors affecting the plant height of PLI in order of importance were: A (N) > B (P2O5) > C (K2O) > E (Pb2+) > D (sheep manure), and N fertilizer has the greatest influence on PLI plant height. It can be seen from the K value that the level combination of factors that promote PLI plant height to reach the maximum is: A2 B4 C2 D1 E3, namely N (0.15 g·kg−1), P2O5 (0.225 g·kg−1), K2O (0.15 g·kg−1), sheep manure (0 g·kg−1), Pb2+ (100 mg·kg−1); The level combination of factors contributing to the minimum plant height of PLI was as follows: A3 B3 C4 D3 E4, namely N (0.3 g·kg−1), P2O5 (0.15 g·kg−1), K2O (0.45 g·kg−1), sheep manure (6 g·kg−1), Pb2+ (350 mg·kg−1).
The main and secondary influencing factors of different fertilizer applications on PLI fruit weight were as follows: B (P2O5) > D (sheep manure) > A (N)> C (K2O) > E (Pb2+), phosphorus fertilizer had the greatest effect on PLI fruit weight. The horizontal combination of factors that promote the maximum fruit weight of PLI is: A2 B4 C2 D4 E3, namely N (0.15 g·kg−1), P2O5 (0.225 g·kg−1), K2O (0.15 g·kg−1), sheep manure (9 g·kg−1), Pb2+ (100 mg·kg−1); The horizontal combinations of factors that promoted PLI fruit weight to reach the minimum value were: A4 B1 C4 D2 E4, namely N (0.45 g·kg−1), P2O5 (0 g·kg−1), K2O (0.45 g·kg−1), sheep manure (3 g·kg−1), Pb2+ (350 mg·kg−1).
As can be seen from Figure 2, nitrogen fertilizer was positively correlated with PLI plant height, phosphorus fertilizer was significantly positively correlated with PLI fruit weight (p < 0.05), and nitrogen fertilizer was significantly negatively correlated with soil pH value (p < 0.05).

3.2. Analysis of Pb Content in PLI

The results of Pb content determination in PLI were shown in Table 4. As can be seen from Table 4, the Pb content range of different parts of PLI in each treatment was generally in the order of root (0.104~1.086 mg·kg−1) > stem (0.032~0.298 mg·kg−1) > leaf (0.022~0.072 mg·kg−1), indicating that Pb was mainly concentrated in the root. Pb content in fruits ranged from 0.011 mg·kg−1 to 0.085 mg·kg−1, among which the highest Pb content in fruits treated 16 was 0.085 mg·kg−1, but it did not exceed the limit (0.1 mg·kg−1) in the “National Standard for Food Safety-Limit of Pollutants in Food” (GB 2762-2017).
The variance analysis of Pb content in different parts of PLI applied with different kinds of fertilizer is shown in Figure 3. The difference in Pb content in different parts of PLI under different treatments shows that there is no significant difference in Pb content in different parts of PLI in groups 1, 7, 15 and 16. Pb content in the roots and stems of PLI in groups 3, 5 and 11 was significantly different from that in the leaves and fruits. The Pb content in the roots of PLI in groups 2 and 6 was significantly different from that in the leaves and fruits. Pb content in the roots of PLI seedlings in groups 4 and 13 was significantly different from that in stems, leaves and fruits. The Pb content in the roots of group 14 was significantly higher than that in stems, leaves and fruits, and the Pb content in stems, leaves and fruits also showed significant differences, The content of Pb in roots was significantly different from that in stems, leaves and fruits.
In addition, the difference between groups in the same part of PLI under different treatments was as follows: the Pb content of group 14 in the root was significantly different from that of group 7 and group 15; Pb content in the stems of group 11 was significantly different from that in the stems of group 4. Pb content in leaf group 7 was significantly different from that in groups 1, 2, 3, 5, 6, 8, 9, 10, 11, 12, 13 and 15. Pb content in fruit group 7 was significantly different from that in groups 2, 3, 8, 9, 12, 13, 14, 15 and 16.

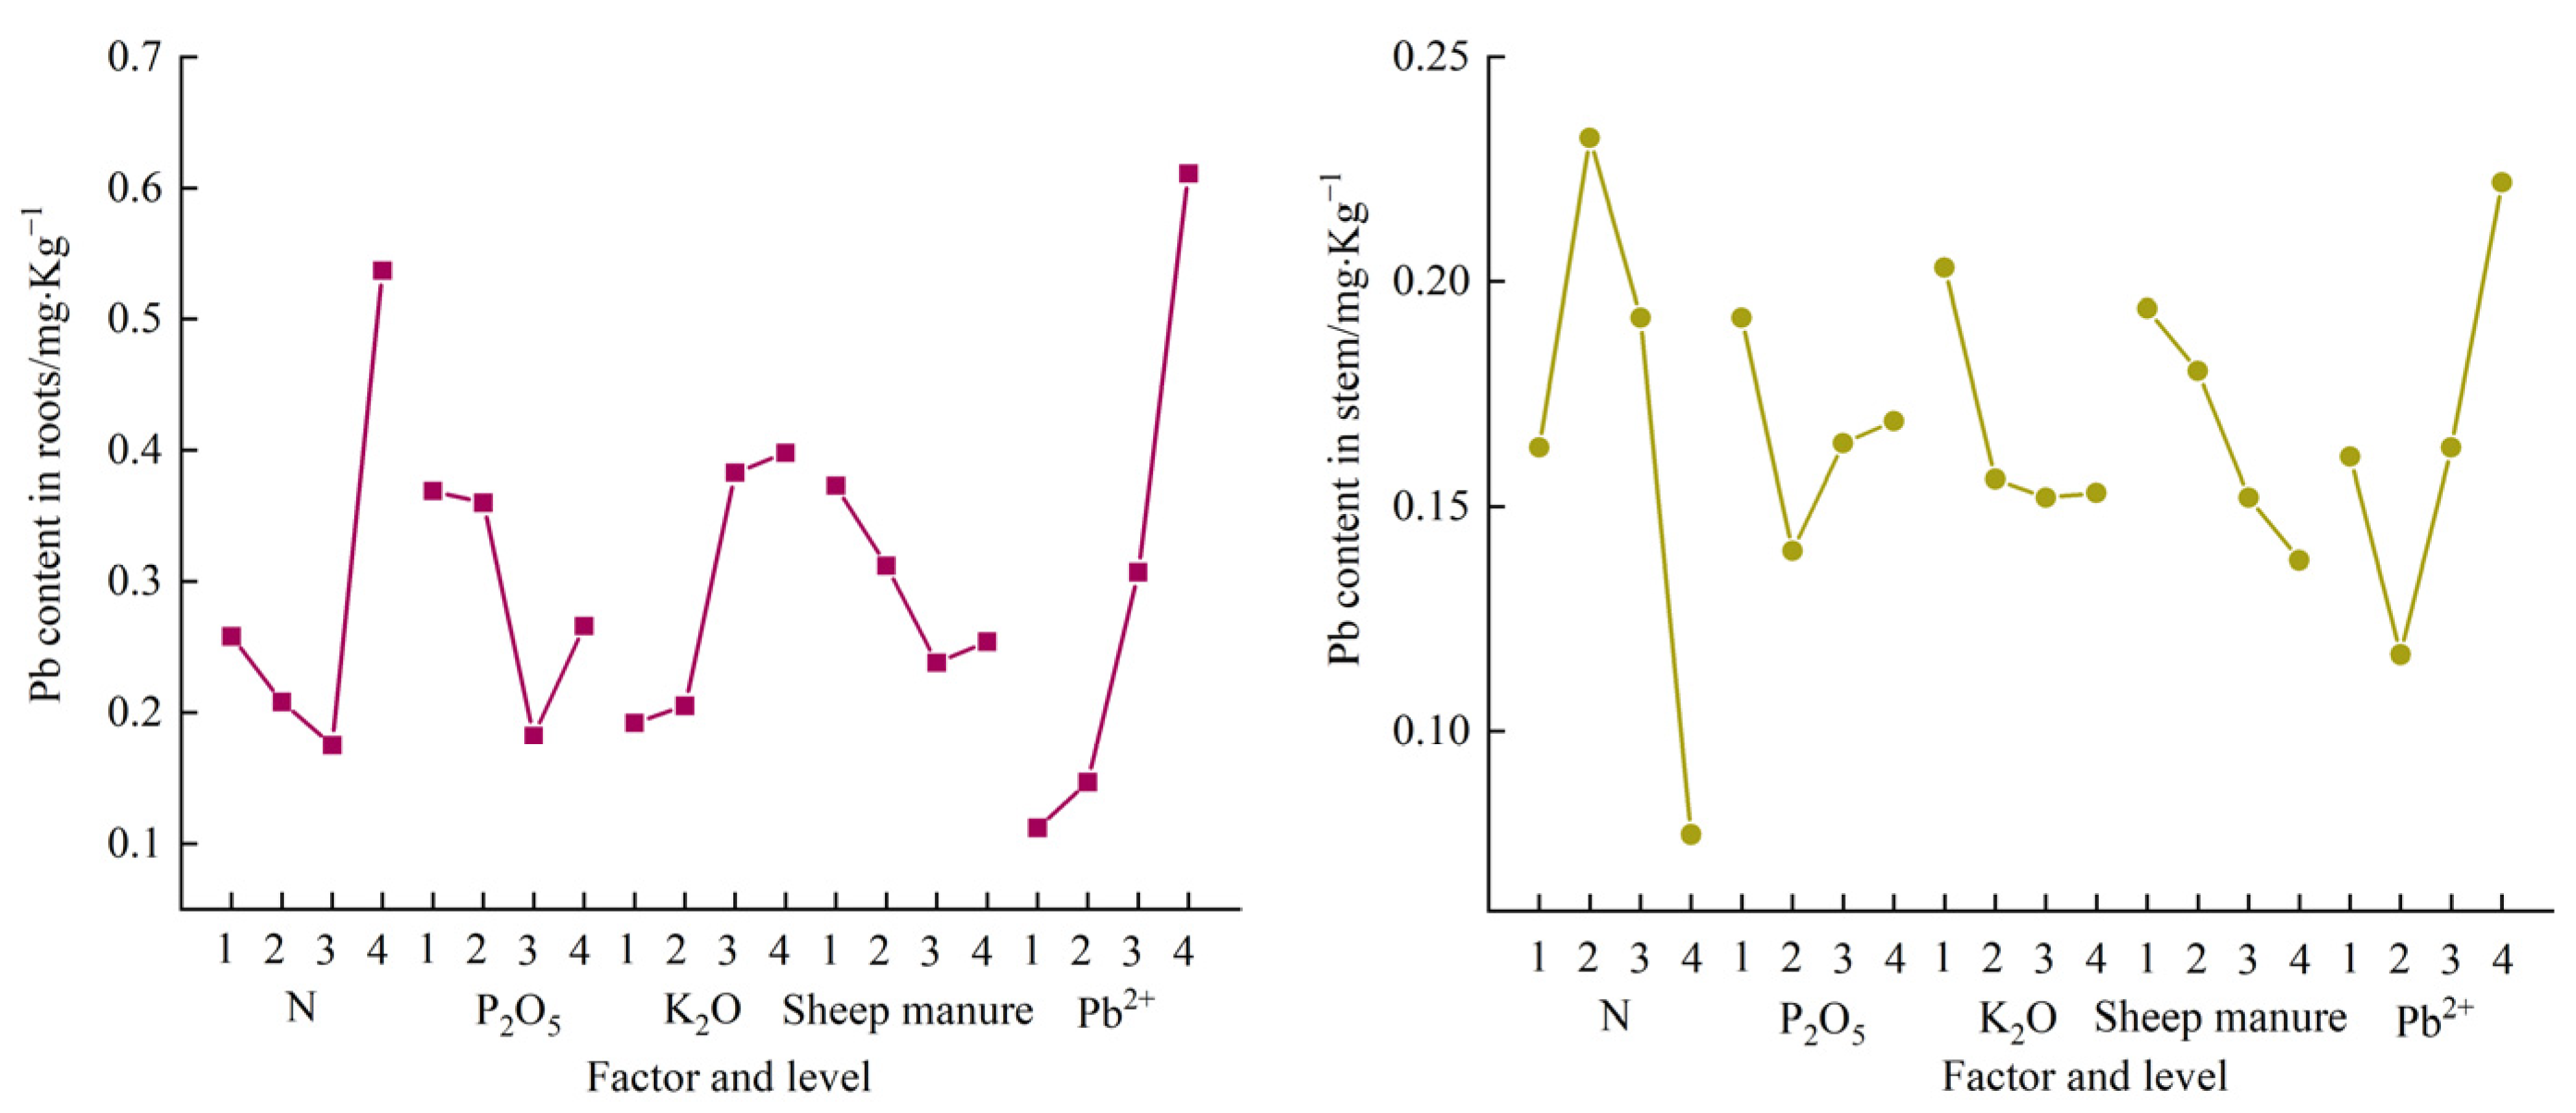
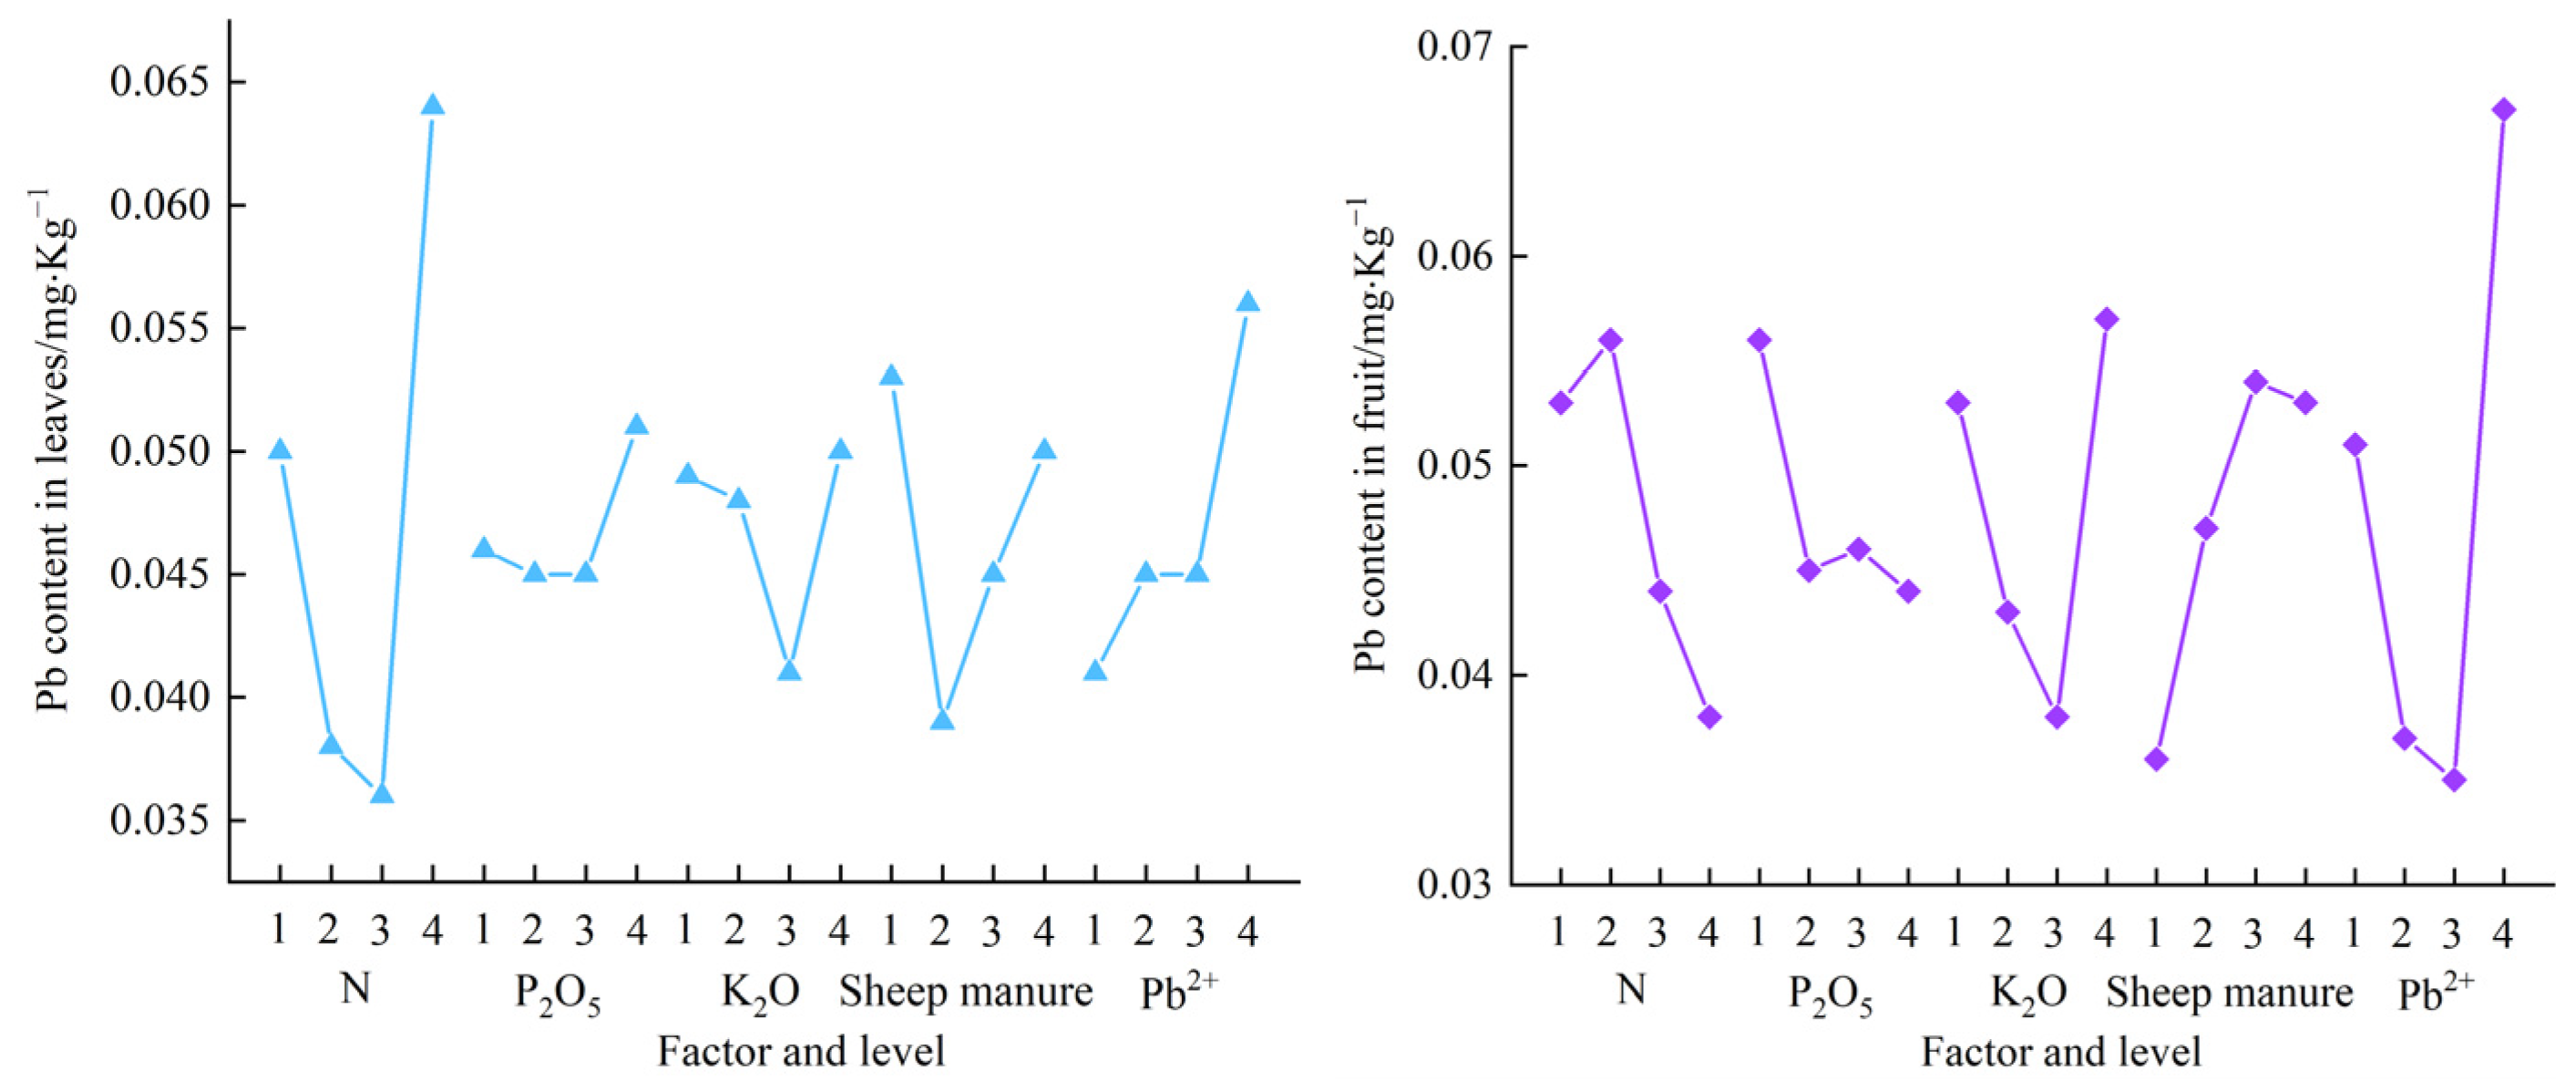
3.3. Effects of Fertilization on Pb Content in PLI under Pb Stress

According to the R-value in Table 5, the main and secondary influencing factors of different fertilizers on Pb content in PLI roots were as follows: E (Pb2+) > A (N) > C (K2O) > B (P2O5) > D (sheep manure), and Pb2+ had the greatest influence on Pb content in PLI roots. It can be seen from the K value that the combination of factors that promote the maximum Pb content in PLI root is as follows: A4 B1 C4 D1 E4, namely N (0.45 g·kg−1), P2O5 (0 g·kg−1), K2O (0.45 g·kg−1), sheep manure (0 g·kg−1), Pb2+ (350 mg·kg−1); The level combination of factors to promote the minimum Pb content in PLI root was as follows: A3 B3 C1 D3 E1, namely N (0.3 g·kg−1), P2O5 (0.15 g·kg−1), K2O (0 g·kg−1), sheep manure (6 g·kg−1), Pb2+ (0 mg·kg−1).
The main and secondary influencing factors on Pb content in PLI fruit were as follows: E (Pb2+) > C (K2O) > A (N) = D (sheep manure) > B (P2O5), and Pb2+ had the greatest influence on Pb content in PLI fruit. The combination of factors that promote the maximum Pb content of PLI fruit is as follows: A2 B1 C4 D3 E4, namely N (0.15 g·kg−1), P2O5 (0 g·kg−1), K2O (0.45 g·kg−1), sheep manure (6 g·kg−1), Pb2+ (350 mg·kg−1); The combination of factors that promote the minimum Pb content of PLI fruit is as follows: A4 B4 C3 D1 E3, namely N (0.45 g·kg−1), P2O5 (0.225 g·kg−1), K2O (0.3 g·kg−1), sheep manure (0 g·kg−1), Pb2+ (100 mg·kg−1).

3.4. Effect of Fertilization Level on Pb Content in PLI under Pb Stress

The correlation analysis of various indicators of soil and PLI is shown in Figure 4. The Pb content of PLI roots is significantly positively correlated with the Pb content of leaves, and the Pb content of PLI stems and fruits is significantly positively correlated. The ratio of PLI stem to root and shoot showed a significant negative correlation; soil Pb content was significantly positively correlated with plant height, and plant height was significantly positively correlated with fruit weight.
The linear relationship between Pb content in different parts of PLI and different fertilizer applications is shown in Table 6. The variation trend of lead content in each part of PLI is shown in Figure 5. According to Table 6 and Figure 5, we can find that there was a significant negative correlation between sheep manure and Pb content in PLI stems (r =−0.990, p = 0.010). Pb2+ was positively correlated with Pb content in root (r = 0.993, p = 0.007), and Pb content in leaf (r = 0.979, p = 0.021). There was no significant correlation between Pb content in different parts of PLI and other fertilizers.

4. Discussion

Fertilization is one of the important agricultural measures to ensure the increase of agricultural production and income, and it also affects the adsorption and resolution of heavy metals in soil, the physicochemical properties of rhizosphere soil and the absorption of heavy metals by crops [23]. Pb is a non-essential element for plants, thus it is hazardous even in low quantities. It easily passes from the soil and atmosphere to plants [2].
Nitrogen is an essential element for plant growth and is contained in the composition of vitamins and energy systems in plants [24]. In this experiment, there was a positive correlation between nitrogen fertilizer and plant height of PLI, that is, the increase of nitrogen fertilizer would promote the growth of plant height. The study showed that the average growth rate and plant height of plants increased when the nitrogen supply of plants increased, which was consistent with the results of this experiment. However, nitrogen application is considered to be the main driving factor of soil acidification, because the input of nitrogen fertilizer will make the nitrogen in the soil easy to nitrate, and the generated NO3 will produce H+, which is easy to leach out of the soil with base ions [25]. The study showed that the nitrification of nitrogen in the soil would produce a large number of protons and lead to a decrease in soil pH, while the addition of fertilizer nitrogen in the soil would lead to more significant soil acidification [25]. In this experiment, there was a significant negative correlation between nitrogen fertilizer and soil pH value, that is, the increase of nitrogen fertilizer led to the decrease of soil pH value. The decrease in soil pH can increase the content of extractable heavy metal elements in soil, improve the bioavailability of heavy metals, and enable plants to enrich more heavy metals [26]. Therefore, attention should be paid to the decrease in soil pH value caused by nitrogen fertilizer application.
Rational application of phosphorus fertilizer can increase crop yield, improve crop quality, promote flowering and fruit of jacket vegetables, and improve results. The research showed that after applying phosphorus fertilizer, the yield of PLI increased with the increase of phosphorus application, and the yield was the highest at the highest phosphorus application [18,27]. In this experiment, there was a significant positive correlation between phosphorus fertilizer and PLI fruit weight, that is, the increase of phosphorus fertilizer would increase PLI fruit weight, possibly because phosphorus would participate in the metabolism and transportation of PLI carbohydrates, which is conducive to the growth of PLI fruit.
Organic fertilizer can not only improve soil fertility but also affect the form of heavy metals in soil and their absorption by plants [15,28]. In this experiment, the content of organic fertilizer was negatively correlated with the Pb content in the roots of PLI and significantly negatively correlated with the Pb content in the stems. Pb intake studies in plants revealed that roots have the ability to absorb large amounts of Pb while limiting their translocation to higher parts of the plant [9,29]. This may be because organic fertilizer has a fixed effect, including the adsorption of heavy metals by macromolecules of solid organic matter and clay minerals in the soil, limiting its mobility and reducing the availability of heavy metals [30]. Moreover, after entering the root, ions are transported to the xylem through both ectoplasmic and symplast pathways, and then to the aboveground part. However, the low permeability of the ectoplasmic barrier to heavy metal ions makes it difficult for Pb to transfer to the stem of PLI [2].
In this experiment, the Pb content in the roots of group 14 was significantly higher than that in stems, leaves and fruits, and the Pb content in stems, leaves and fruits also showed significant differences, which may be because high levels of Pb2+ were enriched in PLI roots through cation adsorption, oxidation and reduction reactions of exchange complexes and because heavy metals in roots were not easily transported upward from stems. Pb content in the stems of group 11 was significantly different from that in the stems of group 4, which may be due to the application of high-concentration organic fertilizer, which resulted in the chelation of Pb2+ with organic matter and other metal oxides, which restricted its mobility and reduced the absorption and transport capacity of Pb in the stems of PLI. Pb content in fruit group 7 was significantly different from that in groups 2, 3, 8, 9, 12, 13, 14, 15 and 16, which may be because potassium plays an important role in plant energy metabolism, acting as a cofactor or activator of many enzymes in carbohydrate and protein metabolism. In addition to helping the roots to absorb Pb from the soil and transfer it from the stem to the leaves, it can also accelerate the process of Pb absorption by the leaf surface itself.
According to the statistics of soil census data, the total nitrogen content of cultivated soil in Urumqi city was 1.13 g·kg−1, the total phosphorus content was above 0.8 g·kg−1 and the total potassium content was about 19.28g·kg−1, showing the phenomenon of nitrogen deficiency, phosphorus deficiency and potassium enrichment [31]. Pb content in soil is relatively low, generally < 100 mg·kg−1.In view of the fact that the Pb content of all PLI fruits treated in this experiment is not beyond the standard, the optimal fertilizer application can be recommended according to the factor level combination (A2 B4 C2 D4) that promotes the maximum fruit weight of PLI: N (330 kg·hm−2), P2O5 (495 kg·hm−2), K2O (330 kg·hm−2), sheep manure (19,800 kg·hm−2); Or according to the combination of treatment 12 with the maximum fruit weight (A3 B4 C2 D1), namely N (660 kg·hm−2), P2O5 (495 kg·hm−2), K2O (330 kg·hm−2), sheep manure (0 kg·hm−2), both of which were treated with high-level phosphorus fertilizer and low-level potassium fertilizer. medium level of nitrogen fertilizer (or low level of nitrogen fertilizer + high level of organic fertilizer) can achieve a higher yield and not exceed the standard of Pb in fruit.

5. Conclusions

(1) The Pb content in PLI fruit ranged from 0.011 mg·kg−1 to 0.085 mg·kg−1, which did not exceed the limit (0.1 mg·kg−1) in the National Standard for Food Safety-Limit of Pollutants in Food (GB 2762-2017).
(2) The effect order of fertilization on fruit weight of PLI was P2O5 > sheep manure > N > K2O > Pb2+; The horizontal combination of factors that promoted PLI fruit weight to reach the maximum value were N (0.15 g·kg−1), P2O5 (0.225 g·kg−1), K2O (0.15 g·kg−1), sheep manure (9 g·kg−1), Pb2+ (100 mg·kg−1).
(3) The effects of fertilization on Pb content in PLI fruit were as follows: Pb2+ > K2O > N = sheep manure > P2O5; The level combination of factors that promoted the maximum Pb content in PLI fruit was N (0.15 g·kg−1), P2O5 (0 g·kg−1), K2O (0.45 g·kg−1), sheep manure (6 g·kg−1), Pb2+ (350 mg·kg−1). There was a significant negative correlation between sheep manure and Pb content in PLI stem (r = −0.990, p = 0.010). There was a significant positive correlation between Pb2+ and Pb content in the root (r = 0.993, p = 0.007) and in the leaf (r = 0.979, p = 0.021). There was no significant correlation between Pb content in different parts of PLI and other fertilizers.
(4) Recommended optimal fertilizer application: high-level phosphorus fertilizer P2O5 (495 kg·hm−2), low-level potassium fertilizer K2O (330 kg·hm−2), medium-level nitrogen fertilizer N (660 kg·hm−2) (or low-level nitrogen fertilizer N (330 kg·hm−2) + high-level organic manure sheep manure (19,800 kg·hm−2), Can achieve high yield and fruit Pb does not exceed the standard.

Author Contributions

Writing—original draft preparation, B.Y.; data curation, D.X.; supervision, Y.L.; funding acquisition, W.W. All authors have read and agreed to the published version of the manuscript.

Funding

This research was funded by [the National Natural Science Foundation of China] grant number [No.21866030] and the APC was funded by [No.21866030].

Institutional Review Board Statement

Not applicable.

Informed Consent Statement

Informed consent was obtained from all subjects involved in the study. Written informed consent has been obtained from the patient(s) to publish this paper.

Data Availability Statement

Unable to obtain data due to privacy concerns.

Conflicts of Interest

The authors declare no conflict of interest.

References

  1. Shaheen, N.; Irfan, N.; Khan, I.N.; Islam, S.; Islam, S.; Ahmed, K. Presence of heavy metals in fruits and vegetables: Health risk implications in bangladesh. Chemosphere 2016, 152, 431–438. [Google Scholar] [CrossRef] [PubMed]
  2. Khatun, J.; Intekhab, A.; Dhak, D. Effect of uncontrolled fertilization and heavy metal toxicity associated with arsenic(As), lead(Pb) and cadmium (Cd), and possible remediation. Toxicology 2022, 477, 153274. [Google Scholar] [CrossRef]
  3. Cecchi, M.; Dumat, C.; Alric, A.; Felix-Faure, B.; Pradere, P.; Guiresse, M. Multi-metal contamination of a calcic cambisol by fallout from a lead-recycling plant. Geoderma 2008, 144, 287–298. [Google Scholar] [CrossRef]
  4. Lipiec, J.; Hatano, R. Quantification of compaction effects on soil physical properties and crop growth. Geoderma 2003, 116, 107–136. [Google Scholar] [CrossRef]
  5. Kushwaha, A.; Hans, N.; Kumar, S.; Rani, R. A Critical review on speciation, mobilization and toxicity of lead in soil-microbe-plant system and bioremediation strategies. Ecotoxicol. Environ. Saf. 2018, 147, 1035–1045. [Google Scholar] [CrossRef]
  6. Kopittke, P.M.; Asher, C.J.; Menzies, N.W. Prediction of Pb speciation in concentrated and dilute nutrient solutions. Environ. Pollut. 2008, 153, 548–554. [Google Scholar] [CrossRef] [PubMed]
  7. Punamiya, P.; Datta, R.; Sarkar, D.; Barber, S.; Patel, M.; Das, P. Symbiotic role of glomus mosseae in phytoextraction of lead in vetiver grass [Chrysopogon zizanioides (L.)]. J. Hazard. Mater. 2010, 177, 465–474. [Google Scholar] [CrossRef]
  8. Kopittke, P.M.; Asher, C.J.; Blamey, F.P.C.; Auchterlonie, G.J.; Guo, Y.N.; Menzies, N.W. Localization and chemical speciation of Pb in roots of signal grass (Brachiaria decumbens) and rhodes grass (Chloris gayana). Environ. Sci. Technol. 2008, 42, 4595–4599. [Google Scholar] [CrossRef]
  9. Qin, J.; Zhao, H.; Liu, H.; Dai, M.; Zhao, P.; Chen, X.; Wu, X. The difference of lead accumulation and transport in different ecotypes of miscanthus floridulus. Processes 2022, 10, 2219. [Google Scholar] [CrossRef]
  10. Basta, N.T.; McGowen, S.L. Evaluation of chemical immobilization treatments for reducing heavy metal transport in a smelter-contaminated soil. Environ. Pollut. 2004, 127, 73–82. [Google Scholar] [CrossRef]
  11. Jiang, Y.; Zhou, P.; Ma, T.; Adeel, M.; Shakoor, N.; Li, Y.; Li, M.; Guo, M.; Rui, Y. Effects of two Mn-based nanomaterials on soybean antioxidant system and mineral element homeostasis. Environ. Sci. Pollut. Res. 2022, 30, 18880–18889. [Google Scholar] [CrossRef] [PubMed]
  12. Tu, C.; Zheng, C.R.; Chen, H.M. Effect of applying chemical fertilizers on forms of lead and cadmium in red soil. Chemosphere 2000, 41, 133–138. [Google Scholar] [CrossRef] [PubMed]
  13. Chen, Q.; Zhang, H.; Ye, J.; Tao, G.; Nimbalkar, S. Corrosion resistance and compressive strength of cemented soil mixed with nano-silica in simulated seawater environment. KSCE J. Civ. Eng. 2023, 27, 1535–1550. [Google Scholar] [CrossRef]
  14. Han, F.; Wu, L. Industrial Solid Waste Recycling in Western China; Springer: Singapore, 2019; ISBN 9789811380853. [Google Scholar]
  15. Guo, B.; Hong, C.; Tong, W.; Xu, M.; Huang, C.; Yin, H.; Lin, Y.; Fu, Q. Health Risk Assessment of Heavy Metal Pollution in a Soil-Rice System: A Case Study in the Jin-Qu Basin of China. Sci. Rep. 2020, 10, 11490. [Google Scholar] [CrossRef]
  16. Aihemaiti, A.; Chen, J.; Hua, Y.; Dong, C.; Wei, X.; Yan, F.; Zhang, Z. Effect of ferrous sulfate modified sludge biochar on the mobility, speciation, fractionation and bioaccumulation of vanadium in contaminated soil from a mining area. J. Hazard. Mater. 2022, 437, 129405. [Google Scholar] [CrossRef]
  17. Combined Effects of Straw Return with Nitrogen Fertilizer on Ion Balance, Photosynthetic Characteristics, Leaf Water Status and Rice Yield in Saline-Sodic Paddy Fields Research Square. Available online: https://www.researchsquare.com/article/rs-2545065/v1 (accessed on 7 July 2023).
  18. Chen, G.; Peng, L.; Li, C.; Tu, Y.; Lan, Y.; Wu, C.; Duan, Q.; Zhang, Q.; Yang, H.; Li, T. Effects of potassium application rate on lipid synthesis and eating quality of two rice cultivars. J. Integr. Agric. 2023, 22, 2025–2040. [Google Scholar] [CrossRef]
  19. Li, Z.; Fan, R.; Peng, X.; Shu, J.; Liu, L.; Wang, J.; Lin, L. Salicylic acid alleviates selenium stress and promotes selenium uptake of grapevine. Physiol. Mol. Biol. Plants 2022, 28, 625–635. [Google Scholar] [CrossRef]
  20. Peng, L.; Li, X.; Sun, X.; Yang, T.; Zhang, Y.; Gao, Y.; Zhang, X.; Zhao, Y.; He, A.; Zhou, M.; et al. Comprehensive Urumqi screening for potentially toxic metals in soil-dust-plant total environment and evaluation of children’s (0–6 Years) risk-based blood lead levels prediction. Chemosphere 2020, 258, 127342. [Google Scholar] [CrossRef]
  21. Li, W.; Wang, S.; Wufuer, R.; Duo, J.; Pan, X. Distinct soil microplastic distributions under various farmland-use types around Urumqi, China. Sci. Total Environ. 2023, 857, 159573. [Google Scholar] [CrossRef]
  22. Keady, T.W.J.; O’Kiely, P. An evaluation of Potassium and nitrogen fertilization of grassland, and date of harvest, on fermentation, effluent production, dry-matter recovery and predicted feeding value of silage. Grass Forage Sci. 1998, 53, 326–337. [Google Scholar] [CrossRef]
  23. Zhao, D.; Xie, D.; Yin, F.; Liu, L.; Feng, J.; Ashraf, T. Estimation of Pb content using reflectance spectroscopy in farmland soil near metal mines, central China. Remote Sens. 2022, 14, 2420. [Google Scholar] [CrossRef]
  24. Hu, W.; Guan, Y.; Ji, Y.; Yang, X. Effect of Cutting Styles on Quality, Antioxidant Activity, Membrane Lipid Peroxidation, and Browning in Fresh-Cut Potatoes. Food Biosci. 2021, 44, 101435. [Google Scholar] [CrossRef]
  25. Tian, D.; Niu, S. A global analysis of soil acidification caused by nitrogen addition. Environ. Res. Lett. 2015, 10, 024019. [Google Scholar] [CrossRef]
  26. Cui, Y.; Dong, Y.; Li, H.; Wang, Q. Effect of elemental sulphur on solubility of soil heavy metals and their uptake by maize. Environ. Int. 2004, 30, 323–328. [Google Scholar] [CrossRef] [PubMed]
  27. Agnihotri, P. Effect of Rhizobium, Phosphorus and Sulphur on Yield and Quality of Black Gram (Vigna mungo L.). Ph.D. Thesis, Veer Bahadur Singh Purvanchal University, Jaunpur, India, 2020. [Google Scholar]
  28. Liu, X.; Ju, Y.; Mandzhieva, S.; Pinskii, D.; Minkina, T.; Rajput, V.D.; Roane, T.; Huang, S.; Li, Y.; Ma, L.Q.; et al. Sporadic Pb accumulation by plants: Influence of soil biogeochemistry, microbial community and physiological mechanisms. J. Hazard. Mater. 2023, 444, 130391. [Google Scholar] [CrossRef]
  29. Usman, K.; Abu-Dieyeh, M.H.; Zouari, N.; Al-Ghouti, M.A. Lead (Pb) bioaccumulation and antioxidative responses in tetraena qataranse. Sci. Rep. 2020, 10, 17070. [Google Scholar] [CrossRef]
  30. Li, S.; Li, J.; Zhang, B.; Li, D.; Li, G.; Li, Y. Effect of different organic fertilizers application on growth and environmental risk of nitrate under a vegetable field. Sci. Rep. 2017, 7, 17020. [Google Scholar] [CrossRef]
  31. Gong, X.; Feng, Y.; Dang, K.; Jiang, Y.; Qi, H.; Feng, B. Linkages of microbial community structure and root exudates: Evidence from microbial nitrogen limitation in soils of crop families. Sci. Total Environ. 2023, 881, 163536. [Google Scholar] [CrossRef] [PubMed]
Figure 1. PLI growth indexes and soil pH table of each group. (a) shows the data of pepper plant height under different treatments, (b) shows the data of pepper fruit number under different treatments, (c) shows the data of pepper fruit weight under different treatments, (d) shows the data of soil pH under different treatments.
Plants 12 02960 g001
Figure 2. Effects of fertilization on PLI plant height, fruit weight and soil pH. Note: R values represent correlation, p values represent significance.
Plants 12 02960 g002
Figure 3. Lead content and variance analysis of PLI in different parts and under different treatments. Note: Different capital letters indicate that at the p < 0.05 level, Pb content in the same PLI parts under different treatments is significantly different; different lowercase letters indicate that at the p < 0.05 level, Pb content in different PLI parts under the same treatment is significantly different.
Plants 12 02960 g003
Figure 4. Correlation analysis of various indicators between soil and PLI. Note: The figure represents the Pb content in each part of the root, stem, leaf and fruit.
Plants 12 02960 g004
Figure 5. Effects of fertilization on Pb content in PLI under Pb stress.
Plants 12 02960 g005aPlants 12 02960 g005b
Table 1. Basic physicochemical properties of soil and organic fertilizer (sheep manure).
SampleTotal nitrogenTotal phosphorusTotal potassiumAvailable nitrogenAvailable phosphorus
/g·kg−1/g·kg−1/g·kg−1/mg·kg−1/mg·kg−1
Soil9.361.841.8780.9142.16
Organic fertilizer12.792.3922.7395.3761.96
SampleAvailable potassiumOrganic matterConductivityPbpH
/g·kg−1/g·kg−1/ms·cm−1/mg·kg−1
Soil0.11127.582.3715.747.21
Organic fertilizer0.18227.361.752.197.09
Table 2. Orthogonal experimental design.
SampleFactor LevelConcentration
ABCDENP2O5K2OSheep ManurePb2+
NP2O5K2OSheep ManurePb2+/g·kg−1/g·kg−1/g·kg−1/g·kg−1/mg·kg−1
11111100000
21222200.0750.15330
31333300.1500.306100
41444400.2250.459350
5212340.1500.156350
6221430.150.07509100
7234120.150.1500.45030
8243210.150.2250.3030
9313420.3000.30930
10324310.300.0750.4560
11331240.300.15003350
12342130.300.2250.150100
13414230.4500.453100
14423140.450.0750.300350
15432410.450.1500.1590
16441320.450.2250630
Table 3. Range analysis of fertilization on PLI plant height, fruit weight and soil pH.
SampleParameterABCDE
NP2O5K2OSheep ManurePb2+
Plant heightK137.70836.71737.24240.98338.433
K245.75841.03342.89238.47538.675
K335.26736.17541.12538.25842.216
K438.71743.52536.19139.73338.125
R10.4917.3506.7012.7254.091
Main and secondary order: A(N) > B(P2O5) > C(K2O) > E(Pb2+) > D(Sheep manure)
Highest level A2 B4 C2 D1 E3
Minimum level A3 B3 C4 D3 E4
Fruit weightK1121.35597.530117.808113.173116.813
K2131.550106.237133.402103.215117.077
K3118.155122.913113.222120.438127.420
K4103.767148.148110.395138.002113.518
R27.78350.61823.00734.78713.902
Main and secondary order: B(P2O5) > D(Sheep manure) > A(N) > C(K2O) > E(Pb2+)
Highest level A2 B4 C2 D4 E3
Minimum level A4 B1 C4 D2 E4
Soil pHK16.9736.8056.8976.8456.815
K26.8826.8556.8436.7636.792
K36.7756.8156.7456.8706.783
K46.6656.8206.8106.8176.905
R0.3080.0500.1520.1070.122
Main and secondary order: A(N) > C(K2O) > E(Pb2+) > D(Sheep manure) > B(P2O5)
Highest level A1 B2 C1 D3 E4
Minimum level A4 B1 C3 D2 E3
Note: K1, K2, K3 and K4 are the sum of the indicators at each level of each factor, K1 represents the sum of the values of the test indicators corresponding to the “1” level. R is called the range, and the largest K is subtracted from the smallest K.
Table 4. Pb content in PLI (fresh weight).
SamplePb2+ Content/mg·kg−1
RootStemLeafFruit
10.126 ± 0.0140.249 ± 0.0230.052 ± 0.0180.058 ± 0.004
20.104 ± 0.0210.092 ± 0.0140.040 ± 0.0060.034 ± 0.005
30.191 ± 0.0020.130 ± 0.0280.039 ± 0.0050.035 ± 0.010
40.610 ± 0.0170.181 ± 0.0120.069 ± 0.0130.083 ± 0.002
50.455 ± 0.0260.290 ± 0.0050.046 ± 0.0090.085 ± 0.009
60.144 ± 0.0180.212 ± 0.0290.039 ± 0.0040.050 ± 0.010
70.131 ± 0.0360.195 ± 0.0290.044 ± 0.0100.043 ± 0.003
80.104 ± 0.0010.230 ± 0.0190.022 ± 0.0120.046 ± 0.013
90.149 ± 0.0380.128 ± 0.0260.031 ± 0.0140.038 ± 0.002
100.106 ± 0.0040.133 ± 0.0150.030 ± 0.0080.061 ± 0.010
110.295 ± 0.0000.298 ± 0.0250.038 ± 0.0080.067 ± 0.002
120.148 ± 0.0220.209 ± 0.0200.045 ± 0.0070.011 ± 0.003
130.746 ± 0.1030.102 ± 0.0240.056 ± 0.0070.042 ± 0.009
141.086 ± 0.0220.121 ± 0.0300.072 ± 0.0110.033 ± 0.008
150.112 ± 0.0330.032 ± 0.0090.060 ± 0.0030.040 ± 0.012
160.202 ± 0.0120.054 ± 0.0100.067 ± 0.0090.035 ± 0.014
Min~Max0.104~1.0860.032~0.2980.022~0.0720.011~0.085
Table 5. Range analysis table of the effect of fertilization on Pb content in PLI under Pb stress.
SampleParameterABCDE
NP2O5K2OSheep ManurePb2+
RootK10.2580.3690.1920.3730.112
K20.2080.3600.2050.3120.147
K30.1750.1820.3830.2380.307
K40.5370.2660.3980.2540.611
R0.3620.1870.2060.1350.499
Main and secondary order: E(Pb2+) > A(N) > C(K2O) > B(P2O5) > D(Sheep manure)
Highest level A4 B1 C4 D1 E4
Minimum level A3 B3 C1 D3 E1
StemK10.1630.1920.2030.1940.161
K20.2320.1400.1560.1800.117
K30.1920.1640.1520.1520.163
K40.0770.1690.1530.1380.222
R0.1550.0520.0510.0560.105
Main and secondary order: A(N) > E(Pb2+) > D(Sheep manure) > B(P2O5) > C(K2O)
Highest level A2 B1 C1 D1 E4
Minimum level A4 B2 C3 D4 E2
LeafK10.0500.0460.0490.0530.041
K20.0380.0450.0480.0390.045
K30.0360.0450.0410.0450.045
K40.0640.0510.0500.0500.056
R0.0280.0060.0090.0140.015
Main and secondary order: A(N) > E(Pb2+) > D(Sheep manure) > C(K2O) > B(P2O5)
Highest level A4 B4 C4 D1 E4
Minimum level A3 B2 C3 D2 E1
FruitK10.0530.0560.0530.0360.051
K20.0560.0450.0430.0470.037
K30.0440.0460.0380.0540.035
K40.0380.0440.0570.0530.067
R0.0180.0120.0190.0180.032
Main and secondary order: E(Pb2+) > C(K2O) > A(N) = D(Sheep manure) > B(P2O5)
Highest level A2 B1 C4 D3 E4
Minimum level A4 B4 C3 D1 E3
Note: K1, K2, K3 and K4 are the sum of the indicators at each level of each factor, K1 represents the sum of the values of the test indicators corresponding to the “1” level.; R is called the range, and the largest K is subtracted from the smallest K.
Table 6. Linear relationship between fertilization and Pb content in PLI under Pb stress.
SampleRootStemLeafFruit
rprprprp
N0.6280.372−0.5850.4150.4000.600−0.8910.109
P2O5−0.7130.287−0.2720.7280.6740.326−0.8130.187
K2O0.9250.075−0.8040.196−0.1260.8740.1030.897
Sheep manure−0.9070.093−0.9900.010 **−0.0630.9370.9060.094
Pb2+0.9930.007 **0.8740.1260.9790.021 *0.7440.256
Note: “*”, p < 0.05, “**”, p < 0.01.
Disclaimer/Publisher’s Note: The statements, opinions and data contained in all publications are solely those of the individual author(s) and contributor(s) and not of MDPI and/or the editor(s). MDPI and/or the editor(s) disclaim responsibility for any injury to people or property resulting from any ideas, methods, instructions or products referred to in the content.

