Article

Arctic Edible Brown Alga Fucus distichus L.: Biochemical Composition, Antiradical Potential and Human Health Risk

by
Ekaterina D. Obluchinskaya
1,
Olga N. Pozharitskaya
1,*,
Elena V. Gorshenina
1,
Denis V. Zakharov
1,2,
Elena V. Flisyuk
3,
Inna I. Terninko
4,
Yuliya E. Generalova
4 and
Alexander N. Shikov
1,3,*
1
Murmansk Marine Biological Institute of the Russian Academy of Sciences (MMBI RAS), 17 Vladimirskaya Str., 183038 Murmansk, Russia
2
Zoological Institute RAS (ZIN RAS), 1 Universitetskaya Embankment, 199034 Saint-Petersburg, Russia
3
Department of Technology of Pharmaceutical Formulations, St. Petersburg State Chemical Pharmaceutical University, 14 Prof. Popov Str., 197376 Saint-Petersburg, Russia
4
Core Shared Research Facilities “Analytical Center”, St. Petersburg State Chemical Pharmaceutical University, 14 Prof. Popov Str., 197376 Saint-Petersburg, Russia
*
Authors to whom correspondence should be addressed.
Plants 2023, 12(12), 2380; https://doi.org/10.3390/plants12122380
Submission received: 3 May 2023 / Revised: 10 June 2023 / Accepted: 15 June 2023 / Published: 19 June 2023
(This article belongs to the Special Issue Bioactive Compounds from Marine Plants and Related Sources)

Abstract

:
Fucus distichus L. is the dominant canopy-forming macroalga in the rocky intertidal areas of the Arctic and Subarctic. In the present study, the impact of the geographic location of F. distichus collected in the Baffin Sea (BfS), Norwegian Sea (NS), White Sea (WS), and Barents Sea (BS) on the variations in biochemical composition, antiradical properties, and health risk was evaluated. The accumulation of main carbohydrates (fucoidan, mannitol, and alginic acid) varied from 335 mg/g dry weight (DW) in NS to 445 mg/g DW in BS. The highest level of the sum of polyphenols and flavonoids was found in samples of F. distichus from WS and was located in the following ranking order: BS < BfS < NS < WS. The 2,2-diphenyl-1-picrylhydrazyl radical scavenging activity of seaweed is correlated with its phenolic content. It is notable that in most Arctic F. distichus samples, Cd, Cr, Pb, and Ni were not detected or their concentrations were below the limit of quantification. According to calculated targeted hazard quotient and hazard index values, all studied samples of Arctic F. distichus are safe for daily consumption as they do not pose a carcinogenic risk to the health of adults or children. The results of this study support the rationale for using Arctic F. distichus as a rich source of polysaccharides, polyphenols, and flavonoids with important antiradical activity. We believe that our data will help to effectively use the potential of F. distichus and expand the use of this algae as a promising and safe raw material for the food and pharmaceutical industries.

1. Introduction

Arctic brown seaweeds are a specific source of unique compounds that may be used to create various products with beneficial properties. In the Northern Hemisphere, the intertidal areas of many cold and warm temperate regions are dominated by the genera Fucus, Ascophyllum, and Pelvetia of the Fucaceae family [1,2]. These algae are the most prominent and have increased relevance due to their high content of various phytochemicals with industrial applications [3]. The dominant canopy-forming macroalga in the rocky intertidal areas of the Arctic and Subarctic is Fucus distichus Linnaeus, 1767 [2,4]. The dynamic development and almost ubiquitous distribution of F. distichus in the littoral zone of the shelf allow us to consider this species as a potential commercial one. In an undisturbed natural environment, the biomass of F. distichus can reach 25 kg/m2 [5]. The chemical composition and high ecological and economic value of Fucus spp. stimulate significant interest and promote the study of its chemical composition and activities for practical applications. F. distichus is nutritionally rich macroalga, containing, based on dry weight, 8.1–10.0% of protein, 1.1–3.0% of lipids, 17.6–26.7% of soluble carbohydrates, 70.6% of total carbohydrate content, and 18.6–20.5% of minerals [6,7,8,9]. However, these values have geographical and seasonal variations [7].
Like other Phaeophyceae, F. distichus is a rich source of valuable biologically active compounds such as fucoidans [8,10,11], mannitol [8,12], alginic acid [8,12], pigments [13], phenolic constituents, and essential minerals [14,15]. Fucoidans are common in the Fucaceae family and are only present in brown seaweeds [16,17]. Fucoidan from F. distichus is composed of 61.9 mol.% fucose, 6.9% sulfate, and 26.1% uronic acid [10]. The main structural units are represented by 1→ 4 and 1→ 3 linked L-fucose [12,18,19]. F. distichus fucoidan exhibits anti-inflammatory and anticoagulant activities [10], which have a beneficial effect on age-related macular degeneration [20,21]. In previous publications, the promising antioxidant potential of F. distichus was associated with I ts high phlorotannin content [11]. Brown seaweeds, like F. distichus are known for their enhanced capacity for the accumulation of minerals and organic and inorganic contaminants from sediments and seawater due to their unique structural and physiological characteristics [22,23,24,25]. Consuming edible seaweed regularly could result in increased health hazards due to its capacity to accumulate elements.
In the present study, the biochemical composition of F. distichus L. collected in different seas of the Arctic region was analyzed. The antiradical properties and health risks were estimated. Our results highlight the potential of Arctic F. distichus as a promising source of functional compounds with multi-biological activity for use in the food and pharmaceutical industries.

2. Materials and Methods

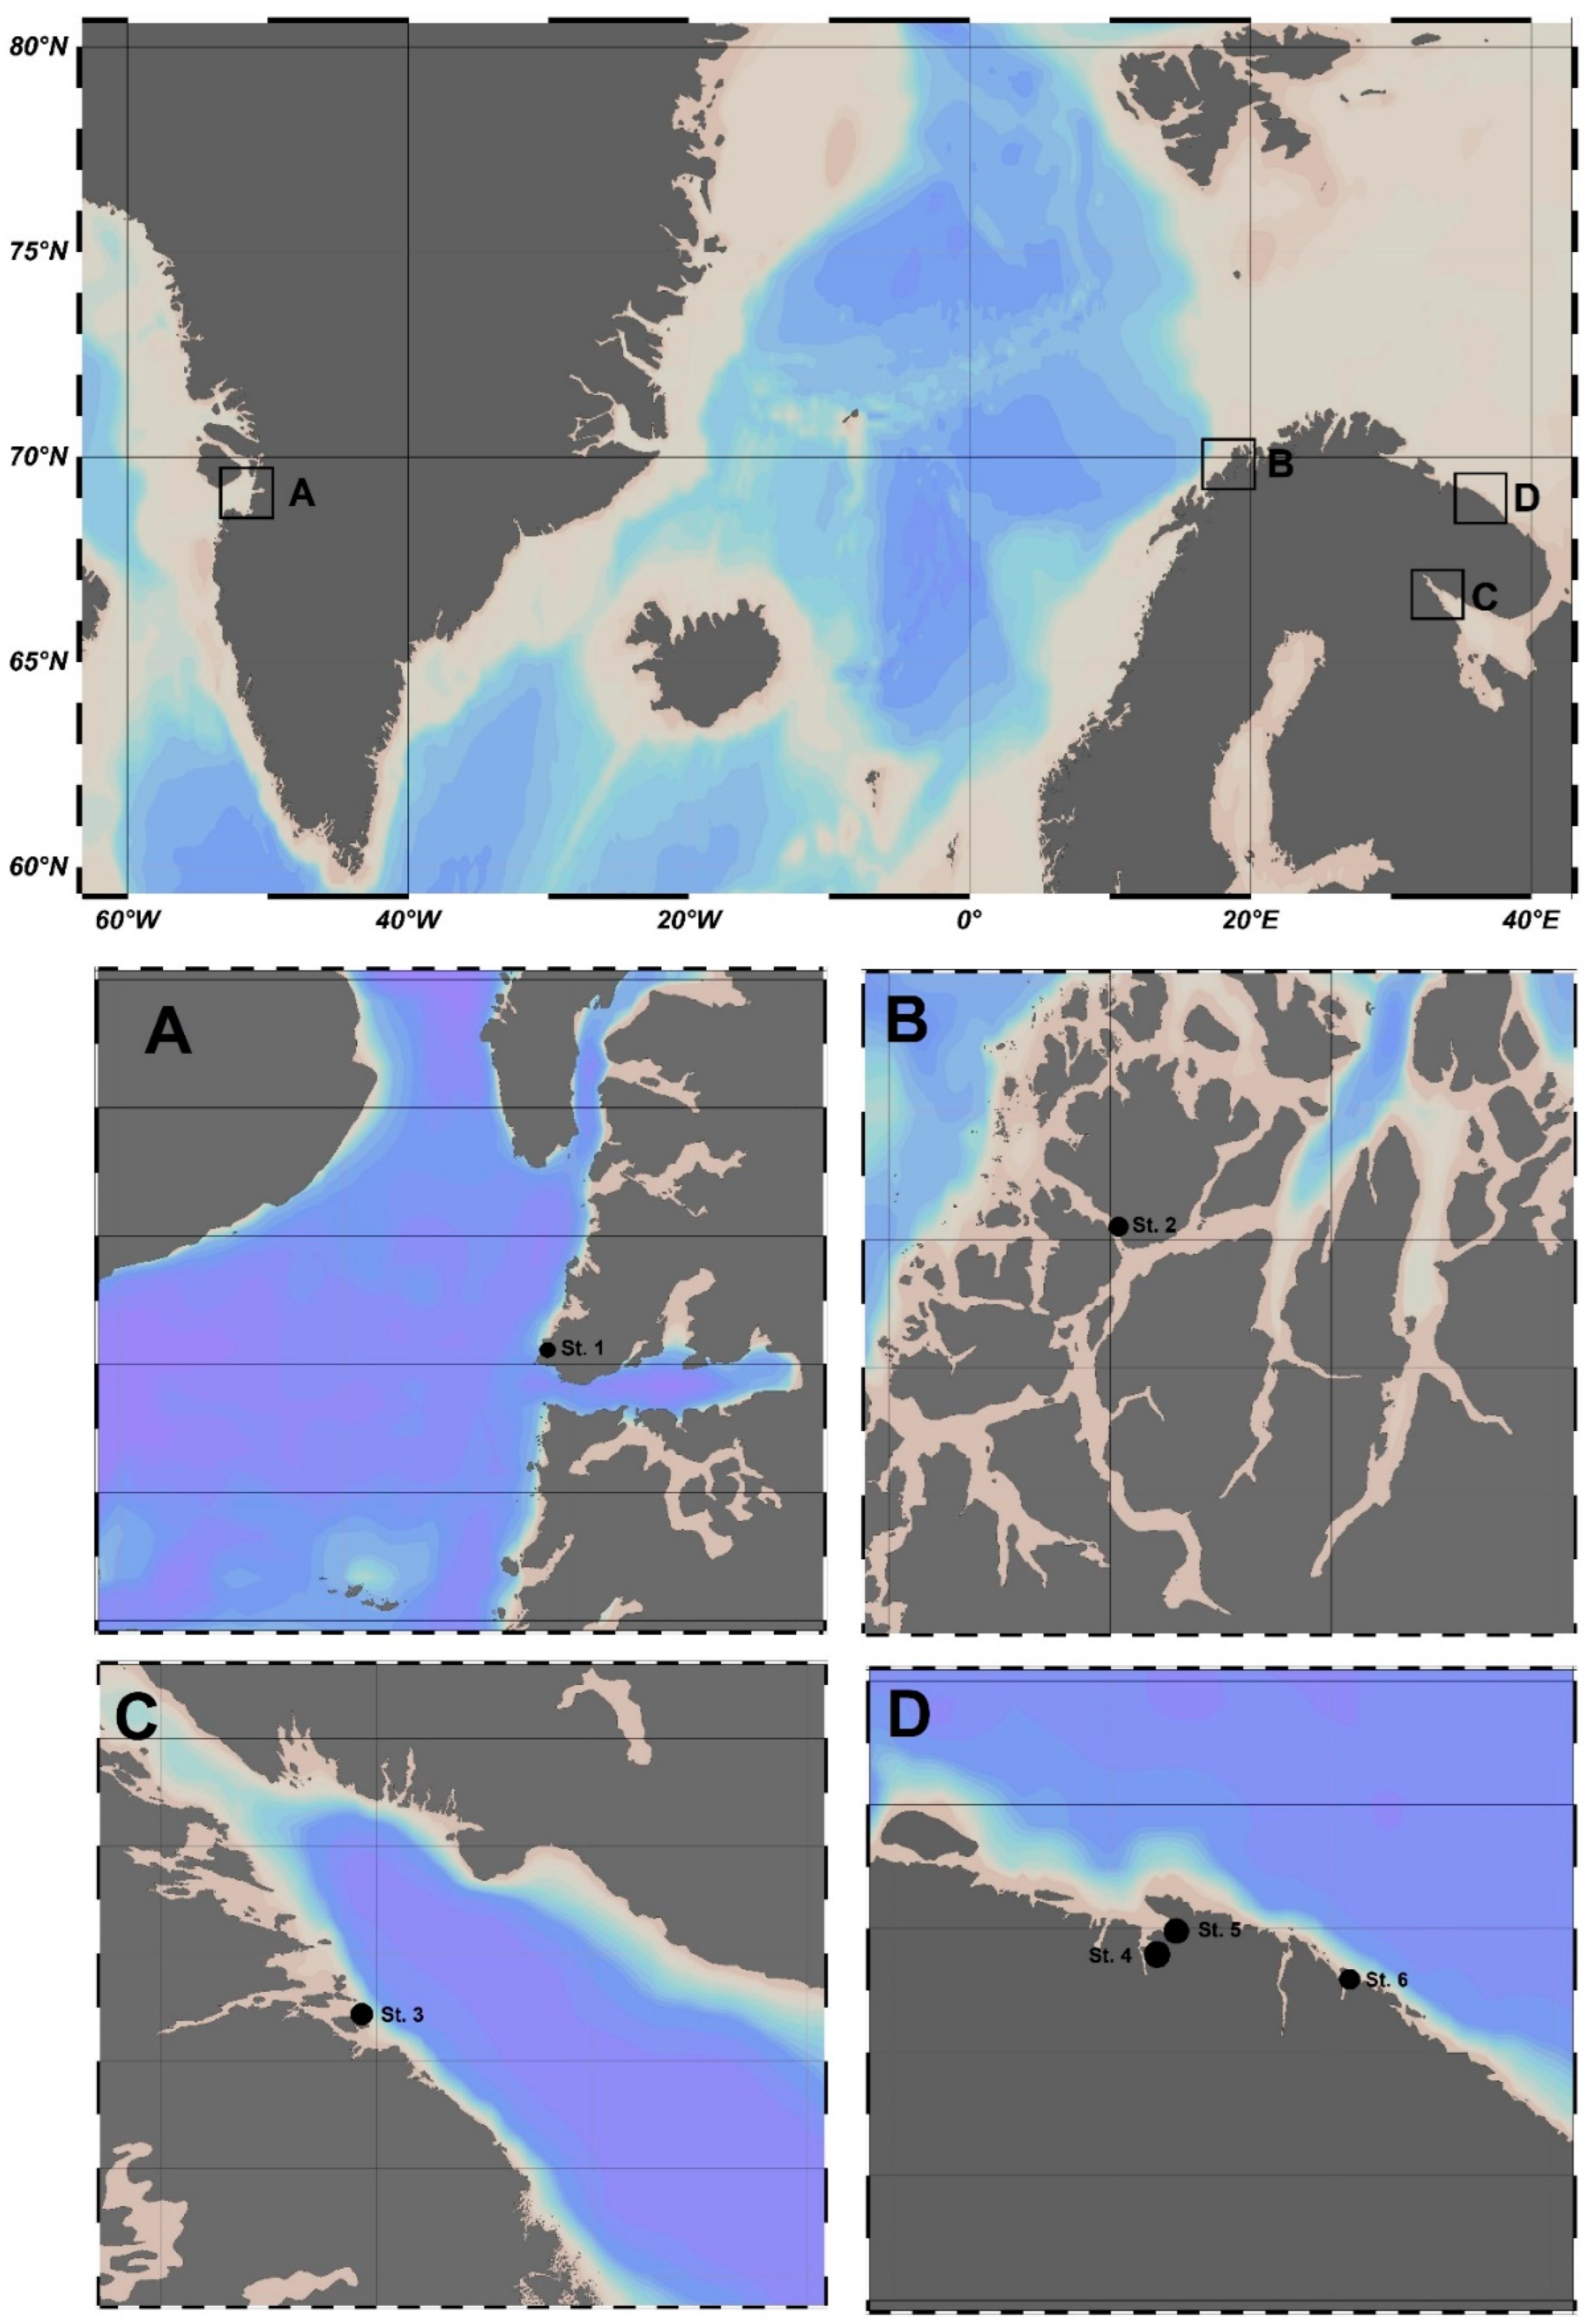
2.1. Samples Collection

Samples of F. distichus were harvested in the coastal zones (low tide at 0.6–1.0 m depth) of the Baffin Sea (BfS), Norwegian Sea (NS), White Sea (WS), and Barents Sea (BS) (Figure 1) in summer 2019. The details of the collection procedure were described in [26,27].
F. distichus samples were collected in Greenland, Norway, and Russia, namely in: Disko Bay of the BfS (Station (St.) 1); NS, Ringvassøya Island (St. 2); WS, Pezhostrov Island of the Kandalaksha Bay Islands (St. 3); and BS, Teriberskaya and Zelenetskaya bays (St. 4–6) (Table 1).

2.2. Chemicals

DPPH (2,2-diphenyl-1-picrylhydrazyl), quercetin, phloroglucinol, fucose (>99%), xylose (>99%), and the Folin-Ciocalteu reagent were all purchased from Sigma-Aldrich (St. Louis, MO, USA). Local chemical suppliers provided all other analytical-grade chemicals and solvents for extraction and testing. Ultrapure water (resistivity of 18.2 MΩ cm) for all solution preparations was obtained using a Milli-Q purification system (Millipore, Bedford, MA, USA). Multi-Element Calibration Standard 3 for element analysis was from PerkinElmer, USA.

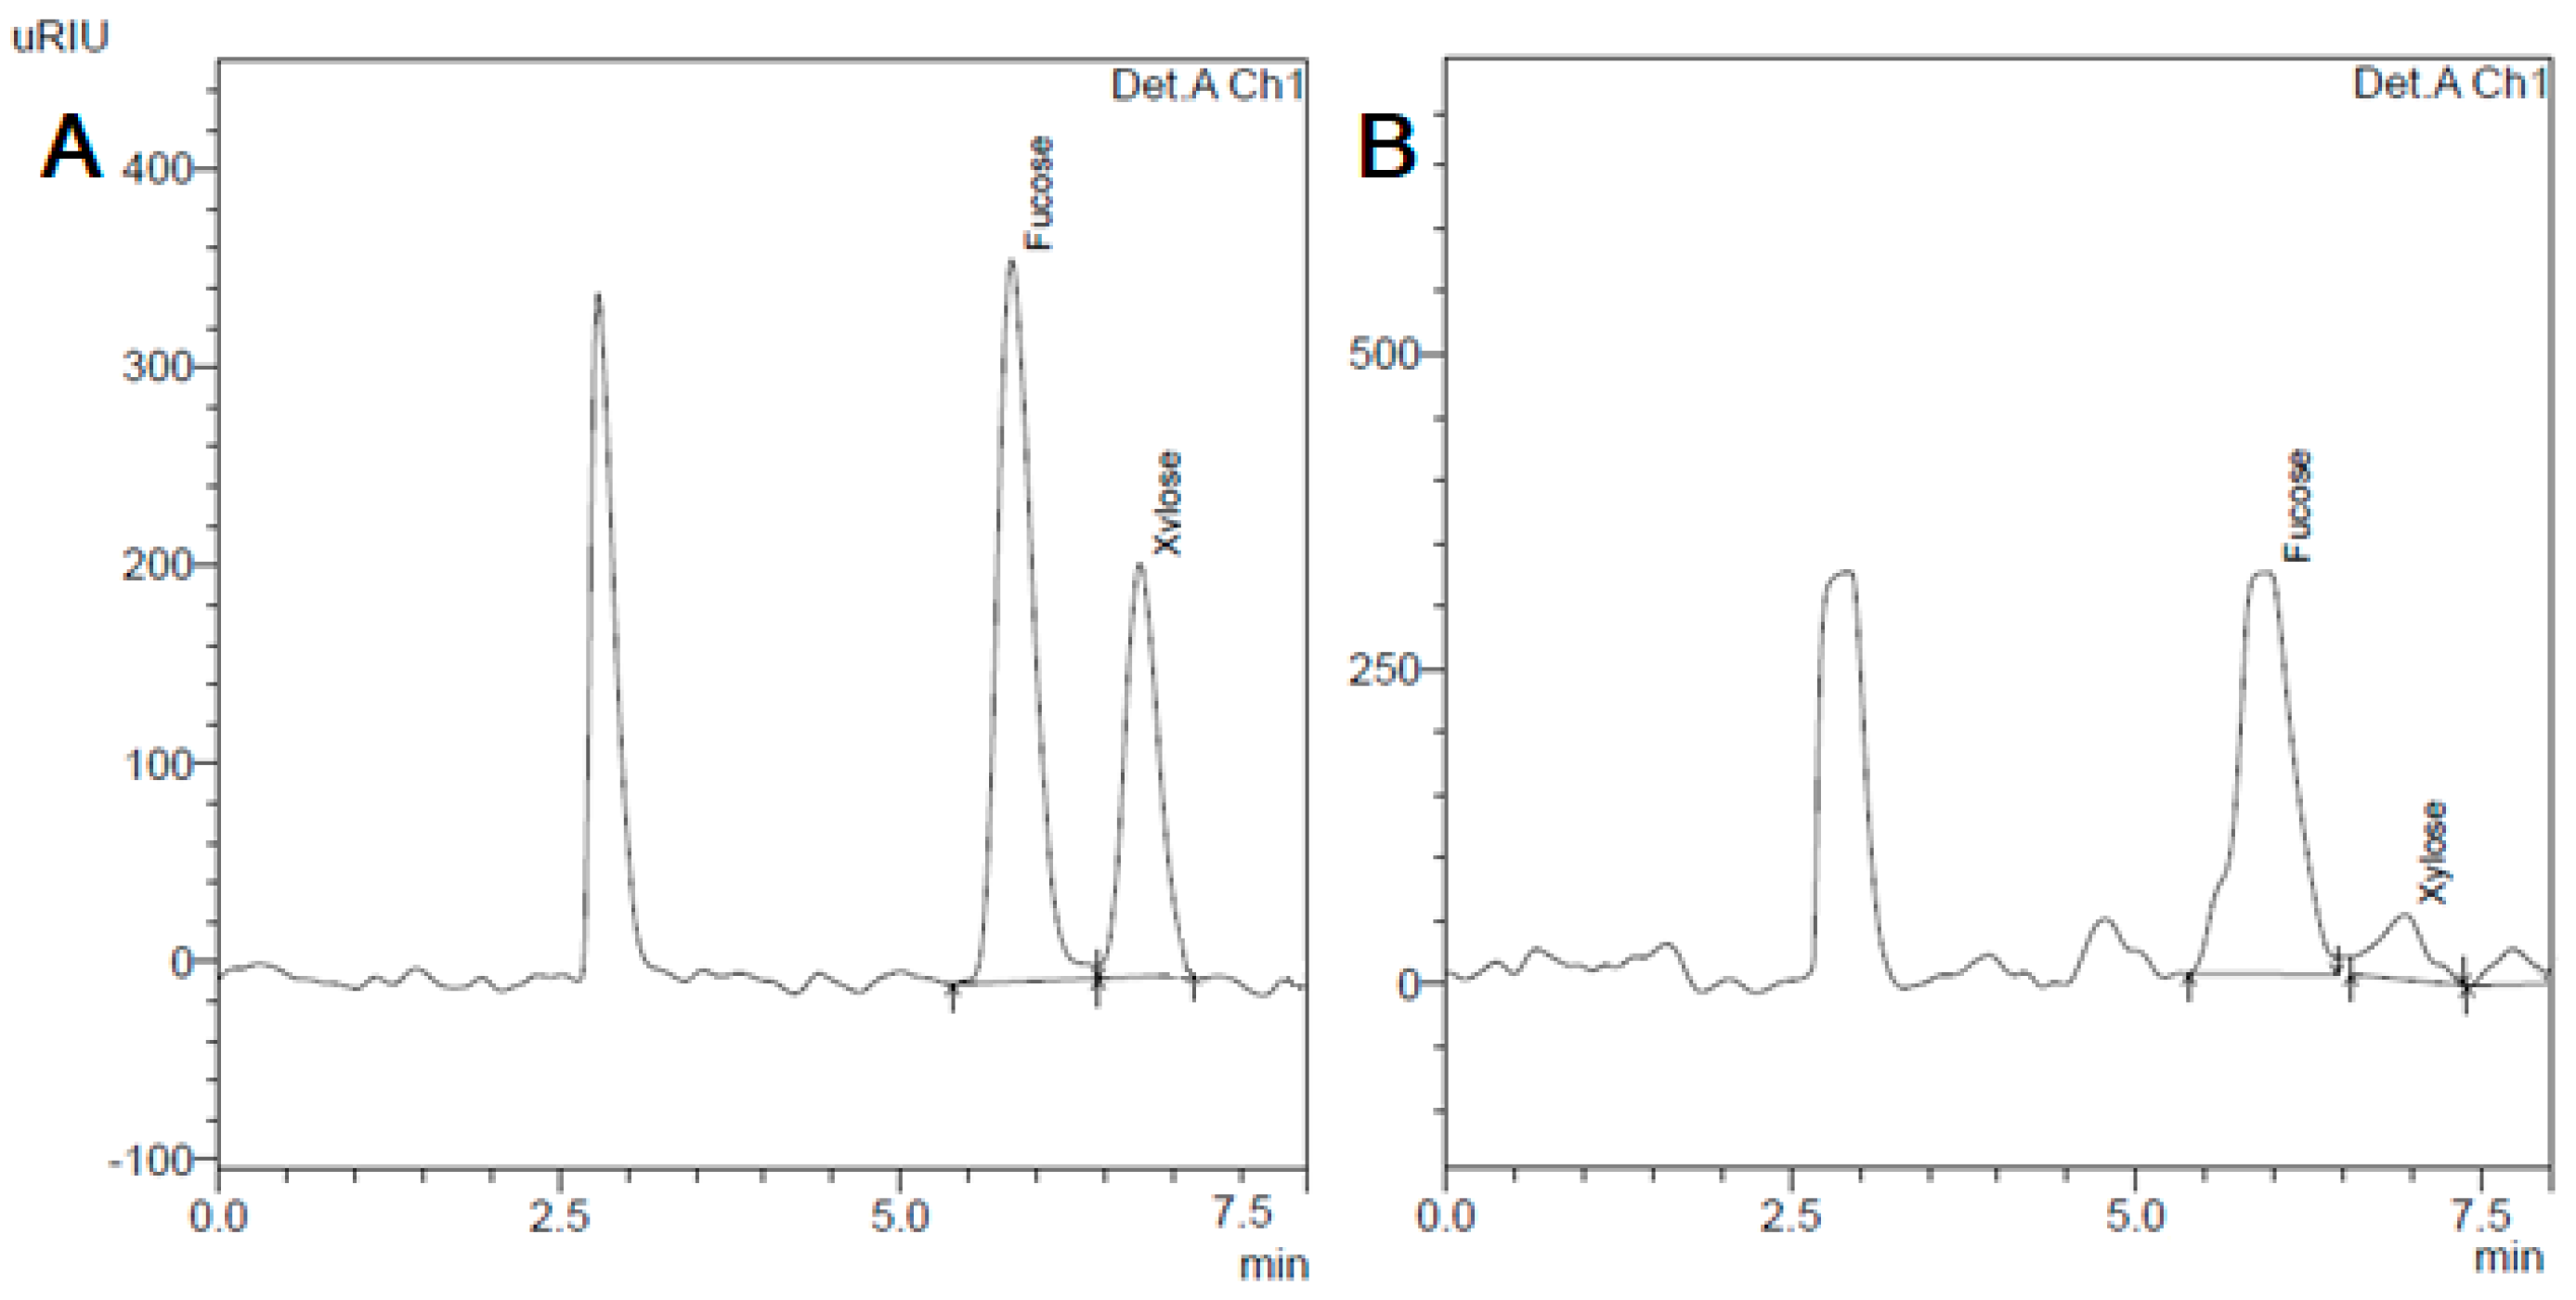
2.3. Carbohydrates Composition

For fucoidan content determination, seaweed samples were processed following the procedure described in [28]. The fucoidan content was measured by the cysteine-sulfuric acid method [29]. L-fucose was used as a reference.
For carbohydrate analysis, fucoidan samples (10–15 mg) were hydrolyzed with 2 M trifluoroacetic acid (0.5 mL) at 121 °C for two hours to determine the concentration of monosaccharides. Then samples were cooled in an ice water bath, centrifuged at 5000 rpm for 5 min, and the liquid fraction was adjusted to pH 7 with 2 M NaOH [30]. The carbohydrate content was estimated by high-performance liquid chromatography (HPLC Model LC 20 AT Prominence, Shimadzu, Kyoto, Japan) and equipped with a refractive index detector (RID-10A, Shimadzu, Kyoto, Japan) as described previously [31].
The level of mannitol in F. distichus samples was determined according to E. Obluchinskaya (2008). Briefly, the powdered seaweed sample (3 g) was extracted three times with 25 mL aqueous solution of CuSO4 (0.5% w/v) in a boiling water bath for 0.5 h. Afterward, the mixture was filtered, combined, and made up to 100 mL with water. 10 mL sample solution was mixed with 0.1 mL concentrated H2SO4 and after 30 min added 5 mL 4 M NaOH and 5 mL CuSO4 (12.5% w/v). The solutions were mixed and incubated for one hour at room temperature. Centrifugation was used to remove the precipitate. Finally, the absorbance was measured at 597 nm (Shimadzu UV 1800, Shimadzu, Kyoto, Japan) and compared to a mannitol calibration curve [32]. Results were expressed in percent per dry weight (DW). All measurements were performed in triplicate.
The alginic acid content was determined by reaction with 3,5-dimethylphenol and sulfuric acid [33]. Briefly, 0.5 mL of alginic acid (ranging from 0.002 to 0.1 mg/mL) and 0.5 mL 0.01% water solution of the sample was added to 0.5 mL of 20% H3BO3 in a 0.1 M NaOH solution and 4 mL of concentrated H2SO4. The solutions were mixed and incubated at 22 °C for 10 min and then at 70 °C in a water bath for 40 min, and after cooling to room temperature, 0.1 mL 3.5-dimethylphenol (0.1% w/v) was added and stored for 180 min at room temperature. The absorbance of the standards and extracts was measured at 400 nm (A400) and 450 nm (A450). Alginic acid was used as a standard at an absorbance A400–A450. Results were expressed as percentages per DW, and all measurements were conducted three times for accuracy.

2.4. Analysis of Total Phenolic, Total Flavonoids, and Antiradical Activity

For the analysis of the content of total phenolics (TPC), total flavonoids (TFC), and DPPH scavenging activity of the samples of F. distichus, they were extracted by the method [34] with some modifications. Briefly, the powdered seaweed samples (2 g) were extracted three times with 50 mL aqueous MeOH (60% v/v) in a dark place at room temperature for 24 h under continuous stirring at 200 rpm on a Multi Bio RS-24 rotator (Biosan, Riga, Latvia). Afterward, the mixtures were centrifuged at 3500 rpm for 10 min, filtered (Whatman filter paper N 1), and combined. The filtrate was concentrated to dryness under reduced pressure using a rotary evaporator IR-1m (PJSC Khimlaborpribor, Klin, Russia) to remove MeOH, and the residue was dissolved in 25 mL volumetric flasks with 60% (v/v) aqueous MeOH and filtered before use for analysis of the TPC, TFC, and DPPH scavenging activity. Extraction assays were performed in triplicate.
The TPC in the F. distichus extracts was analyzed spectrophotometrically at 750 nm (Shimadzu UV 1800 spectrophotometer, Shimadzu, Kyoto, Japan) according to [35] using the Folin-Ciocalteu reagent. TPC was expressed as mg phloroglucinol equivalent (PhE) per g DW.
The TFC was measured by a spectrophotometric assay [34,36], with some modifications [37]. The absorbance of the tested solutions was recorded at 415 nm on a UV-Vis spectrophotometer, Shimadzu UV 1800 (Shimadzu, Kyoto, Japan). TFC was expressed as mg quercetin equivalent (QE) per g DW.
The DPPH scavenging activity was analyzed according to W. Brand-Williams et al. [38], with some modifications [37]. The absorbance of the resulted solutions was measured at 517 nm with the UV-Vis spectrophotometer Shimadzu UV 1800 (Shimadzu, Kyoto, Japan).
The percent DPPH scavenged by each different samples was calculated according to Equation (1):
D P P H   s c a v e n g i n g   a c t i v i t y   ( % ) = A c o n t r o l A s a m p l e A c o n t r o l × 100
where Acontrol stands for the absorbance of the control, and Asample is the absorbance of the sample solution reaction at 30 min.
The percentage of remaining DPPH-radicals was plotted against the sample/standard concentration to obtain the IC50 value, which represents the concentration of the extract or reference antioxidant (mg/mL) required to scavenge 50% of the DPPH-radicals in the reaction mixture. Its reciprocal, the antiradical power (ARP, ARP = 1/IC50), was also calculated for each of the sample extracts [39].
All measurements were performed in triplicate.

2.5. Element Analysis

The samples of F. distichus were extracted by the method [35]. The PerkinElmer® Optima™ 8000 inductively coupled plasma optic emission spectrophotometer (ICP-OES) (PerkinElmer, Inc., Shelton, CT, USA) was used for the analysis of elements as described previously [37]. Instrumental parameters were as described by É. Flores et al. [40]. The concentration of the elements (mg/kg) was calculated according to Equation (2):
X = C c a l i b × V × 1000 m
where Ccalib—element concentration from the calibration, mg/L; V—volumetric flask, L; m—sample weight, g.
For the evaluation of the accuracy of the method, a reference sample of Cu was added to the F. distichus sample as described in [41]. The mean recovery value of Cu was 94–104%.

2.6. Metal Pollution Index

The metal pollution index (MPI) [42] represents the contribution of all the elements detected and calculated according to Equation (3):
M P I = ( M 1 × M 2 × × M n ) 1 / n
where Mn is the concentration of the metal n in the sample in mg/kg.

2.7. Assessments of Human Health Risk

The nutritional recommendations [43,44] were used for the evaluation of the nutrimental importance of essential elements. The health risk associated with the toxic elements accumulated by F. distichus samples was assessed using risk estimators [43,44,45,46,47].
The risk to human health from the elements contained in F. distichus samples was assessed using the targeted hazard quotient (THQ) and hazard index (HI) proposed by USEPA (2020). The indexes were calculated following Equations (4)–(6) below [48,49].
E s t i m a t e d   D a i l y   I n t a k e   E D I = C i × C R × E F × E D B W × A T
T a r g e t   H a z a r d   Q u o t i e n t   T H Q = E D I R f D
H a z a r d   I n d e x   H I = k = 1 n = k T H Q
where Ci is the mean concentration of each element in the sample (mg/kg); CR is the consumption rate (0.0052 kg); EF is the exposure frequency (250 days); ED is the average exposure duration (70 years); BW is the average body weight (70 kg) and AT is the average lifetime (72.59 years) [50]. There is no fixed consumption rate for seaweed in Russia. As a result, the consumption rate has been considered in different studies [49]. RfD is the recommended oral reference dose.

2.8. Statistical Analysis

The statistical analysis was conducted using STATGRAPHICS Centurion XV (StatPoint Technologies Inc., Warrenton, VA, USA). Data and error bars in the figures are expressed as mean ± standard deviation (SD). Differences between means were analyzed by the ANOVA test, followed by the post hoc Tukey’s test. The difference was considered significant at a level of p < 0.05. Pearson’s correlation coefficients were used to establish the relationship between the content of representative compounds and antioxidant capacity. Multiple regression and multivariate data analysis using the partial least squares coefficient method was carried out.

3. Results and Discussion

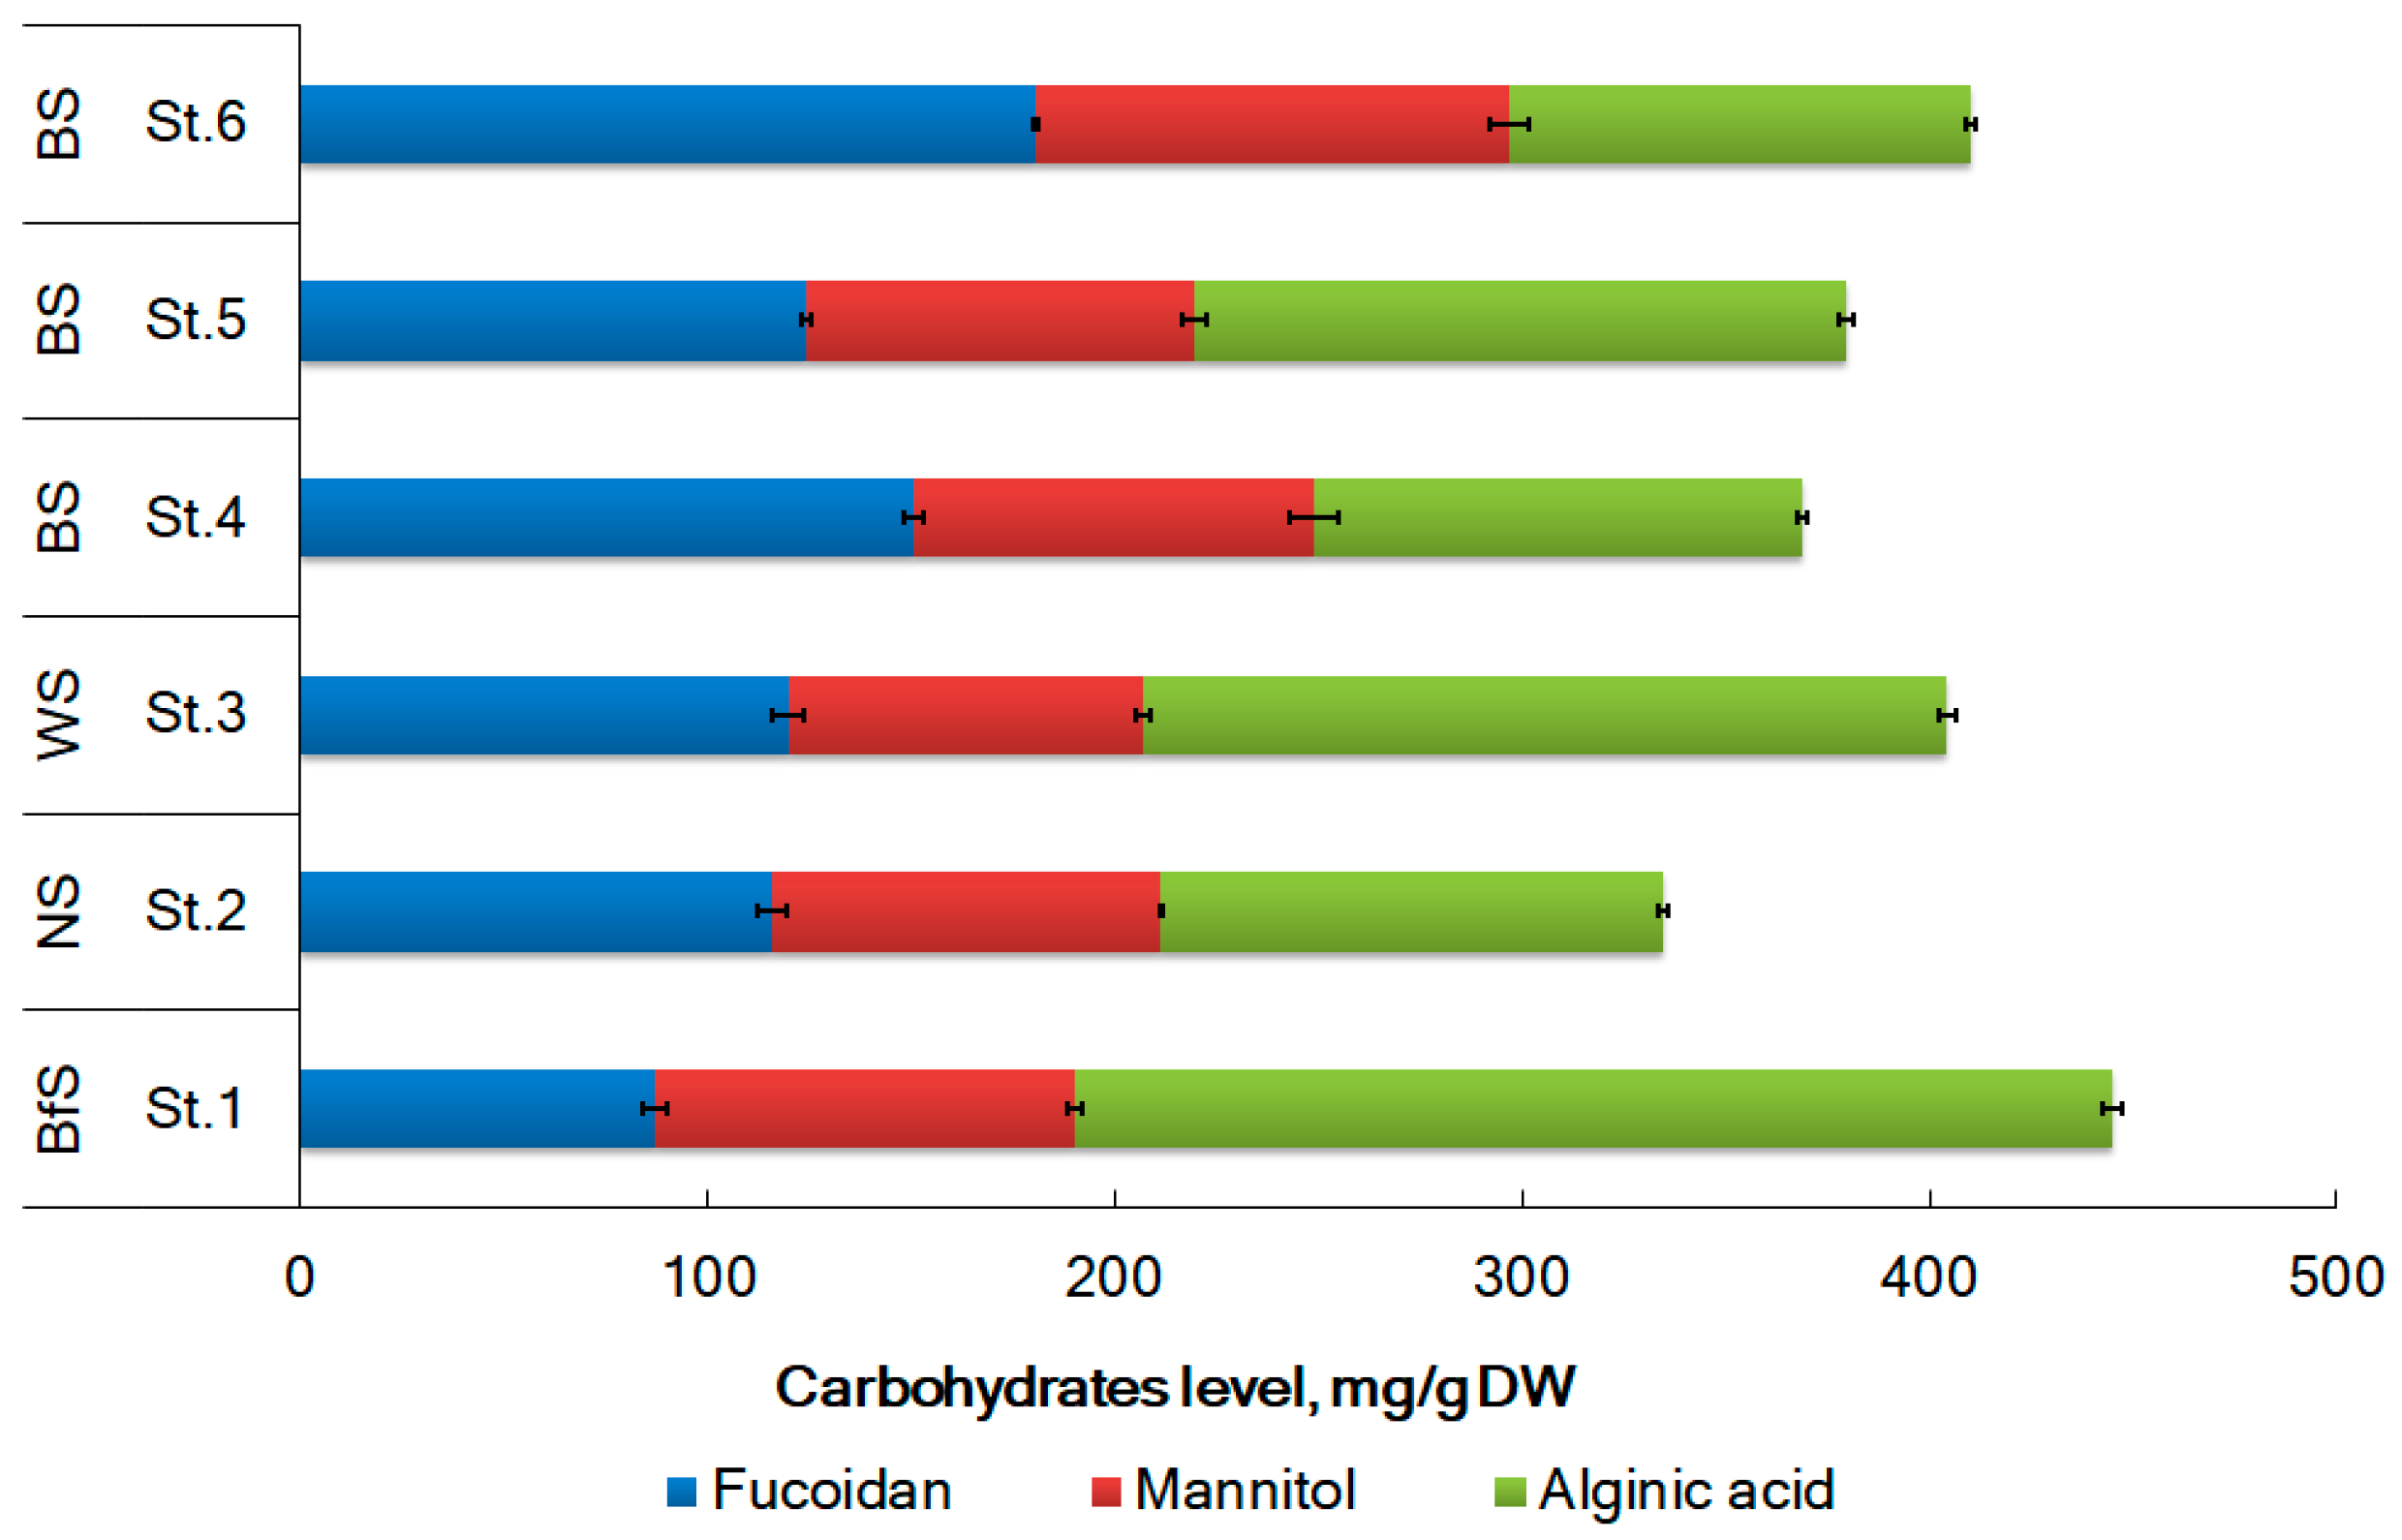
3.1. Carbohydrates Composition

Literature data on the study of the carbohydrate composition of F. distichus are very insufficient, and mainly fucoidan has been studied. However, the content of fucoidan in samples collected in different seas of the Arctic was compared for the first time.
The content of fucoidan in the tested samples of F. distichus varied from 86.9 ± 3 mg/g DW from the Disco Bay of the BfS to 180.6 ± 0.8 mg/g DW in the Zelenetskaya Bay of the BS (St. 6) (Figure 2). The content of fucoidan in F. distichus samples from the WS and the NS was 116.1 ± 3.6 and 119.8 ± 3.7 mg/g DW, respectively, and there is not a statistically significant difference between the standard deviations of the two samples at the 95.0% confidence level. For Teriberskaya Bay in BS, values varied from 150.5 ± 2.6 (St. 4) to 124.3 ± 1.0 mg/g DW (St. 5). The accumulation of fucoidan is not affected by water temperature or salinity. The level of fucoidan from F. distichus collected in autumn in Zelenetskaya Bay was slightly lower and reached 146.7 ± 22.4 mg/g DW. It is interesting to note that T.N. Zvyagintseva et al. (2003), having analyzed samples of some Far Eastern brown algae, also found some noticeable differences for samples obtained in different geographical locations [51].
The levels of fucose and xylose in F. distichus from different locations determined by HPLC-RID after acid hydrolysis are presented in Table 2.
The content of the main monosaccharides, determined by HPLC after acid hydrolysis, fucose, in the samples ranged from 43.5 mg/g in BfS (St. 1) to 90.3 mg/g in BS (St. 6). Previously, it was found that fucose is dominant in these seaweed species. Its content varied from 59.4–62 mol.% [11,52,53] to 76.7–87 mol.% [54,55]. Xylose (4.5–10 mol.%) was a minor sugar. The content of galactose, mannose, and glucose was less than 7 mol.% or a trace [17]. In this study, samples from the Barents Sea were most rich in fucose and xylose (Table 2). The typical chromatogram is presented in Figure 3.
A strong correlation between accumulation of fucose and xylose (Pearson’s correlation coefficients r = 0.926, p < 0.05) and their ratio (r = −0.682 and r = −0.887, p < 0.05 for fucose and xylose, respectively) was established. No correlation was observed between xylose and fucose contents and water salinity, while a slight negative correlation between water temperature and fucose and xylose content (Pearson’s correlation coefficients r = −0.378 and r = −0.465, p < 0.05, respectively for fucose and xylose) was found. The fucose/xylose ratio in fucoidan from the samples collected in the BfS differed significantly from the rest of the samples and was 1.45 times higher on average.
Crude fucoidan from F. distichus harvested in the Kiel Fjord (Germany) contained about 61.9−76.7 mol.% fucose, and the fucose to xylose ratio was 6.13−7.83 [20,54]. Fucoidan extracted from F. distichus from the western coast of Iturup Island (the Okhotsk Sea) collected in summer was composed of 59.4 mol.% fucose and 5.7 mol.% xylose, and the ratio of fucose to xylose was 10.42 [52]. While purified fucoidan contained 87.1 mol.% fucose and an increased ratio of fucose to xylose of 24.19 [56], T.N. Zvyagintseva et al., (2003) have found some notable differences for the F. distichus collected in different spots of the southern Okhotsk Sea (fucose proportion 56–80%) [51]. Previously, A.V. Skriptsova et al., (2012) showed that the fraction of fucose changes insignificantly during the transition to the generative phase. Based on the obtained data and literature, it can be assumed that the predominant unit of fucoidan synthesized by F. distichus is fucose [57].
Mannitol content in the tested samples ranged from 86.9 to 116.2 mg/g DW (Figure 2). Mannitol levels were statistically higher in samples from the BfS (St. 1) and BS (St. 6) than in samples from the WS (St. 3) (103.0 ± 1.8 mg/g DW and 116.2 ± 4.6 mg/g DW compared to 86.9 ± 1.8 mg/g DW, p < 0.05). A positive correlation between the content of mannitol in algae and the water salinity was found (Pearson’s correlation coefficients, r = 0.41, p < 0.05).
Hexatomic alcohol D-mannitol is one of the primary products of photosynthesis and a reserve substance in brown algae. Its content is varied by different seaweeds, seasons, and growing conditions. Mannitol has various technical and medical applications, and its isolation from algae is cheaper than chemical synthesis [58]. The richest sources of D-mannitol are representatives of the genus Laminaria, and they can accumulate up to 20–30% of the dry weight of biomass. The content of mannitol in the biomass of the focus algae from Kamchatka was about 7.7% DW [59]. F. distichus from the Zelenetskaya Bay of the Barents Sea accumulates mannitol up to 12.75% DW [32]. The positive correlation between the water salinity and the mannitol content in F. vesiculosus has been demonstrated [60]. It supports its osmoregulatory functions in brown seaweeds.
The content of alginic acid in the tested samples of F. distichus varied from 113.2 ± 1.1 mg/g DW from the Zelenetskaya Bay of the Barents Sea (St. 6) to 255.1 ± 2.4 mg/g DW in the Disco Bay of the Baffin Sea (St. 1) (Figure 2). For Teriberskaya Bay in the Barents Sea, the values varied from 119.7 ± 1.4 (St. 4) to 159.8 ± 1.8 mg/g DW (St. 5). No correlation was found between temperature, salinity, and the content of alginic acid. The level of alginic acid from F. distichus collected in autumn in Zelenetskaya Bay was slightly lower and reached 235.8±24.0 mg/g DW [32]. According to reference [28], the content of alginic acid found in Fucus collected from Avacha Bay in Kamchatka was 173 mg/g DW.
Several therapeutic activities, such as anticoagulants, antitumor agents, and others, have been demonstrated for alginate in vivo [61]. Due to their lack of toxicity and adaptation to demands, alginate polymers have significant potential for the development of pharmaceutical, biomedical, and food formulations. Some alginate-containing gastrointestinal formulations and protectors (e.g., Gaviscon) have been reported in the literature [62].

3.2. Polyphenols and Flavonoids Content

The TPC in F. distichus collected in different Arctic regions varied in a wide diapason of concentrations, from 24.0 to 135.3 mg of phloroglucinol equivalent per 1 g of DW. The TFC was on average 6.2 times lower than the TPC (Figure 4).
The highest accumulation of TPC and TFC was observed in samples of F. distichus from the White Sea and was increased in the following ranking order: BSmean < BfS < NS < WS.
Brown algae synthesize phlorotannins, polyphenolic compounds that include phloroglucinol units in their structure [63]. The extract from algae of the order Fucales was the most distinct in phlorotannin content compared to the order [14]. According to the previous publication, the antioxidant activity of fucoidan from the brown alga was associated with the impurity of phenolic compounds [64].

3.3. DPPH Radical Scavenging Activity

The DPPH radical scavenging activity of F. distichus was expressed as antiradical power (ARP), which represents the reciprocal of IC50 (ARP = 1/ IC50). All the investigated samples of F. distichus exhibited medium or low activity in the DPPH assay. The ARPs ranged from 1.3–1.4 in BS to 2.2 in WS (Figure 3). The sample from BS (St. 5) had the lowest polyphenol content (24.4 mg/g DW) and the lowest ARP of 1.2 mL/mg. In contrast, the sample from WS showed strong DPPH radical scavenging activity with an ARP value of 2.2 (Figure 3). A similar scavenging activity pattern was observed for the flavonoid assay. The sample with the highest flavonoid content of 18.4 mg/g DW (WS, St. 3) showed a stronger antioxidant capacity than the other samples. In our study, a weak negative correlation was found between the content of fucose or xylose and their antiradical activity (Pearson’s correlation coefficients r = −0.482 and r = −0.359, p < 0.05, respectively for fucose and xylose). This finding may indicate a negative effect of fucoidan content on the radical scavenging activity of F. distichus extracts. Although several studies have reported that fucoidan has radical scavenging activity [65], crude fucoidan was used in the above studies. Therefore, other compounds usually observed in crude fucoidans (e.g., minor phenolics, ascorbic acid, fucoxanthin, proteins, etc.) may have an impact on the radical scavenging activity. In a previous study, only very weak antioxidant activity was found for relatively pure sulfate-rich polysaccharide fractions containing few polyphenols. T.I. Imbs et al. (2015) concluded that the structural features required for the antioxidant activity of sulfated polysaccharides from Fucus algae from the Okhotsk Sea are polyphenols co-extracted with sulfated polysaccharides [64]. The content of phenolic compounds, including phlorotannins and flavonoids, largely determined the radical-scavenging activity of samples (Pearson’s correlation coefficients r = 0.895 and r = 0.870, p < 0.05, for TPC and TFC, respectively).
Our results are in line with previous publications. The direct correlation between DPPH scavenging activity and TPC in algal extracts has been discussed by several authors [11,39,64]. Flavonoids contribute to the ARP too. Extreme conditions, such as salinity, dryness, air exposure, UV radiation, etc., influence on littoral algae during high and low tides. Algae synthesize a variety of chemical antioxidants, including polyphenols, in response to environmental stresses. Scientific publications confirm that compounds with antioxidant activity are produced by all classes of sea algae [66]. Besides dominating structure-forming polysaccharides, seaweeds of Fucus spp. are rich in polyphenols [39]. These marine polyphenols are highly hydroxylated, and their ARP can be up to 100 times stronger than that of polyphenols synthesized by terrestrial plants [67]. We found that temperature and salinity affect the antiradical activity of F. distichus from the Arctic region (Pearson’s correlation coefficients r = 0.636 and r = 0.605, p < 0.05, respectively for temperature and salinity). F. spiralis from the Portuguese coast was previously found to have high TPC levels (0.049 ± 0.005 mmol gallic acid equivalent (EGA)/g DW) [68] compared to F. spiralis collected in Denmark (0.044 ± 0.001 mmol EGA/g dry body weight) and much higher than in Scotland (0.014 ± 0.000 mmol EGA/g DW) [69,70]. These differences are related to geographic location and climatic differences. Higher temperatures and sun exposure in Portugal than in Scotland and Denmark caused seaweed to produce more antioxidant compounds to protect them [68].

3.4. Element Contents

The measured concentrations, range (minimum and maximum concentrations) for elements in each sample of F. distichus, and LOQ are provided in Table 3. The concentration of elements varied in the seaweed collected in different regions. Al and Fe levels in F. distichus from WS (St. 3) and BS (St. 6) were significantly higher than in other samples. This may be related to the dependence on photosynthetic activity, which proceeds continuously during the arctic summer [71]. The concentration of Ca averaged 14,774 mg/kg DW and reached a maximum of 25,476 mg/kg DW in the samples BS (St. 5). The Mg concentration was slightly lower and averaged about 9304 mg/kg DW. Samples from WS showed the highest concentrations of Ba, Co, Mn, and Fe. The majority of F. distichus samples from various Arctic regions did not show any detectable levels of Pb, Cd, Cr, or Ni, with some concentrations falling below the LOQ. Elements in seaweeds from the seas of the Arctic region can be sequenced in descending order by mean values: Ca > Mg > Sr > Fe > Al > Mn > Rb > Zn > As total > Ba > Ni > Co > Cu > Pb, Cr, Cd (< LOQ). Similar results were previously reported in the literature for the same elements in other fucales from the Arctic region [37,72].
F. distichus from the WS showed higher metal concentrations when compared to seaweeds collected in the NS and the BS (Table 3). Average concentrations of Cu, Cd, and Pb in fucus from BS from April 2010–2012, 2014, and 2018 were varied, such as 4–18 µg/g DW, 0.35–0.98, and 0.2–1.3 [27]. A comparison of seaweeds collected by us in the Arctic with F. distichus from the WS collected near the village of Rabocheostrovsk [73] showed that F. distichus had similar concentrations of Cu, Fe, and Zn but lower concentrations of Cd, Cr, Ni, and Pb. The increased concentration of Mn in algae samples from the WS is associated with a higher volume of river runoff into it [74]. The biogeochemical feature of the WS consists of increased background concentrations of Mn and low Cd, which are associated with the level of terigen runoff. It is assumed that the deficiency of bioavailable forms of Zn in the coastal strip of the WS, NS, and BfS is a consequence of increased biomass of macrophytes in the littoral. The levels of Fe and Mn are influenced by how close an area is to sources of terrigenous runoff. The concentration of Fe in the algae of the BfS is significantly lower than in the algae of the WS, which is associated with their adaptation to the supply of this metal from hydrothermal sources and the glacier, respectively.
The total concentration of As in the samples varied slightly and averaged 32.4 ± 15.4 mg/kg DW (Table 3). The As total contents of seaweed species belonging to Phaeophyta range from 1.89–245.19 mg/kg DW. The overwhelming majority of species of Rhodophyta, Phaeophyta, and Chlorophyta have As total contents of <30, 100 and 20 mg/kg DW, respectively. The species belonging to Phaeophyta and containing extremely high As total contents (over 100 mg/kg DW) are Laminaria ochroleuca, Cystoseira barbata, Sargassum piluliferum, Hizikia fusiforme, F. vesiculosis, Laminaria digitate, and Melanosiphen intestinalis [75].
Some compounds found in algae that are useful to humans also have one or more metal-binding sites. The polysaccharides in the cell walls of brown algae may have a high capacity to absorb and hold metals from the surrounding seawater [76]. Algal polysaccharides generally bind heavy metals to variable degrees. According to estimates of binding affinities, alginates (brown algae) are more likely to bind heavy metals than carrageenans (red algae) or agar (red algae) [77]. In this study, we also found a weak positive correlation between a total concentration of metals and a level of alginic acid (Pearson’s correlation coefficients r = 0.296, p < 0.05), but at the same time, we observed a negative correlation between the concentration of metals and the level of fucoidan and mannitol (Pearson’s correlation coefficients r = −0.493 and r = −0.440, p < 0.05 for fucoidan and mannitol, respectively).

3.5. Metal Pollution Index

The cumulative accumulation of metals (MPI) by F. distichus collected in different regions of the Arctic is shown in Figure 5.
The overall mean MPI for all samples was 55.3 (range 39–77). Seaweeds from NS have the lowest MPI of 38.7. F. distichus from WS showed the highest MPI of 77.2. The MPI values in F. distichus have increased in the following order: NS < BfS < BSmean < WS (Figure 4). A strong Pearson correlation was found for the MPI value versus salinity (r = −0.772, p < 0.05) and temperature (r = 0.689, p < 0.05).
Various metal guidelines can be used to categorize the ecological quality of European coastal waters. According to Norwegian Pollution Control Authority guidelines for the blue mussel Mytilus edulis (SFT TA-1467/1997), different ecological classes: Unpolluted (Class I) to Very Highly Polluted (Class V) were proposed depending on metals amount [78]. Maximum metal pollutants in food were defined by the European Community Commission [79]. Previously, F. distichus was mentioned as a monitoring tool for seawater metal contamination [74]. Based on the data we collected on the contamination of F. distichus and the guidelines mentioned earlier, we can conclude that the seawater in the Arctic Region’s seas (BfS, NS, WS, and BS) in the summer of 2019 belonged to “Class I–Unpolluted” for all studied metals.

3.6. Human Health Risk

The mean and maximum concentration, the daily dose, and a comparison with the risk estimations for a 70 kg man [44,45,46,47] and with nutritional requirements [43,44,80] are presented in Table 4 for every element detected in F. distichus.
In recent years, the consumption of seaweed has increased in Western nations. Seaweed is a splendid source of nutrition due to its high levels of protein, fatty acids, vitamins, and minerals. As a result, it’s becoming more popular to include seaweed in daily diets [61]. Approximately 35 million tons of seaweed were produced worldwide in 2019 [50]. Regulations for contaminant levels in seaweed vary across different regions of the world. The regulatory limits for selected heavy metals in seaweed food products are implemented in some countries. For example, upper limits for Pb, Cd, Sn, Hg, As, and I in seaweed for human consumption are approved in France. [76]. The limits for Pb, As, Cd, and Hg are established for algae in Russia [80]. The potential toxicity of Arctic F. distichus to consumers was evaluated in the present study by comparison of all tested elements with (a) the Provisional Tolerable Weekly and Monthly Intakes (PTWI and PTWM, respectively) recommended by the Joint FAO/WHO Expert Committee on Food Additives [45,46,47] and (b) the tolerable upper intake level (UL) recommended by the European Food Safety Authority [44].
After analyzing the information provided in Table 4, we have compared the intake and corresponding UL for the tested elements according to EFSA (2006). We noted that daily consumption of 3.3–12.5 g of F. distichus from BS (St. 5) with the highest Ca level (25.5 g/kg DW) corresponds to a daily intake of 0.18–0.32 g of this metal. This amount is equivalent to around 7.2–12.8% of the recommended daily intake for Ca, which is 2.5 g. Daily consumption of F. distichus (3.3–12.5 g) with the highest Cu (3.23 mg/kg DW) from BfS (St. 1) provides 0.04 mg of this metal. This level is 0.8% of the tolerated daily dose (5 mg) of Cu. The consumption of F. distichus from BS (St. 5) with the highest Zn (44.6 mg/kg DW) at the above-mentioned dose provides a daily intake of 0.42–0.56 mg of this element that is equal to 3.5–4.7% of the tolerable daily dose (12 mg) for Zn. The regular consumption of F. distichus from BS (St. 6) with the highest Al concentration (126.2 mg/kg DW) provides an intake of 0.86–1.58 mg of this metal, which is equal to about 2.2% of the tolerable daily dose (70 mg) for Al [81].
The regular consumption of F. distichus (3.3–12.5 g) from BS (St. 4) provides daily consumption of 0.86–1.58 mg of total As which is equal to 17–31.6% of the tolerable daily dose for total As (5 mg/day). In this study, As was analyzed as total As in F. distichus samples. Exposure to inorganic arsenic can have negative health effects, including an increased risk of developing diabetes [82], cardiovascular disease [83], and various types of cancer. The International Agency for Research on Cancer has classified inorganic arsenic as a human carcinogen (Group 1) [84]. It’s important to note that in marine species, As is mostly present in organic form, specifically as sugars. The trivalent (AsIII) and pentavalent (AsV) inorganic forms are toxic, but their organic derivatives (arsenopentine, arsenosugar, arsenocholine, arsenolipids, methyl arsenate, and dimethyl arsenate) have low toxicity [85]. The toxicity of arsenolipids has not been proven. Organic arsenic compounds such as arsenobetaine are classified as Group 3 (substances not classified as carcinogenic) according to the classification of the International Agency for Research on Cancer [84].
The human health risk caused by elements detected in F. distichus from the seas of the Arctic region was calculated for children and adults based on their daily consumption of seaweed. The targeted hazard quotient (THQ) and hazard index (HI) recommended by USEPA (2020) were used. The sum of all THQs of all elements equals HI. The calculated HI values are shown in Figure 6.
Generally, if the THQ value is below 1, there is no predicted health risk associated with some elements [86,87]. However, if the THQ is equal to or greater than 1, there may be a potential health risk that needs to be addressed through preventative or cautionary measures, as mentioned in reference [88]. In the present study, THQ for all elements in F. distichus samples was less than one. It indicates no potential health risk for humans. The HI values were also below one. The mean HI for all algae samples was calculated as 0.11 for adults and 0.022 for children. Thus, all studied samples of Arctic F. distichus are safe for daily consumption as they do not pose a carcinogenic risk to the health of adults or children (Figure 5).
It is important to note that F. distichus, found in the Arctic region’s seas (Baffin Sea, Norwegian Sea, White Sea, and Barents Sea), does not accumulate toxic elements in hazardous concentrations. Additionally, these algae can be used as a source of nutritional elements to meet humans’ daily nutritional needs.

4. Conclusions

In this study, the biochemical variability, antiradical properties, and health risks of Arctic Fucus distichus L. collected from the Baffin, Norwegian, White, and Barents Seas were studied. F. distichus from the seas of the Arctic is a rich source of carbohydrates. The accumulation of main carbohydrates (fucoidan, mannitol, and alginic acid) varied from 335 mg/g DW in NS (St. 2) to 445 mg/g DW in BS (St. 1). The highest level of the sum of polyphenols and flavonoids was found in samples of F. distichus from WS and was increased in the following order: BS < BfS < NS < WS. The DPPH radical scavenging activity of seaweed was correlated with its phenolic content. It is noteworthy that all the Arctic F. distichus samples tested did not contain detectable levels of toxic elements such as Cd, Cr, Pb, and Ni, or their concentrations were below the limit of quantification (LOQ). According to calculated THQ and HI values, samples of Arctic F. distichus are safe for daily consumption as they do not pose a carcinogenic risk to the health of adults or children. The results of this study support the rationale for using Arctic F. distichus as a valuable source of polysaccharides, polyphenols, and flavonoids. We believe that our data will help to effectively use the potential of F. distichus and expand the use of this alga as a promising and safe raw material for the food and pharmaceutical industries.

Author Contributions

Conceptualization, O.N.P. and A.N.S.; methodology, E.D.O., O.N.P., I.I.T. and A.N.S.; software, O.N.P.; validation, E.D.O. and Y.E.G.; formal analysis, O.N.P. and A.N.S.; investigation, E.D.O., O.N.P., E.V.G., D.V.Z. and Y.E.G.; resources, E.D.O.; data curation, O.N.P., E.V.F., I.I.T. and A.N.S.; writing—original draft preparation, O.N.P.; writing—review and editing, O.N.P. and A.N.S.; visualization, O.N.P. and D.V.Z.; supervision, A.N.S.; project administration, E.D.O.; funding acquisition, E.D.O. and I.I.T. All authors have read and agreed to the published version of the manuscript.

Funding

This study was funded by the Ministry of Science and Higher Education of the Russian Federation within the framework of the Government Assignment to the Murmansk Marine Biological Institute of the Russian Academy of Sciences (State Reg. No. 121091600104-7). The elements analyses performed in the Core Shared Research Facilities “Analytical Center” of the Saint-Petersburg State Chemical and Pharmaceutical University with financial support from the Ministry of Education and Science of Russia (The agreement No. 075-15-2021-685 dated 26 July 2021).

Data Availability Statement

All data generated or analyzed during this study are included in this published article.

Acknowledgments

Authors thank Lyubov Zakharova for technical assistance.

Conflicts of Interest

The authors declare that they have no known competing financial interests or personal relationships that could have appeared to influence the work reported in this paper.

References

  1. Guiry, M.D.; Guiry, G.M. AlgaeBase; World-Wide Electronic Publication, National University of Ireland: Galway, Ireland, 2023; Available online: https://www.algaebase.org (accessed on 2 May 2023).
  2. WoRMS Editorial Board; World Register of Marine Species. 2023. Available online: https://www.marinespecies.org/aphia.php?p=taxdetails&id=145544 (accessed on 2 May 2023).
  3. Leandro, A.; Pacheco, D.; Cotas, J.; Marques, J.C.; Pereira, L.; Gonçalves, A.M.M. Seaweed’s bioactive candidate compounds to food industry and global food security. Life 2020, 10, 140. [Google Scholar] [CrossRef]
  4. Jueterbock, A.; Smolina, I.; Coyer, J.A.; Hoarau, G. The fate of the Arctic seaweed Fucus distichus under climate change: An ecological niche modeling approach. Ecol. Evol. 2016, 6, 1712–1724. [Google Scholar] [CrossRef] [Green Version]
  5. Sukhoveeva, M.V.; Podkorytova, A.V. Commercial Algae and Grasses of the Seas of the Far East: Biology, Distribution, Stocks, Processing Technology; Tinro-Center: Vladivostok, Russia, 2006. [Google Scholar]
  6. Aimakov, O.A. Biological value of extractives of brown algae. J. Agric. Environ. 2022, 6, 26. [Google Scholar] [CrossRef]
  7. Aminina, N.M.; Vishnevskaya, T.I.; Guruleva, O.N.; Kovekovdova, L.T. Biological value and parameters of safety of brown seaweeds in the Far-Eastern seas. Bulletin FEB RAS 2007, 6, 123–130. [Google Scholar]
  8. Catarino, M.D.; Silva, A.; Cardoso, S.M. Phycochemical constituents and biological activities of Fucus spp. Mar. Drugs 2018, 16, 249. [Google Scholar] [CrossRef] [PubMed] [Green Version]
  9. Podkorytova, A.V.; Roshchina, A.N.; Evseeva, N.V.; Usov, A.I.; Golovin, G.Y.; Popov, A.M. Brown algae of the orders Laminariales and Fucales from the Sakhalin-Kuril region: Stocks, extraction, use. Trudy VNIRO 2020, 181, 235–256. [Google Scholar] [CrossRef]
  10. Cumashi, A.; Ushakova, N.A.; Preobrazhenskaya, M.E.; D’Incecco, A.; Piccoli, A.; Totani, L.; Tinari, N.; Morozevich, G.E.; Berman, A.E.; Bilan, M.I.; et al. A comparative study of the anti-inflammatory, anticoagulant, antiangiogenic, and antiadhesive activities of nine different fucoidans from brown seaweeds. Glycobiology 2007, 17, 541–552. [Google Scholar] [CrossRef] [Green Version]
  11. Obluchinskaya, E.D.; Pozharitskaya, O.N.; Shikov, A.N. In Vitro anti-inflammatory activities of fucoidans from five species of brown seaweeds. Mar. Drugs 2022, 20, 606. [Google Scholar] [CrossRef]
  12. Nguyen, T.T.; Mikkelsen, M.D.; Tran, V.H.N.V.; Trang, T.D.; Rhein-Knudsen, N.; Holck, J.; Rasin, A.B.; Cao, H.T.T.; Van, T.T.T.; Meyer, A.S. Enzyme-assisted fucoidan extraction from brown macroalgae Fucus distichus subsp. evanescens and Saccharina latissimi. Mar. Drugs 2020, 18, 296. [Google Scholar] [CrossRef]
  13. Romoth, K.; Nowak, P.; Kempke, D.; Dietrich, A.; Porsche, C.; Schubert, H. Acclimation limits of Fucus evanescens along the salinity gradient of the southwestern Baltic Sea. Bot. Mar. 2019, 62, 31–42. [Google Scholar] [CrossRef]
  14. Imbs, T.I.; Krasovskaya, N.P.; Ermakova, S.P.; Makarieva, T.N.; Shevchenko, N.M.; Zvyagintseva, T.N. Comparative study of chemical composition and antitumor activity of aqueous-ethanol extracts of brown algae Laminaria cichorioides, Costaria costata, and Fucus evanescens. Russ. J. Mar. Biol. 2009, 35, 164–170. [Google Scholar] [CrossRef]
  15. Kreissig, K.J.; Hansen, L.T.; Jensen, P.E.; Wegeberg, S.; Geertz-Hansen, O.; Sloth, J.J. Characterisation and chemometric evaluation of 17 elements in ten seaweed species from Greenland. PLoS ONE 2021, 16, e0243672. [Google Scholar] [CrossRef] [PubMed]
  16. Usov, A.I.; Bilan, M.I.; Ustyuzhanina, N.E.; Nifantiev, N.E. Fucoidans of brown algae: Comparison of sulfated polysaccharides from Fucus vesiculosus and Ascophyllum nodosum. Mar. Drugs 2022, 20, 638. [Google Scholar] [CrossRef] [PubMed]
  17. Ponce, N.M.; Stortz, C.A. A comprehensive and comparative analysis of the fucoidan compositional data across the Phaeophyceae. Front. Plant Sci. 2020, 11, 556312. [Google Scholar] [CrossRef]
  18. Zayed, A.; El-Aasr, M.; Ibrahim, A.-R.S.; Ulber, R. Fucoidan characterization: Determination of purity and physicochemical and chemical properties. Mar. Drugs 2020, 18, 571. [Google Scholar] [CrossRef] [PubMed]
  19. Apostolova, E.; Lukova, P.; Baldzhieva, A.; Delattre, C.; Molinié, R.; Petit, E.; Elboutachfaiti, R.; Nikolova, M.; Iliev, I.; Murdjeva, M.; et al. Structural characterization and in vivo anti-inflammatory activity of fucoidan from Cystoseira crinita (Desf.) Borry. Mar. Drugs 2022, 20, 714. [Google Scholar] [CrossRef]
  20. Rohwer, K.; Neupane, S.; Bittkau, K.S.; Pérez, M.G.; Dörschmann, P.; Roider, J.; Alban, S.; Klettner, A. Effects of crude Fucus distichus subspecies evanescens fucoidan extract on retinal pigment epithelium cells—Implications for use in age-related macular degeneration. Mar. Drugs 2019, 17, 538. [Google Scholar] [CrossRef] [Green Version]
  21. Mateos, R.; Pérez-Correa, J.R.; Domínguez, H. Bioactive properties of marine phenolics. Mar. Drugs 2020, 18, 501. [Google Scholar] [CrossRef]
  22. Wells, M.L.; Potin, P.; Raven, J.A.; Craigie, J.; Merchant, S.S.; Helliwell, K.E.; Smith, A.G.; Camire, M.E.; Brawley, S.H. Algae as nutritional and functional food sources: Revisiting our understanding. J. Appl. Phycol. 2017, 29, 949–982. [Google Scholar] [CrossRef]
  23. Kashutin, A.N.; Egorova, E.V.; Kashutina, I.A.; Rogalyova, N.L. Influence of anthropogenic pollution on macrophyte algae of Avacha Bay (Southeastern Kamchatka). Ekosistemy 2020, 24, 130–141. [Google Scholar] [CrossRef]
  24. Kumar, M.S.; Sharma, S.A. Toxicological effects of marine seaweeds: A cautious insight for human consumption. Crit. Rev. Food Sci. Nutr. 2020, 61, 500–521. [Google Scholar] [CrossRef]
  25. Hahn, J.L.; Van Alstyne, K.L.; Gaydos, J.K.; Wallis, L.K.; West, J.E.; Hollenhorst, S.J.; Ylitalo, G.M.; Poppenga, R.H.; Bolton, J.L.; McBride, D.E.; et al. Chemical contaminant levels in edible seaweeds of the Salish Sea and implications for their consumption. PLoS ONE. 2022, 17, e0269269. [Google Scholar] [CrossRef]
  26. García-Seoane, R.; Fernández, J.A.; Villares, R.; Aboal, J.R. Use of macroalgae to biomonitor pollutants in coastal waters: Optimization of the methodology. Ecol. Indic. 2018, 84, 710–726. [Google Scholar] [CrossRef]
  27. Obluchinskaya, E.; Zakharova, L. Metal concentrations in three species of Fucus L. on the Murmansk coast of the Barents Sea. Polar Sci. 2021, 28, 100646. [Google Scholar] [CrossRef]
  28. Usov, A.I.; Smirnova, G.P.; Klochkova, N.G. Polysaccharides of algae: 55. Polysaccharide composition of several brown algae from Kamchatka. Russ. J. Bioorg. Chem. 2001, 27, 395–399. [Google Scholar] [CrossRef]
  29. Dische, Z.; Shettles, L.B. A specific color reaction of methylpentoses and a spectrophotometric micromethod for their determination. J. Biol. Chem. 1948, 175, 595–603. [Google Scholar] [CrossRef] [PubMed]
  30. Obluchinskaya, E.; Daurtseva, A. Effects of air drying and freezing and long-term storage on phytochemical composition of brown seaweeds. J. Appl. Phycol. 2020, 32, 4235–4249. [Google Scholar] [CrossRef]
  31. Rodríguez-Jasso, R.M.; Mussatto, S.I.; Pastrana, L.; Aguilar, C.N.; Teixeira, J.A. Extraction of sulfated polysaccharides by autohydrolysis of brown seaweed Fucus vesiculosus. J. Appl. Phycol. 2013, 25, 31–39. [Google Scholar] [CrossRef] [Green Version]
  32. Obluchinskaya, E.D. Comparative chemical composition of the Barents Sea brown algae. Appl. Biochem. Microbiol. 2008, 44, 305–309. [Google Scholar] [CrossRef]
  33. Usov, A.I.; Bilan, M.I.; Klochkova, N.G. Polysaccharides of algae. 48. Polysaccharide composition of several calcareous red algae: Isolation of alginate from Corallina pilulifera P. et R. (Rhodophyta, Corallinaceae). Bot. Mar. 1995, 38, 43–51. [Google Scholar] [CrossRef]
  34. Uribe, E.; Pardo-Orellana, C.M.; Vega-Gálvez, A.; Ah-Hen, K.S.; Pastén, A.; García, V.; Aubourg, S.P. Effect of drying methods on bioactive compounds, nutritional, antioxidant, and antidiabetic potential of brown alga Durvillaea antarctica. Dry Technol. 2020, 38, 1915–1928. [Google Scholar] [CrossRef]
  35. Uribe, E.; Vega-Gálvez, A.; Vargas, N.; Pasten, A.; Rodríguez, K.; Ah-Hen, K.S. Phytochemical components and amino acid profile of brown seaweed Durvillaea antarctica as affected by air drying temperature. J. Food Sci. Technol. 2018, 55, 4792–4801. [Google Scholar] [CrossRef]
  36. Generalić Mekinić, I.; Šimat, V.; Botić, V.; Crnjac, A.; Smoljo, M.; Soldo, B.; Ljubenkov, I.; Čagalj, M.; Skroza, D. Bioactive phenolic metabolites from Adriatic brown algae Dictyota dichotoma and Padina pavonica (Dictyotaceae). Foods 2021, 10, 1187. [Google Scholar] [CrossRef]
  37. Obluchinskaya, E.D.; Pozharitskaya, O.N.; Zakharov, D.V.; Flisyuk, E.V.; Terninko, I.I.; Generalova, Y.E.; Smekhova, I.E.; Shikov, A.N. The Biochemical composition and antioxidant properties of Fucus vesiculosus from the Arctic region. Mar. Drugs 2022, 20, 193. [Google Scholar] [CrossRef]
  38. Brand-Williams, W.; Cuvelier, M.E.; Berset, C. Use of free radical method to evaluate antioxidant capacity. LWT-Food Sci. Technol. 1995, 28, 25–30. [Google Scholar] [CrossRef]
  39. Wang, T.; Jónsdóttir, R.; Ólafsdóttir, G. Total phenolic compounds, radical scavenging and metal chelation of extracts from Icelandic seaweeds. Food Chem. 2009, 116, 240–248. [Google Scholar] [CrossRef]
  40. Flores, É.M.D.M.; Barin, J.S.; Paniz, J.N.G.; Medeiros, J.A.; Knapp, G. Microwave-assisted sample combustion: A technique for sample preparation in trace element determination. Anal. Chem. 2004, 76, 3525–3529. [Google Scholar] [CrossRef] [PubMed]
  41. Shikov, A.N.; Obluchinskaya, E.D.; Flisyuk, E.V.; Terninko, I.I.; Generalova, Y.E.; Pozharitskaya, O.N. The Impact of natural deep eutectic solvents and extraction method on the co-extraction of trace metals from Fucus vesiculosus. Mar. Drugs 2022, 20, 324. [Google Scholar] [CrossRef]
  42. Usero, J.; Morillo, J.; Gracia, I. Heavy metal concentrations in molluscs from the Atlantic coast of southern Spain. Chemosphere 2005, 59, 1175–1181. [Google Scholar] [CrossRef] [PubMed]
  43. Norms of Physiological Needs Energy and Nutrients for Various Groups of the Population of the Russian Federation. In Methodical Recommendations; MR 2.3.1.2432−08; Federal Center for Hygiene and Epidemiology of Rospotrebnadzor: Moscow, Russia, 2009.
  44. EFSA European Food Safety Authority. Tolerable Upper Intake Levels for Vitamins and Minerals. February 2006. Available online: www.efsa.europa.eu/sites/default/files/efsa_rep/blobserver_assets/ndatolerableuil.pdf (accessed on 2 May 2023).
  45. WHO. World Health Organization Evaluation of Certain Food Additives and Contaminants: Seventy-Second Report of the Joint FAO/WHO Expert Committee on Food Additives; WHO Technical Report Series No. 959; WHO: Geneva, Switzerland, 2011. [Google Scholar]
  46. WHO. World Health Organization Evaluation of Certain Food Additives and Contaminants: Seventy-Third Report of the Joint FAO/WHO Expert Committee on Food Additives, Geneva, 2010; WHO Technical Report Series No. 960; WHO: Geneva, Switzerland, 2011. [Google Scholar]
  47. JECFA. Safety Evaluation of Certain Food Additives and Contaminants. 67th Joint FAO/WHO Expert Committee on Food Additives, WHO, Rome, Italy. 2006. Available online: http://www.who.int/ipcs/food/jecfa/summaries/summary67.pdf (accessed on 2 May 2023).
  48. USEPA, Human Health Risk Assessment. Environmental Protection Agency, USA. 2020. Available online: https://www.epa.gov/risk/human-health-risk-assessment (accessed on 25 April 2023).
  49. Siddique, M.A.M.; Hossain, M.S.; Islam, M.M.; Rahman, M.; Kibria, G. Heavy metals and metalloids in edible seaweeds of Saint Martin’s Island, Bay of Bengal, and their potential health risks. Mar. Pollut. Bull. 2022, 181, 113866. [Google Scholar] [CrossRef] [PubMed]
  50. World Health Organization. Report of the Expert Meeting on Food Safety for Seaweed—Current Status and Future Perspectives. Rome, 28–29 October 2021; Food Safety and Quality Series No. 13; FAO; WHO: Rome, Italy, 2022. [Google Scholar] [CrossRef]
  51. Zvyagintseva, T.N.; Shevchenko, N.M.; Chizhov, A.O.; Krupnova, T.N.; Sundukova, E.V.; Isakov, V.V. Water-soluble polysaccharides of some far-eastern brown seaweeds. Distribution, structure, and their dependence on the developmental conditions. J. Exp. Mar. Biol. Ecol. 2003, 294, 1–13. [Google Scholar] [CrossRef]
  52. Kiseleva, M.I.; Imbs, T.I.; Avilov, S.A.; Bakunina, I.Y. The effects of polyphenolic impurities in fucoidan samples from the brown alga Fucus distichus subsp. evanescens (C. Agardh) HT Powell, 1957 on the embryogenesis in the sea urchin Strongylocentrotus intermedius (A. Agassiz, 1864) and on the embryotoxic action of cucumarioside. Russ. J. Mar. Biol. 2021, 47, 290–299. [Google Scholar] [CrossRef]
  53. Dörschmann, P.; Klettner, A. Fucoidans as potential therapeutics for age-related macular degeneration—Current evidence from in vitro research. Int. J. Mol. Sci. 2020, 21, 9272. [Google Scholar] [CrossRef]
  54. Wang, F.; Xiao, Y.; Neupane, S.; Ptak, S.H.; Römer, R.; Xiong, J.; Ohmes, J.; Seekamp, A.; Frette, X.; Alban, S.; et al. Influence of fucoidan extracts from different fucus species on adult stem cells and molecular mediators in in vitro models for bone formation and vascularization. Mar. Drugs 2021, 19, 194. [Google Scholar] [CrossRef]
  55. Ohmes, J.; Mikkelsen, M.D.; Nguyen, T.T.; Tran, V.H.N.; Meier, S.; Nielsen, M.S.; Ding, M.; Seekamp, A.; Meyer, A.S.; Fuchs, S. Depolymerization of fucoidan with endo-fucoidanase changes bioactivity in processes relevant for bone regeneration. Carbohydr. Polym. 2022, 286, 119286. [Google Scholar] [CrossRef]
  56. Dörschmann, P.; Apitz, S.; Hellige, I.; Neupane, S.; Alban, S.; Kopplin, G.; Ptak, S.; Fretté, X.; Roider, J.; Zille, M.; et al. Evaluation of the effects of fucoidans from Fucus species and Laminaria hyperborea against oxidative stress and iron-dependent cell death. Mar. Drugs 2021, 19, 557. [Google Scholar] [CrossRef] [PubMed]
  57. Skriptsova, A.V.; Shevchenko, N.M.; Tarbeeva, D.V.; Zvyagintseva, T.N. Comparative study of polysaccharides from reproductive and sterile tissues of five brown seaweeds. Mar. Biotechnol. 2012, 14, 304–311. [Google Scholar] [CrossRef] [PubMed]
  58. Ghoreishi, S.M.; Shahrestani, R.G. Innovative strategies for engineering mannitol production. Trends Food Sci. Technol. 2009, 20, 263–270. [Google Scholar] [CrossRef]
  59. Usov, A.I.; Klochkova, N.G. Brown–algae from Kamchatka as a source of mannitol. Bioorganicheskaya Khimiya 1994, 20, 1234–1241. [Google Scholar]
  60. Klindukh, M.P.; Obluchinskaya, E.D.; Matishov, G.G. Seasonal changes in the mannitol and proline contents of the brown alga Fucus vesiculosus L. on the Murman coast of the Barents Sea. Dokl. Biol. Sci. 2021, 441, 373–376. [Google Scholar] [CrossRef] [PubMed]
  61. Leandro, A.; Pereira, L.; Gonçalves, A.M.M. Diverse applications of marine macroalgae. Mar. Drugs 2020, 18, 17. [Google Scholar] [CrossRef] [Green Version]
  62. Mandel, K.G.; Daggy, D.A.; Brodie, H.I. Jacoby, Review article: Alginate-raft formulations in the treatment of heartburn and acid reflux. Aliment. Pharmacol. Ther. 2000, 14, 669–690. [Google Scholar] [CrossRef] [PubMed]
  63. Meng, W.; Mu, T.; Sun, H.; Garcia-Vaquero, M. Phlorotannins: A review of extraction methods, structural characteristics, bioactivities, bioavailability, and future trends. Algal Res. 2021, 60, 102484. [Google Scholar] [CrossRef]
  64. Imbs, T.I.; Skriptsova, A.V.; Zvyagintseva, T.N. Antioxidant activity of fucose-containing sulfated polysaccharides obtained from Fucus evanescens by different extraction methods. J. Appl. Phycol. 2015, 27, 545–553. [Google Scholar] [CrossRef]
  65. Lim, S.J.; Aida, W.M.W.; Maskat, M.Y.; Mamot, S.; Ropien, J.; Mohd, D.M. Isolation and antioxidant capacity of fucoidan from selected Malaysian seaweeds. Food Hydrocoll. 2014, 42, 280–288. [Google Scholar] [CrossRef]
  66. Valentão, P.; Trindade, P.; Gomes, D.; Guedes de Pinho, P.; Mouga, T.; Andrade, P.B. Codium tomentosum and Plocamium cartilagineum: Chemistry and antioxidant potential. Food Chem. 2010, 119, 1359–1368. [Google Scholar] [CrossRef]
  67. Mohamed, S.; Hashim, S.N.; Rahman, H.A. Seaweeds: A sustainable functional food for complementary and alternative therapy. Trends Food Sci. Technol. 2012, 23, 83–96. [Google Scholar] [CrossRef]
  68. Francisco, J.; Horta, A.; Pedrosa, R.; Afonso, C.; Cardoso, C.; Bandarra, N.M.; Gil, M.M. Bioaccessibility of antioxidants and fatty acids from Fucus spiralis. Foods 2020, 9, 440. [Google Scholar] [CrossRef] [Green Version]
  69. Farvin, K.S.; Jacobsen, C. Phenolic compounds and antioxidant activities of selected species of seaweeds from Danish coast. Food Chem. 2013, 138, 1670–1681. [Google Scholar] [CrossRef]
  70. Peinado, I.; Girón, J.; Koutsidis, G.; Ames, J.M. Chemical composition, antioxidant activity and sensory evaluation of five different species of brown edible seaweeds. Food Res. Int. 2014, 66, 36–44. [Google Scholar] [CrossRef] [Green Version]
  71. Krause-Jensen, D.; Duarte, C.M. Expansion of vegetated coastal ecosystems in the future Arctic. Front. Mar. Sci. 2014, 1, 77. [Google Scholar] [CrossRef] [Green Version]
  72. Obluchinskaya, E.D.; Pozharitskaya, O.N.; Zakharov, D.V.; Flisyuk, E.V.; Terninko, I.I.; Generalova, Y.E.; Shikov, A.N. Biochemical composition, antiradical potential and human health risk of the Arctic edible brown seaweed Fucus spiralis L. J. Appl. Phycol. 2023, 35, 365–380. [Google Scholar] [CrossRef]
  73. Podkorytova, A.V.; Roshchina, A.N. Marine brown algae—Perspective source of BAS for medical, pharmaceutical and food use. Trudy VNIRO 2021, 186, 156–172. [Google Scholar]
  74. Chernova, E.N. The biogeochemical background and trace metal accumulation by brown algae of the genus Fucus in coastal waters of the Sea of Japan, the Sea of Okhotsk, and the White Sea. Russ. J. Mar. Biol. 2016, 42, 87–96. [Google Scholar] [CrossRef]
  75. Ma, Z.; Lin, L.; Wu, M.; Yu, H.; Shang, T.; Zhang, T.; Zhao, M. Total and inorganic arsenic contents in seaweeds: Absorption, accumulation, transformation and toxicity. Aquaculture 2018, 497, 49–55. [Google Scholar] [CrossRef]
  76. Roleda, M.Y.; Marfaing, H.; Desnica, N.; Jónsdóttir, R.; Skjermo, J.; Rebours, C.; Nitschke, U. Variations in polyphenol and heavy metal contents of wild-harvested and cultivated seaweed bulk biomass: Health risk assessment and implication for food applications. Food Control 2019, 95, 121–134. [Google Scholar] [CrossRef]
  77. Güven, K.C.; Akyüz, K.; Yurdun, T. Selectivity of heavy metal binding by algal polysaccharides. Toxicol. Environ. Chem. 1995, 47, 65–70. [Google Scholar] [CrossRef]
  78. SFT. Classification of Environmental Quality in Fjords and Coastal Waters; Guidance Document 97:03; TA-1467/1997; Norwegian State Pollution Control Authority: Oslo, Norway, 1997; p. 36. (In Norwegian) [Google Scholar]
  79. European Union Commission Regulation (EC) No 629/2008 amending Regulation (EC) No 1881/2006 setting maximum levels for certain contaminants in foodstuffs. OJEU 2008, L 173, 6–9. Available online: https://eur-lex.europa.eu/legal-content/EN/TXT/?uri=uriserv:OJ.L_.2008.173.01.0006.01.ENG (accessed on 2 May 2023).
  80. SanPiN 2.3.2.1078-01; Food Raw Materials and Food Products Hygiene Requirements for Safety and Nutritional Food. Sanitary-Epidemiological Rules and Standards: Moscow, Russia, 2002.
  81. SCF: Scientific Committee for Food of the European Communities. 2011. Available online: http://ec.europa.eu/food/fs/sc/scf/index_en.html (accessed on 2 May 2023).
  82. Wang, W.; Xie, Z.; Lin, Y.; Zhang, D. Association of inorganic arsenic exposure with type 2 diabetes mellitus: A meta-analysis. J. Epidemiol. Community Health 2014, 68, 176–184. [Google Scholar] [CrossRef]
  83. Moon, K.A.; Oberoi, S.; Barchowsky, A.; Chen, Y.; Guallar, E.; Nachman, K.E.; Rahman, M.; Sohel, N.; D’Ippoliti, D.; Wade, T.J.; et al. A dose-response meta-analysis of chronic arsenic exposure and incident cardiovascular disease. Int. J. Epidemiol. 2017, 46, 1924–1939. [Google Scholar] [CrossRef] [Green Version]
  84. IARC Monographs on the Evaluation of Carcinogenic Risks to Humans Volume 100C. 2012. Arsenic, Metals, Fibres, and Dusts. Available online: https://publications.iarc.fr/120 (accessed on 2 May 2023).
  85. Sartal, C.G.; Alonso, M.C.B.; Barrera, P.B. Arsenic in seaweed: Presence, bioavailability and speciation. In Seafood Science: Advances in Chemistry Technology and Applications; Kim, S.-K., Ed.; CRC Press, Taylor & Francis Group: Boca Raton, FL, USA, 2014; pp. 276–351. [Google Scholar]
  86. Chien, L.C.; Hung, T.C.; Choang, K.Y.; Yeh, C.Y.; Meng, P.J.; Shieh, M.J.; Ha, B.C. Daily intake of TBT, Cu, Zn, Cd and as for fishermen in Taiwan. Sci. Total Environ. 2002, 285, 177–185. [Google Scholar] [CrossRef]
  87. U.S. EPA. Concepts, Methods, and Data Sources For Cumulative Health Risk Assessment of Multiple Chemicals, Exposures and Effects: A Resource Document (Final Report, 2008); EPA/600/R-06/013F; U.S. Environmental Protection Agency: Washington, DC, USA, 2007. Available online: https://cfpub.epa.gov/ncea/risk/recordisplay.cfm?deid=190187 (accessed on 2 May 2023).
  88. Rahman, M.S.; Hossain, M.B.; Babu, S.; Rahman, M.; Ahmed, A.S.S.; Jolly, Y.N.; Choudhury, T.R.; Begum, B.A.; Kabir, J.; Akter, S. Source of metal contamination in sediment, their ecological risk, and phytoremediation ability of the studied mangrove plants in ship breaking area, Bangladesh. Mar. Pollut. Bull. 2019, 141, 137–146. [Google Scholar] [CrossRef] [PubMed]
Figure 1. Map of the sampling sites: (A) Baffin Sea–Station (St.) 1 (Disko Bay); (B) Norwegian Sea–St. 2 (Ringvassøya Island; (C) White Sea–St. 3 (Pezhostrov Island of the Kandalaksha Bay); (D) Barents Sea–St. 4 (Teriberskaya Bay (Korabelnaya Bay)), St. 5 (Teriberskaya Bay (Zavalishina Bay)), and St. 6 (Zelenetskaya bay).
Plants 12 02380 g001
Figure 2. The level of main carbohydrates from F. distichus from different seas of the Arctic region. BfS (Baffin Sea)–St. 1 (Disko Bay), NS (Norwegian Sea)–St. 2 (Ringvassøya Island), WS (White Sea)–St. 3 (Pezhostrov Island), and BS (Barents Sea)–St. 4 (Korabelnaya Bay), St. 5 (Zavalishina Bay), and St. 6 (Zelenetskaya bay) (error bars for SD at n = 3). The station locations (St. 1–St. 6) are presented in Figure 1.
Plants 12 02380 g002
Figure 3. The typical chromatogram of (A) reference compounds fucose and xylose and (B) a sample of F. distichus from the BS (Barents Sea), St. 4 (Korabelnaya Bay).
Plants 12 02380 g003
Figure 4. The correlation between DPPH scavenging activity (expressed as IC50) and TPC and TFC in F. distichus collected in different Arctic seas: experimental data—markers (error bars for SD at n = 3), and the correlation—lines (blue—TPC; red—TFC). BfS (Baffin Sea)–St. 1 (Disko Bay), (NS) Norwegian Sea–St. 2 (Ringvassøya Island), WS (White Sea)–St. 3 (Pezhostrov Island), and BS (Barents Sea)–St. 4 (Korabelnaya Bay), St. 5 (Zavalishina Bay), and St. 6 (Zelenetskaya bay) (error bars for SD at n = 3). The station locations (St. 1–St. 6) are presented in Figure 1.
Plants 12 02380 g004
Figure 5. Cumulative accumulation of metals by F. distichus collected at different regions of the Arctic. St. 1 (Disko Bay) from BfS (Baffin Sea), St. 2 (Ringvassøya Island) from NS (Norwegian Sea), St. 3 (Pezhostrov Island) from WS (White Sea), and St. 4 (Korabelnaya Bay), St. 5 (Zavalishina Bay), and St. 6 (Zelenetskaya bay) from BS (Barents Sea). The station locations (St. 1–St. 6) are presented in Figure 1.
Plants 12 02380 g005
Figure 6. The hazard indexes (HI) for F. distichus collected in the Arctic (error bars for SD at n = 3). BfS (Baffin Sea), NS (Norwegian Sea), WS (White Sea), and BS (Barents Sea).
Plants 12 02380 g006
Table 1. Characterization of collection sites of F. distichus.
Sea AreaSampling SiteCoordinatesStation on Figure 1Mean Water Temperature, °CRange of Salinity, ‰
Baffin SeaDisko Bay69.219858 N 51.111819 WSt. 111.025.8–26.2
Norwegian SeaRingvassøya Island69.815097 N 19.027894 ESt. 210.633.7–34.3
White SeaPezhostrov Island66.273315 N 33.934406 ESt. 317.222.1–22.3
Barents SeaTeriberskaya Bay (Korabelnaya Bay)69.173088 N
35.168468 E
St. 411.214.7–15.5
Barents SeaTeriberskaya Bay (Zavalishina Bay)69.184068 N
35.259487 E
St. 59.119.9–20.7
Barents SeaZelenetskaya Bay69.117150 N
36.070790 E
St. 610.331.0–32.0
St. 1–St. 6–station 1–station 6.
Table 2. The level of fucose and xylose in samples of F. distichus (mean ± SD, n = 3).
Sea, StationFucose, mg/g DWXylose, mg/g DWFucose/Xylose Ratio
BfS, St. 143.5 ± 1.55.4 ± 0.38.05 ± 0.57
NS, St. 258.1 ± 1.88.9 ± 0.86.53 ± 0.41
WS, St. 359.9 ± 1.89.8 ± 0.66.12 ± 0.31
BS, St. 475.2 ± 1.313.6 ± 1.05.57 ± 0.35
BS, St. 562.1 ± 0.514.2 ± 0.44.38 ± 0.13
BS, St. 690.3 ± 0.417.5 ± 0.45.16 ± 0.10
Baffin Sea (BfS), Norwegian Sea (NS), White Sea (WS), and Barents Sea (BS).
Table 3. The concentrations of tested elements (mg/kg DW) in samples of Arctic F. distichus (mean ± SD, n = 3).
ElementLOQMean ± sdRange
(min–max)
St. 1St. 2St. 3St. 4St. 5St. 6
Al1.668.9 ± 37.533.3–126.258.7 ± 4.838.0 ± 2.8103.4 ± 4.033.3 ± 1.253.7 ± 4.3126.2 ± 18.9
As6.332.4 ± 15.419.2–58.519.2 ± 3.327.2 ± 1.721.6 ± 0.758.5 ± 0.743.4 ± 2.924.7 ± 0.9
Ba 0.01613.0 ±7.77.3–28.010.4 ± 0.27.3 ± 1.628.0 ± 0.214.0 ± 0.610.4 ± 0.27.9 ± 0.2
Ca1.914,774 ± 55659490–25,47615,029 ± 17713,816 ± 50912,037 ± 26812,795 ± 25525,476 ± 5809490 ± 17
Cd0.23<LOQ<LOQ<LOQ<LOQ<LOQ<LOQ<LOQ<LOQ
Co0.121.8 ± 2.30.6–6.50.96 ± 0.020.71 ± 0.066.46 ± 0.021.03 ± 0.051.31 ± 0.010.62 ± 0.01
Cr0.13<LOQ< LOQ<LOQ<LOQ<LOQ<LOQ<LOQ<LOQ
Cu0.371.7 ± 1.10.6–3.23.23 ± 0.121.46 ± 0.092.86 ± 0.181.11 ± 0.240.97 ± 0.040.60 ± 0.01
Fe0.098214 ± 19074–56273.8 ± 10.7112 ± 21562 ± 1597.1 ± 6.6132 ± 19310 ± 10
Mg1.79304 ± 7008400–10,22210222 ± 1249510 ± 319904 ± 1719056 ± 208731 ± 678400 ± 28
Mn0.05845.8 ± 27.815.3–90.159.7 ± 1.715.3 ± 1.490.1 ± 4.432.7 ± 0.654.3 ± 0.322.8 ± 0.2
Ni0.310.2 ± 1.1 <LOQ–10.9<LOQ<LOQ<LOQ9.5 ± 0.0910.9 ± 0.04<LOQ
Pb4.6<LOQ<LOQ<LOQ<LOQ<LOQ<LOQ<LOQ<LOQ
Rb0.5536.4 ± 12.822.5–54.154.1 ± 1.535.8 ± 0.749.8 ± 1.228.9 ± 0.922.5 ± 0.627.3 ± 3.0
Sr0.026875 ± 130704–1051828 ± 35833 ± 211009 ± 301051 ± 32828 ± 8704 ± 9
Zn0.1733.8 ± 8.126.9–44.627.3 ± 1.027.7 ± 1.733.1 ± 0.542.9 ± 0.944.6 ±0.326.9 ±1.0
LOQ—limit of quantification; St. 1–St. 6—the sampling stations.
Table 4. Element concentrations, their daily dose for F. distichus from different Arctic regions, and comparison with daily dose risk estimators for a 70-kg man and with nutritional requirements.
ElementSampling Site with a
Maximum Concentration
Mean–Max Concentration (mg/kg)Single Dose for
3.3 g Consumption
(mg/Day)
Daily Dose for
12.5 g Consumption
(mg/Day)
Daily Dose from Risk EstimatorsDaily Nutritional
Requirements
AlBS, St. 668.9–126.20.23–0.420.86–1.5870 110 5
As (total)BS, St. 432.4–58.50.11–0.190.41–0.730.15 1
(inorganic)
5.0 6
BaWS, St. 313.0–28.00.04–0.090.16–0.352000.75 5
CaBS, St. 514,774–25,47649–84185–3182500 21000 3
CoWS, St. 31.8–6.50.006–0.0210.023–0.08130 510 5
CuBfS, St. 11.7–3.20.006–0.0110.021–0.0405 2,50.9 4/1.0 5
FeWS, St. 3214–5620.71–1.862.68–7.0345 510 3,5
MgBfS, St. 19304–10,22231–34116–128800 5400 5
MnWS, St. 345.8–90.10.15–0.300.57–1.1311 52.7 3/2.0 5
NiBS, St. 53.6–11.00.012–0.0360.045–0.1420 50.2 5
RbBfS, St. 136.4–56.10.12–0.180.45–0.682002.2 5
SrBS, St. 4875–10512.89–3.4710.9–13.111 51.9 5
ZnBS, St. 533.8–44.60.11–0.150.42–0.5625 2/40 512 3,5
1 PTWI: Provisional tolerable weekly intake; 2 UL: Tolerable upper intake level; 3 PRI: Population reference intake; 4 AI: Adequate intake; 5 [43]; 6 [80].
Disclaimer/Publisher’s Note: The statements, opinions and data contained in all publications are solely those of the individual author(s) and contributor(s) and not of MDPI and/or the editor(s). MDPI and/or the editor(s) disclaim responsibility for any injury to people or property resulting from any ideas, methods, instructions or products referred to in the content.

