

Effects of High Intensity Ultrasound Stimulation on the Germination Performance of Caper Seeds

Abstract
1. Introduction
2. Results and Discussion
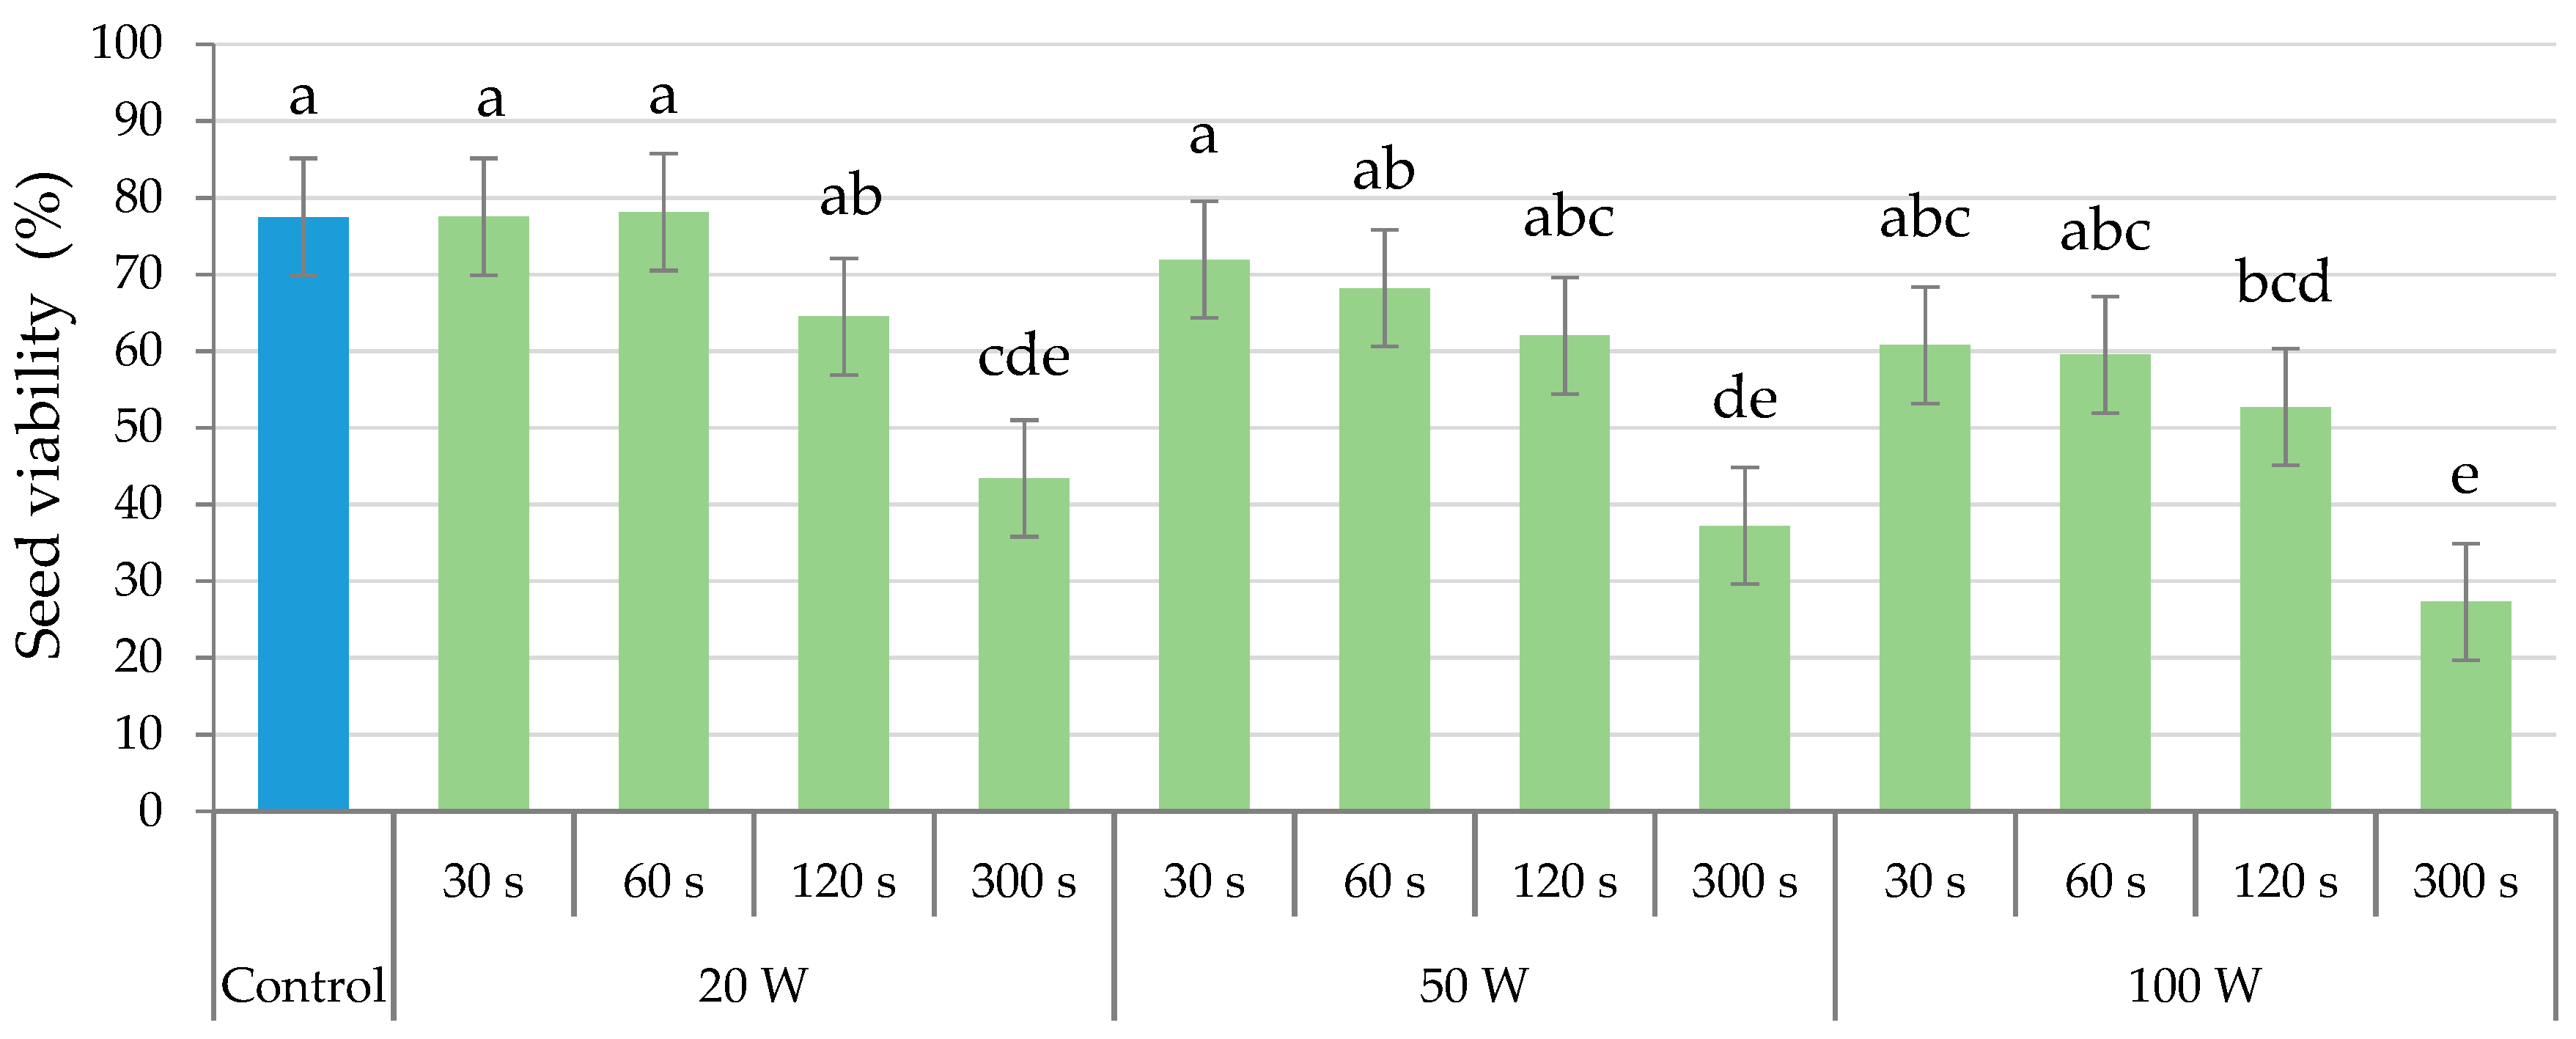
2.1. Ultrasonication
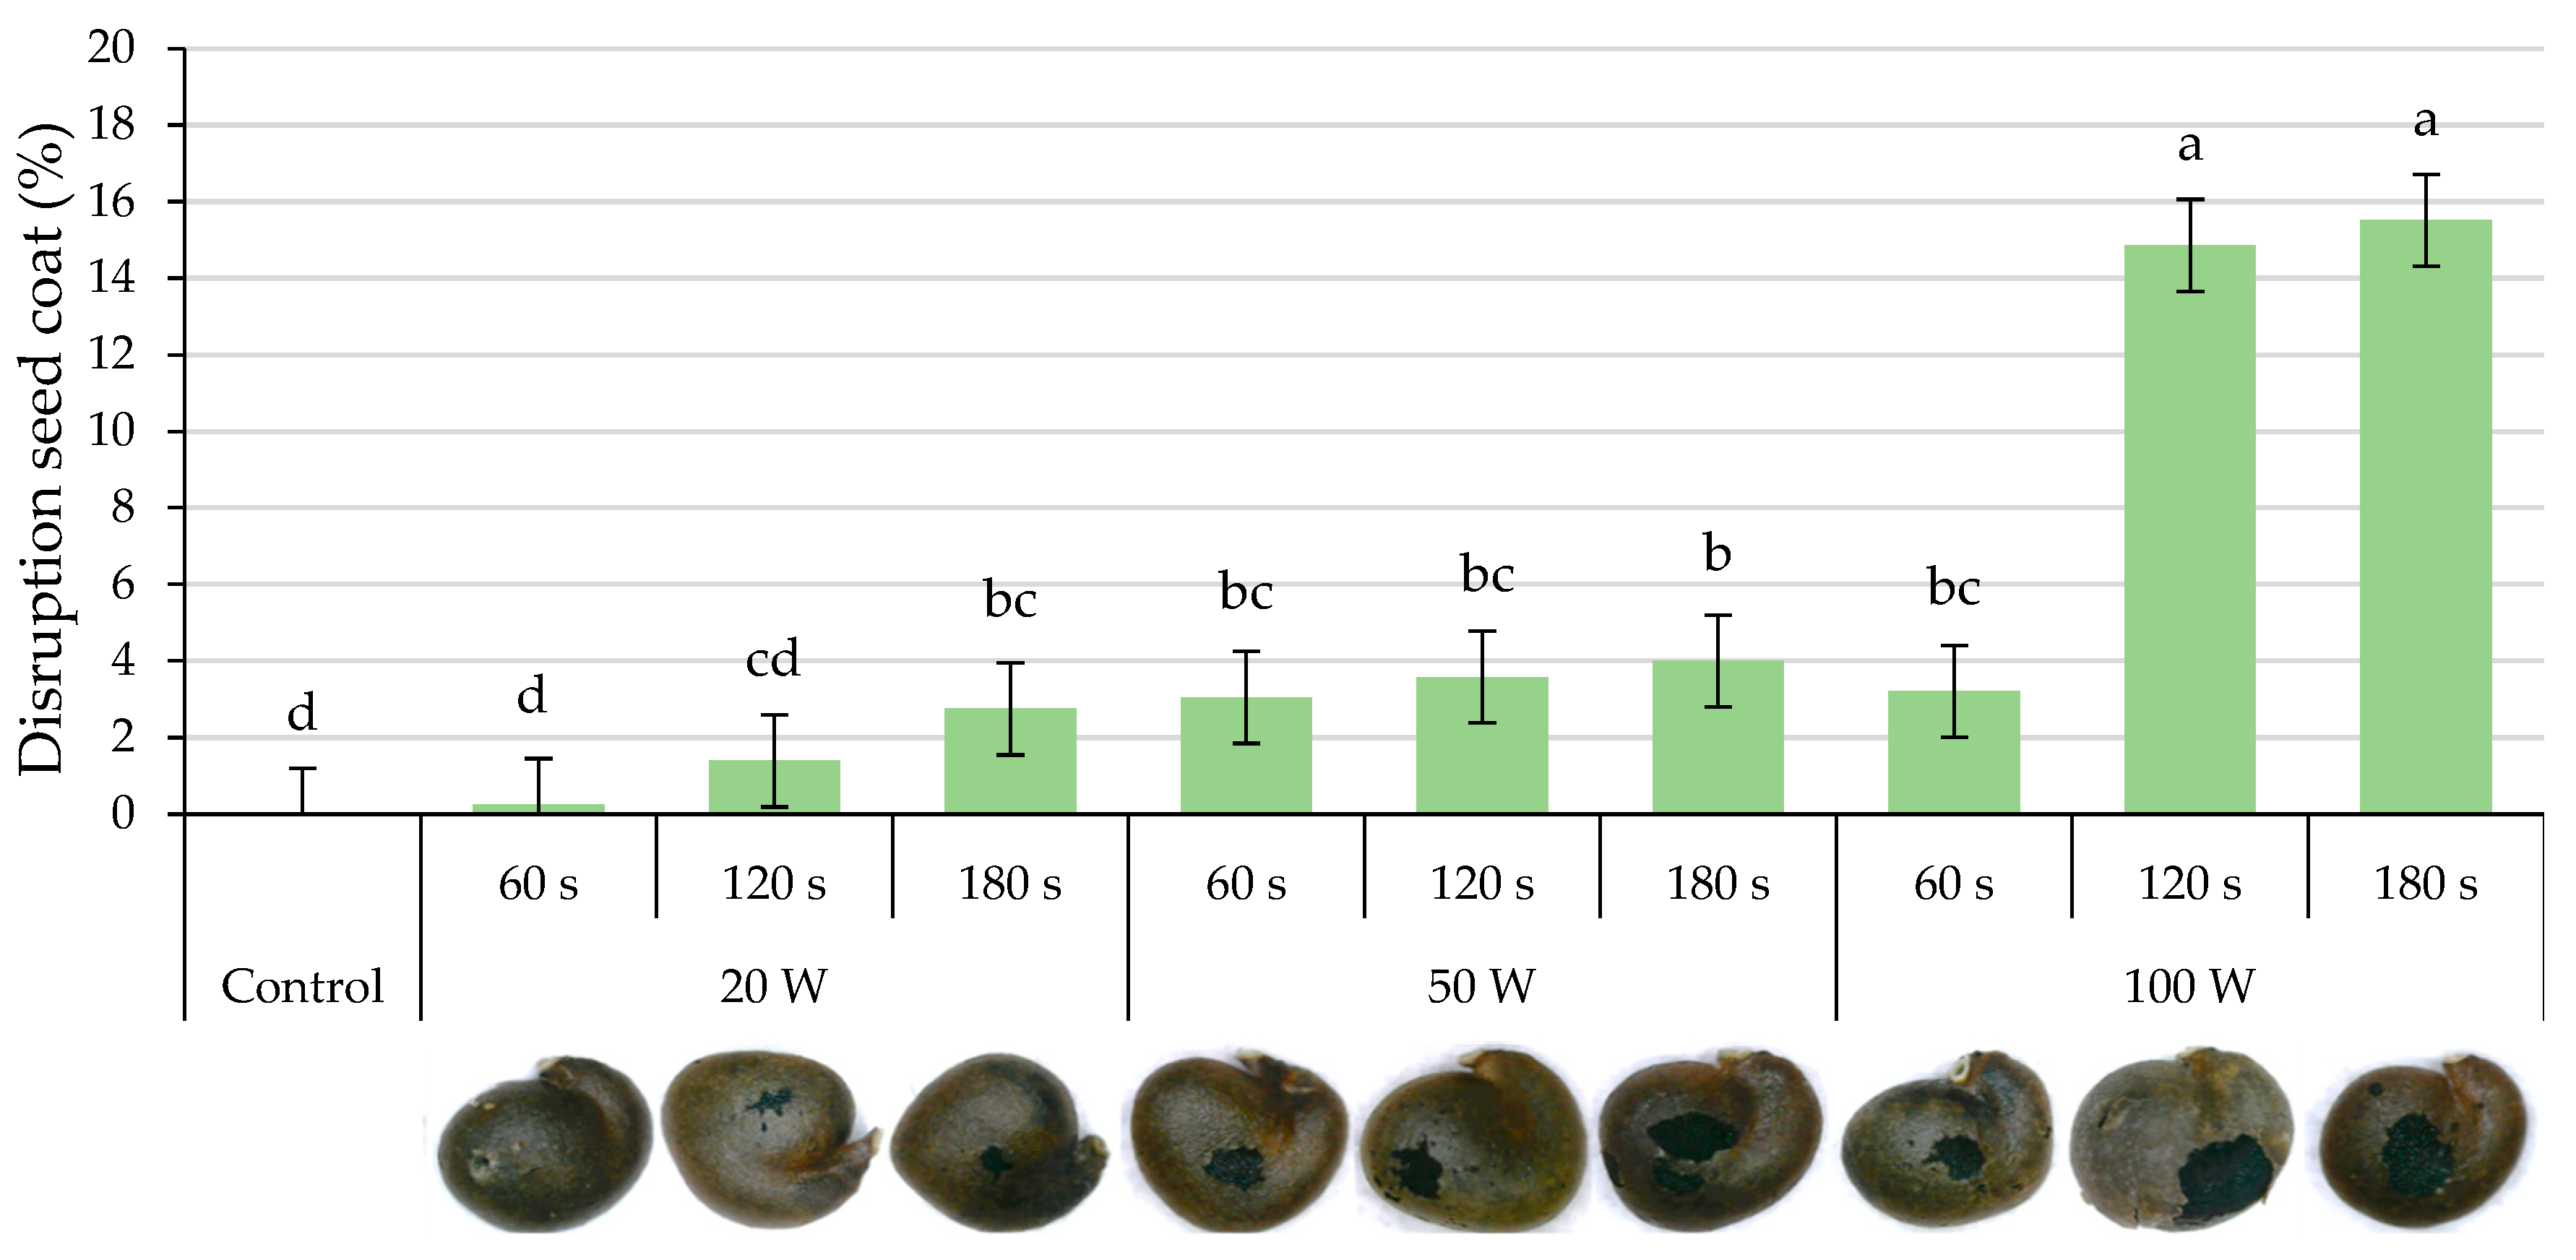
2.2. Disruption of the Seed Coat
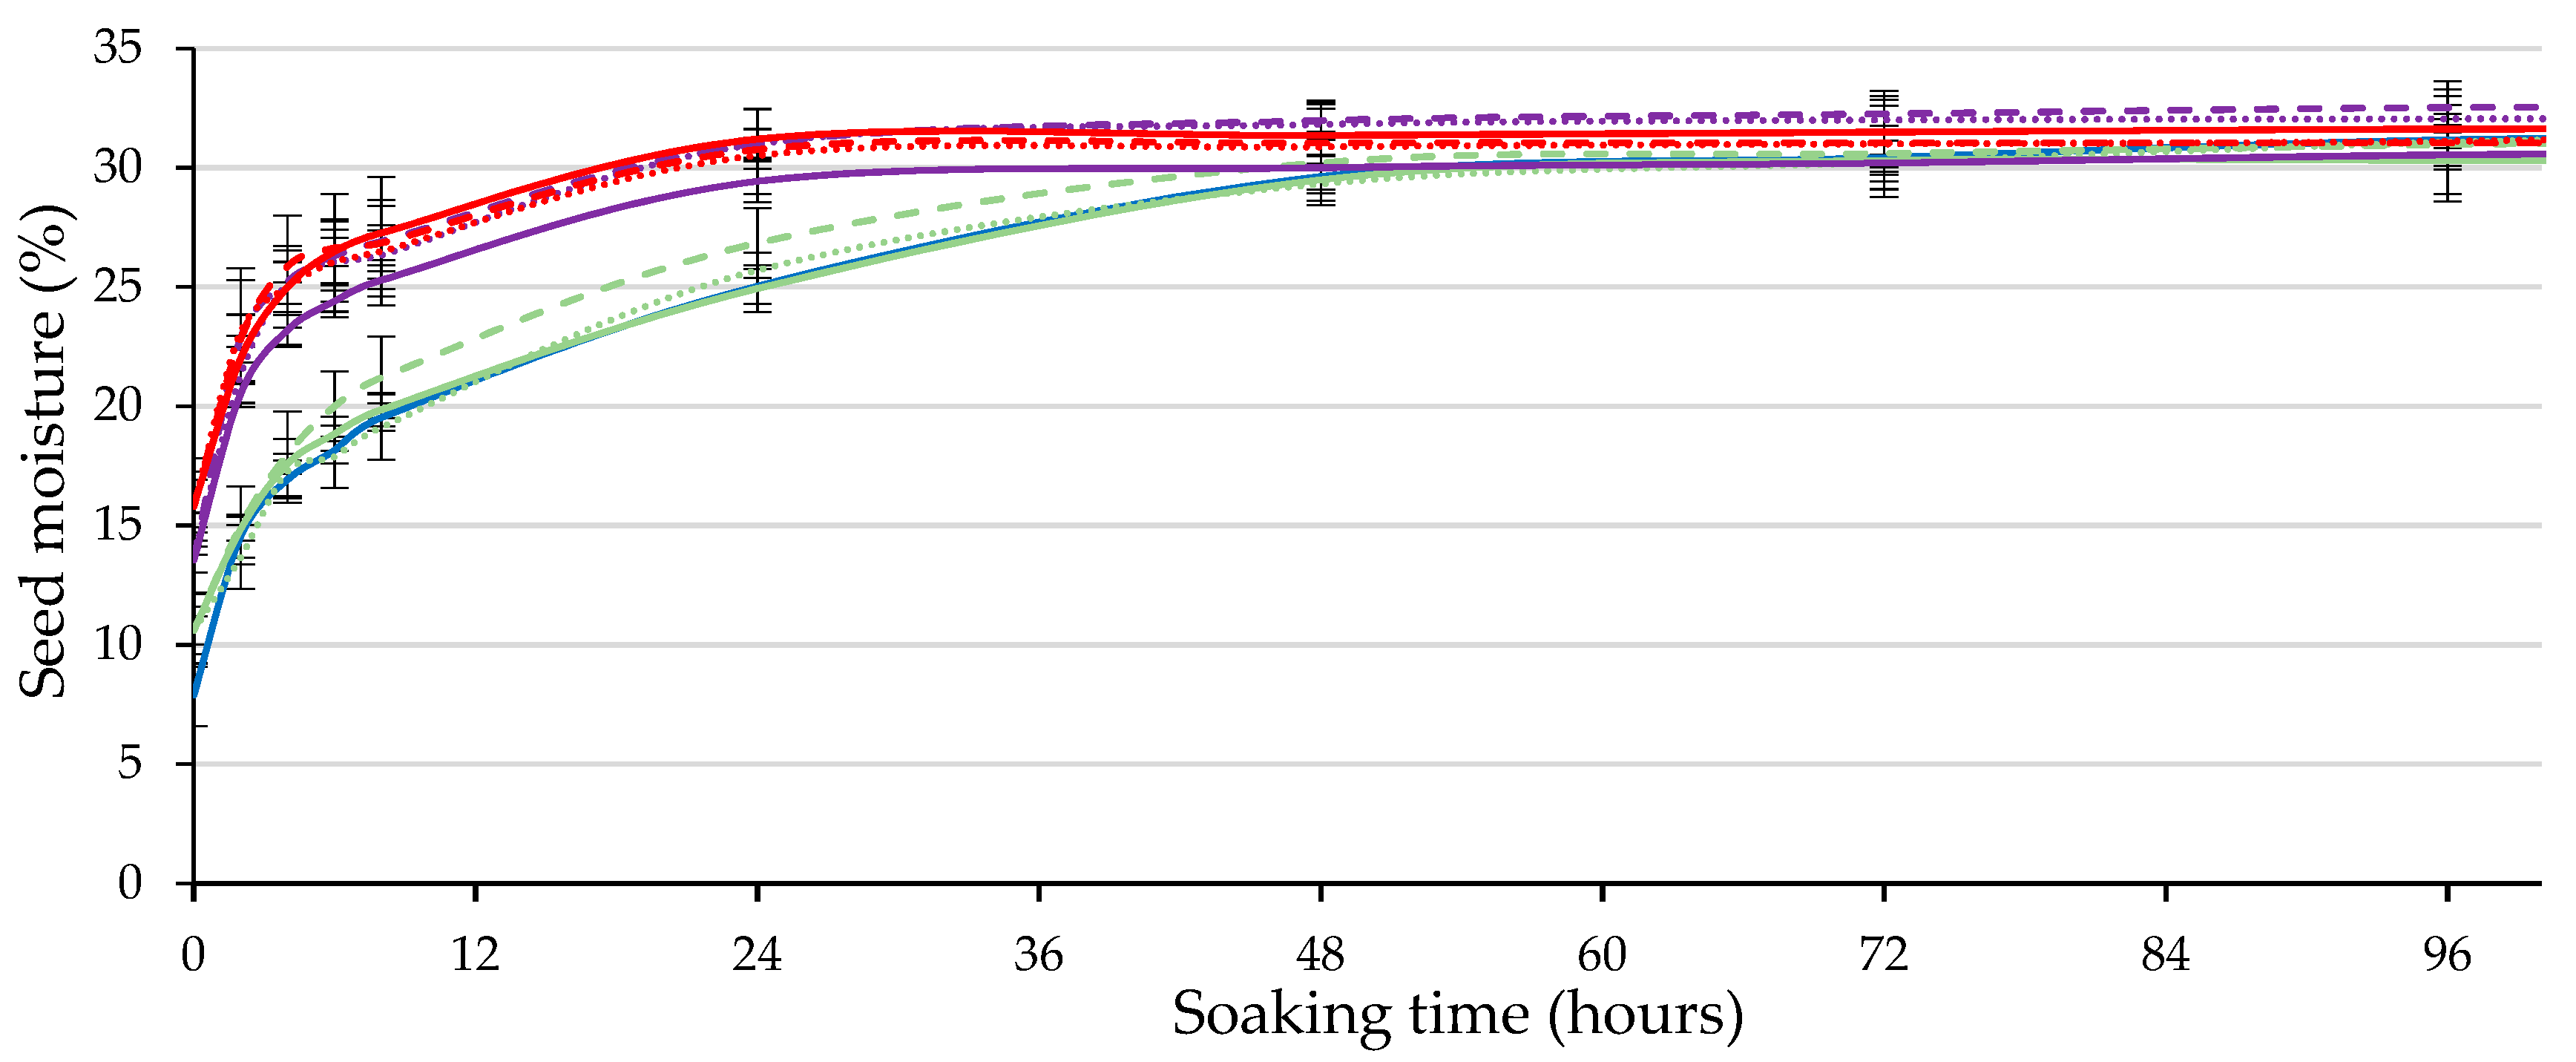
2.3. Imbibition
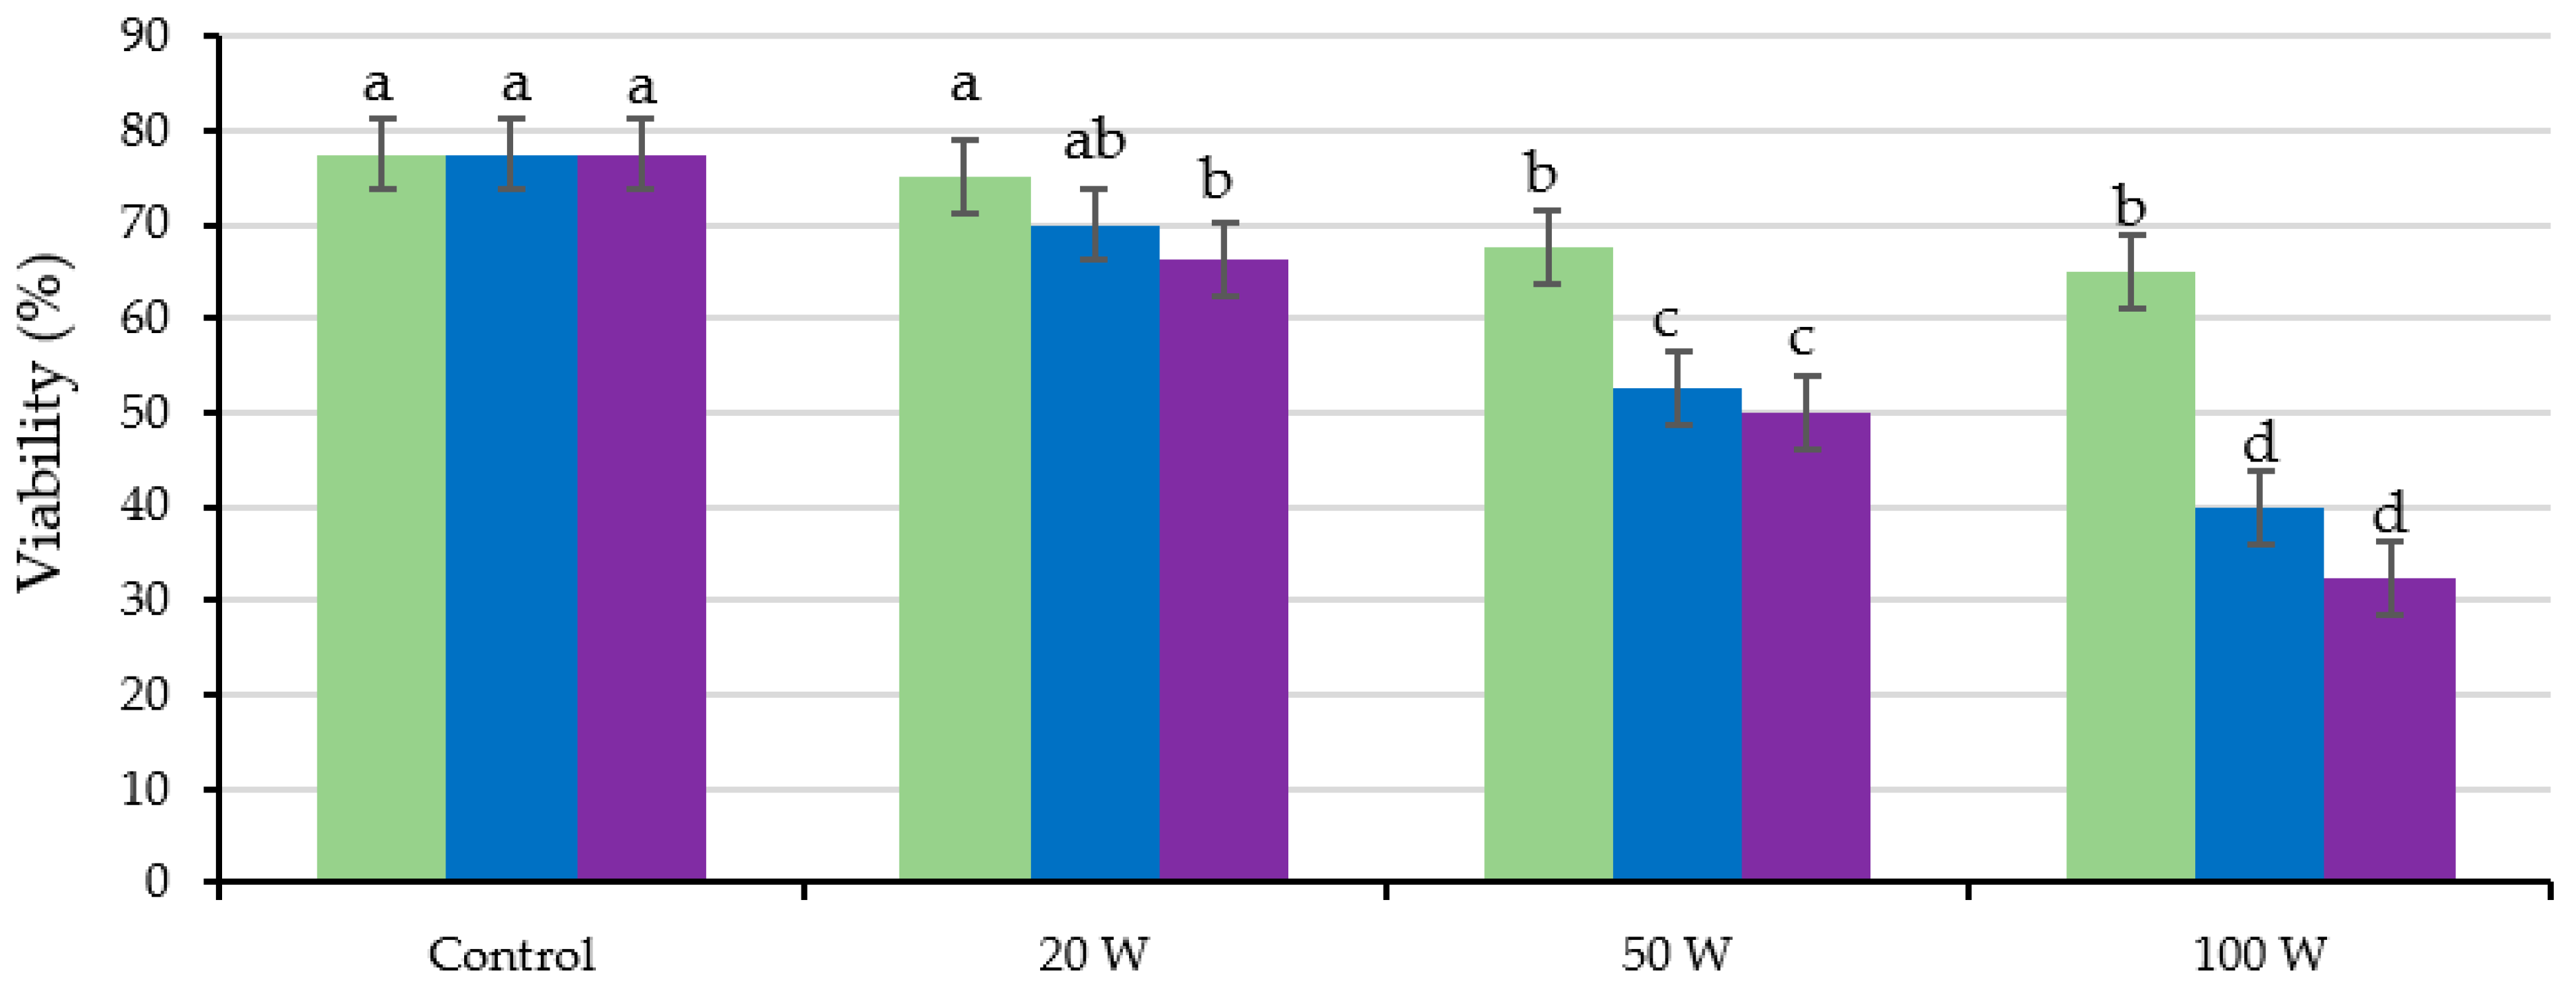
2.4. Seed Viability
2.5. Seed Germination
3. Materials and Methods
3.1. Plant Material
3.2. Ultrasonication
3.3. Disruption of the Seed Coat
3.4. Imbibition
3.5. Seed Viability
3.6. Seed Germination
3.7. Statistical Analysis
4. Conclusions
Supplementary Materials
Author Contributions
Funding
Data Availability Statement
Conflicts of Interest
References
- Sottile, F.; Caltagirone, C.; Peano, C.; Del Signore, M.B.; Barone, E. Can the caper (Capparis spinosa L.) still be considered a difficult-to-propagate Crop? Horticulturae 2021, 7, 316. [Google Scholar] [CrossRef]
- Sozzi, G.O.; Peter, K.V.; Nirmal Babu, K.; Divakaran, M. Capers and caperberries. In Handbook of Herbs and Spices, 2nd ed.; Woodhead Publishing: Sawston, UK, 2012; Volume 2, pp. 193–224. [Google Scholar]
- Corner, E.J.H. The Seeds of Dicotyledons; Cambridge University Press: London, UK, 1976; Volume 2, pp. 53–58. [Google Scholar]
- Foschi, M.L.; Juan, M.; Pascual, B.; Pascual-Seva, N. Influence of seed-covering layers on caper seed germination. Plants 2023, 12, 439. [Google Scholar] [CrossRef]
- Pascual, B.; San Bautista, A.; Imbernón, A.; López-Galarza, S.; Alagarda, J.; Maroto, J.V. Seed treatments for improved germination of caper (Capparis spinosa). Seed Sci. Technol. 2004, 32, 637–642. [Google Scholar] [CrossRef]
- Marković, M.; Grbić, M.; Skočajić, D.; Đukić, M.; Đunisijević-Bojović, D. Germination of Capparis spinosa L. seeds under different dormancy breaking treatments. In Proceedings of the X International Scientific Agriculture Symposium AGROSYM, Jahorina, Bosnia and Herzegovina, 3–6 October 2019; pp. 460–464. [Google Scholar]
- Juan, M. Estudio para la mejora de las técnicas de propagación de la alcaparra (Capparis spinosa L.). Ph.D. Thesis, Universitat Politècnica de València, Valencia, Spain, 2017. [Google Scholar]
- Abadi, N.E.M.; Kaboli, S.H.; Rejali, F.; Zolfaghari, A.A. Improvement of germination characteristics of Capper (Capparis spinosa) with biological, chemical, and mechanical priming. J. Arid Biome 2021, 10, 149–158. [Google Scholar]
- Pascual, B.; San Bautista, A.; Pascual Seva, N.; García Molina, R.; López-Galarza, S.; Maroto, J.V. Effects of soaking period and gibberellic acid addition on caper seed germination. Seed Sci. Technol. 2009, 37, 33–41. [Google Scholar] [CrossRef]
- Labbafi, M.; Mehrafarin, A.; Badi, H.; Ghorbani, M.; Tavakoli, M. Improve germination of caper (Capparis spinosa L.) seeds by different induction treatments of seed dormancy breaking. Trakia J. Sci. 2018, 16, 70–74. [Google Scholar] [CrossRef]
- Foschi, M.L.; Juan, M.; Pascual, B.; Pascual-Seva, N. Water uptake and germination of caper (Capparis spinosa L.) seeds. Agronomy 2020, 10, 838. [Google Scholar] [CrossRef]
- Asatov, I.; Merganov, A.; Abdullaev, Z. Technology of caper (Capparis spinosa) seed preparation for cultivation and cultural growth. E3S Web Conf. 2021, 244, 02022. [Google Scholar] [CrossRef]
- Yaldagard, M.; Mortazavi, S.A.; Tabatabaie, F. Influence of ultrasonic stimulation on the germination of barley seed and its alpha-amylase activity. African J. Biotechnol. 2008, 7, 2465–2471. [Google Scholar]
- López-Ribera, I.; Vicient, C.M. Use of ultrasonication to increase germination rates of Arabidopsis seeds. Plant Methods 2017, 13, 31. [Google Scholar] [CrossRef]
- Babaei-Ghaghelestany, A.; Alebrahim, M.T.; MacGregor, D.R.; Khatami, S.A.; Hasani Nasab Farzaneh, R. Evaluation of ultrasound technology to break seed dormancy of common lambsquarters (Chenopodium album). Food Sci. Nutr. 2020, 8, 2662–2669. [Google Scholar] [CrossRef] [PubMed]
- Ghafoori, H.; Keshtkar, E.; Aghaalikhani, M.; Mahdavian, A. Effect of ultrasound waves on dormancy-breaking and germination characteristics of Datura stramonium and Convolvulus arvensis. Iran. J. Seed Sci. Technol. 2021, 10, 127–139. [Google Scholar]
- Kim, H.J.; Feng, H.; Kushad, M.M.; Fan, X. Effects of ultrasound, irradiation, and acidic electrolyzed water on germination of alfalfa and broccoli seeds and Escherichia coli O157:H7. J. Food Sci. 2006, 71, 168–173. [Google Scholar] [CrossRef]
- Lo Porto, C.; Ziuzina, D.; Los, A.; Boehm, D.; Palumbo, F.; Favia, P.; Tiwari, B.; Bourke, P.; Cullen, P.J. Plasma activated water and airborne ultrasound treatments for enhanced germination and growth of soybean. Innov. Food Sci. Emerg. Technol. 2018, 49, 13–19. [Google Scholar] [CrossRef]
- Hielscher-Ultrasonics-GmbH Sondas de Sonicación Frente a Baños de Ultrasonidos: Una Comparación de Su Eficiencia. Available online: https://www.hielscher.com/es/probe-type-sonication-vs-ultrasonic-bath-an-efficiency-comparison.htm (accessed on 28 April 2023).
- Ranade, V.V.; Bhandari, V.M.; Nagarajan, S.; Sarvothaman, V.P.; Simpson, A.T. Hydrodynamic Cavitation: Devices, Design and Applications; Wiley-VCH: Weinheim, Germany, 2013; pp. 3–20. [Google Scholar]
- Asadi, A.; Pourfattah, F.; Miklós Szilágyi, I.; Afrand, M.; Żyła, G.; Seon Ahn, H.; Wongwises, S.; Minh Nguyen, H.; Arabkoohsar, A.; Mahian, O. Effect of sonication characteristics on stability, thermophysical properties, and heat transfer of nanofluids: A comprehensive review. Ultrason. Sonochem. 2019, 58, 104701. [Google Scholar] [CrossRef]
- Debeaujon, I.; Léon-Kloosterziel, K.M.; Koornneef, M. Influence of the testa on seed dormancy, germination, and longevity in Arabidopsis. Plant Physiol. 2000, 122, 403–413. [Google Scholar] [CrossRef]
- Xia, Q.; Tao, H.; Li, Y.; Pan, D.; Cao, J.; Liu, L.; Zhou, X.; Barba, F.J. Characterizing physicochemical, nutritional and quality attributes of wholegrain Oryza sativa L. subjected to high intensity ultrasound-stimulated pre-germination. Food Control 2020, 108, 106827. [Google Scholar] [CrossRef]
- Yildirim, A.; Öner, M.; Bayram, M. Modeling of water absorption of ultrasound applied chickpeas (Cicer arietinum L.) using peleg’s equation. Tarım Bilim. Derg. 2010, 16, 278–286. [Google Scholar]
- Foschi, M.L.; Juan, M.; Pascual, B.; Pascual-Seva, N. The imbibition, viability, and germination of caper seeds (Capparis spinosa L.) in the first year of storage. Plants 2022, 11, 202. [Google Scholar] [CrossRef]
- Wang, X.F.; Zheng, C.H.; Jing, X.M. Effect of seed moisture content on seed storage longevity. Acta Bot. Sin. 2001, 43, 551–557. [Google Scholar]
- Walters, C.; Wheeler, L.M.; Grotenhuis, J.M. Longevity of seeds stored in a genebank: Species characteristics. Seed Sci. Res. 2005, 15, 1–20. [Google Scholar] [CrossRef]
- Baskin, C.C.; Baskin, J.M. Seeds: Ecology, Biogeography, and Evolution of Dormancy and Germination, 2nd ed.; Academic Press: San Diego, CA, USA, 2014; pp. 5–35. [Google Scholar]
- Ranjbari, A.; Kashaninejad, M.; Aalami, M.; Khomeiri, M.; Gharekhani, M. Effect of ultrasonic pre-treatment on water absorption characteristics of chickpeas (Cicer arietinum). Lat. Am. Appl. Res. 2013, 43, 153–159. [Google Scholar]
- Ding, J.; Hou, G.G.; Dong, M.; Xiong, S.; Zhao, S.; Feng, H. Physicochemical properties of germinated dehulled rice flour and energy requirement in germination as affected by ultrasound treatment. Ultrason. Sonochem. 2018, 41, 484–491. [Google Scholar] [CrossRef]
- Miano, A.C.; da Costa Pereira, J.; Castanha, N.; da Matta Júnior, M.D.; Augusto, P.E.D. Enhancing mung bean hydration using the ultrasound technology: Description of mechanisms and impact on its germination and main components. Sci. Rep. 2016, 6, 38996. [Google Scholar] [CrossRef]
- Bewley, J.D.; Bradford, K.J.; Hilhorst, H.W.M.; Nonogaki, H. Seeds: Physiology of Development, Germination and Dormancy, 3rd ed.; Springer: New York, NY, USA, 2013; pp. 141–152. [Google Scholar]
- Pascual, B.; San Bautista, A.; López-Galarza, S.; Alagarda, J.; Maroto, J.V. Germination behavior after storage of caper seeds. Seed Sci. Technol. 2006, 34, 151–159. [Google Scholar] [CrossRef]
- Foschi, M.L.; Juan, M.; Pascual, B.; Pascual-Seva, N. Influence of lighting and laser irradiation on the germination of caper seeds. Agriculture 2022, 12, 1612. [Google Scholar] [CrossRef]
- Juan, M.; Pascual-Seva, N.; Iranzo, D.; Pascual, B. Improvement of seed germination of caper (Capparis spinosa L.) through magnetic fields. Acta Hortic. 2020, 1273, 433–440. [Google Scholar] [CrossRef]
- Andriamparany, J.N.; Buerkert, A. Effect of ultrasonic dormancy breaking on seed germination and seedling growth of three wild yam species (Dioscorea spp.) from SW-Madagascar. Genet. Resour. Crop Evol. 2019, 66, 1167–1174. [Google Scholar] [CrossRef]
- Farooq, M.; Aziz, T.; ur Rehman, H.; ur Rehman, A.; Cheema, S.A.; Aziz, T. Evaluating surface drying and re-drying for wheat seed priming with polyamines: Effects on emergence, early seedling growth and starch metabolism. Acta Physiol. Plant. 2011, 33, 1707–1713. [Google Scholar] [CrossRef]
- Wang, Q.; Chen, G.; Yersaiyiti, H.; Liu, Y.; Cui, J.; Wu, C.; Zhang, Y.; He, X. Modeling analysis on germination and seedling growth using ultrasound seed pretreatment in switchgrass. PLoS ONE 2012, 7, e47204. [Google Scholar] [CrossRef]
- Davies, F.T.; Geneve, R.L.; Wilson, S.B. Hartmann and Kester’s Plant Propagation Principles and Practices, 9th ed.; Pearson Education: New York, NY, USA, 2018; pp. 182–225. [Google Scholar]
- Schneider, C.A.; Rasband, W.S.; Eliceiri, K.W. NIH Image to ImageJ: 25 years of image analysis. Nat. Methods 2012, 9, 671–675. [Google Scholar] [CrossRef] [PubMed]
- Ma, F.; Cholewa, E.; Mohamed, T.; Peterson, C.A.; Gijzen, M. Cracks in the palisade cuticle of soybean seed coats correlate with their permeability to water. Ann. Bot. 2004, 94, 213–228. [Google Scholar] [CrossRef] [PubMed]
- International Seed Testing Association (ISTA); ISTA Rules; ISTA: Bassersdorf, Switzerland, 2018; Seed viability; Seed germination.
- ISTA Working Sheets on Tetrazolium Testing. Tree and Shrub Species, 1st ed.; The International Seed Testing Association (ISTA): Bassersdorf, Switzerland, 2003; Volume 2, pp. 1–5. [Google Scholar]
- Patil, V.N.; Dadlani, M. Tetrazolium test for seed viability and vigour. In Handbook of Seed Testing; Agrawal, P.K., Ed.; Ministry of Agriculture, Government of India: New Delhi, India, 1993; pp. 209–241. [Google Scholar]
- Torres, M.; Frutos, G. Logistic function analysis of germination behaviour of aged fennel seeds. Environ. Exp. Bot. 1990, 30, 383–390. [Google Scholar] [CrossRef]
- Statgraphics Statistical Graphics Statgraphics Centurion XVIII; Statistical Graphics Corporation: Rockville, MD, USA, 2018.
- Sileshi, G.W. A critique of current trends in the statistical analysis of seed germination and viability data. Seed Sci. Res. 2012, 22, 145–159. [Google Scholar] [CrossRef]


| 0 h | 8 h | 24 h | 96 h | |
|---|---|---|---|---|
| Output power (P) | ||||
| Control | 7.9 c | 19.6 b | 25.0 b | 31.2 |
| 20 | 10.6 b | 20.4 b | 25.8 b | 30.7 |
| 50 | 13.5 a | 26.2 a | 30.9 a | 31.7 |
| 100 | 15.8 a | 26.9 a | 30.8 a | 31.3 |
| Holding time (T) | ||||
| 60 | 11.3 | 23.0 | 27.7 | 30.9 |
| 120 | 12.0 | 23.1 | 28.2 | 31.4 |
| 180 | 12.6 | 23.6 | 28.6 | 31.4 |
| Analysis of variance | ||||
| Factors (degrees of freedom) | % Sum of squares | |||
| P (3) | 54.6 ** | 68.6 ** | 68.6 ** | 2.6 NS |
| T (2) | 1.6 NS | 0.5 NS | 1.3 NS | 1.4 NS |
| P × T (6) | 1.0 NS | 0.9 NS | 2.8 NS | 3.9 NS |
| Residual (36) | 42.8 | 30.0 | 27.2 | 92.0 |
| Standard deviation (+) | 3.0 | 2.5 | 2.0 | 2.4 |
| Sound | Sound + Weak but Viable | |
|---|---|---|
| Output power (P) | ||
| Control | 55.00 a | 77.50 a |
| 20 | 42.50 b | 70.42 a |
| 50 | 27.50 c | 56.67 b |
| 100 | 24.17 c | 45.83 c |
| Holding time (T) | ||
| 60 | 43.75 a | 71.25 a |
| 120 | 35.63 ab | 60.00 b |
| 180 | 32.50 b | 56.56 b |
| Analysis of variance | ||
| Factors (degrees of freedom) | % Sum of squares | |
| P (3) | 53.93 ** | 53.29 ** |
| T (2) | 7.97 * | 13.99 ** |
| P × T (6) | 3.97 NS | 9.62 * |
| Residual (36) | 34.14 | 23.10 |
| Standard Deviation (+) | 11.33 | 9.31 |
| G (%) | |
|---|---|
| Output power (P) | |
| Control | 32.8 a |
| 20 W | 32.2 a |
| 50 W | 19.2 b |
| 100 W | 5.4 c |
| Holding time (T) | |
| 60 | 26.4 a |
| 120 | 22.8 b |
| 180 | 17.9 c |
| Solution (S) | |
| Water | 5.3 b |
| GA3 | 39.4 a |
| Analysis of Variance | |
| Factors (degrees of freedom) | % Sum of squares |
| P (3) | 21.2 ** |
| T (2) | 2.0 ** |
| S (1) | 49.0 ** |
| P × T (6) | 1.2 ** |
| P × S (3) | 23.6 ** |
| T × S (2) | 0.7 ** |
| P × T × S (6) | 1.0 ** |
| Residual (72) | 1.4 |
| Standard deviation (+) | 3.3 |
| Power | Time | G(%) | Power | Solution | G(%) | Time | Solution | G(%) |
|---|---|---|---|---|---|---|---|---|
| Control | - | 32.8 b | Control | GA3 | 62.0 a | 60 | GA3 | 46.0 a |
| 20 | 60 | 36.8 a | 20 | GA3 | 59.7 a | 120 | GA3 | 39.5 b |
| 20 | 120 | 32.3 b | 50 | GA3 | 29.5 b | 180 | GA3 | 32.8 c |
| 20 | 180 | 27.5 c | 100 | GA3 | 6.5 cd | 60 | Water | 6.8 d |
| 50 | 60 | 23.0 d | Control | Water | 3.5 e | 120 | Water | 6.1 d |
| 50 | 120 | 23.5 d | 20 | Water | 4.7 de | 180 | Water | 3.1 e |
| 50 | 180 | 11.0 e | 50 | Water | 8.8 c | LSD (p ≤ 0.05) | 2.3 | |
| 100 | 60 | 13.0 e | 100 | Water | 4.3 de | |||
| 100 | 120 | 2.8 f | LSD (p ≤ 0.05) | 2.69 | ||||
| 100 | 180 | 0.5 f | ||||||
| LSD (p ≤ 0.05) | 3.3 | |||||||
| A (%) | Gt50 | k/2 | |
|---|---|---|---|
| Output power (P) | |||
| Control | 61.1 a | 27.2 a | 0.06 c |
| 20 W | 59.3 a | 23.9 b | 0.09 a |
| 50 W | 29.1 b | 27.3 a | 0.08 b |
| Holding time (T) | |||
| 60 | 54.8 a | 24.2 b | 0.08 |
| 120 | 51.4 a | 28.0 a | 0.07 |
| 180 | 43.2 b | 26.2 ab | 0.08 |
| Analysis of variance | |||
| Factors (degrees of freedom) | % sum of squares | ||
| P (2) | 76.6 ** | 18.8 * | 41.6 ** |
| T(2) | 8.5 ** | 18.1 * | 1.9 NS |
| P × T (4) | 8.6 ** | 16.4 NS | 6.4 NS |
| Residual (27) | 6.3 | 46.7 | 50.0 |
| Standard deviation (+) | 4.9 | 2.9 | 0.01 |
Disclaimer/Publisher’s Note: The statements, opinions and data contained in all publications are solely those of the individual author(s) and contributor(s) and not of MDPI and/or the editor(s). MDPI and/or the editor(s) disclaim responsibility for any injury to people or property resulting from any ideas, methods, instructions or products referred to in the content. |
© 2023 by the authors. Licensee MDPI, Basel, Switzerland. This article is an open access article distributed under the terms and conditions of the Creative Commons Attribution (CC BY) license (https://creativecommons.org/licenses/by/4.0/).
Share and Cite
Foschi, M.L.; Juan, M.; Pascual, B.; Pascual-Seva, N. Effects of High Intensity Ultrasound Stimulation on the Germination Performance of Caper Seeds. Plants 2023, 12, 2379. https://doi.org/10.3390/plants12122379
Foschi ML, Juan M, Pascual B, Pascual-Seva N. Effects of High Intensity Ultrasound Stimulation on the Germination Performance of Caper Seeds. Plants. 2023; 12(12):2379. https://doi.org/10.3390/plants12122379
Chicago/Turabian StyleFoschi, María Laura, Mariano Juan, Bernardo Pascual, and Nuria Pascual-Seva. 2023. "Effects of High Intensity Ultrasound Stimulation on the Germination Performance of Caper Seeds" Plants 12, no. 12: 2379. https://doi.org/10.3390/plants12122379
APA StyleFoschi, M. L., Juan, M., Pascual, B., & Pascual-Seva, N. (2023). Effects of High Intensity Ultrasound Stimulation on the Germination Performance of Caper Seeds. Plants, 12(12), 2379. https://doi.org/10.3390/plants12122379