Article

Study on the Shape Characteristics and the Allometry of Phalaenopsis Leaves for Greenhouse Management

1
Africa Industrial Research Center, National Chung Hsing University, 250 Kuokuang Road, Taichung 40227, Taiwan
2
Department of Bio-Industrial Mechatronics Engineering, National Chung Hsing University, 250 Kuokuang Road, Taichung 40227, Taiwan
*
Author to whom correspondence should be addressed.
Plants 2023, 12(10), 2031; https://doi.org/10.3390/plants12102031
Submission received: 29 April 2023 / Accepted: 17 May 2023 / Published: 19 May 2023
(This article belongs to the Section Horticultural Science and Ornamental Plants)

Abstract

:
Phalaenopsis orchids are highly economical ornamental potted plants. Controlling their production schedule requires information on the leaf development characteristics of the orchids. Phalaenopsis leaves affect the plant’s photosynthesis, respiration, and transpiration. The leaf growth conditions can serve as a development index for greenhouse management. The use of the growth characteristics of Phalaenopsis leaves as the basis for greenhouse cultivation and management needs to be studied. The allometry of Phalaenopsis leaves is worth studying. The goal of this research was to investigate the allometry of Phalaenopsis leaves and develop prediction models of the total leaf area. Then, these total leaf area models were developed and validated. In this study, five Phalaenopsis varieties (amabilis, Sin-Yuan beauty, Ruey Lish beauty, Ishin KHM1095, and Sogo F1091) were selected. Each sample had five mature leaves. The lengths, widths, and areas of the sequential leaves were measured, and then the length ratios, width ratios, and area ratios were calculated. The top and bottom models were used to calculate the total leaf areas. The results indicate that no significant differences could be found in the length ratios, width ratios, and area ratios of the sequential leaves from the same variety. However, significant differences were found in these leaf characteristics between different varieties. The observation of leaf growth characteristics can be used to provide useful information for Phalaenopsis management. Comparing the predictive criteria of the two models, the top model had a better predictive ability than the bottom model. From a practical viewpoint, measuring the top leaf area is easier than measuring the bottom leaf area in a greenhouse operation. Comparing the effects of the sample numbers on the predictive ability of the model, the sample number of 30 was sufficient to ensure the accuracy of the total leaf area measurements. We provide an easy and accurate method to measure the total leaf area of Phalaenopsis. The calculated values of total leaf areas can be incorporated into decision models for smart management.

1. Introduction

Moth orchids (Phalaenopsis spp.) are high-value potted ornamental plants. In the orchid industry, the special characteristics of Phalaenopsis are shorter juvenile periods, rapid growth, and easy-to-control spiking and flowering. These orchids have stylish and exotic shapes, various sizes and colors of blossoms, and long vase lives. Their shape, length, width, and area are affected by environmental factors (day and night temperatures) and fertilization (fertilizer concentration and formulation). The timing of the potted flowers being sent to the market determines the market price [1,2]. To ensure the spiking and flowering period, affecting factors such as temperature and light intensity are controlled in a modern greenhouse [3,4]. In the study by Paradiso and De Pascale [4], they emphasized that three factors, leaf size, temperature, and light intensity, are the key factors in the flowering quality of Phalaenopsis. That is, the maturation conditions of the plants affect the size, number, and bright color of the flowers. The growth conditions of the leaves need to be investigated. However, quantified leaf characteristics are lacking for the management operation of an orchid greenhouse.
The term allometry is used to describe the scaling relationship between the size of a part of a body and the size of the whole body. The typical application of allometry is in using the leaf width or length to predict its area. In this study, the concept of the allometry approach was proposed to study the growth characteristics of Phalaenopsis leaves.
In a detailed review, Lemaire et al. [5] introduce evidence of allometry between metabolic and structural mass, and the concentrations of nutrient also have a relationship with biomass. Shi et al. [6] developed novel models to describe the relationship between leaf shape and other variables for fifteen vine species. Fanourakis et al. [7] proposed eight empirical linear equations to describe the relationship between leaf area and length, width, and the product of length and width. Colchado-Lopez et al. [8] introduced the rhizochron index model to describe lateral root branching and elongation patterns in the root architecture. Feng et al. [9] adopted the concept of allometry to observe the relationship between vegetative and reproductive traits, such as peduncles and flowers, inflorescence length and leaf area, and total floral area and total leaf area, in different species of orchids. Mantovan [10] studied the relationship between plant size and dry mass partitioning in the epiphytic orchid Lankesterella ceracifolia, and several allometric models were validated.
A crop model needs to consider leaf phenology [11]. The relationship between the carbohydrate contents in leaves and inflorescence initiation in Phalaenopsis has been observed [12]. The development of a leaf can serve as an index of growth stages [13]. The number and quality of leaves can be illustrated to serve as an index for greenhouse management [3]. Recently, with the development of the camera technique, pictures of orchid leaves can be easily collected and analyzed [14]. To the best of the authors’ knowledge, no quantified index has been proposed to represent the growing conditions of leaves for Phalaenopsis.
To measure a leaf area continuously, a non-destructive estimation of the leaf area (A) with the leaf length (L) and width (W) is of interest to researchers [15,16,17,18]. Empirical equations relating the length and width to the area have been developed, such as for corn, grapes, muskmelons, and capsicum [19]. Swart [20] reported six empirical models and found the best equation was A = c1 (L × W) + c2 (L × W)2. In this equation, L, W, and A are the length, width, and area of a capsicum leaf, and c1, c2, and the following ci are constants. Shi et al. [21] studied the leaf area equations of four types of special leaf shapes of trees and found that the Montgomery equation could be used for all special plants. This equation is A = c3 (L × W). In a study on the leaf area equations of six Magnoliaceae species, He et al. [22] proposed that the Montgomery equation could provide a standard measurement for leaf morphology. Mazzini et al. [23] studied the leaf area models of six genotypes of citrus and proposed a linear equation with an intercept and slope, A = c4 L × W + c5, which could be applied to other citrus genotypes. Yu et al. [24] examined the estimation equations of 15 species of vines with different leaf shapes and recommended the Montgomery equation. Chen and Lin [25] studied the leaf area equations of Phalaenopsis leaves, and four popular cultivars in Taiwan were used to measure their leaf areas, lengths, and widths. The proposed equation, A = 0.725 L × W, was presented as the adequate equation.
The total leaf area is a very important index for plant growth. It involves photosynthesis, respiration, and transpiration. A total leaf model can be developed with the concept of allometry. The development of total leaf area models has been proposed using the following equations.
The calculation models of the total leaf areas of a shoot were reviewed by Koyama and Smith [19]. The total leaf area (Atot) of a shoot is related to the sum of a single leaf width (ΣWidth) and the maximum leaf length (Lmax).
Atot = c6 ΣWidth × Lmax
Ogawa et al. [26] proposed the following empirical equations:
Atot = c7 (Lmax)c8
Sun et al. [27,28] found that the Atot is related to the product of the maximum leaf area (Amax) of a shoot and the total number of leaves on each shoot (N). Their model is as follows:
Atot = c9 N × (Amax)
Koyama et al. [29] arranged the affecting factors and proposed the following prediction equation of the total leaf area with the total number of leaves (N):
Atot = c10 × NC11
Teobaldelli et al. [30] proposed an empirical model of the total leaf area:
Atot = c12 NC13 Wmax
where Wmax is the maximum width of the leaves.
Lopes and Pinto [31] studied the formula of the total leaf area for each shoot of a wine grape vine and found the total leaf area of a shoot can be estimated as the mean of the maximum (MaxArea) and minimum leaf area (MinArea):
Atot = C14 × N × (MaxArea + MinArea)/2
These models were validated via the observation of the linear equation between the predicted values and actual values of the total leaf areas of a shoot. All leaves are assumed to have the same shape and size.
A lot of plants have many shoots and leaves. Phalaenopsis is an epiphytic and monopodia orchid. The plant structure has very short internodes and succulent-like leaves. A growth characteristic of Phalaenopsis is an enlarged leaf phenomenon. That is, the leaves are developed sequentially. In the leaf growth of Phalaenopsis, according to the observations of growers, the newly grown leaves are larger than the previous leaves.
The previous models in the literature that assume that all leaves have a similar shape and area could not be used for Phalaenopsis. That is, these proposed leaf area equations in the literature cannot be directly applied to Phalaenopsis.
For managing Phalaenopsis production, the information on leaf shape, length, width, and total leaf area is a very useful index. It is easily analyzed in photo monitoring systems. In this study, the leaf characteristics and allometry of leaves were quantified for the leaf development characteristics of Phalaenopsis. The prediction equations of the total leaf area were developed and validated. This study could provide basic information for greenhouse management.

2. Results

2.1. The Leaf Specification

2.1.1. The Ratio Characteristics

The statistics for the total leaf areas of the five Phalaenopsis varieties are listed in Table 1. Comparing the mean areas, amabilis has the smallest value, and Ishin KHM 1095 has the largest.
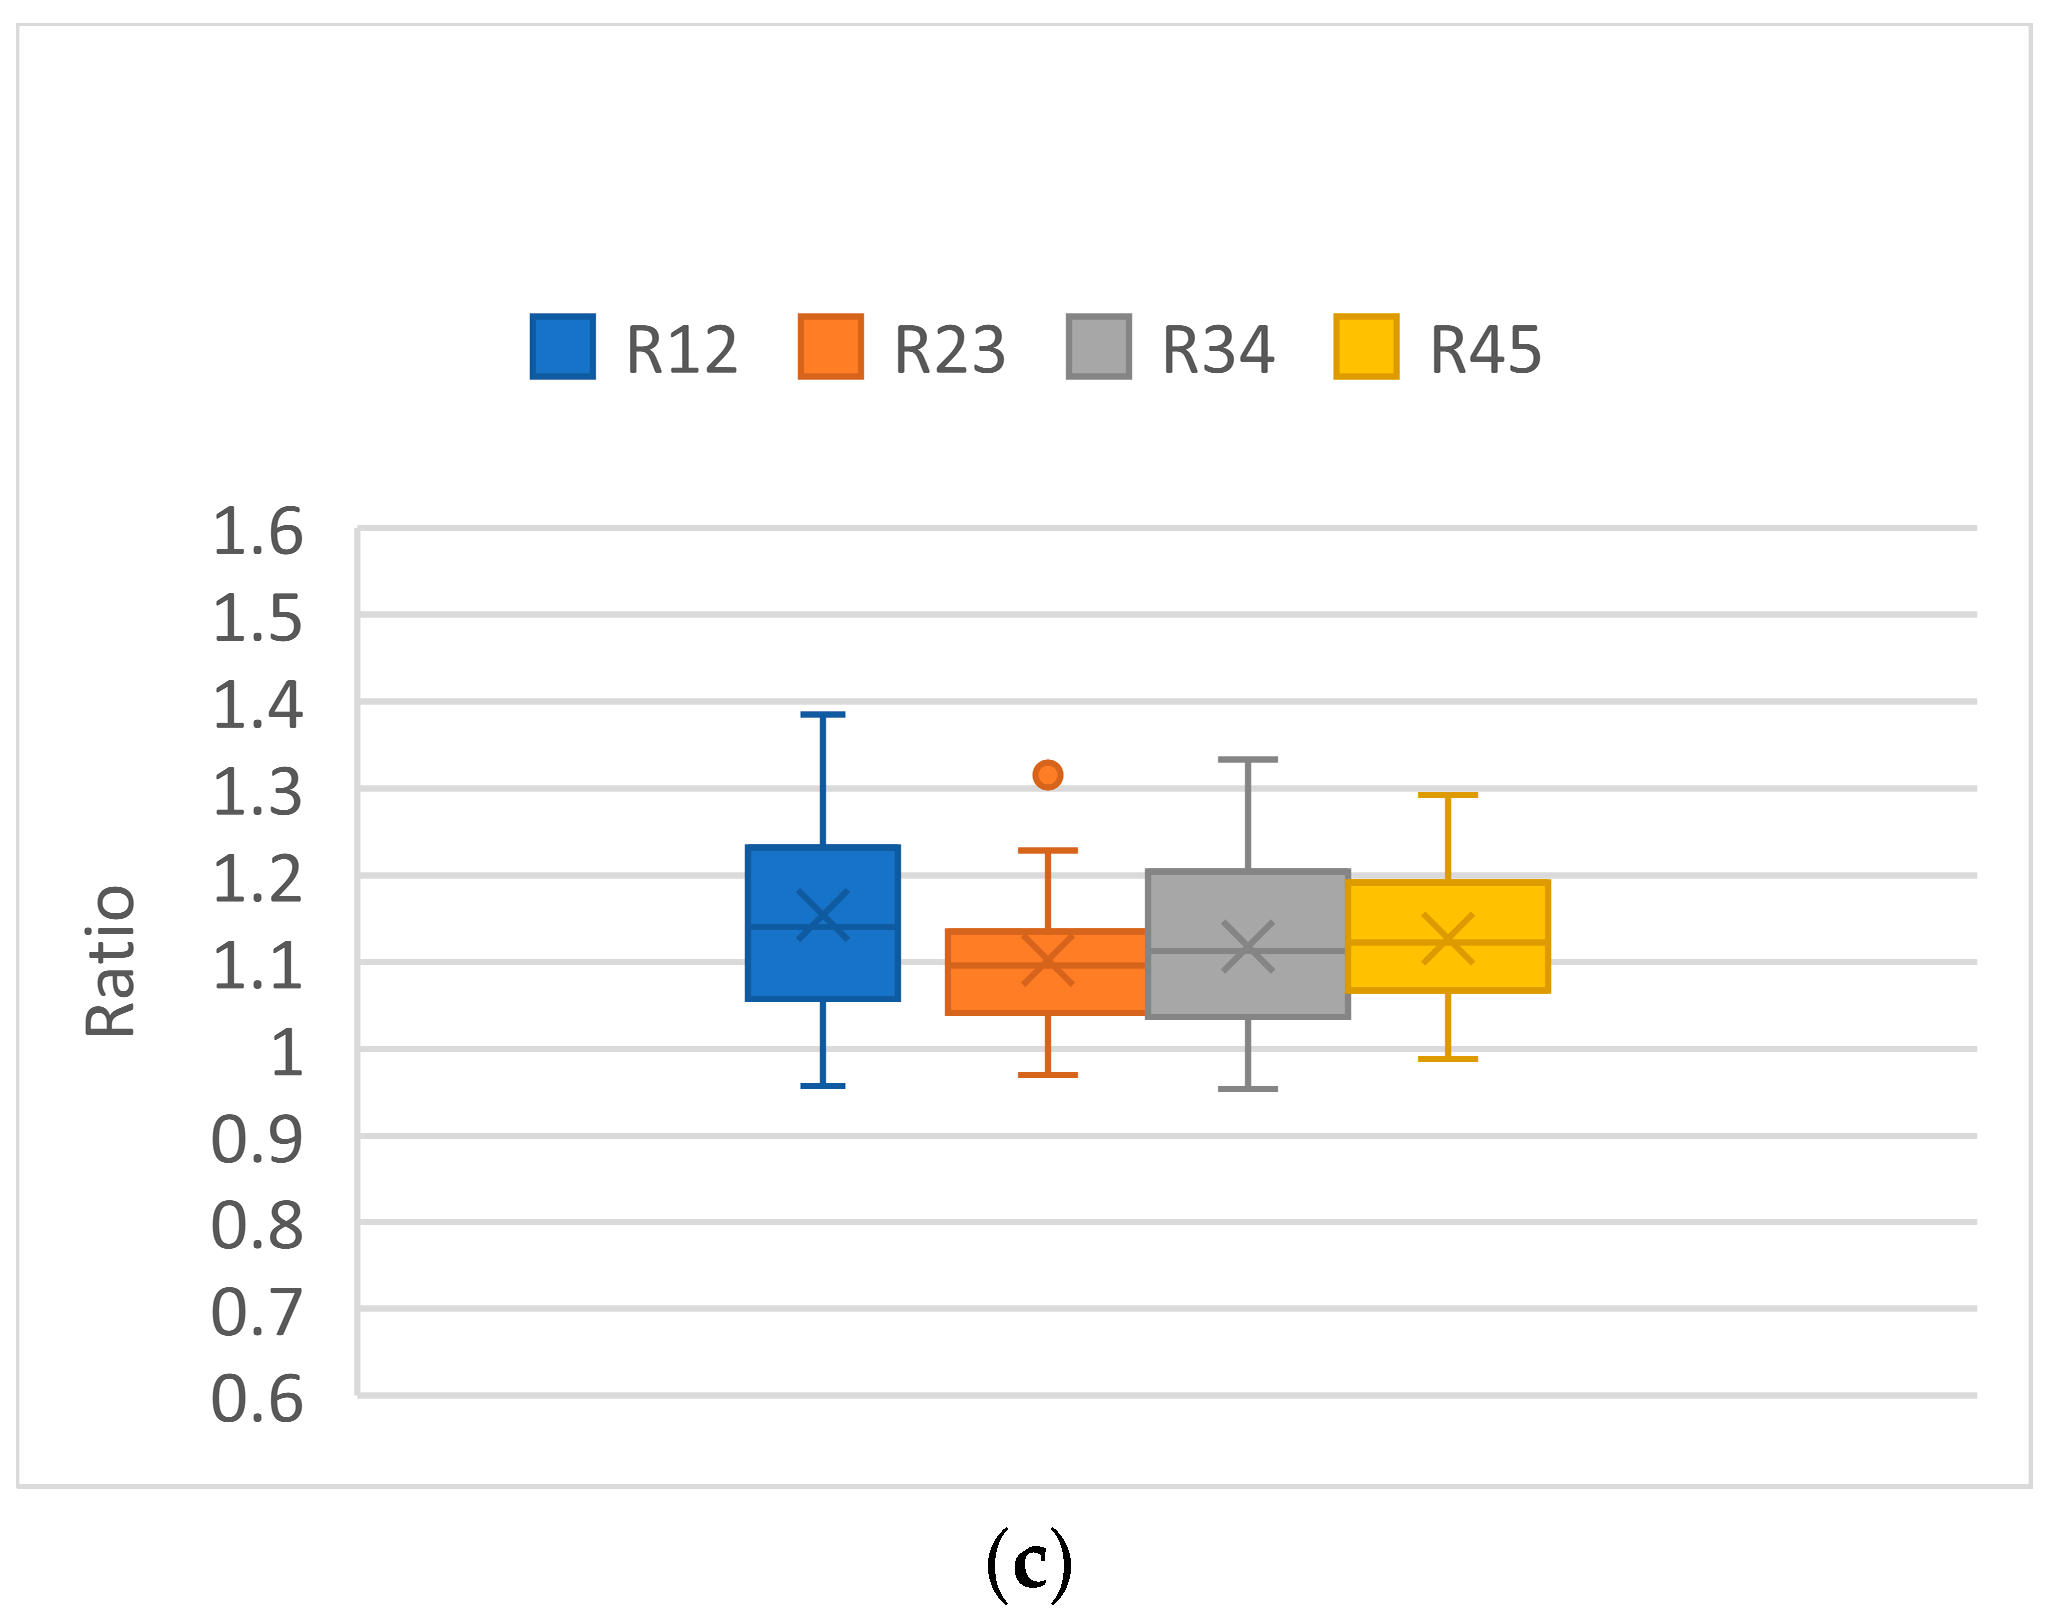
Figure 1 shows the leaf length, width, and area ratios for amabilis. The results of the analysis of variance (ANOVA) are insignificantly different for the length ratio (F (3, 120) = 0.502; p = 0.682), width ratio (F (3, 120) = 1.546; p = 0.206), and area ratio (F (3, 120) = 1.579; p = 0.198). There were 5 mature leaves for Phalaenopsis in the 12 cm pot. The length ratios of L1 to L2, L2 to L3, L3 to L4, and L4 to L5 were similar, and no significant differences could be found. The same results were found for the width ratios and area ratios. That is, the W ratios of W1 to W2, W2 to W3, W3 to W4, and W4 to W5 were similar, and no significant differences could be found. The same conclusion was found for the area ratios. The area ratios of A1 to A2, A2 to A3, A3 to A4, and A4 to A5 were similar, and no significant differences could be found. The length, width, and area ratios in sequence leaves are useful characteristics of Phalaenopsis. The leaves are developed sequentially in Phalaenopsis, whereby the newly grown leaves are larger than the previous leaves. The results for Phalaenopsis amabilis confirmed this leaf growth characteristic.
The analysis of variance results for Sin Yuan indicated no significant differences between the length ratios (F (3, 120) = 1.970; p = 0.124), width ratios (F (3, 120 = 0.497; p = 0.685), and area ratios (F (3, 120) = 2.217; p = 0.092).
The evaluation of the length ratios, width ratios, and area ratios for Rey Lish was performed with a one-way ANOVA. The results of the ANOVA were insignificantly different for the length ratios (F (3, 120) = 0.655, p = 0.582), width ratios (F (3, 120) = 2.111, p = 0.983), and area ratios (F (3, 120) = 0.918; p = 2.683).
To evaluate the leaf ratio of Ishin KHM1095, a one-way ANOVA was performed. The results revealed no significant differences between the four leaf ratios (F (3, 120) = 2.260; p = 0.085), width ratios (F (3, 120) = 2.070; p = 0.108), and area ratios (F (3, 120) = 2.393; p = 0.720).
For the Sogo F1091 variety, the results of the one-way ANOVA showed the effect of the ratios of the characteristics was insignificant. The results were F (3, 120) = 1.633, p = 0.185, for the length ratios; F (3, 120) = 2.113, p = 0.0781, for the width ratios; and F (3, 120) = 1.211, p = 0.309, for the area ratios.
According to the observations of growers, the leaves are developed sequentially in Phalaenopsis, such that the newly grown leaves are larger than the previous leaves. The results for the five varieties of Phalaenopsis confirm this leaf growth characteristic. This provides a quantitative basis for the leaf characteristics of Phalaenopsis.

2.1.2. The Ratio Characteristics of Five Varieties

In this study, the leaf characteristics of five Phalaenopsis varieties were measured.
In the above discussion, the length ratio, width ratio, and area ratio were insignificant for each variety. Then, all the data for each variety were pooled for further analysis. For example, the L12, L13, L34, and L45 data of a variety were pooled into a data set.
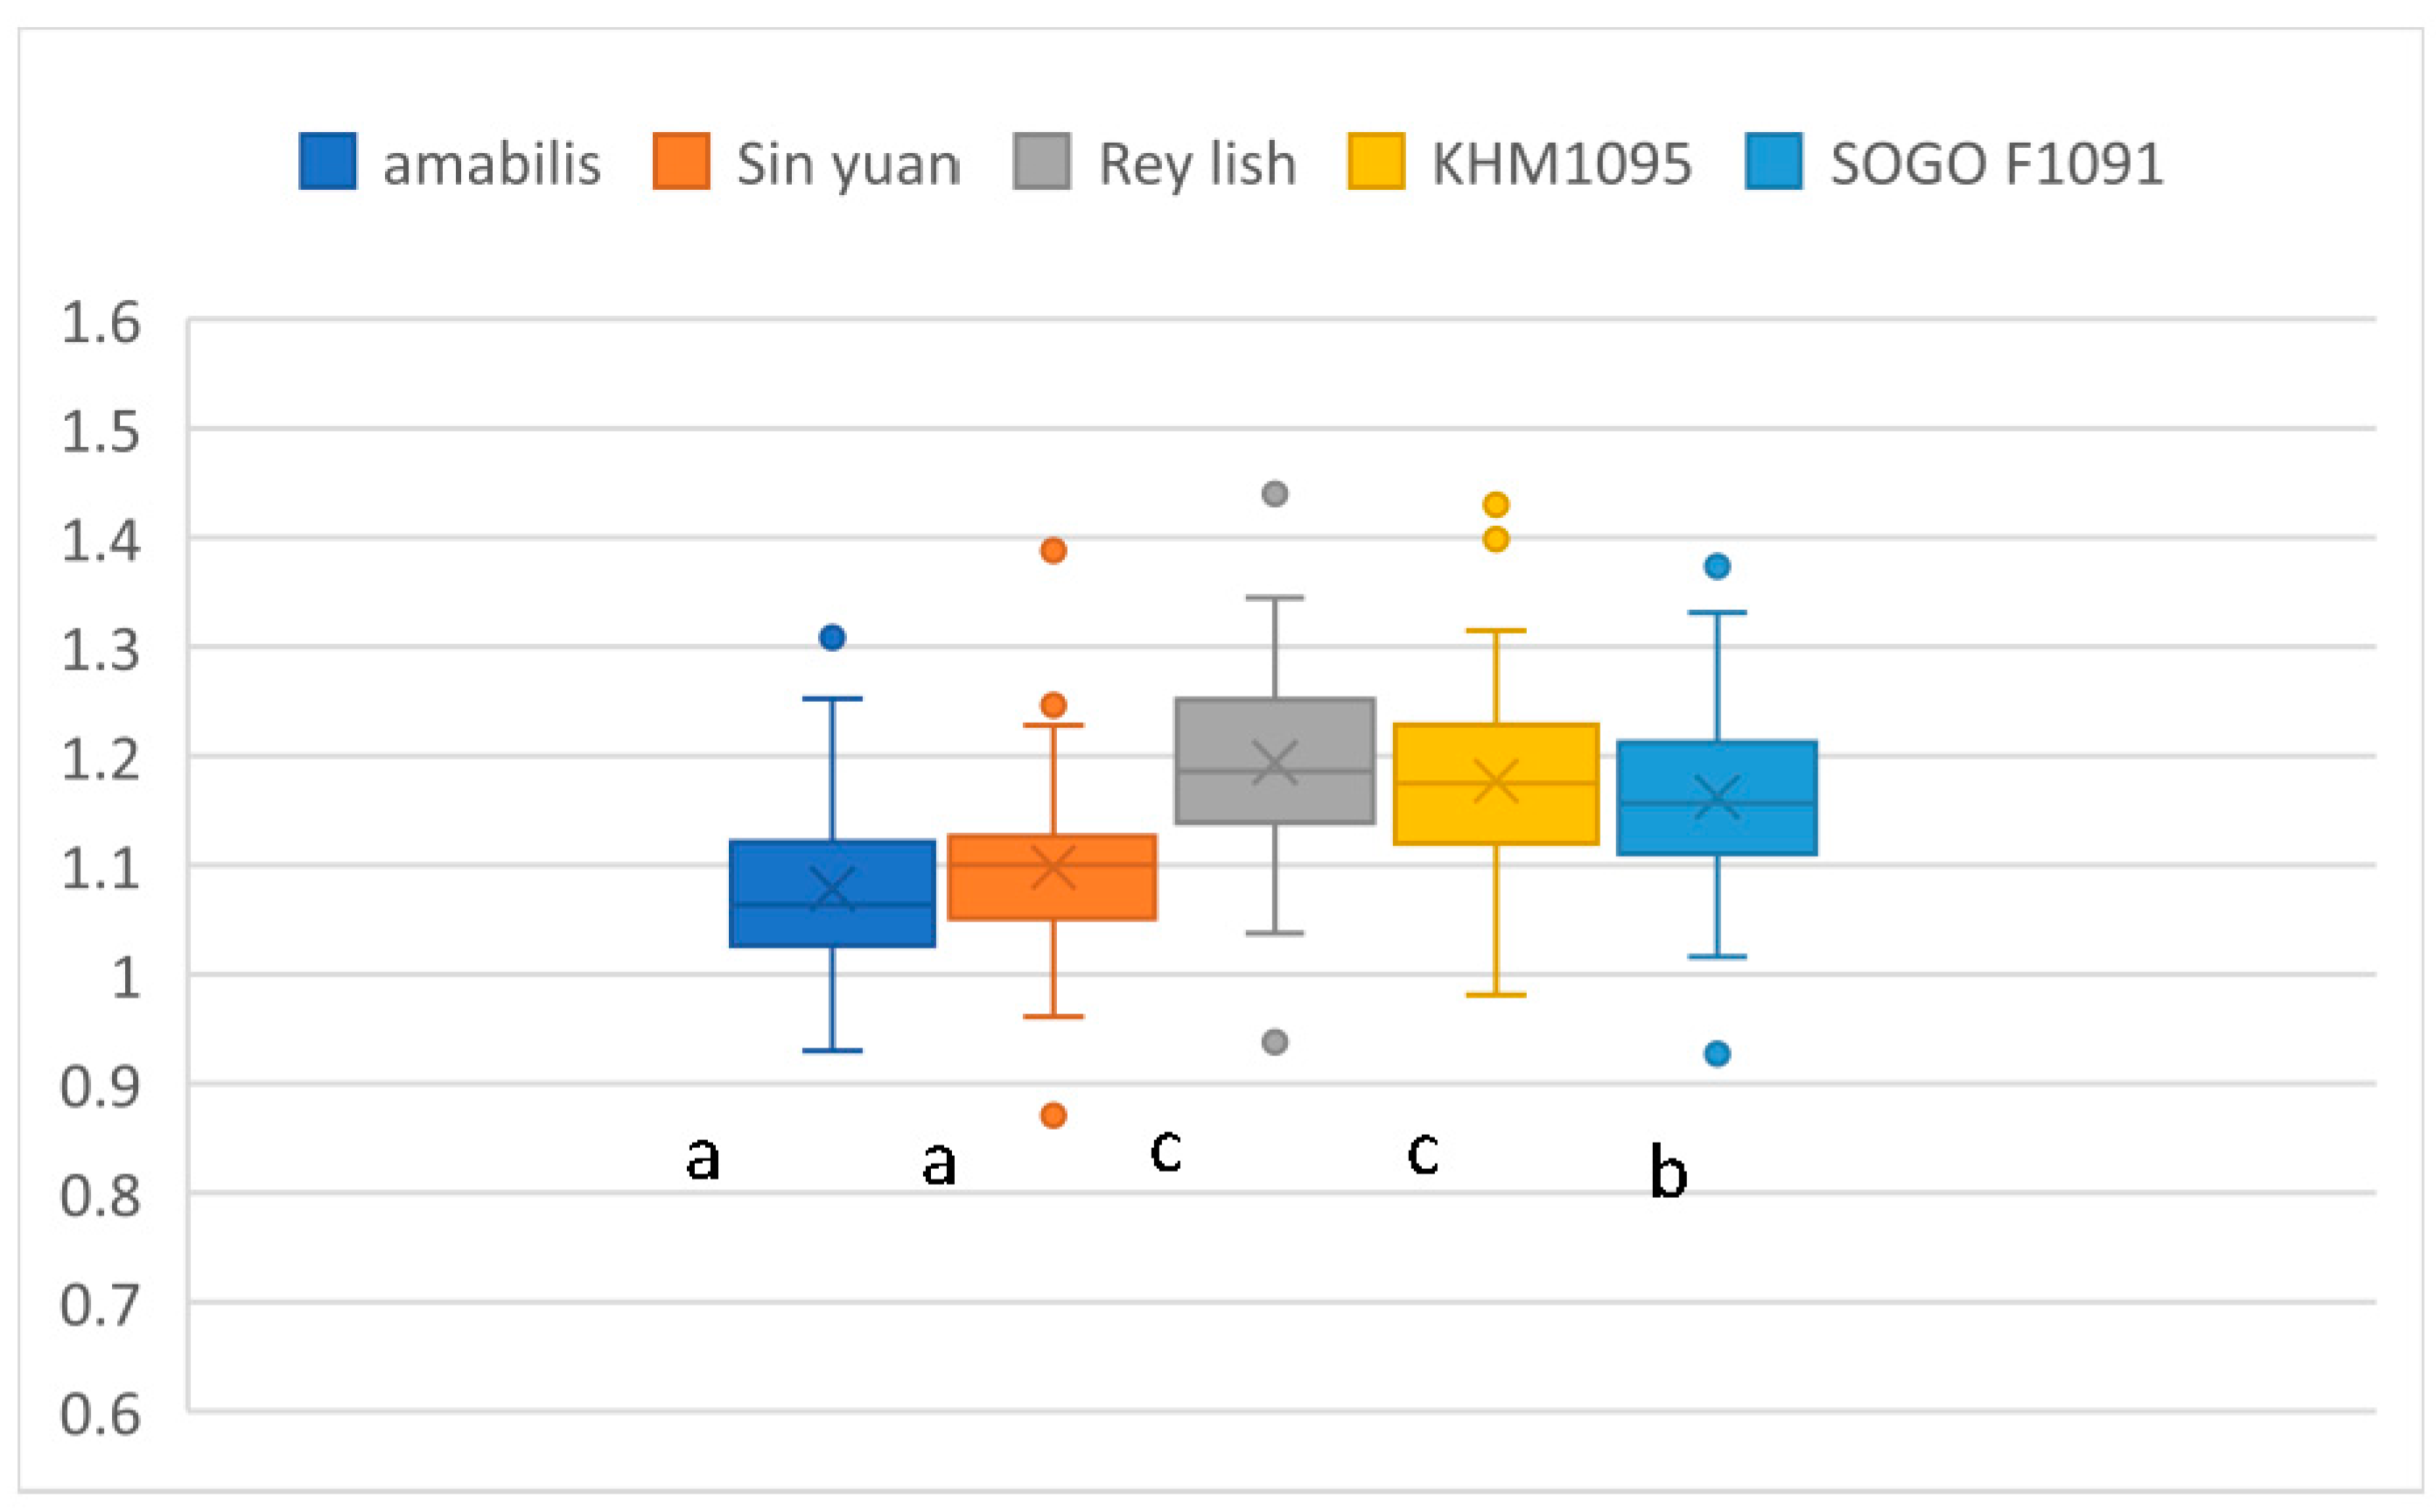
A comparison of the length ratios for the five varieties is shown in Figure 2. The results of the ANOVA are significantly different (F (4, 615) = 50.150; p < 0.001). In multiple comparisons, Tukey’s tests are significantly different for the 3 groups at a 95% confidence level. The order for the average length ratios is Rey Lish and KHM1091 > Sogo F1091 > amabilis and Sin Yuan.
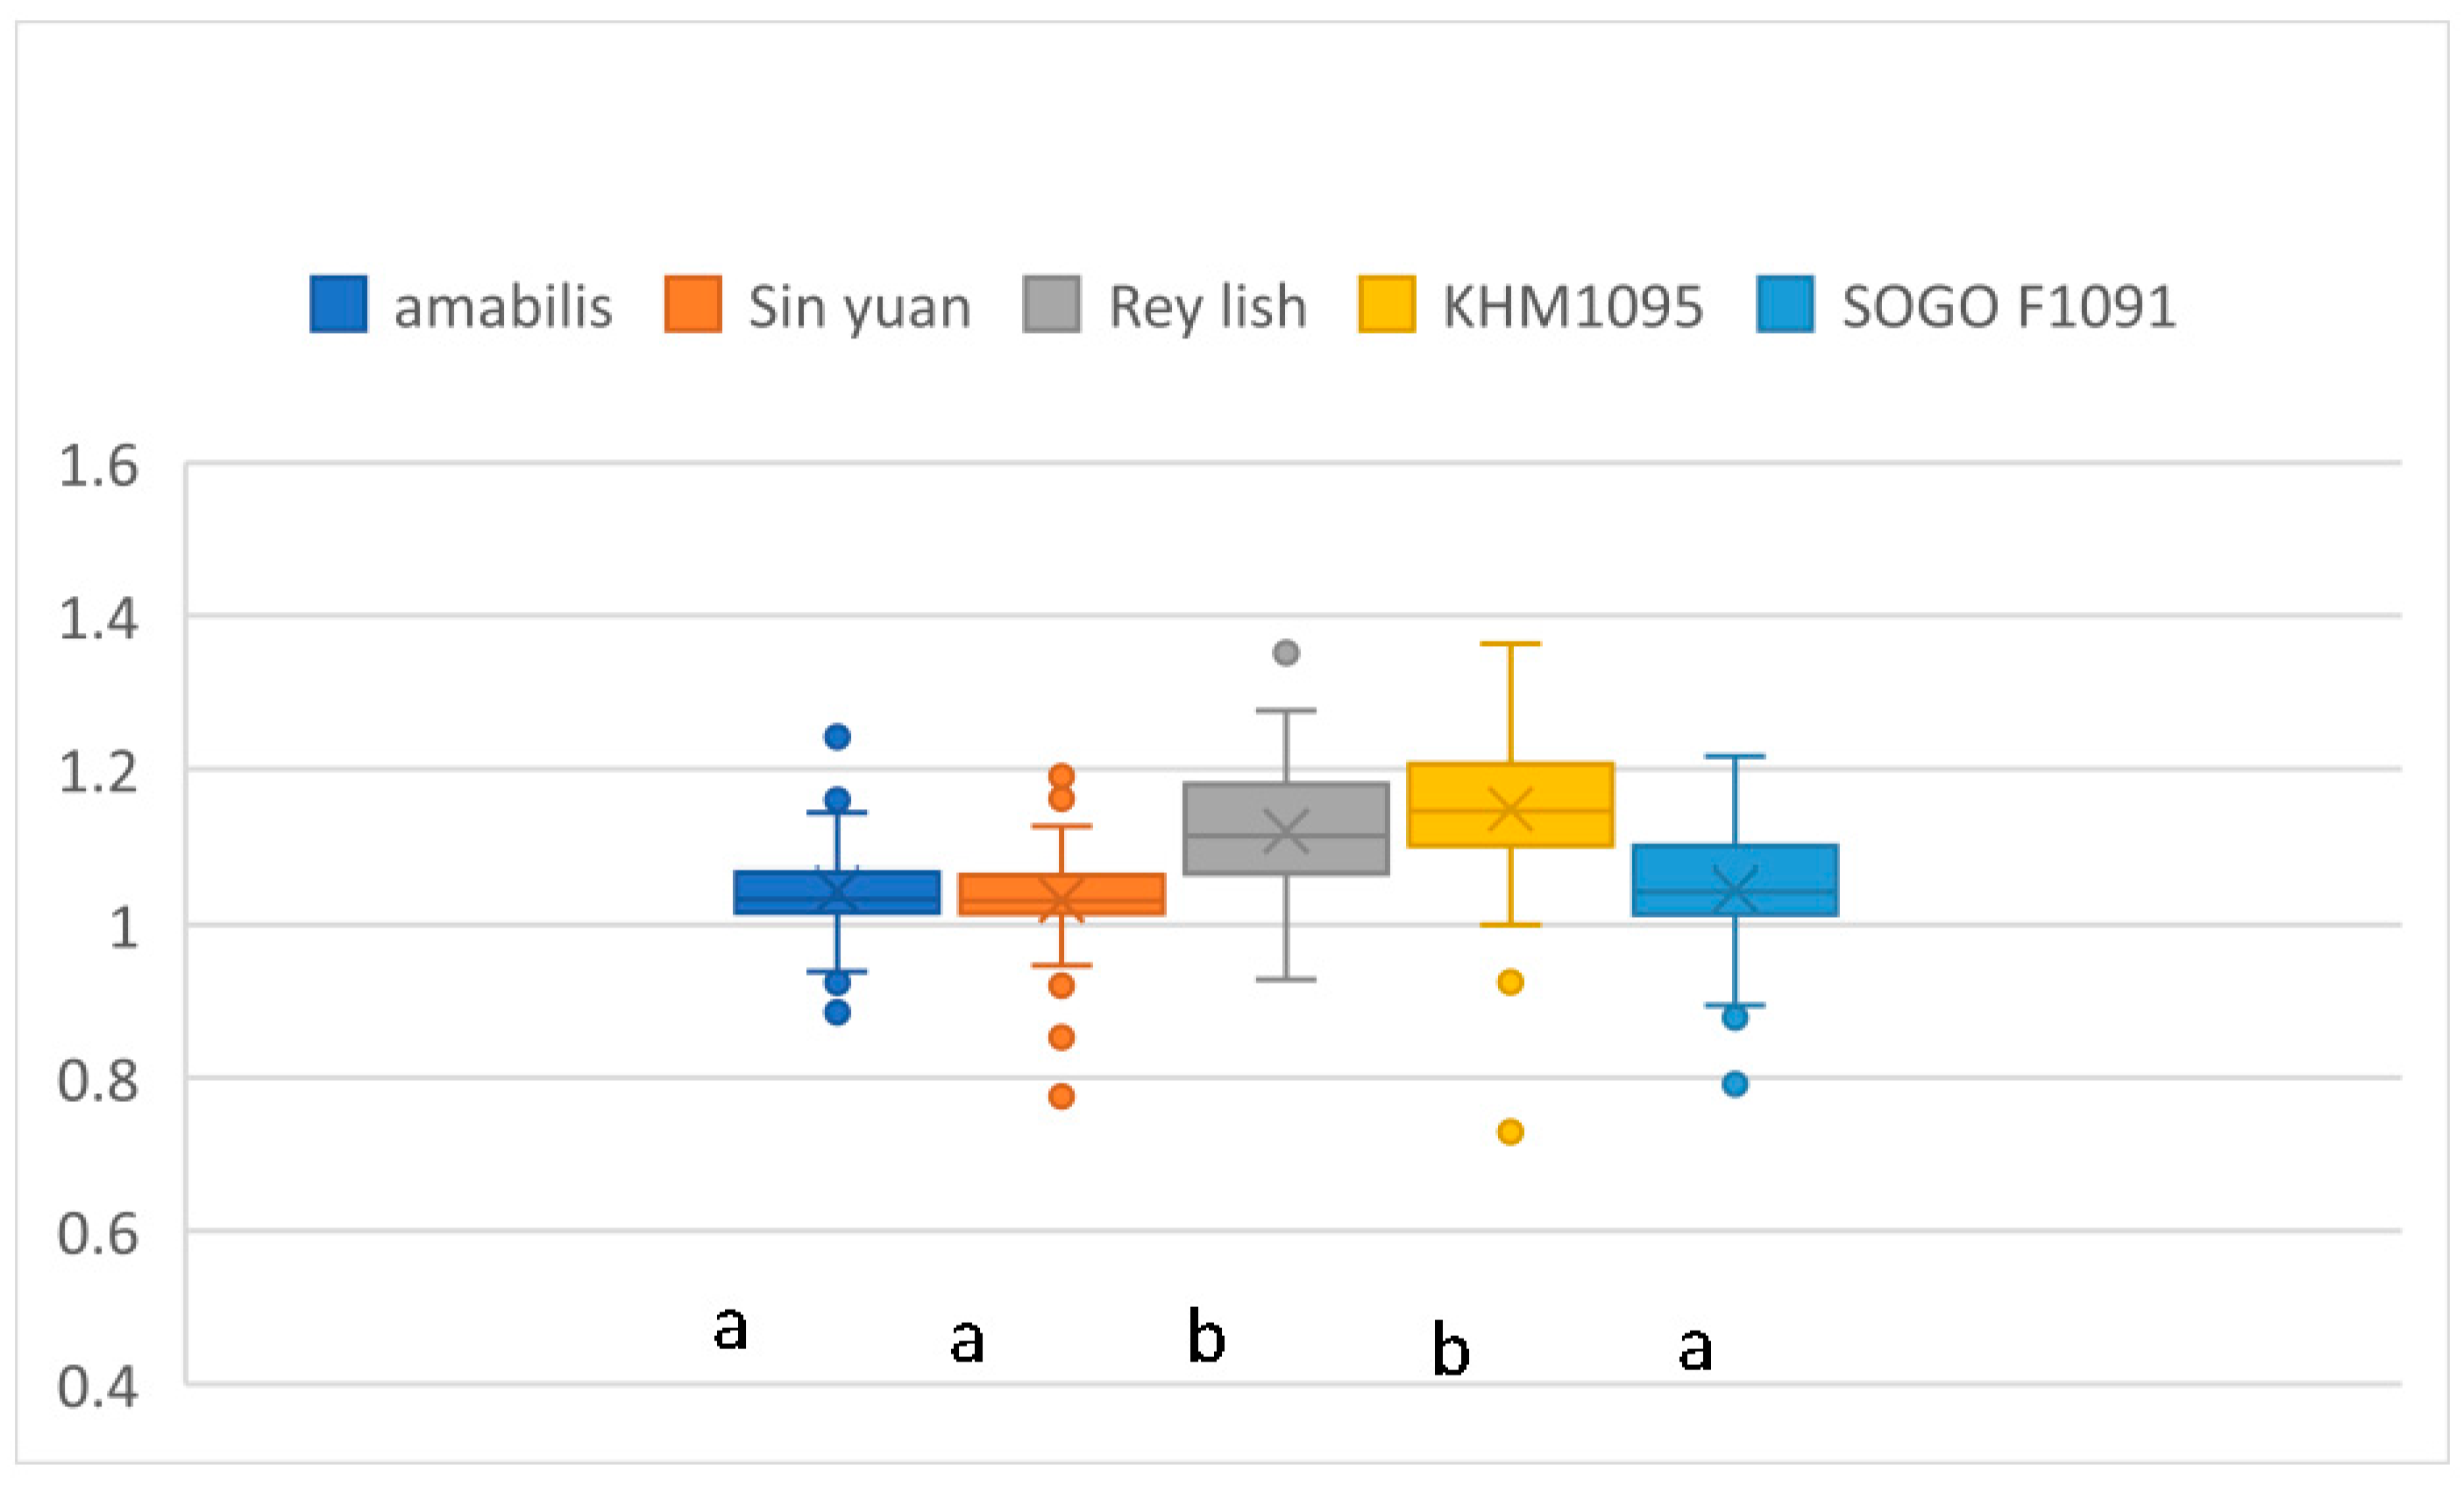
A comparison of the width ratios for the five varieties is shown in Figure 3. The results of the analysis of variance show a significant difference (F (4, 615) = 53.113; p < 0.001). For multiple comparisons, Tukey’s tests are significantly different for the 2 groups at a 95% confidence level. The order for the average width ratios is Rey Lish and KHM1091 > amabilis and Sin Yuan and Sogo F1091.
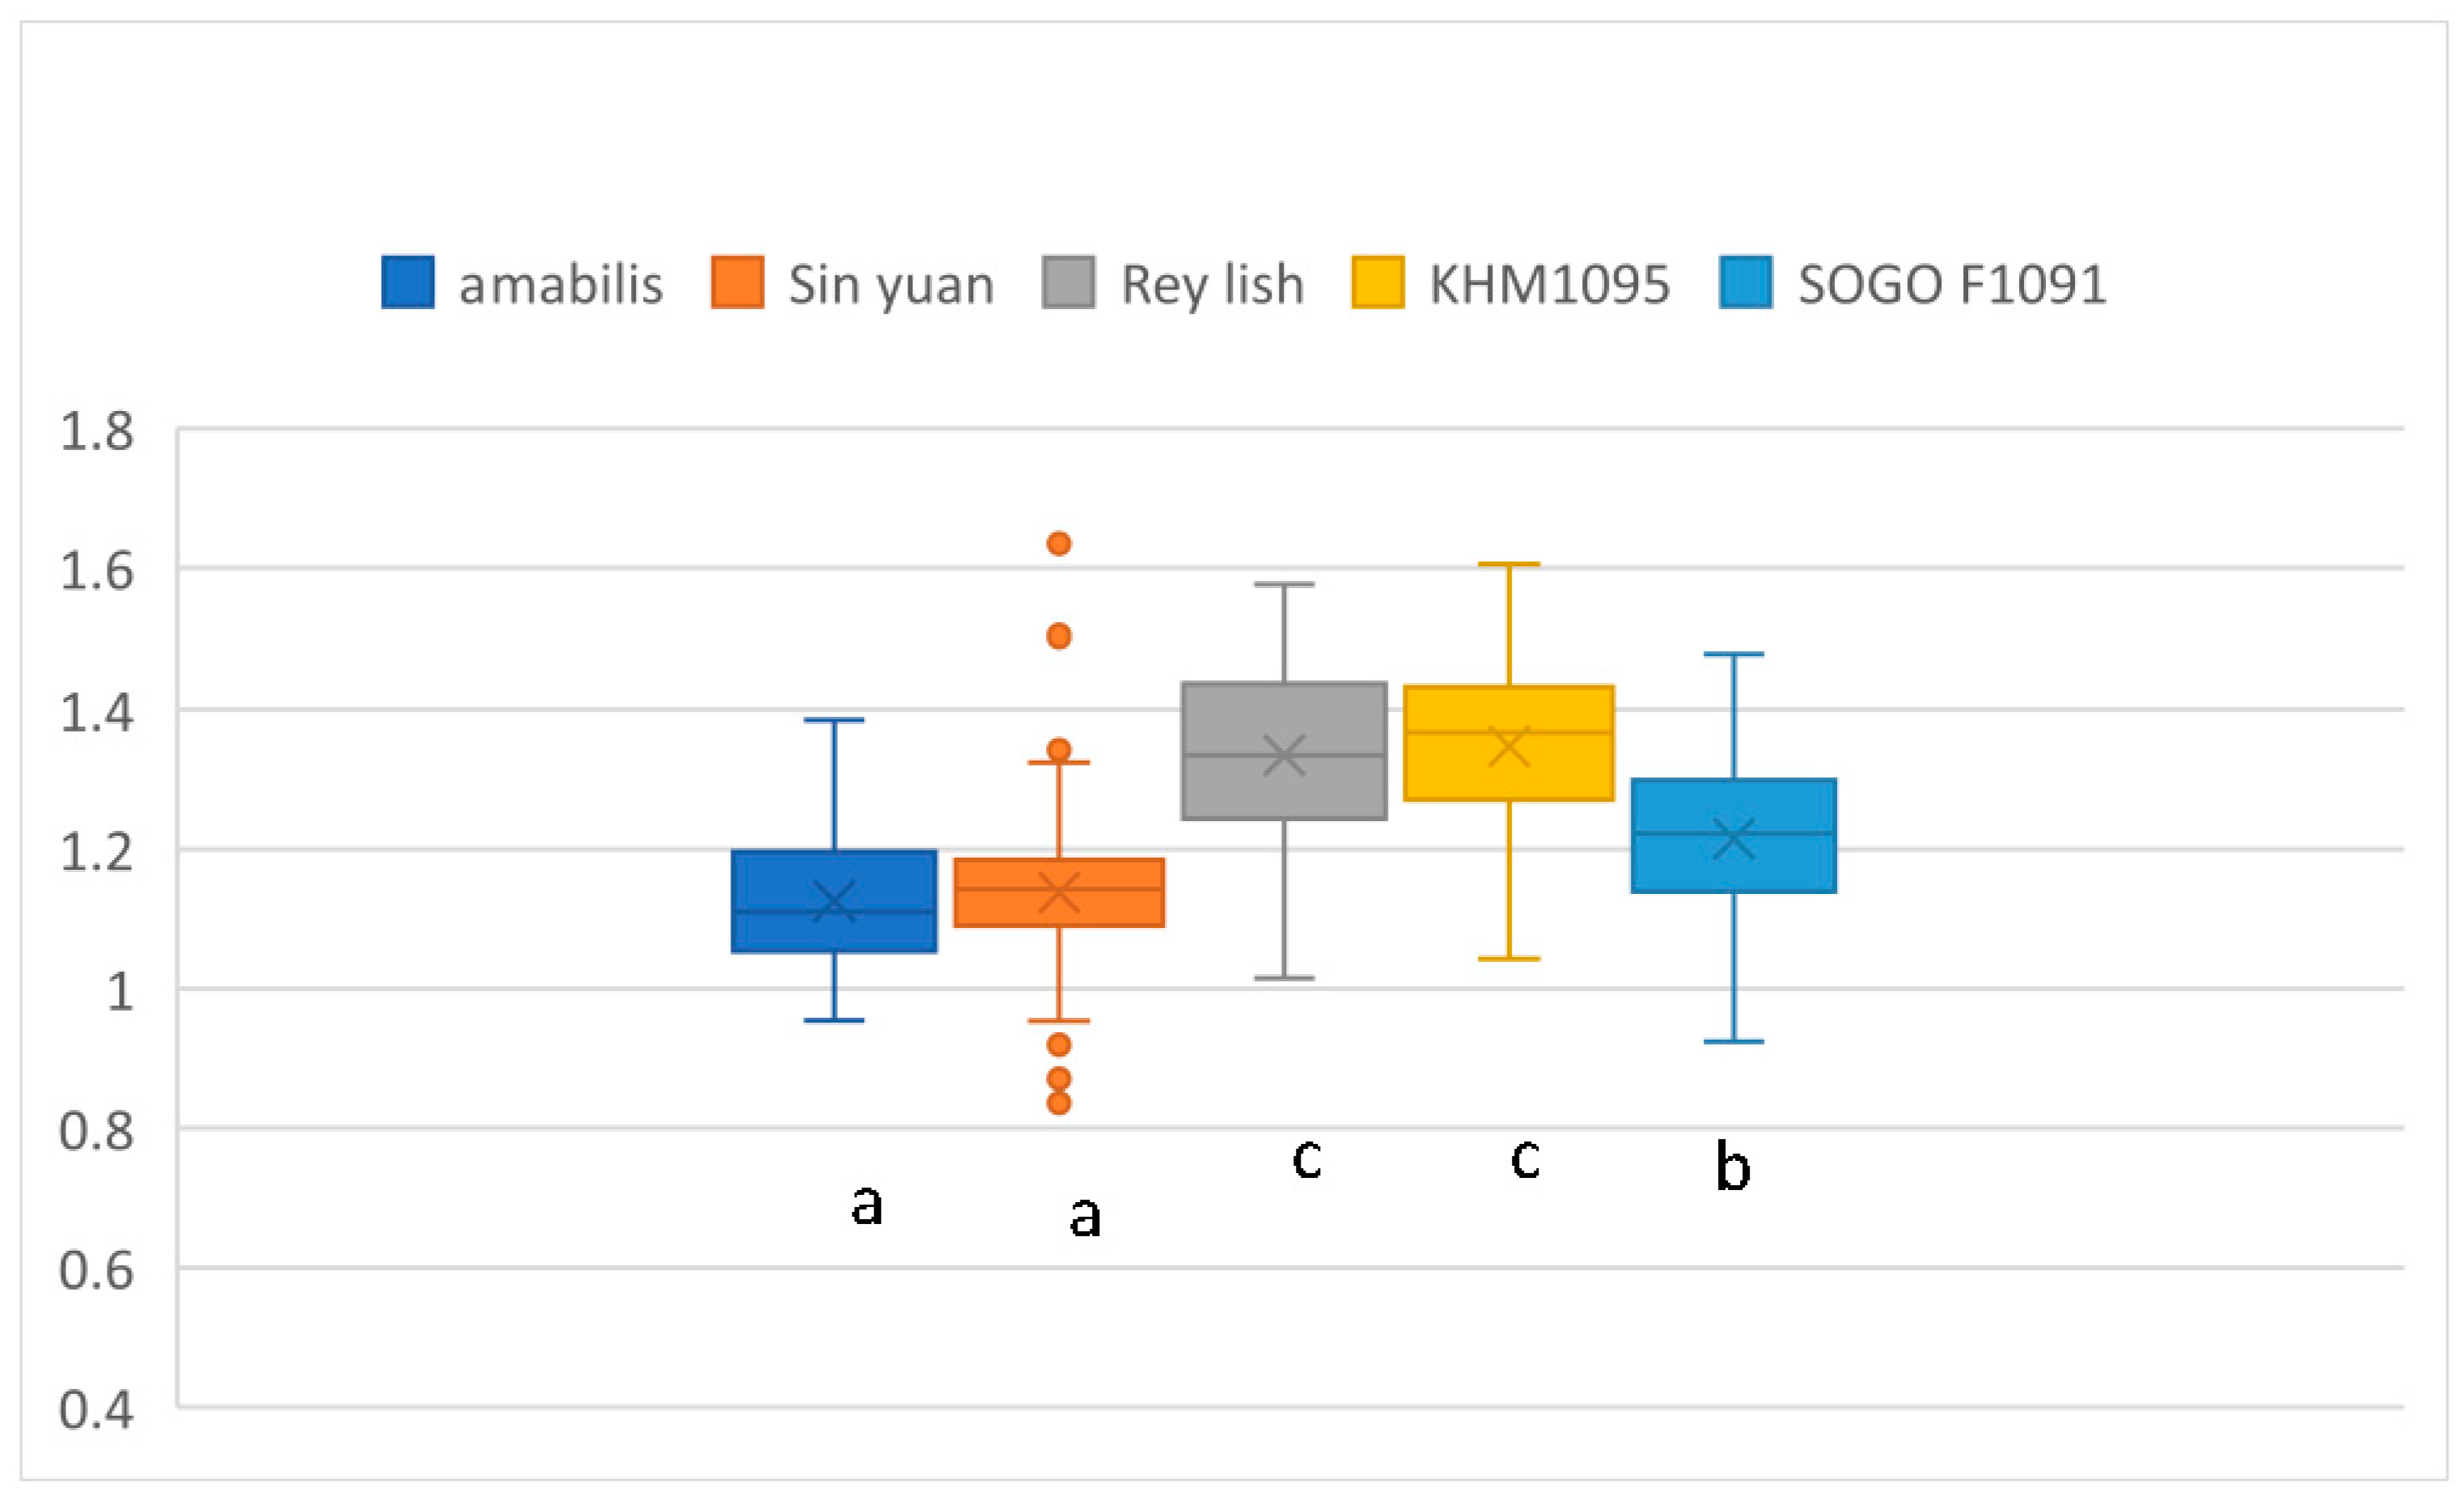
A comparison of the area ratios for the five varieties is shown in Figure 4. The results of the ANOVA indicate a significant difference (F (4, 615) = 101.74; p < 0.001). For the multiple comparisons, Tukey’s test measurements show significant differences between the 3 groups at a 95% confidence level. The order for the average area ratios is Rey Lish and KHM1095 > Sogo F1091 > amabilis and Sin Yuan.
In Table 1, the flower styles and the plant heights of amabilis and Sin Yuan differ. However, both varieties had similar leaf ratio characteristics. The Rey Lish and KHM1095 varieties have big red flowers and similar plant heights. They have similar leaf ratio characteristics. Sogo F1091 has a similar plant height and flower size to amabilis and Sin Yuan. The flower color is different. The leaf ratio characteristics differ from those of other varieties. Due to the diversity of the Phalaenopsis varieties, it is necessary to establish each variety’s specific leaf ratio characteristics.
Growers have observed the sequential development of Phalaenopsis leaves. The special characteristic of Phalaenopsis is that the areas of newly grown leaves are larger than those of previous leaves. The results for the five varieties of Phalaenopsis reveal that each variety has a special growth characteristic. The basic leaf characteristics of each variety need to be established.

2.2. The Prediction Performance for the Total Leaf Area

The mean values of the area ratios for the five varieties were used in the top and bottom models to predict the total leaf areas. The prediction error is defined as the predicted value minus the actual measured total leaf area value. The prediction errors for the two models of the five varieties are listed in Table 2.
For the criterion e min, the top model has smaller e min values than those of the bottom model, except for Rey Lish. All the emax values of the top model are smaller than those of the bottom model. For the criterion | e | ave, the average mean absolute error, the top model has smaller values than those of the bottom model. The | e | ave values of the top model are 19.15, 23.33, 32.48, 22.25, and 30.79 for the five varieties, respectively. However, the | e | ave values of the bottom model are 21.13, 24.19, 48.15, 45.94, and 32.91 for the same varieties, respectively. Comparing these predictive criteria, the top model has a better predictive performance than the bottom model.
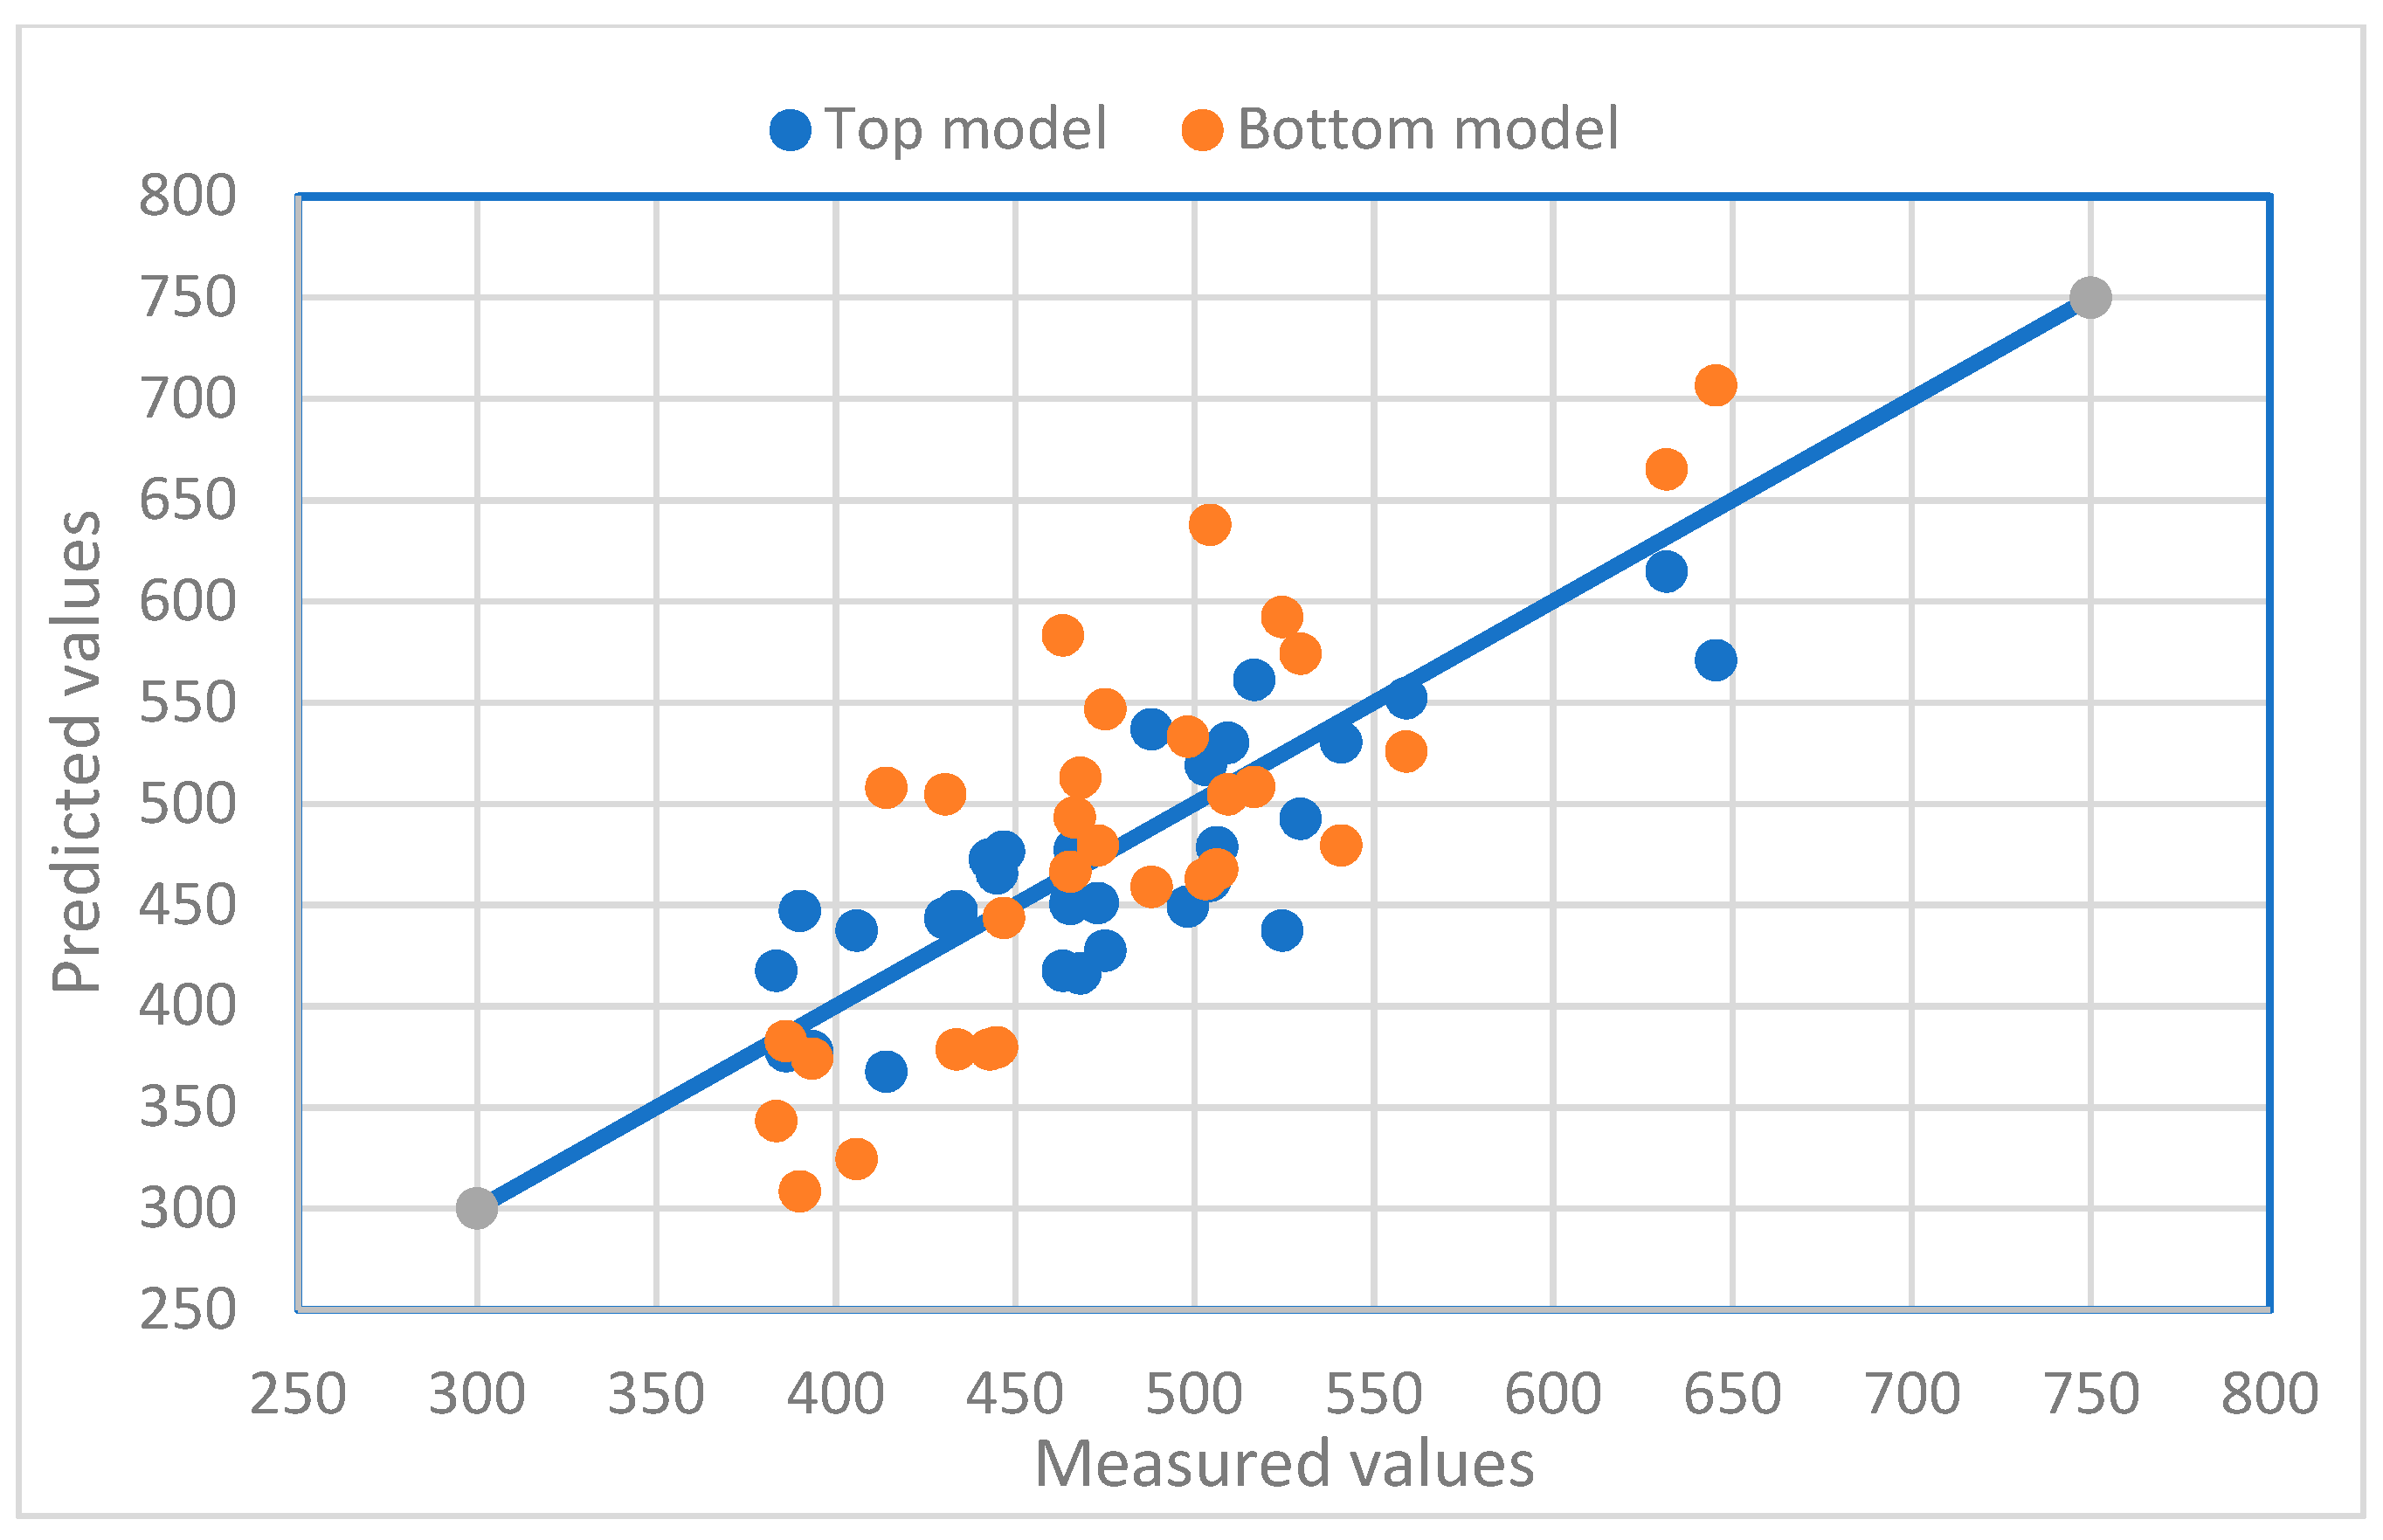
The relationships between the measured values and the predicted total leaf areas using the two models for the three varieties are presented in Figure 5, Figure 6 and Figure 7. The diversified scatter points along the X = Y lines reveal the prediction problems of the models. If only a few samples are used for leaf area measurements, the predicted total leaf area may not be accurate enough.
The effects of the sample numbers on the prediction performance for the total leaf area are listed in Table 3. A sample number of 10 means 10 plants were used to measure their top or bottom areas. Then, the total leaf areas were calculated with the top model or the bottom model, The mean error percentages of the top model are 5.4% (amabilis), 1.3% (Sin Yuan), −5.9% (Rey Lish), −5.1% (KHM 1095), and −4.0% (Sogo F1091). The mean error percentages of the bottom model are −2.9% (amabilis), −2.6% (Sin Yuan), 3.7% (Rey Lish), 6.7% (KHM 1095), and 2.3% (Sogo F1091). The mean error percentages of the two models are > 2%, except for the top model for Sin Yuan.
A sample number of 20 means 20 plants were used to measure their top and bottom leaf areas and then to calculate their total leaf areas. The error percentages are reduced. With a sample number of 30, 30 orchids were used to measure their top and bottom leaf areas. The total leaf areas were calculated. The mean error percentages of the top model are 0.4% (amabilis), −0.3% (Sin Yuan), −1.7% (Rey Lish), 0.8% (KHM 1095), and 1.2% (Sogo F1091). The mean error percentages of the bottom model are 1.7% (amabilis), −0.8% (Sin Yuan), 1.3% (Rey Lish), −1.1% (KHM 1095), and 1.0% (Sogo F1091). The mean error percentages of the two models are < 2%. In a study on the allometry of the epiphytic orchid Lankesterella ceracifolia [10], the sample number was thirty-five. This number exceeds the investigated number in our study. Based on the results of this study, a sample number of thirty is enough. That is, 30 leaves are measured for each quality control work. This technique could cooperate with the standard operating procedure (SOP) of greenhouse management.

3. Discussion

In the cultivation of Phalaenopsis [3], Anthura b.v. illustrates mature orchids with their shapes and number of leaves. However, the study still lacks a quantified criterion. With the concept of allometry, growth characteristics can be evaluated with the measurement of leaf length, width, and area. The development of leaf shape is affected by the environment (temperature, light intensity, etc.) and fertilization. The observation of leaf growth characteristics provides useful information on Phalaenopsis management. For example, if the leaf measurement data during a period of quality control work indicated that the ratios of length, width, and area were different from the previous standard of this variety, the management of microclimate factors and the fertilization technique would need to be modified.
The total leaf area of an orchid is important information to evaluate its mature state. The total leaf area can be calculated with the measurement of the top leaf area and the model developed in this study. Then, the total leaf area could serve as a useful index.
From a practical viewpoint, measuring the top leaf area is easier than measuring the bottom leaf area. To increase production capacity, orchid pots are very densely placed in commercial greenhouses. The distribution of the upper leaves retards the measurement of the lowest leaf area.
Recently, drones have been applied in greenhouses to obtain crop information with cameras. A lot of pictures of plants could be captured within a short time. Many data on the top area of orchids were easily collected [32]. The information on the total leaf area can then be calculated with the top model developed in this study. This study provides an easy and smart method to enhance the production of Phalaenopsis. When the total leaf area is calculated, this parameter can be used for crop models to evaluate growth conditions and manage other crops.
To the authors’ knowledge, this study is the first to research total leaf area models for orchids. Lawless et al. [11] proposed a wheat canopy model that links leaf area and its phenology. In this study, the total leaf area was introduced and validated. This model can be incorporated into these crop models to enhance their predictive performance. Lee et al. [12] found a correlation between carbohydrate concentrations and the soluble sugars in the leaves of Phalaenopsis. They present the basic concept of the relationship between the total leaf area and the quantity and quality of flowers. Further studies need to be performed. Paradiso et al. [1] introduced the effect of plant size on the flowering of Phalaenopsis. However, their definition of plant size was not precise enough. The values of the total leaf area developed in this study could provide a more precise index for plant size. Crop models have been proposed and emphasized by researchers [16,28,33,34]. In their models, the total leaf area involves photosynthesis, respiration, and transpiration. However, measuring each leaf area and calculating the total leaf area is time-consuming work in the applications of these crop models. The model developed in this study provides an easy way to calculate the total leaf area.
In a study on the vegetative traits and flowering quality of Phalaenopsis for different genotypes, van Tongerlo et al. [35] found the after-effects of treatments applied during vegetative growth on flowering traits and plant biomass, and the number of leaves was positively correlated with the flowering quality. The authors mention that the measurements of the plant biomass and number of leaves can be used as predictors of flowering capacity and quality. The dry mass of Phalaenopsis is a function of the length and width [25]. In this study, besides the number of leaves, the shape, length, width, and total area are growth characteristics that could serve as quality control work for the cultivation of Phalaenopsis.
In this study, Phalaenopsis was selected as the research object. The nursery of these orchids was grown with the mericlone tissue culture technique. These genetic characteristics can supply a uniform nursery. The orchids were cultivated in a greenhouse with modern equipment. The aerial environment (temperature, humidity, light intensity, and air velocity) and root environment (moisture content and EC in the substrate) were all controlled in uniform conditions. In this study, the leaf ratio characteristics were established. Because of the uniform growth characteristics of Phalaenopsis, the variations in leaf dimensions in Table 2 were limited. The accuracy of the calculation of the total leaf area with the top model developed in this study is very helpful.
However, a nursery of other crops may be planted with seeds or cutting propagation materials. The aerial and root environment in an open field or simple protected culture cannot be a uniform microclimate such as in a modern greenhouse with all kinds of equipment. It may not be possible to adopt the technique developed in this study for all crops. The suitability of the developed model in this study needs to be further studied for other crops.

4. Materials and Methods

4.1. The Total Leaf Area Model

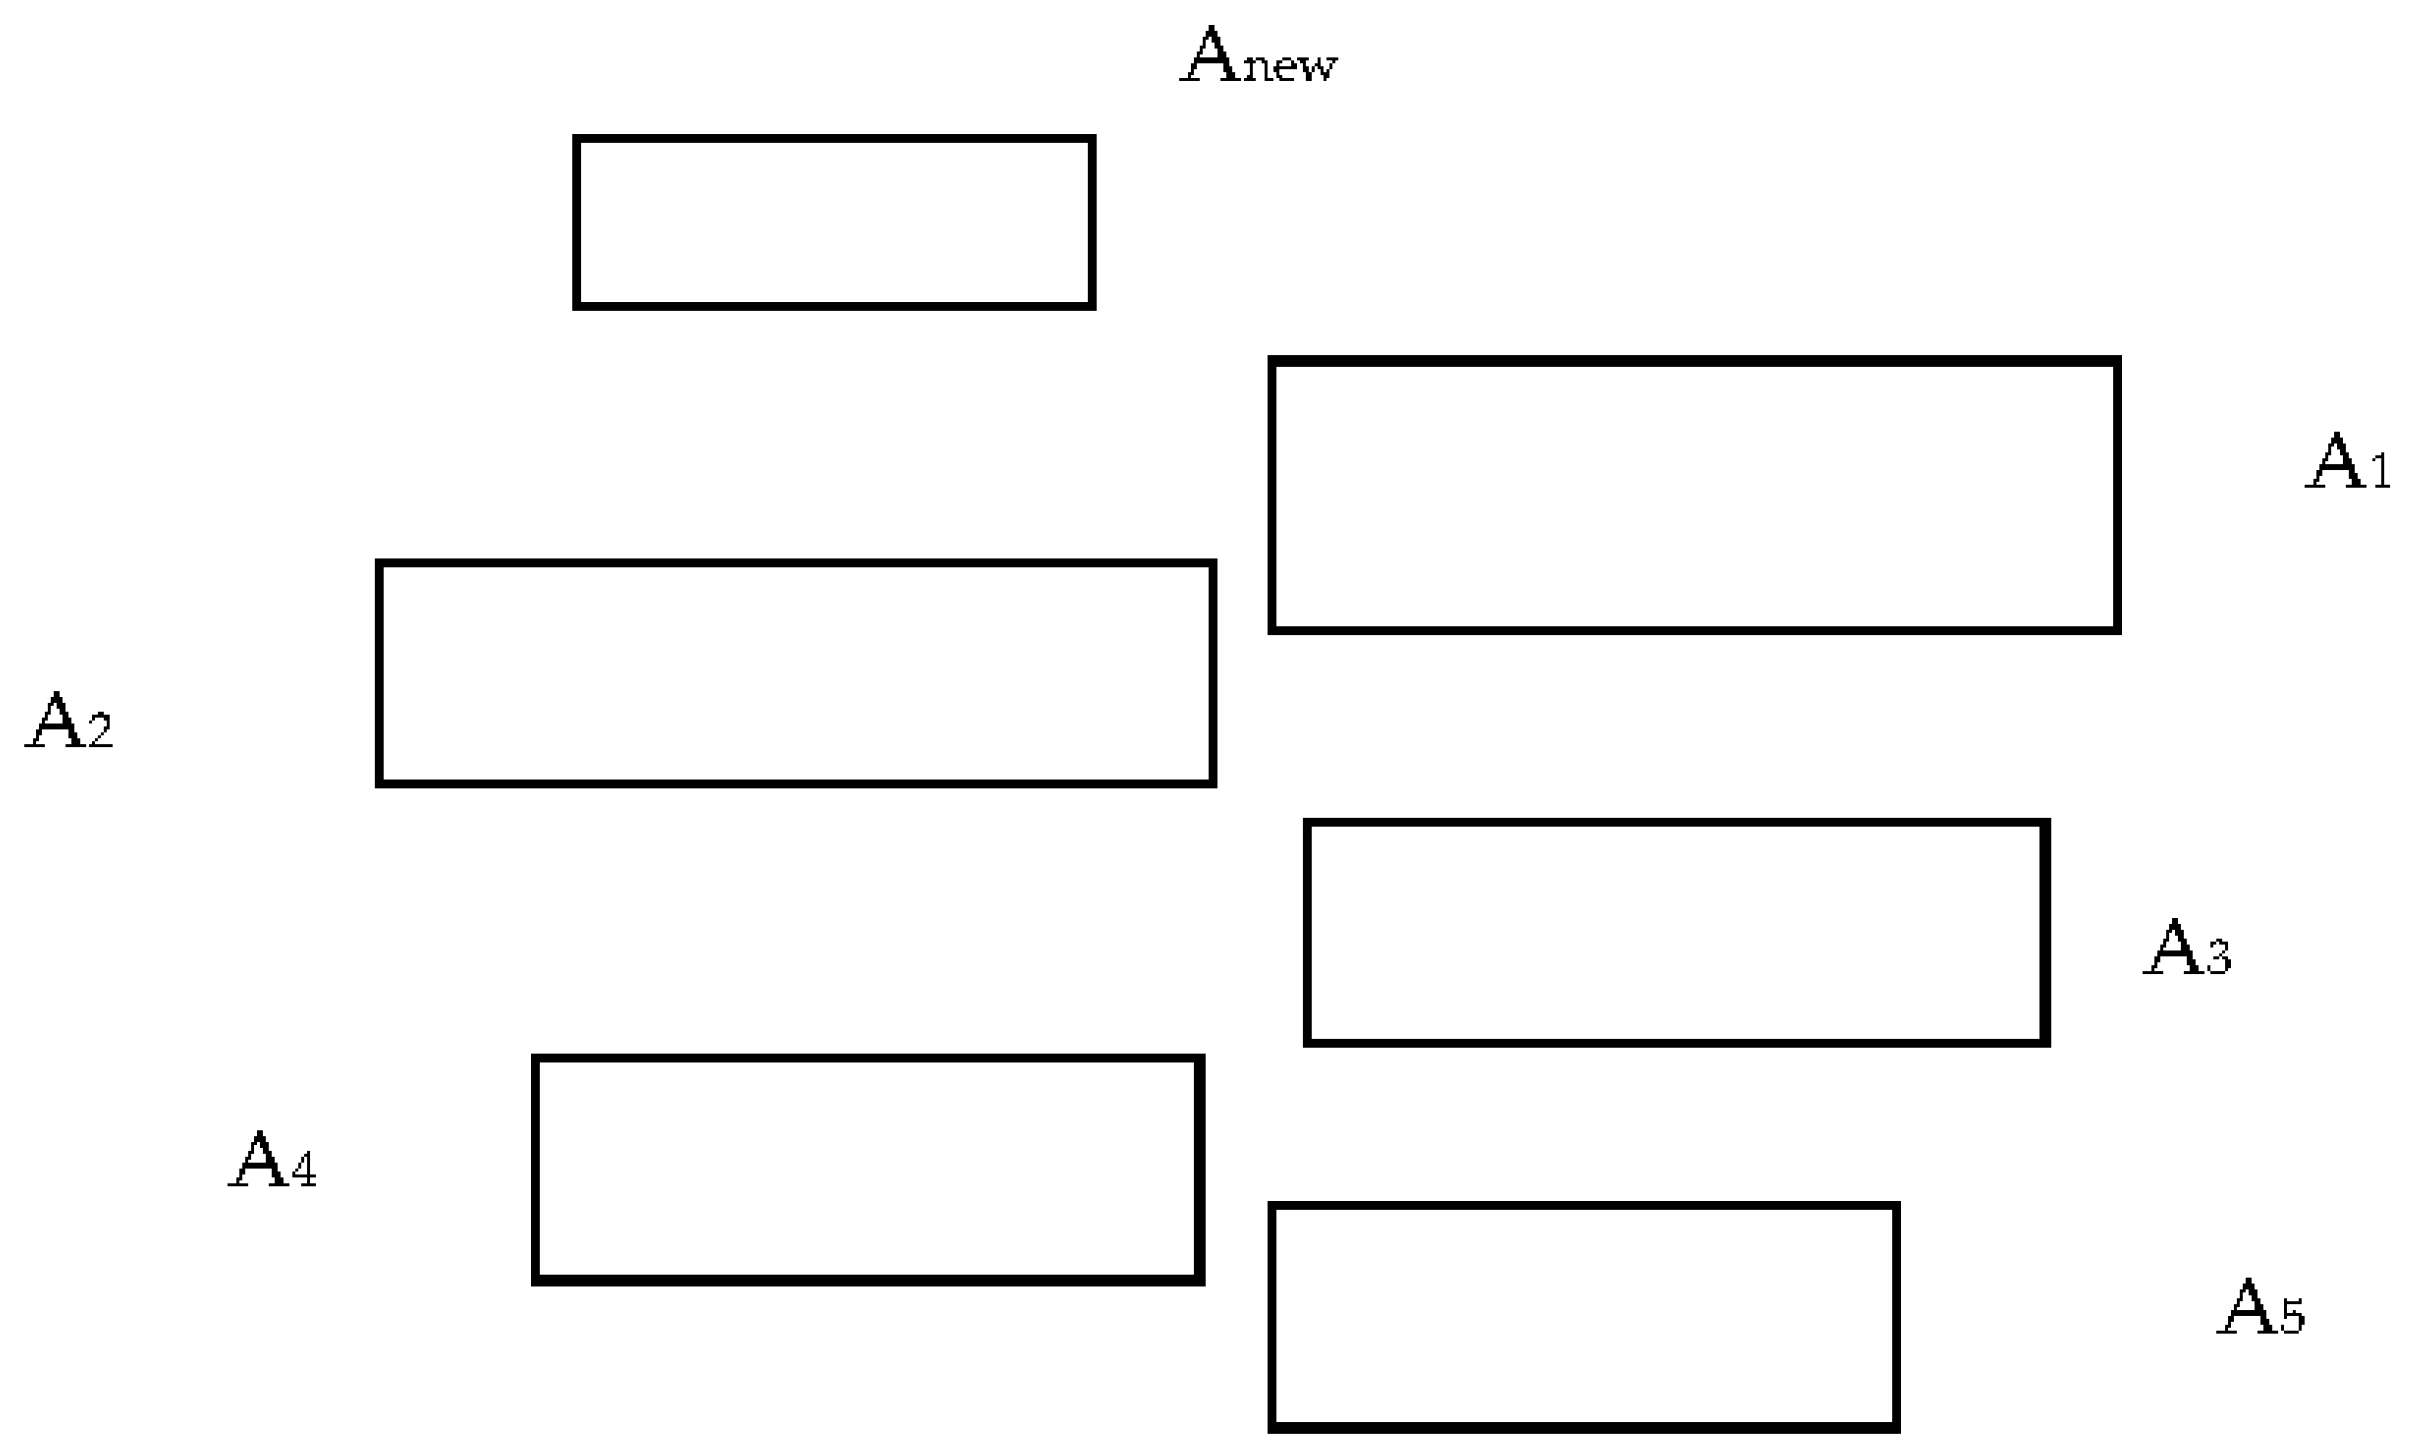
Phalaenopsis orchids with 5 leaves planted in a 12 cm pot were used as the test materials. The notation of the leaf number was adopted from the study by Hew and Yong [4]. The areas of new immature leaves and cotyledons were not considered in this study. The diagram of the number of leaves is shown in Figure 8. Anew is a new immature leaf. A1 to A5 are the sequential numbers of leaves. A1 is the top leaf, and A5 is the bottom leaf. The cotyledon is not presented in the figure.
The bottom leaf is called the fifth leaf, and the area (A5) is a function of the leaf length (L5) and width (W5).
A5 = K (L5 × W5)
In this study, K = 0.725 [25].
For the next leaf above the bottom leaf, the length (L4) and width (W4) of the fourth leaf (the L4) have a ratio relation with the bottom leaf.
L4 = aL5
W4 = bW5
The ratio of the length of the fourth leaf to the length of the fifth leaf is denoted as L45. The ratio of the width of the fourth leaf to the width of the fifth leaf is denoted as W45. The ratio of the area of the fourth leaf to the area of the fifth leaf is denoted as R45, and so on for other notations.
Therefore, the relationship between the leaf area of the fourth leaf (A4) and the area of the bottom leaf (A5) is expressed as
A4 = K (L4 × W4) = K × a × b × (L5W5)
It is assumed the ratio between L3 and L4 has the same value as a, and the ratio between W3 and W4 has the same value as b.
The area of the next upper leaf, the third leaf (A3), can be derived as
A3 = K (L3 × W3) = K × a × b (L4W4) = Ka2b2 (L5W5)
With the same procedure,
A2 = Ka3b3 (L5W5)
The area of the top leaf, the first leaf, can be calculated as
A1 = Ka4b4 (L5W5)
In a 4-inch pot of Phalaenopsis, there are 5 mature leaves. The total leaf area of a Phalaenopsis orchids with five leaves is
Atot = A5 + A4 + A3 + A2 + A1 = K (L5W5) (1 + ab + a2b2 + a3b3 + a4b4)
This equation is called the bottom model. That is, the total leaf area is calculated with the bottom leaf area.
If the top leaf (A1) serves as the basic leaf to calculate the total leaf area,
Atot = K ( L 1 W 1 ) ( 1 + 1 ab + ( 1 ab ) 2 + ( 1 ab ) 3 + ( 1 ab ) 4 )
This equation is called the top model.

4.2. Testing Materials

This experiment was performed in a commercial orchid nursery, Taida Orchids Company (Dacun, Changhua county, Taiwan). Five commercial varieties were studied. These were amabilis, Dtps. Sin-Yuan beauty (Sin-Yuan), Phal. Ruey Lish beauty (Ruey Lish), Ishin KHM1095 (KHM-1095), and the Sogo Co. Ltd. F1091 variety (Sogo F1091). All orchids were cultivated in 12 cm pots and had at least 5 mature leaves. The plant and flower styles of these Phalaenopsis varieties are listed in Table 4. There were thirty-one samples for each variety. Each sample had five mature leaves.

4.3. Measurement of Leaf Characteristics

Before starting the measurements, the leaves were detached from the plants. The leaf and maximum widths were measured with a digital vernier caliper (CARMA, Taipei, Taiwan). The resolution was 0.01 mm, and the accuracy was 0.1 mm. The leaf areas were measured with a Li-300A area meter (LI-COR, Inc., Lincoln, NE, USA). The resolution of this meter was 1 min2. The accuracy was 1% for samples smaller than 50 cm2 after calibrating.

4.4. Data Analysis

This experiment used Sigmaplot version 13.0 (SPSS Inc., Chicago, IL, USA) and EXCEL 2007 (Microsoft® Office Excel 2007) for statistical analyses. For each leaf characteristic in each treatment, an analysis of variance was used to test whether there were significant differences between the various positions or varieties.
If a significant difference was found, post hoc tests were used to determine the differences between the treatments.
Before the ANOVA tests, a homogeneous test was performed to test whether the amount of variation between the treatments was equal. If the variance was equal, Tukey’s test was used for the post hoc test.

4.5. Model Evaluation

To evaluate the predictive abilities of the two models, the predicted total leaf area values of the models and the actual measured values were compared. The difference between the predicted value of a model and the measured value is termed the error. The criteria for comparison were the maximum error, emax; the minimum error, emin; and the average sum of absolute errors, | e | ave.
ei = predictive value–measured value
| e | ave = | e i | / n

5. Conclusions

In this study, the lengths, widths, and areas of Phalaenopsis leaves were measured to study the growth characteristics. The allometry of the total leaf area was modeled and validated. Five Phalaenopsis varieties were used. All samples had five mature leaves excluding the cotyledons. Sequential leaves’ lengths, widths, and areas were measured, and then the length, width, and area ratios were calculated. Two models, the top and bottom models, were developed to calculate the total leaf areas using the top leaf area or bottom leaf area as the parameter.
The results indicate no significant differences could be found for the length ratios, width ratios, and area ratios in the same variety. However, significant differences were found for these leaf characteristics between different varieties. The growth characteristics could be evaluated with the measurement of the leaf lengths, widths, and areas. The observation of leaf growth characteristics could be used to evaluate the growth of Phalaenopsis. The measurement data obtained during a period of quality control work could be compared with the previous standard values of this variety. The management of microclimate factors and fertilization techniques could be modified if necessary.
Compared with the predictive criteria of the two models, the top model calculated with the top leaf area has a better predictive ability than that of the bottom model calculated with the lowest leaf area. From a practical viewpoint, the top leaf area is easier to measure. The sample number of thirty leaves is reasonable to ensure the accuracy of the total leaf area measurement. With modern sensing techniques, the top areas of many Phalaenopsis leaves can be measured easily. The total leaf areas of orchids can be calculated easily. This index could then be used for greenhouse management. This technique could be employed in the standard operating procedure (SOP) of greenhouse management.
Future studies could include validating this total leaf model for more varieties of Phalaenopsis and other crops. This total leaf area model will be incorporated into the decision model for a study on smart orchid production. The relationship between the total leaf area and the quantity and quality of flowers in Phalaenopsis will be studied to ensure the applicability of this total leaf area model.

Author Contributions

Conceptualization, J.C. and C.C.; methodology, C.C.; software, C.C.; validation, J.C. and C.C.; formal analysis, J.C.; investigation, C.C.; resources, C.C.; data curation, J.C.; writing—original draft preparation, J.C.; writing—review and editing, C.C.; visualization, J.C.; supervision, C.C.; project administration, C.C.; funding acquisition, C.C. All authors have read and agreed to the published version of the manuscript.

Funding

This research received no external funding.

Data Availability Statement

Not applicable.

Acknowledgments

The authors would like to thank the Ministry of Science and Technology of the Republic of China for supporting this research under contract no. MOST-109-2313-B-005-038.

Conflicts of Interest

The authors declare no conflict of interest.

References

  1. Paradiso, R.; De Pascale, S. Effects of plant size, temperature, and light intensity on flowering of Phalaenopsis hybrids in Mediterranean greenhouses. Sci. World J. 2014, 2014, 420807. [Google Scholar] [CrossRef] [PubMed]
  2. Chen, C. The Fundamental issue in the Phalaenopsis industry in the Netherlands. J. Agric. For. 2020, 67, 89–100. [Google Scholar]
  3. Anthura, B.V.; Bureau, I.M.A.C.; Bleiswijk, B.V. Cultivation Guide Phalaenopsis: Knowledge for Professionals; Anthura: Bleiswijk, The Netherlands, 2005. [Google Scholar]
  4. Hew, C.S.; Yong, J.W. Physiology of Tropical Orchids in Relation to the Industry; The World Scientific Publishing Company: Singapore, 2004. [Google Scholar]
  5. Lemaire, G.; Sinclair, T.; Sadras, V.; Bélanger, G. Allometric approach to crop nutrition and implications for crop diagnosis and phenotyping. A review. Agron. Sustain. Dev. 2019, 39, 27. [Google Scholar] [CrossRef]
  6. Shi, P.; Niinemets, Ü.; Hui, C.; Niklas, K.J.; Yu, X.; Hölscher, D. Leaf bilateral symmetry and the scaling of the perimeter vs. the surface area in 15 vine species. Forests 2020, 11, 246. [Google Scholar] [CrossRef]
  7. Fanourakis, D.; Kazakos, F.; Nektarios, P.A. Allometric individual leaf area estimation in chrysanthemum. Agronomy 2021, 11, 795. [Google Scholar] [CrossRef]
  8. Colchado-López, J.; Cervantes, R.C.; Rosas, U. A linear model to describe branching and allometry in root architecture. Plants 2019, 8, 218. [Google Scholar] [CrossRef]
  9. Feng, J.Q.; Zhang, F.P.; Huang, J.L.; Hu, H.; Zhang, S.B. Allometry between vegetative and reproductive traits in orchids. Front. Plant Sci. 2021, 12, 728843. [Google Scholar] [CrossRef]
  10. Mantovani, A. Size dependent allocation to vegetative and reproductive organs of the orchid Lankesterella ceracifolia (Spiranthinae). Lankesteriana Int. J. Orchidol. 2022, 22, 225–240. [Google Scholar] [CrossRef]
  11. Lawless, C.; Semenov, M.A.; Jamieson, P.D. A wheat canopy model linking leaf area and phenology. Eur. J. Agron. 2005, 22, 19–32. [Google Scholar] [CrossRef]
  12. Lee, H.B.; Jeong, S.J.; Lim, N.H.; An, S.K.; Kim, K.S. Correlation between carbohydrate contents in the leaves and inflorescence initiation in Phalaenopsis. Sci. Hortic. 2020, 265, 109270. [Google Scholar] [CrossRef]
  13. Chen, C.; Lin, R.S. CO2 Uptake patterns in Phalaenopsis amabilis. Afr. J. Agric. Res. 2012, 7, 128–141. [Google Scholar]
  14. Li, Z.; Ji, C.; Liu, J. Leaf area calculating based on digital image. In International Conference on Computer and Computing Technologies in Agriculture; Springer: Boston, MA, USA, 2007; pp. 1427–1433. [Google Scholar]
  15. Faust, J.E.; Heins, R.D. Modeling leaf development of the African violet (Saintpaulia ionantha Wendl.). J. Am. Soc. Hortic. 1993, 118, 747–751. [Google Scholar] [CrossRef]
  16. Okie, J.G. General models for the spectra of surface area scaling strategies of cells and organisms: Fractality, geometric dissimilitude, and internalization. Am. Nat. 2013, 181, 421–439. [Google Scholar] [CrossRef]
  17. Smith, D.D.; Sperry, J.; Adler, F.R. Convergence in leaf size versus twig leaf area scaling: Do plants optimize leaf area partitioning? Ann. Bot. 2017, 119, 447–456. [Google Scholar] [CrossRef]
  18. Schrader, J.; Shi, P.; Royer, D.L.; Peppe, D.J.; Gallagher, R.V.; Li, Y.; Wright, I.J. Leaf size estimation based on leaf length, width and shape. Ann. Bot. 2021, 128, 395–406. [Google Scholar] [CrossRef]
  19. Koyama, K.; Smith, D.D. Scaling the leaf length-times-width equation to predict total leaf area of shoots. Ann. Bot. 2022, 130, 215–230. [Google Scholar] [CrossRef]
  20. Swart, E.D.; Groenwold, R.; Kanne, H.J.; Stam, P.; Marcelis, L.F.; Voorrips, R.E. Non-destructive estimation of leaf area for different plant ages and accessions of Capsicum annuum L. J. Hortic. Sci. Biotechnol. 2004, 79, 764–770. [Google Scholar] [CrossRef]
  21. Shi, P.; Liu, M.; Yu, X.; Gielis, J.; Ratkowsky, D.A. Proportional relationship between leaf area and the product of leaf length and width of four types of special leaf shapes. Forests 2019, 10, 178. [Google Scholar] [CrossRef]
  22. He, J.; Reddy, G.V.; Liu, M.; Shi, P. A general formula for calculating surface area of the similarly shaped leaves: Evidence from six Magnoliaceae species. Glob. Ecol. Conserv. 2020, 23, e01129. [Google Scholar] [CrossRef]
  23. Mazzini, R.B.; Ribeiro, R.V.; Pio, R.M. A simple and non-destructive model for individual leaf area estimation in citrus. Fruits 2010, 65, 269–275. [Google Scholar] [CrossRef]
  24. Yu, X.; Shi, P.; Schrader, J.; Niklas, K.J. Nondestructive estimation of leaf area for 15 species of vines with different leaf shapes. Am. J. Bot. 2020, 107, 1481–1490. [Google Scholar] [CrossRef]
  25. Chen, C.; Lin, R.S. Nondestructive estimation of dry-weight and leaf area of Phalaenopsis leaves. Appl. Eng. Agric. 2004, 20, 467–472. [Google Scholar] [CrossRef]
  26. Ogawa, K.; Furukawa, A.; Hagihara, A.; Abdullah, A.M.; Awang, M. Morphological and phenological characteristics of leaf development of Durio zibethinus Murray (Bombacaceae). J. Plant Res. 1995, 108, 511–515. [Google Scholar] [CrossRef]
  27. Sun, J.; Wang, M.; Lyu, M.; Niklas, K.J.; Zhong, Q.; Li, M.; Cheng, D. Stem and leaf growth rates define the leaf size vs. number trade-off. AoB Plants 2019, 11, plz063. [Google Scholar] [CrossRef]
  28. Sun, J.; Wang, M.; Lyu, M.; Niklas, K.J.; Zhong, Q.; Li, M.; Cheng, D. Stem diameter (and not length) limits twig leaf biomass. Front. Plant Sci. 2019, 10, 185. [Google Scholar] [CrossRef]
  29. Koyama, K.; Hidaka, Y.; Ushio, M. Dynamic scaling in the growth of a non-branching plant, Cardiocrinum cordatum. PLoS ONE 2012, 7, e45317. [Google Scholar] [CrossRef]
  30. Teobaldelli, M.; Rouphael, Y.; Gonnella, M.; Buttaro, D.; Rivera, C.M.; Muganu, M.; Basile, B. Developing a fast and accurate model to estimate allometrically the total shoot leaf area in grapevines. Sci. Hortic. 2020, 259, 108794. [Google Scholar] [CrossRef]
  31. Lopes, C.; Pinto, P. Easy and accurate estimation of grapevine leaf area with simple mathematical models. Vitis 2005, 44, 55–61. [Google Scholar]
  32. Liao, M.S.; Chen, S.F.; Chou, C.Y.; Chen, H.Y.; Yeh, S.H.; Chang, Y.C.; Jiang, J.A. On precisely relating the growth of Phalaenopsis leaves to greenhouse environmental factors by using an IoT-based monitoring system. Comput. Electron. Agric. 2017, 136, 125–139. [Google Scholar] [CrossRef]
  33. Gary, C.; Jones, J.W.; Tchamitchian, M. Crop modelling in horticulture: State of the art. Sci. Hortic. 1998, 74, 3–20. [Google Scholar] [CrossRef]
  34. Thornley, J.H.; Johnson, I.R. Plant and Crop Modelling; Clarendon: Oxford, UK, 1990. [Google Scholar]
  35. van Tongerlo, E.; van Ieperen, W.; Dieleman, J.A.; Marcelis, L.F.M. Vegetative traits can predict flowering quality in Phalaenopsis orchids despite large genotypic variation in response to light and temperature. PLoS ONE 2021, 6, e0251405. [Google Scholar] [CrossRef] [PubMed]
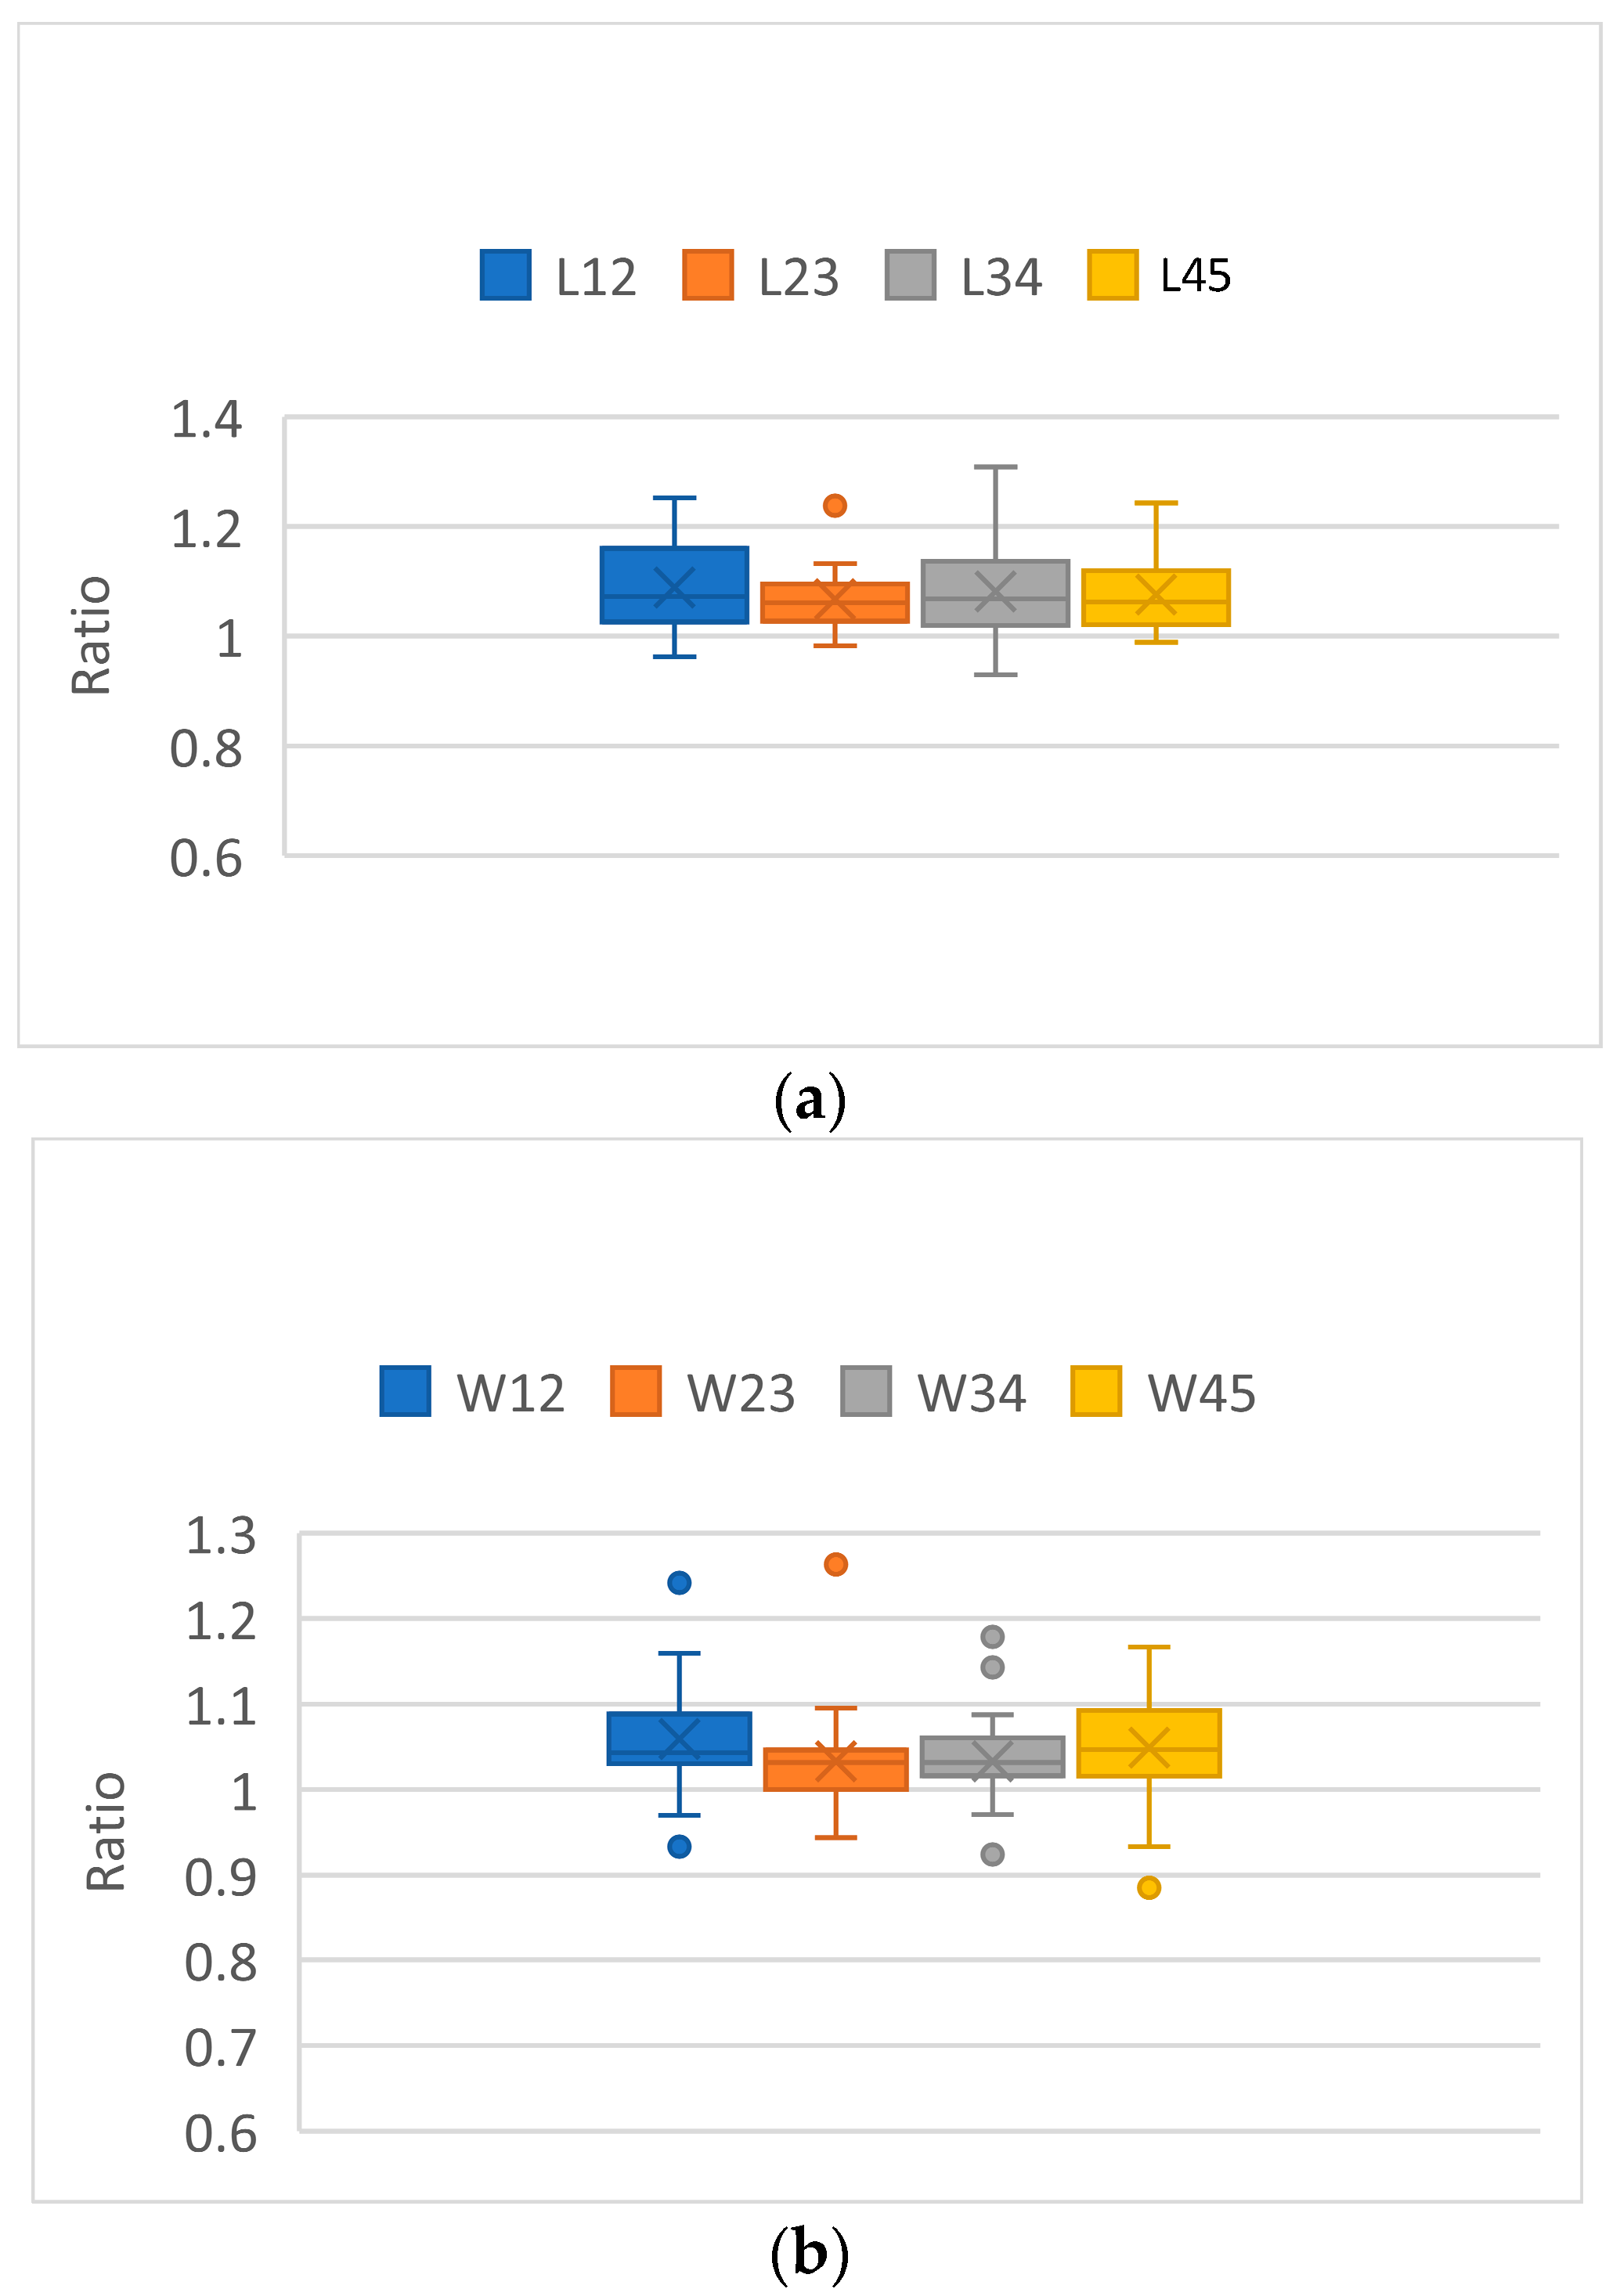
Figure 1. The leaf length, width, and area ratios for amabilis. No significant differences could be found. There are no significant differences between the four ratios in the different leaves. (a) Length ratios (L12 is the ratio between no. 1 leaf length to no. 2 leaf length, etc.). (b) Width ratios (W12 is the ratio between no. 1 leaf width to no. 2 leaf width, etc.). (c) Area ratios (R12 is the ratio between no. 1 leaf area to no. 2 leaf area, etc.). The colored circles showed some extreme measurement values.
Plants 12 02031 g001aPlants 12 02031 g001b
Figure 2. The ratios of leaf length for five Phalaenopsis varieties. Means followed by the same letter are not significantly different (p < 0.05; Tukey’s multiple comparison tests). The letters a, b, and c represent whether there is a significant difference. The colored circles showed some extreme measurement values.
Plants 12 02031 g002
Figure 3. The ratios of leaf width for five Phalaenopsis varieties. Means followed by the same letter are not significantly different (p < 0.05; Tukey’s multiple comparison tests). The letters a, b, and c represent whether there is a significant difference. The colored circles showed some extreme measurement values.
Plants 12 02031 g003
Figure 4. The area ratios for five Phalaenopsis varieties. Means followed by the same letter are not significantly different (p < 0.05; Tukey’s multiple comparison tests). The letters a, b, and c represent whether there is a significant difference. The colored circles showed some extreme measurement values.
Plants 12 02031 g004
Figure 5. The relationship between the measured values and the predicted total leaf areas using the top and bottom models for amabilis. A solid line represents a 1:1 relationship. The correlation analysis result between the top model values and the measured values is 0.9968 (p < 0.001), and the correlation analysis result between the bottom model values and the measured values is 0.9955 (p < 0.001).
Plants 12 02031 g005
Figure 6. The relationship between the measured values and the predicted total leaf areas using the top and bottom models for Rey Lish. A solid line represents a 1:1 relationship. The correlation analysis result between the top model values and the measured values is 0.9970 (p < 0.001), and the correlation analysis result between the bottom model values and the measured values is 0.9931 (p < 0.001).
Plants 12 02031 g006
Figure 7. The relationship between the measured values and the predicted total leaf areas using the top and bottom models for Sogo F1091. A solid line represents a 1:1 relationship. The correlation analysis result between the top model values and the measured values is 0.9962 (p < 0.001), and the correlation analysis result between the bottom model values and the measured values is 0.9956 (p < 0.001).
Plants 12 02031 g007
Figure 8. Diagram of Phalaenopsis leaves.
Plants 12 02031 g008
Table 1. Statistics for the total leaf areas of five Phalaenopsis varieties.
AmabilisSin YuanRey LishKHM1095Sogo F1091
Mean265.34414.56478.04577.61419.82
S.D.4.117.7211.8413.066.86
Minimum222.59329.52383.42429.15325.41
Maximum333.85478.73645.53734.36528.95
S.D.: standard deviation.
Table 2. Statistical results of the prediction errors for two total leaf area models of five varieties.
AmabilisSin YuanRey LishKHM 1095Sogo F1091
Top model
      e m i n −39.68−98.01−87.22−66.3−64.47
      e m a x 35.0735.1857.0537.5468.84
| e | ave19.1523.3332.4822.2530.79
Bottom model
e m i n −50.74−128.1−81.52−107.05−71.15
  e m a x 55.4465.5133.51106.68102.71
| e | ave21.1324.1948.1545.9432.91
Table 3. Effects of test numbers of samples on the prediction performance for total leaf area.
AmabilisSin YuanRey LishKHM 1095Sogo F1091
N = 10Area277.92
(100%)
415.97505.51569.62419.03
Top model292.99
(5.4%)
421.38
(1.3%)
474.93
(−5.9%)
540.69
(−5.1%)
402.80
(−4.0%)
Bottom model269.88
(−2.9%)
405.15
(−2.6%)
524.2
(3.7%)
607.53
(6.7%)
428.74
(2.3%)
N = 20Area274.83
(100%)
414.56480.20574.14410.77
Top model279.83
(1.8%)
417.88
(0.8%)
470.80
(−1.9%)
559.17
(−2.6%)
404.40
(−1.6%)
Bottom model270.08
(−1.7%)
407.10
(−1.8%)
483.13
(0.6%)
583.95
(1.7%)
414.5
(0.9%)
N = 30Area265.34
(100%)
413.14478.04577.60419.82
Top model260.61
(0.4%)
411.95
(−0.3%)
470.08
(−1.7%)
582.33
(0.8%)
414.60
(−1.2%)
Bottom model269.94
(1.7%)
409.66
(−0.8%)
484.10
(1.3%)
570.93
(−1.1%)
424.14
(1.0%)
Table 4. Plant and flower styles of the five Phalaenopsis orchid varieties.
AmabilisSin YuanRey LishKHM1095Sogo F-1091
Plant height (cm)4050707040
Flower size (cm)4.57.510.510.04.5
Flower colorWhiteYellow with red lipRedRedPink
Disclaimer/Publisher’s Note: The statements, opinions and data contained in all publications are solely those of the individual author(s) and contributor(s) and not of MDPI and/or the editor(s). MDPI and/or the editor(s) disclaim responsibility for any injury to people or property resulting from any ideas, methods, instructions or products referred to in the content.