
Analysis of Nutrient-Specific Response of Maize Hybrids in Relation to Leaf Area Index (LAI) and Remote Sensing

 ,
,  ,
,  ,
,  ,
, 


Abstract
1. Introduction
2. Results
3. Discussion
4. Materials and Methods
5. Conclusions
Author Contributions
Funding
Institutional Review Board Statement
Informed Consent Statement
Data Availability Statement
Conflicts of Interest
Ethics Approval and Consent to Participate
References
- Chaudhary, A.H. Effect of population and control of weeds with herbicides in maize. Field Crop Abstr. 1983, 35, 403. [Google Scholar]
- Buschmann, C.; Nagel, E. In vivo spectroscopy and internal optics of leaves as basis for remote sensing of vegetation. Int. J. Remote Sens. 1993, 14, 711–722. [Google Scholar] [CrossRef]
- Gitelson, A.A.; Merzlyak, M.N. Quantitative estimation of chlorophyll a using reflectance spectra: Experiments with autumn chestnut and maple leaves. J. Photochem. Photobiol. B Biol. 1994, 22, 247–252. [Google Scholar] [CrossRef]
- Hay, K.M.R.; Walker, A.J. An Introduction to the Physiology of Crop Yield; Longman Scientific & Technical: Essex, UK, 1989. [Google Scholar]
- Murphy, S.D.; Yakubu, Y.; Weise, S.F.; Swanton, C.J. Effect of planting patterns and inter-row cultivation on competition between corn (Zea mays) and late emerging weeds. Weed Sci. 1996, 44, 865–870. [Google Scholar] [CrossRef]
- Valadabadi, S.A.; Farahani, H.A. Effects of planting density and pattern on physiological growth indices in maize (Zea mays L.) under nitrogenous fertilizer application. J. Agric. Ext. Rural Dev. 2010, 2, 40–47. [Google Scholar]
- Haghighi, B.J.; Yarmahmodi, Z.; Alizadeh, O. Evaluation the effects of biological fertilizer on physiological characteristic and yield and its components of corn (Zea mays L.) under drought stress. Am. J. Agric. Biol. Sci. 2010, 5, 189–193. [Google Scholar] [CrossRef][Green Version]
- Hammad, H.M.; Ahmad, A.A.; Wajid, A.; Akhter, J. Maize response to time and rate of nitrogen application. Pak. J. Bot. 2011, 43, 1935–1942. [Google Scholar]
- Lemcoff, J.H.; Loomis, R.S. Nitrogen Influences on Yield Determination in Maize. Crop Sci. 1986, 26, 1017. [Google Scholar] [CrossRef]
- Watson, D.J. Comparative physiological studies on the growth of field crops. II: The effect of varying nutrient supply on net assimilation rate and leaf area. Ann. Bot. 1947, 12, 281–310. [Google Scholar] [CrossRef]
- Uhart, S.A.; Andrade, F.H. Nitrogen deficiency in maize: II. Carbon–nitrogen interaction effects on kernel number and grain yield. Crop Sci. 1995, 35, 1384–1389. [Google Scholar] [CrossRef]
- Moosavi, S.G. The effect of water deficit stress and nitrogen fertilizer levels on morphology traits, yield and leaf area index in maize. Pak. J. Bot. 2012, 44, 1351–1355. [Google Scholar]
- Hokmalipour, S.; Darbandi, M.H. Effects of nitrogen fertilizer on chlorophyll content and other leaf indicate in three cultivars of maize (Zea mays L.). World Appl. Sci. J. 2011, 15, 1780–1785. [Google Scholar]
- Sharanabasappa, H.C.; Basavanneppa, M.A. Influence of plant population and fertilizer levels on growth, yield and quality parameters of quality protein maize (Zea mays L.) in irrigated ecosystem. Int. J. Chem. Stud. 2019, 7, 1425–1429. [Google Scholar]
- Jin, H.; Li, A.; Wang, J.; Bo, Y. Improvement of spatially and temporally continuous crop leaf area index by integration of CERES-Maize model and MODIS data. Eur. J. Agron. 2016, 78, 1–12. [Google Scholar] [CrossRef]
- Fageria, N.K.; Baligar, V.C.; Clark, R.B. Physiology of Crop Production; Haworth Press: New York, NY, USA, 2006. [Google Scholar]
- Elings, A. Estimation of leaf area in tropical maize. Agron. J. 2000, 92, 436–444. [Google Scholar] [CrossRef]
- Sumi, A.; Ketayama, T.C. Effect of nitrogen fertilizer application and solar radiation on the growth response of sorghum seedling to soil moisture. Jpn. J. Crop Sci. 2000, 69, 513–519. [Google Scholar] [CrossRef]
- Birch, C.J.; Hammer, G.L.; Rickert, K.G. Improved Methods for Predicting Individual Leaf Area and Leaf Senescence in Maize (Zea mays L). Aust. J. Agric. Res. 1998, 49, 249–262. [Google Scholar] [CrossRef]
- Setiyono, T.D.; Weiss, A.; Specht, J.; Bastidas, A.M.; Cassman, K.G.; Dobermann, A. Understanding and modeling the effect of temperature and daylength on soybean phenology under high-yield conditions. Field Crops Res. 2007, 100, 257–271. [Google Scholar] [CrossRef]
- Monteith, J.L. Climate and the efficiency of crop production in Britain. Philos. Trans. R. Soc. Lond. Ser. B 1977, 281, 277–294. [Google Scholar]
- Lukeba, J.C.L.; Vumilia, R.K.; Nkongolo, K.C. Growth and leaf area index simulation in maize (Zea mays L.) under small-scale farm conditions in a Sub-Saharan African Region. Am. J. Plant Sci. 2013, 4, 575–583. [Google Scholar] [CrossRef]
- Song, B.; Wu, S.L.; Yu, S.H.; Chen, F.; Xu, L.; Fan, W.B.A. Study on Population Quality Indexes of Maize under Different Ecological Condition. Tillage Cultiv. 1998, 7, 23–28. [Google Scholar]
- Novoa, R.; Loomis, R.S. Nitrogen and plant production. Plant Soil 1981, 58, 177–204. [Google Scholar] [CrossRef]
- Puntel, L.A. Field Characterization of Maize Photosynthesis Response to Light and Leaf Area Index under Different Nitrogen Levels: A Modeling Approach. Ph.D. Thesis, Iowa State University, Ames, IA, USA, 2012. [Google Scholar]
- Pokovai, K.; Fodor, N. Adjusting ceptometer data to improve leaf area index measurements. Agronomy 2019, 9, 866. [Google Scholar] [CrossRef]
- Grindlay, D.J.C. Towards an explanation of crop nitrogen demand based on the optimization of leaf nitrogen per unit leaf area. J. Agric. Sci. 1997, 128, 377–396. [Google Scholar] [CrossRef]
- Williams, W.A.; Loomis, R.S.; Duncan, W.G.; Dovrat, A.; Nunez, F.A. Canopy Architecture at Various Population Densities and the Growth and Grain Yield of Corn. Crop Sci. 1968, 8, 303–308. [Google Scholar] [CrossRef]
- Hejazi, P.; Mousavi, S.M.N.; Mostafavi, K.; Ghomshei, M.S.; Hejazi, S.; Mousavi, S.M.N. Study on hybrids maize response for drought tolerance index. Adv. Environ. Biol. 2013, 7, 333–338. [Google Scholar]
- Subedi, K.D.; Ma, B.L. Ear position, leaf area, and contribution of individual leaves to grain yield in conventional and leafy maize hybrids. Crop Sci. 2005, 45, 2246–2257. [Google Scholar] [CrossRef]
- Széles, A.; Nagy, J.; Rátonyi, T.; Harsányi, E. Effect of differential fertilisation treatments on maize hybrid quality and performance under environmental stress condition in Hungary. Maydica 2019, 64, 14. [Google Scholar]
- Horváth, É.; Gombos, B.; Széles, A. Evaluation phenology, yield and quality of maize genotypes in drought stress and non-stress environments. Agron. Res. 2021, 2, 408–422. [Google Scholar] [CrossRef]
- Jovanović, D.; Govedarica, M.; Rašić, D. Remote sensing as a trend in agriculture. Res. J. Agric. Sci. 2014, 46, 32–37. [Google Scholar]
- Yao, X.; Huang, Y.; Shang, G.; Zhou, C.; Cheng, T.; Tian, Y.; Cao, W.; Zhu, Y. Evaluation of six algorithms to monitor wheat leaf nitrogen concentration. Remote Sens. 2015, 7, 14939–14966. [Google Scholar] [CrossRef]
- Jaafar, H.H.; Ahmad, F.A. Crop yield prediction from remotely sensed vegetation indices and primary productivity in arid and semi-arid lands. Int. J. Remote Sens. 2015, 36, 4570–4589. [Google Scholar] [CrossRef]
- Thomason, W.E.; Phillips, S.B.; Raymond, F.D. Defining useful limits for spectral reflectance measures in corn. J. Plant Nutr. 2007, 30, 1263–1277. [Google Scholar] [CrossRef]
- Han, L.; Yang, G.; Yang, H.; Xu, B.; Li, Z.; Yang, X. Clustering field-based maize phenotyping of plant-height growth and canopy spectral dynamics using a UAV remote-sensing approach. Front. Plant Sci. 2018, 9, 1638. [Google Scholar] [CrossRef]
- Guan, S.; Fukami, K.; Matsunaka, H.; Okami, M.; Tanaka, R.; Nakano, H.; Sakai, T.; Nakano, K.; Ohdan, H.; Takahashi, K. Assessing Correlation of High-Resolution NDVI with Fertilizer Application Level and Yield of Rice and Wheat Crops Using Small UAVs. Remote Sens. 2019, 11, 112. [Google Scholar] [CrossRef]
- Rouse, J.W.; Haas, R.H.; Schell, J.A.; Deering, D.W. Monitoring the Vernal Advancement and Retrogradation (Green Wave Effect) of Natural Vegetation; No. NASA-CR-132982; NASA: Washington, DC, USA, 1973. [Google Scholar]
- Duan, T.; Chapman, S.C.; Guo, Y.; Zheng, B. Dynamic monitoring of NDVI in wheat agronomy and breeding trials using an unmanned aerial vehicle. Field Crops Res. 2017, 210, 71–80. [Google Scholar] [CrossRef]
- Potgieter, A.B.; George-Jaeggli, B.; Chapman, S.C.; Laws, K.; Cadavid, L.A.S.; Wixted, J.; Watson, J.; Eldridge, M.; Jordan, D.R.; Hammer, G.L. Multi-spectral imaging from an unmanned aerial vehicle enables the assessment of seasonal leaf area dynamics of sorghum breeding lines. Front. Plant Sci. 2017, 8, 1532. [Google Scholar] [CrossRef]
- Zhang, Y.; Han, W.; Niu, X.; Li, G. Maize crop coefficient estimated from UAV-measured multispectral vegetation indices. Sensors 2019, 19, 5250. [Google Scholar] [CrossRef]
- Burke, M.; Lobell, D.B. Satellite-based assessment of yield variation and its determinants in smallholder African systems. Proc. Natl. Acad. Sci. USA 2017, 114, 2189–2194. [Google Scholar] [CrossRef]
- Swain, K.C.; Thomson, S.J.; Jayasuriya, H.P.W. Adoption of an unmanned helicopter for low-altitude remote sensing to estimate yield and total biomass of a rice crop. Am. Soc. Agric. Biol. Eng. 2010, 53, 21–27. [Google Scholar]
- Zaman-Allah, M.; Vergara, O.; Araus, J.L.; Tarekegne, A.; Magorokosho, C.; Zarco-Tejada, P.J.; Hornero, A.; Albà, A.H.; Das, B.; Craufurd, P.; et al. Unmanned aerial platform-based multi-spectral imaging for field phenotyping of maize. Plant Methods 2015, 11, 35. [Google Scholar] [CrossRef] [PubMed]
- Shi, Y.; Thomasson, J.A.; Murray, S.C.; Pugh, N.A.; Rooney, W.L.; Shafian, S.; Yang, C. Unmanned aerial vehicles for high-throughput phenotyping and agronomic research. PLoS ONE 2017, 11, e0159781. [Google Scholar] [CrossRef] [PubMed]
- Amanullah, M.J.H.; Nawab, K.; Ali, A. Response of specific leaf area (SLA), leaf area index (LAI) and leaf area ratio (LAR) of maize (Zea mays L.) to plant density, rate and timing of nitrogen application. World Appl. Sci. J. 2007, 2, 235–243. [Google Scholar]
- Bavec, F.; Bavec, M. Effects of plant population on leaf area index, cob characteristics and grain yield of early maturing maize cultivars (FAO 100–400). Eur. J. Agron. 2002, 16, 151–159. [Google Scholar] [CrossRef]
- Eltelib, H.A.; Hamad, M.A.; Ali, E.E. The effect of nitrogen and phosphorus fertilization on growth, yield and quality of forage maize (Zea mays L.). J. Agron. 2006, 5, 515–518. [Google Scholar]
- Jasemi, M.; Darabi, F.; Naseri, R.; Naserirad, H.; Bazdar, S. Effect of planting date and nitrogen fertilizer application on grain yield and yield components in maize (SC 704). Am. Eurasian J. Agric. Environ. Sci. 2013, 13, 914–919. [Google Scholar]
- Kanning, M.; Kühling, I.; Trautz, D.; Jarmer, T. High-resolution UAV-based hyperspectral imagery for LAI and chlorophyll estimations from wheat for yield prediction. Remote Sens. 2018, 10, 2000. [Google Scholar] [CrossRef]
- Cui, B.; Zhao, Q.; Huang, W.; Song, X.; Ye, H.; Zhou, X. A new integrated vegetation index for the estimation of winter wheat leaf chlorophyll content. Remote Sens. 2019, 11, 974. [Google Scholar] [CrossRef]
- Mousavi, S.M.N.; Illés, Á.; Bojtor, C.; Nagy, J. The impact of different nutritional treatments on maize hybrids morphological traits based on stability statistical methods. Emir. J. Food Agric. 2020, 11, 666–672. [Google Scholar] [CrossRef]
- Illes, A.; Bojtor, C.; Szeles, A.; Mousavi, S.M.N.; Toth, B.; Nagy, J. Analyzing the effect of intensive and low-input agrotechnical support for the physiological, phenometric, and yield parameters of different maize hybrids using multivariate statistical methods. Int. J. Agron. 2021, 2021, 6682573. [Google Scholar] [CrossRef]
- Zhao, B.; Ata-Ul-Karim, S.T.; Duan, A.; Liu, Z.; Wang, X.; Xiao, J.; Lian, Y. Determination of critical nitrogen concentration and dilution curve based on leaf area index for summer maize. Field Crops Res. 2018, 228, 195–203. [Google Scholar] [CrossRef]
- Lykhovyd, P.V.; Ushkarenko, V.O.; Lavrenko, S.O.; Lavrenko, N.M.; Zhuikov, O.H.; Mrynskyi, I.M.; Didenko, N.O. Leaf area index of sweet corn (Zea mays ssp. saccharata L.) crops depending on cultivation technology in the drip-irrigated conditions of the south of Ukraine. Mod. Phytom. 2019, 13, 1–4. [Google Scholar]
- Mi, G.; Wu, D.; Chen, Y.; Xia, T.; Feng, G.; Li, Q.; Shi, D.F.; Su, X.P.; Gao, Q. The ways to reduce chemical fertilizer input and increase fertilizer use efficiency in maize in Northeast China. Sci. Agric. Sin. 2018, 51, 2758–2770. [Google Scholar]
- Lucas, F.T.; Borges, B.M.M.N.; Coutinho, E.L.M. Nitrogen fertilizer management for maize production under tropical climate. Agron. J. 2019, 111, 2031–2037. [Google Scholar] [CrossRef]
- Abubakar, A.W.; Manga, A.A.; Kamara, A.Y.; Tofa, A.I. Physiological evaluations of maize hybrids under low nitrogen. Adv. Agric. 2019, 2019, 2624707. [Google Scholar] [CrossRef]
- Mousavi, S.M.N.; Bojtor, C.; Illés, Á.; Nagy, J. Genotype by Trait Interaction (GT) in Maize Hybrids on Complete Fertilizer. Plants 2021, 10, 2388. [Google Scholar] [CrossRef]
- Cayrol, P.; Chehbouni, A.; Kergoat, L.; Dedieu, G.; Mordelet, P.; Nouvellon, Y. Grassland modeling and monitoring with SPOT4 VEGETATION instrument during the 1999 SALSA experiment. Agric. For. Meteorol. 2000, 105, 91–115. [Google Scholar] [CrossRef]
- Bojtor, C.; Mousavi, S.M.N.; Illés, Á.; Széles, A.; Nagy, J.; Marton, C.L. Stability and adaptability of maize hybrids for precision crop production in a long-term field experiment in hungary. Agronomy 2021, 11, 2167. [Google Scholar] [CrossRef]
- Li, G.; Zhao, B.; Dong, S.; Zhang, J.; Liu, P.; Lu, W. Controlled-release urea combining with optimal irrigation improved grain yield, nitrogen uptake, and growth of maize. Agric. Water Manag. 2020, 227, 105834. [Google Scholar] [CrossRef]
- Karki, T.B. Yield prediction and nitrogen recommendation in maize using normalized difference vegetation index. Agron. J. Nepal 2013, 3, 82–88. [Google Scholar] [CrossRef]
- Li, F.; Miao, Y.; Feng, G.; Yuan, F.; Yue, S.; Gao, X.; Liu, Y.; Liu, B.; Ustin, S.L.; Chen, X. Improving estimation of summer maize nitrogen status with red edge-based spectral vegetation indices. Field Crops Res. 2014, 157, 111–123. [Google Scholar] [CrossRef]


| Parameters | Source | df | F-Value | p Value |
|---|---|---|---|---|
| Moisture | Hybrid | 6 | 16.49 | 0.000 |
| NPK | 2 | 0.30 | 0.740 | |
| Sampling Date | 3 | 0.90 | 0.443 | |
| LAI | 225 | 1.59 | 0.005 | |
| Protein | Hybrid | 6 | 16.63 | 0.000 |
| NPK | 2 | 64.92 | 0.000 | |
| Sampling Date | 3 | 0.98 | 0.405 | |
| LAI | 225 | 0.96 | 0.593 | |
| Oil | Hybrid | 6 | 9.83 | 0.000 |
| NPK | 2 | 1.11 | 0.335 | |
| Sampling Date | 3 | 0.28 | 0.843 | |
| LAI | 225 | 0.81 | 0.896 | |
| Starch | Hybrid | 6 | 29.64 | 0.000 |
| NPK | 2 | 8.22 | 0.000 | |
| Sampling Date | 3 | 0.61 | 0.609 | |
| LAI | 225 | 0.97 | 0.585 | |
| Yield | Hybrid | 6 | 1.89 | 0.089 |
| NPK | 2 | 26.59 | 0.000 | |
| Sampling Date | 3 | 0.93 | 0.431 | |
| LAI | 225 | 1.01 | 0.493 |
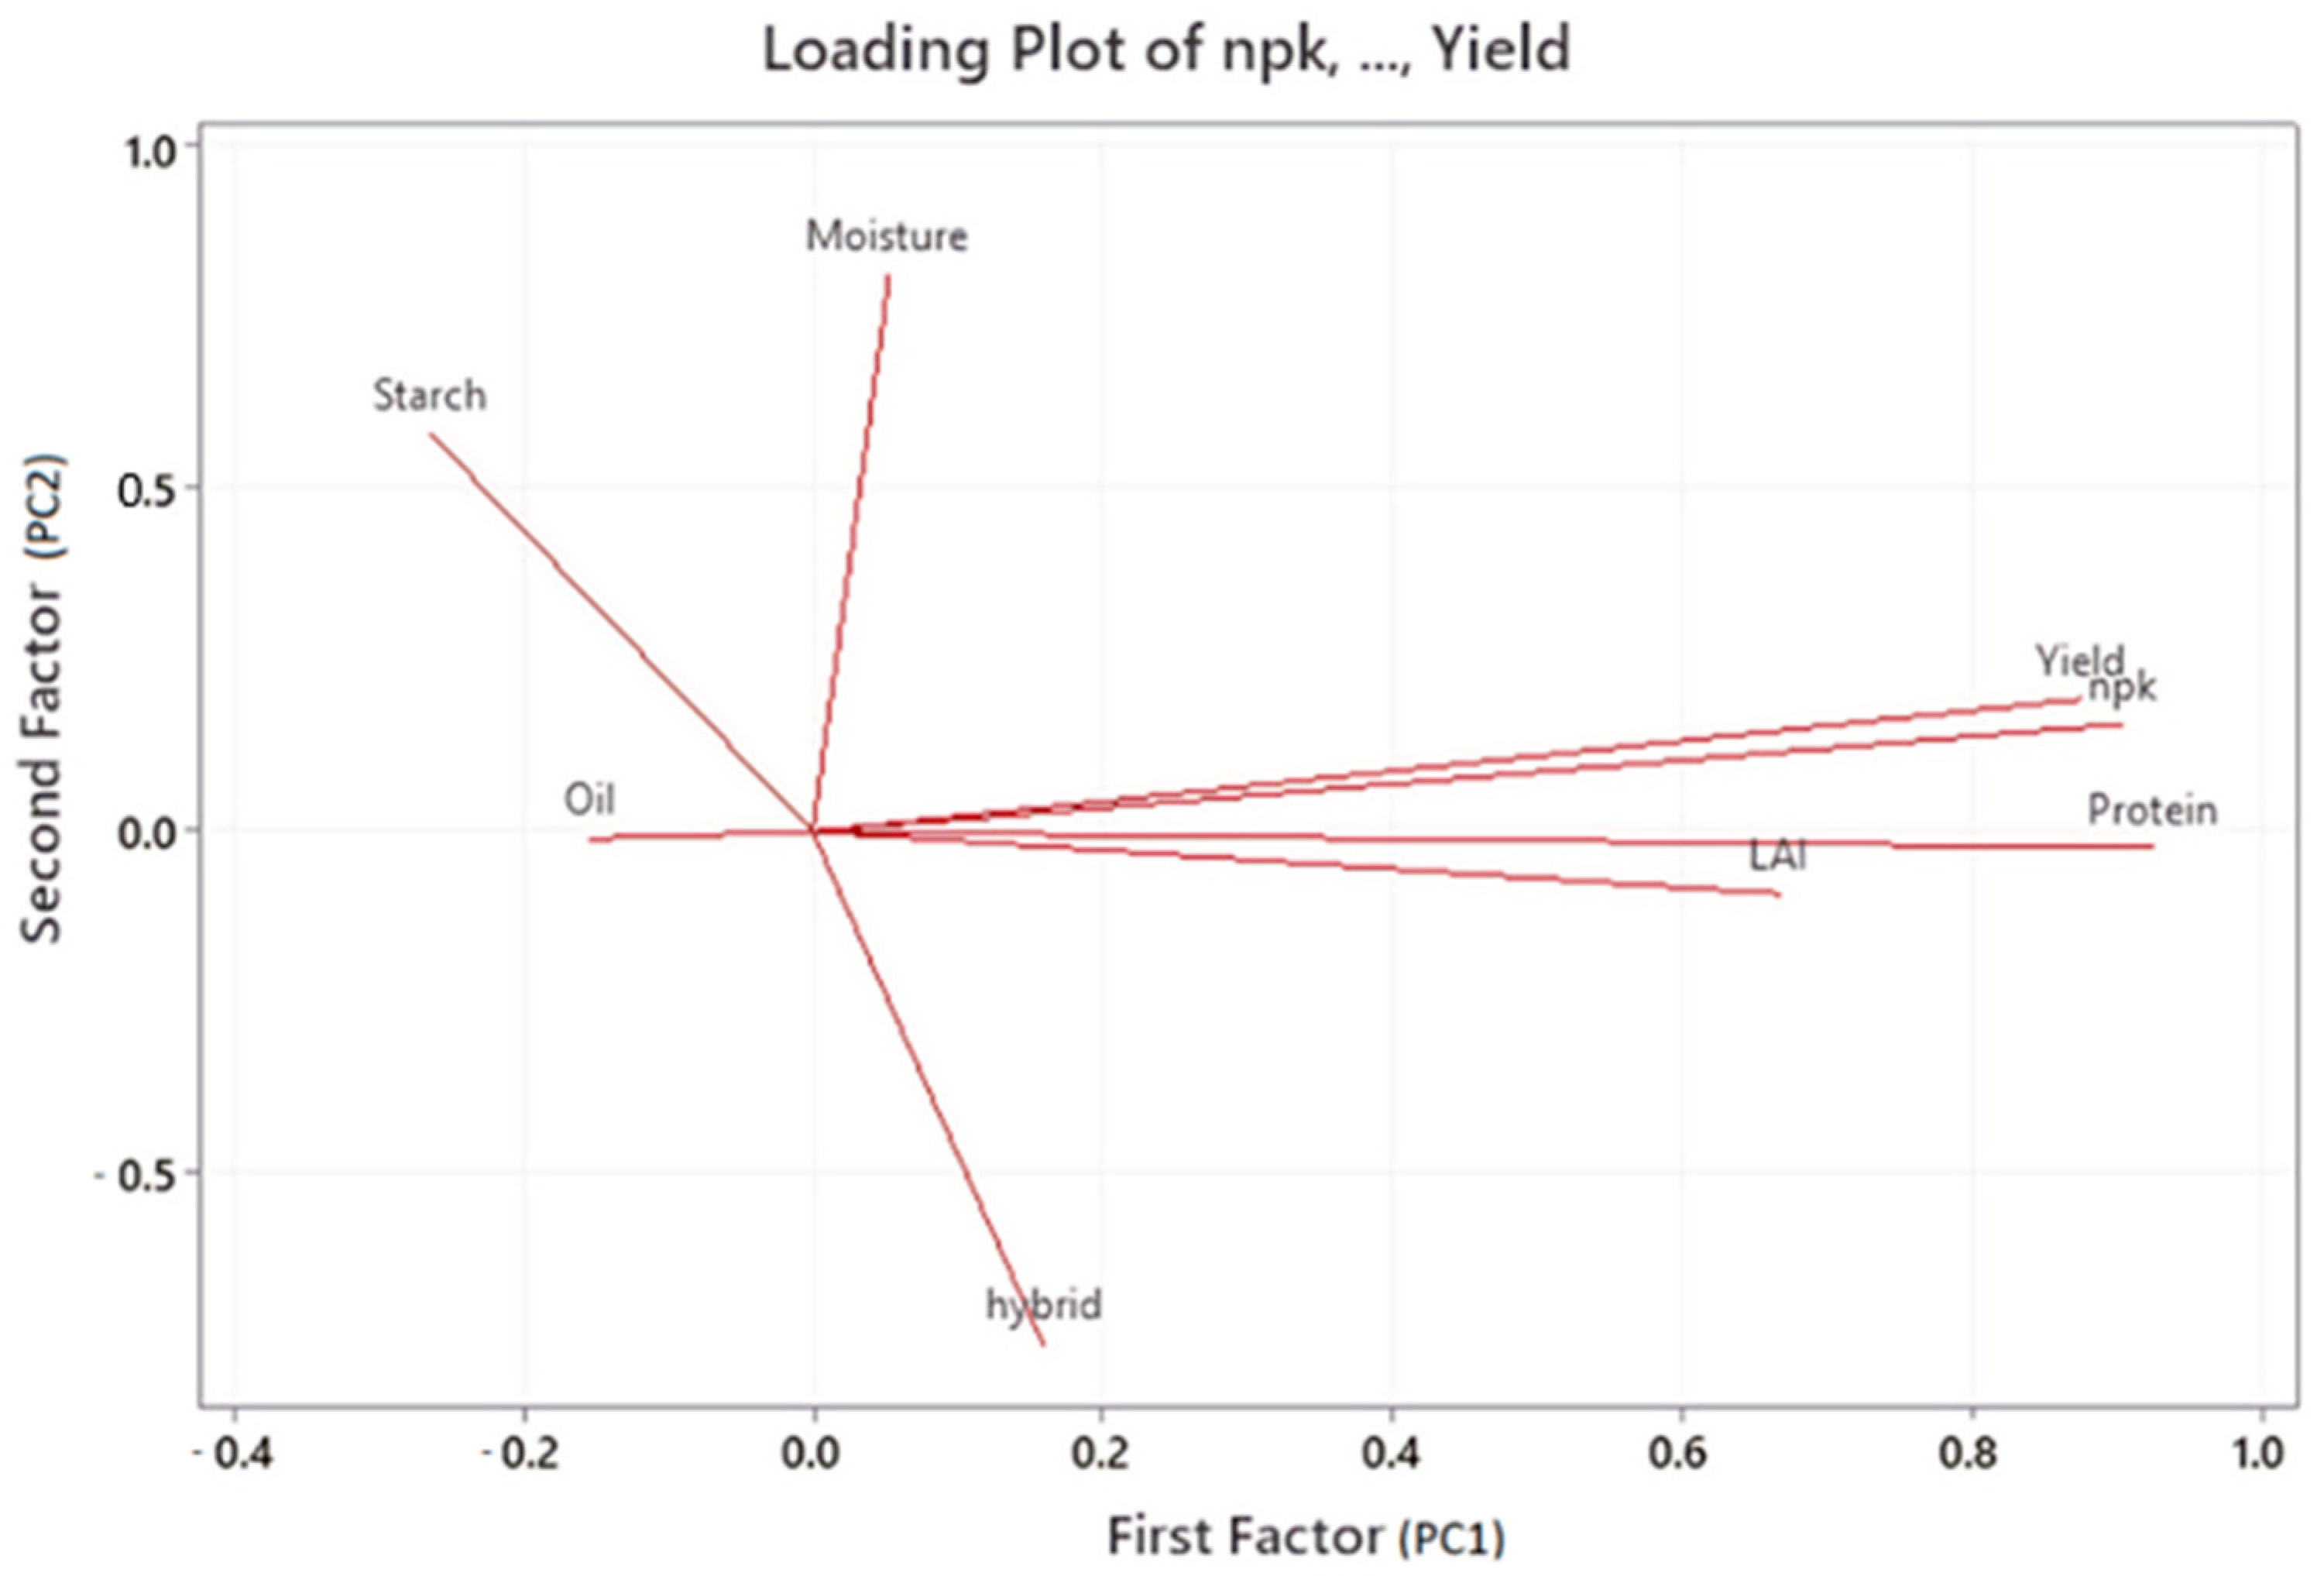
| Variable | Factor 1 | Factor 2 | Factor 3 | Factor 4 | Factor 5 | Communality |
|---|---|---|---|---|---|---|
| NPK | 0.904 | 0.157 | −0.056 | −0.062 | 0.189 | 0.884 |
| hybrid | 0.159 | −0.749 | 0.481 | −0.077 | −0.131 | 0.840 |
| LAI | 0.667 | −0.090 | 0.057 | 0.563 | −0.454 | 0.980 |
| Moisture | 0.053 | 0.812 | 0.032 | −0.321 | −0.435 | 0.955 |
| Protein | 0.927 | −0.024 | −0.070 | −0.253 | 0.061 | 0.933 |
| Oil | −0.154 | −0.010 | −0.898 | 0.271 | 0.031 | 0.904 |
| Starch | −0.264 | 0.582 | 0.574 | 0.410 | 0.247 | 0.969 |
| Yield | 0.876 | 0.193 | 0.015 | 0.108 | 0.217 | 0.863 |
| Variance | 3.0096 | 1.6302 | 1.3792 | 0.7475 | 0.5614 | 7.3278 |
| % Var | 0.376 | 0.204 | 0.172 | 0.093 | 0.070 | 0.916 |
| F-Value | p-Value | Regression Equation | |
|---|---|---|---|
| Yield | 185.72 | 0.000 | Yield = 5868 + 0.01391 NPK − 0.1111 hybrid − 0.1332 sampling date + 1.943 LAI |
| Starch | 5.90 | 0.000 | Starch = 133 − 0.000880 NPK − 0.0498 hybrid − 0.00154 sampling date + 0.0224 LAI |
| Oil | 13.56 | 0.000 | Oil = 109.7 − 0.000332 NPK − 0.02859 hybrid − 0.00242 sampling date + 0.0353 LAI |
| Protein | 208.46 | 0.000 | Protein = 403 + 0.003314 NPK + 0.01192 hybrid − 0.00904 sampling date + 0.1319 LAI |
| Moisture | 20.13 | 0.000 | Moisture = −207 + 0.000893 NPK − 0.07302 hybrid + 0.00511 sampling date − 0.0745 LAI |
| Parameters | r | r2 | Significance |
|---|---|---|---|
| BNDVI–yield | 0.265744238 | 0.07062 | ** |
| BNDVI–oil | 0.092422941 | 0.008542 | NS |
| BNDVI–protein | 0.3591657 | 0.129 | *** |
| BNDVI–starch | 0.145567854 | 0.02119 | NS |
| ENDVI–yield | 0.723187389 | 0.523 | *** |
| ENDVI–oil | 0.079906195 | −0.006385 | NS |
| ENDVI–protein | 0.688694417 | 0.4743 | *** |
| ENDVI–starch | 0.099599197 | −0.00992 | NS |
| GNDVI–yield | 0.617413962 | 0.3812 | *** |
| GNDVI–oil | 0.083486526 | −0.00697 | NS |
| GNDVI–protein | 0.462709412 | 0.2141 | *** |
| GNDVI–starch | 0.110136279 | 0.01213 | NS |
| BNDVI*ENDVI~yield | 0.629046898 | 0.3957 | *** |
| BNDVI*ENDVI~oil | 0.044888751 | −0.002015 | NS |
| BNDVI*ENDVI~protein | 0.629364759 | 0.3961 | *** |
| BNDVI*ENDVI~starch | 0.059472683 | −0.003537 | NS |
| GNDVI*ENDVI~yield | 0.259826865 | 0.06751 | ** |
| GNDVI*ENDVI~oil | 0.106957936 | 0.01144 | NS |
| GNDVI*ENDVI~protein | 0.36 | 0.1296 | *** |
| GNDVI*ENDVI~starch | 0.131529464 | 0.0173 | NS |
| BNDVI*GNDVI*ENDVI~yield | 0.272836948 | 0.07444 | ** |
| BNDVI*GNDVI*ENDVI~oil | 0.099342841 | 0.009869 | NS |
| BNDVI*GNDVI*ENDVI~protein | 0.364142829 | 0.1326 | *** |
| BNDVI*GNDVI*ENDVI~starch | 0.128257553 | 0.01645 | NS |
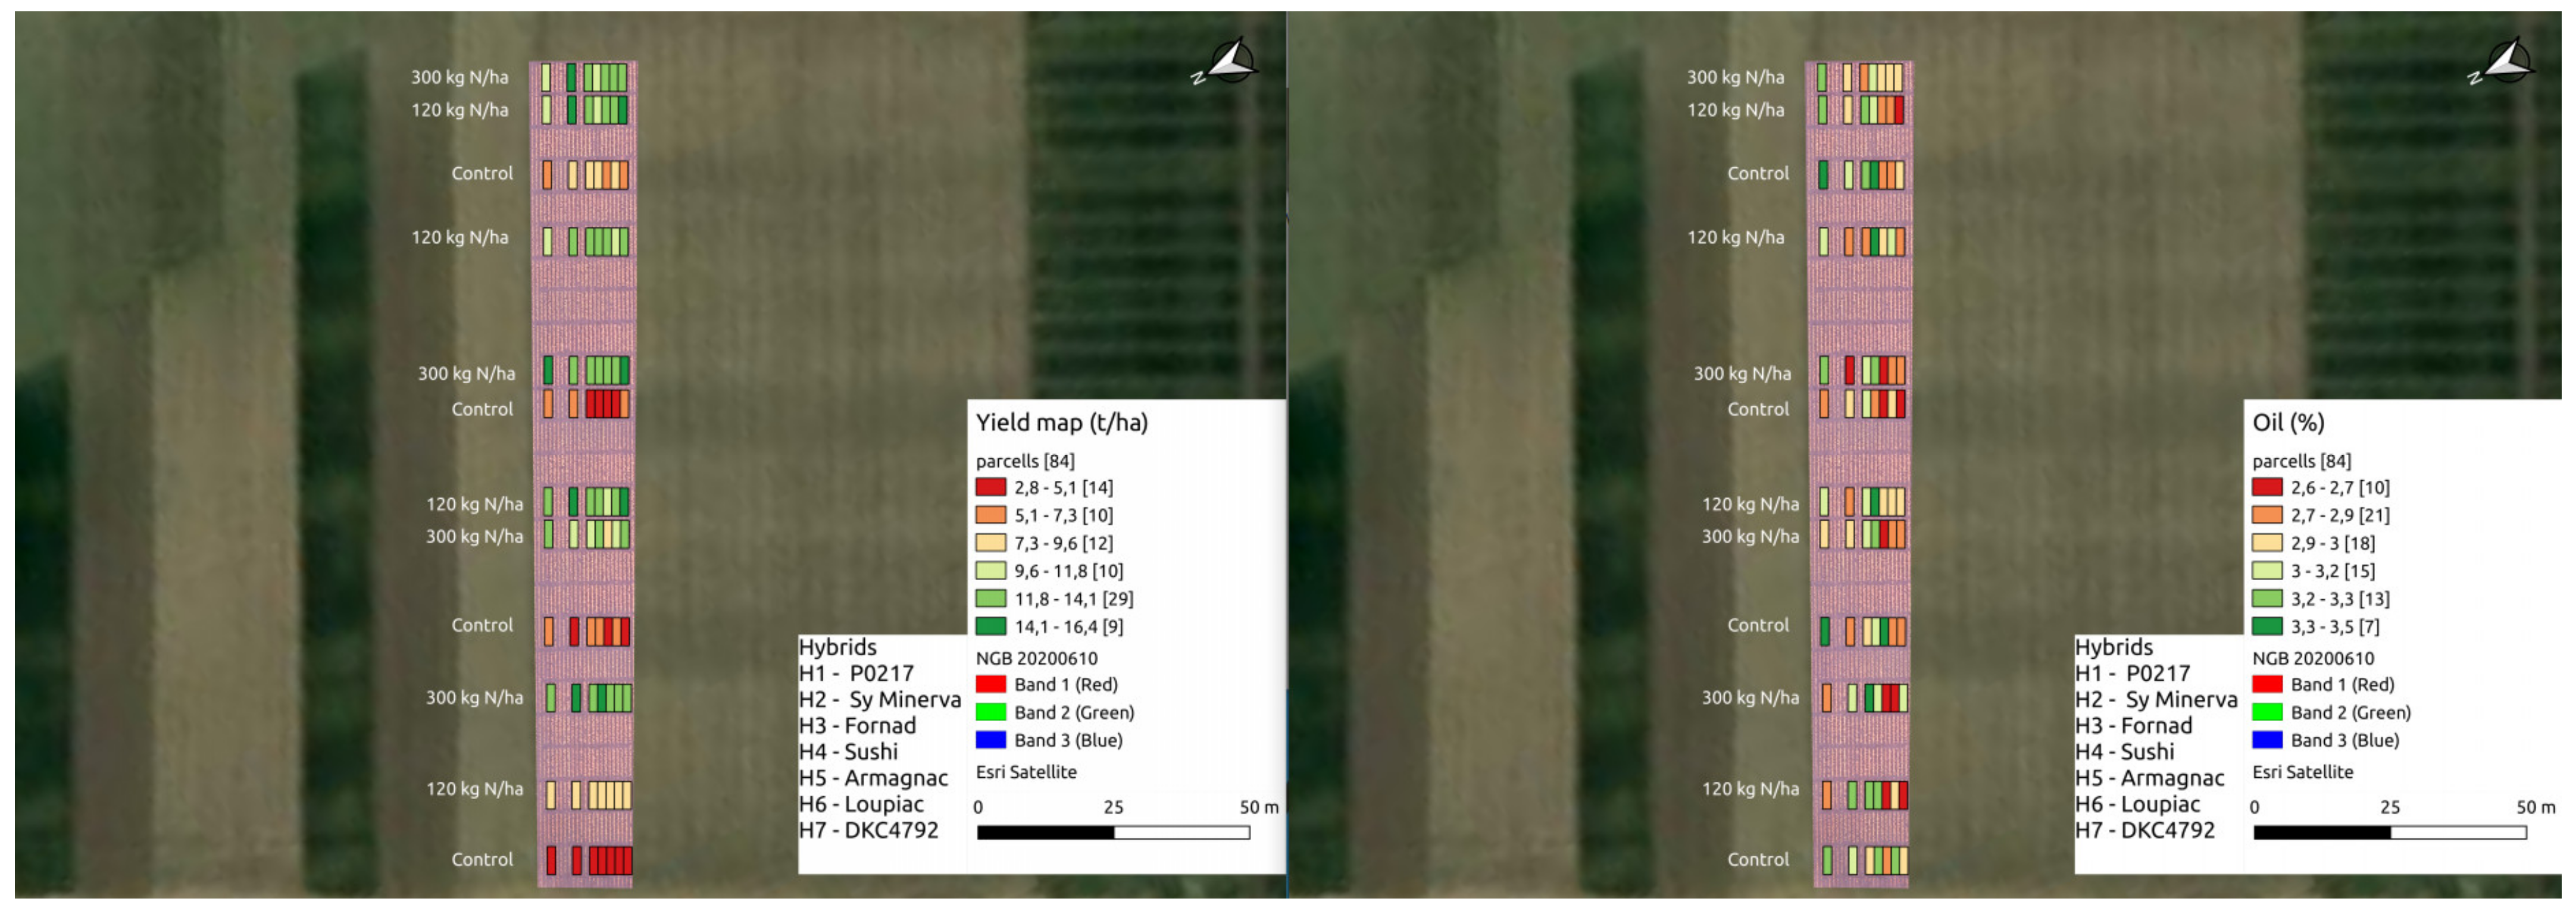
| Hybrid | Yield | Group | Hybrid | BNDVI | Group |
|---|---|---|---|---|---|
| SY Minerva | 10.886453 | a | Fornad | 0.1387226 | a |
| DKC4792 | 10.681877 | ab | P0217 | 0.1375380 | ab |
| Sushi | 10.232131 | abc | Loupiac | 0.1368377 | ab |
| Fornad | 10.111388 | abc | DKC4792 | 0.1367105 | abc |
| Loupiac | 9.825149 | bc | Sushi | 0.1355918 | bc |
| P0217 | 9.393235 | c | Armagnac | 0.1355891 | bc |
| Armagnac | 9.343470 | c | SY Minerva | 0.1341214 | c |
| Hybrid | Oil | Group | Hybrid | ENDVI | Group |
| Sushi | 3.190833 | a | Fornad | 0.06731359 | a |
| P0217 | 3.117500 | a | Loupiac | 0.06690510 | a |
| Fornad | 3.087500 | ab | DKC4792 | 0.06676005 | ab |
| SY Minerva | 2.934167 | bc | Sushi | 0.06655601 | ab |
| Loupiac | 2.908333 | c | Armagnac | 0.06627764 | ab |
| Armagnac | 2.835000 | c | P0217 | 0.06438019 | b |
| DKC4792 | 2.834167 | c | SY Minerva | 0.06187965 | c |
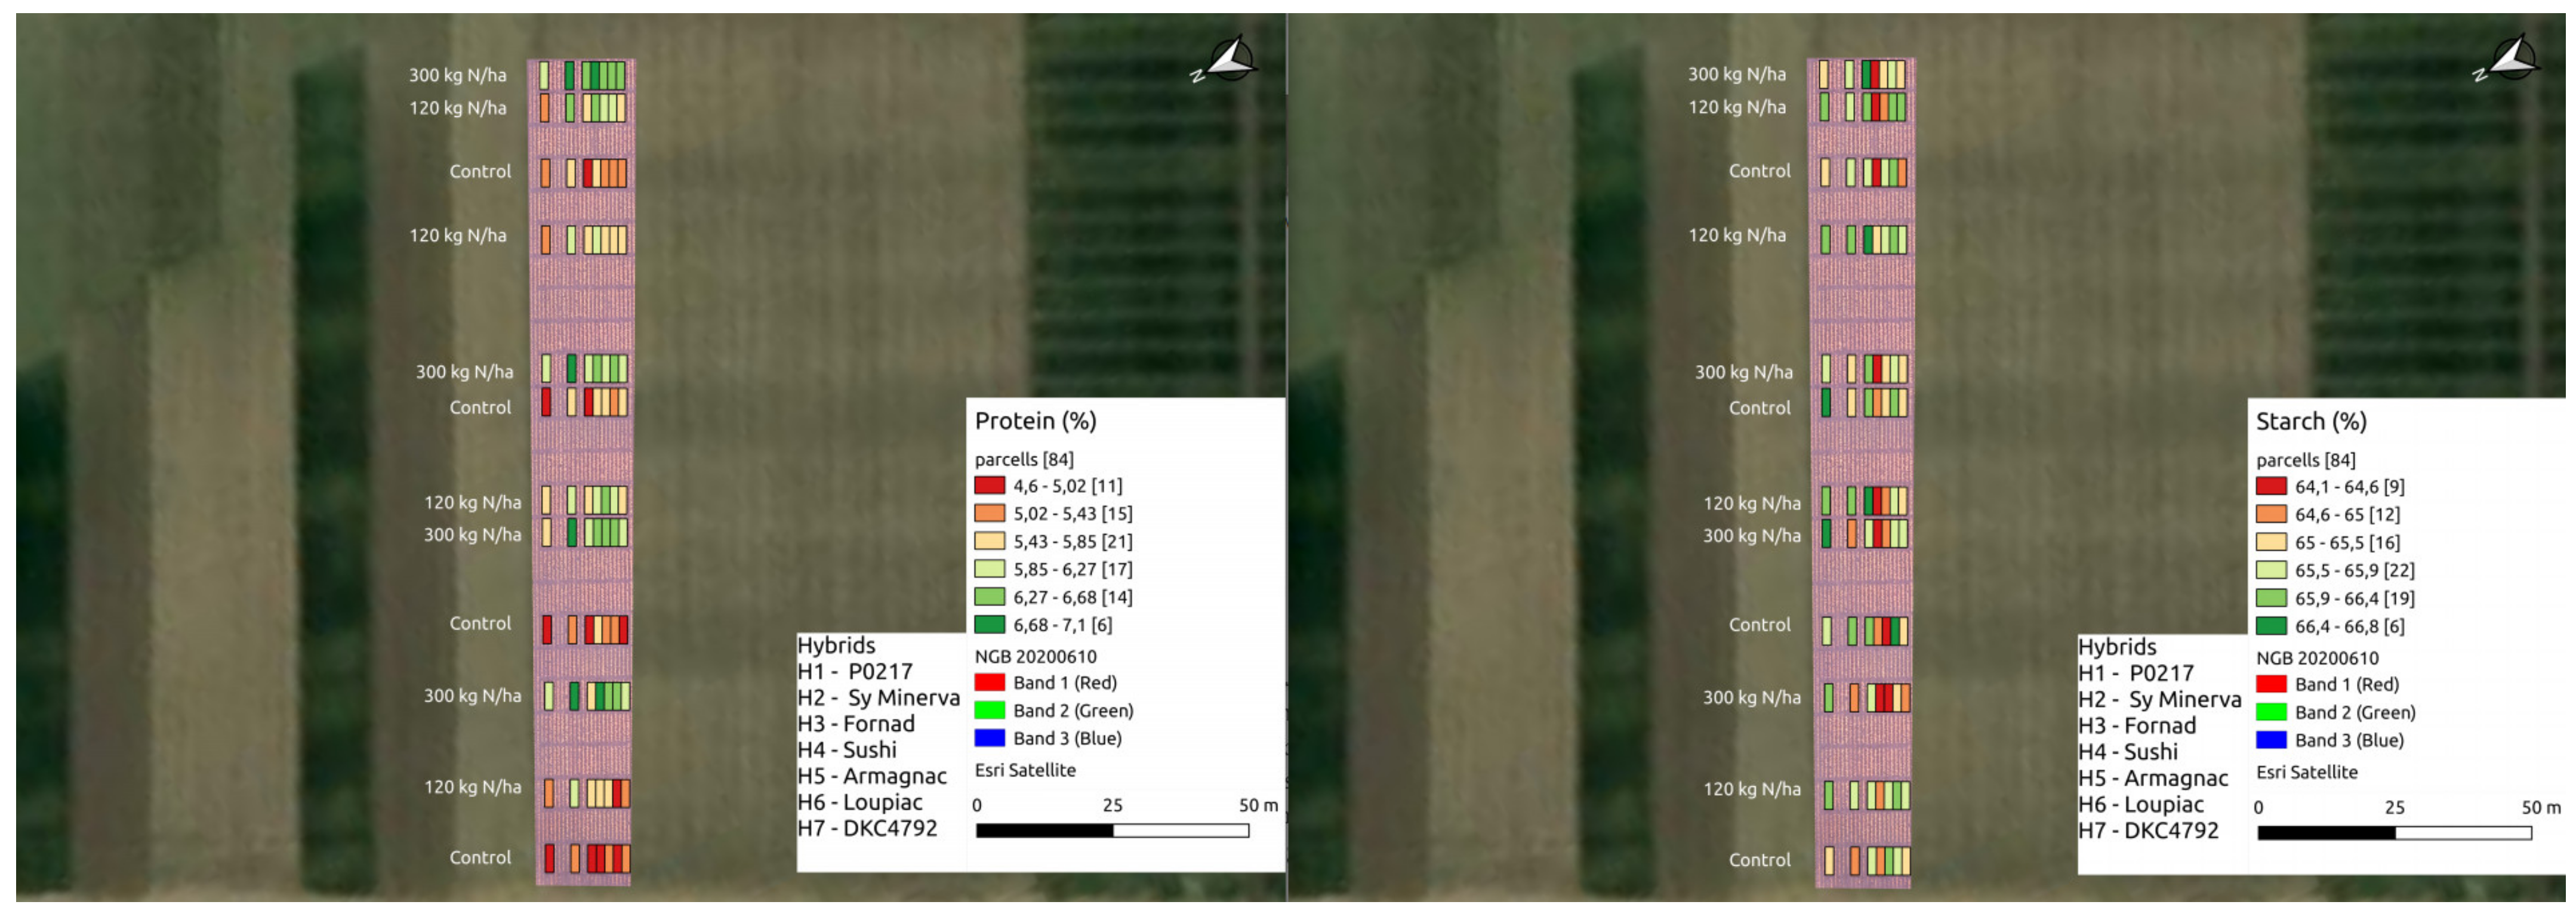
| Hybrid | Protein | Group | Hybrid | GNDVI | Group |
| SY Minerva | 6.093333 | a | P0217 | 0.1602840 | a |
| Sushi | 6.023333 | ab | SY Minerva | 0.1578918 | ab |
| Armagnac | 5.945833 | b | Fornad | 0.1564729 | b |
| Loupiac | 5.697500 | c | DKC4792 | 0.1529463 | c |
| DKC4792 | 5.665000 | c | Loupiac | 0.1529081 | c |
| Fornad | 5.530833 | d | Armagnac | 0.1514125 | c |
| P0217 | 5.384167 | e | Sushi | 0.1507901 | c |
| Hybrid | Starch | Group | |||
| Fornad | 66.06917 | a | |||
| Loupiac | 65.99750 | a | |||
| P0217 | 65.93167 | a | |||
| SY Minerva | 65.55750 | b | |||
| DKC4792 | 65.40917 | bc | |||
| Armagnac | 65.20333 | c | |||
| Sushi | 64.55750 | d |
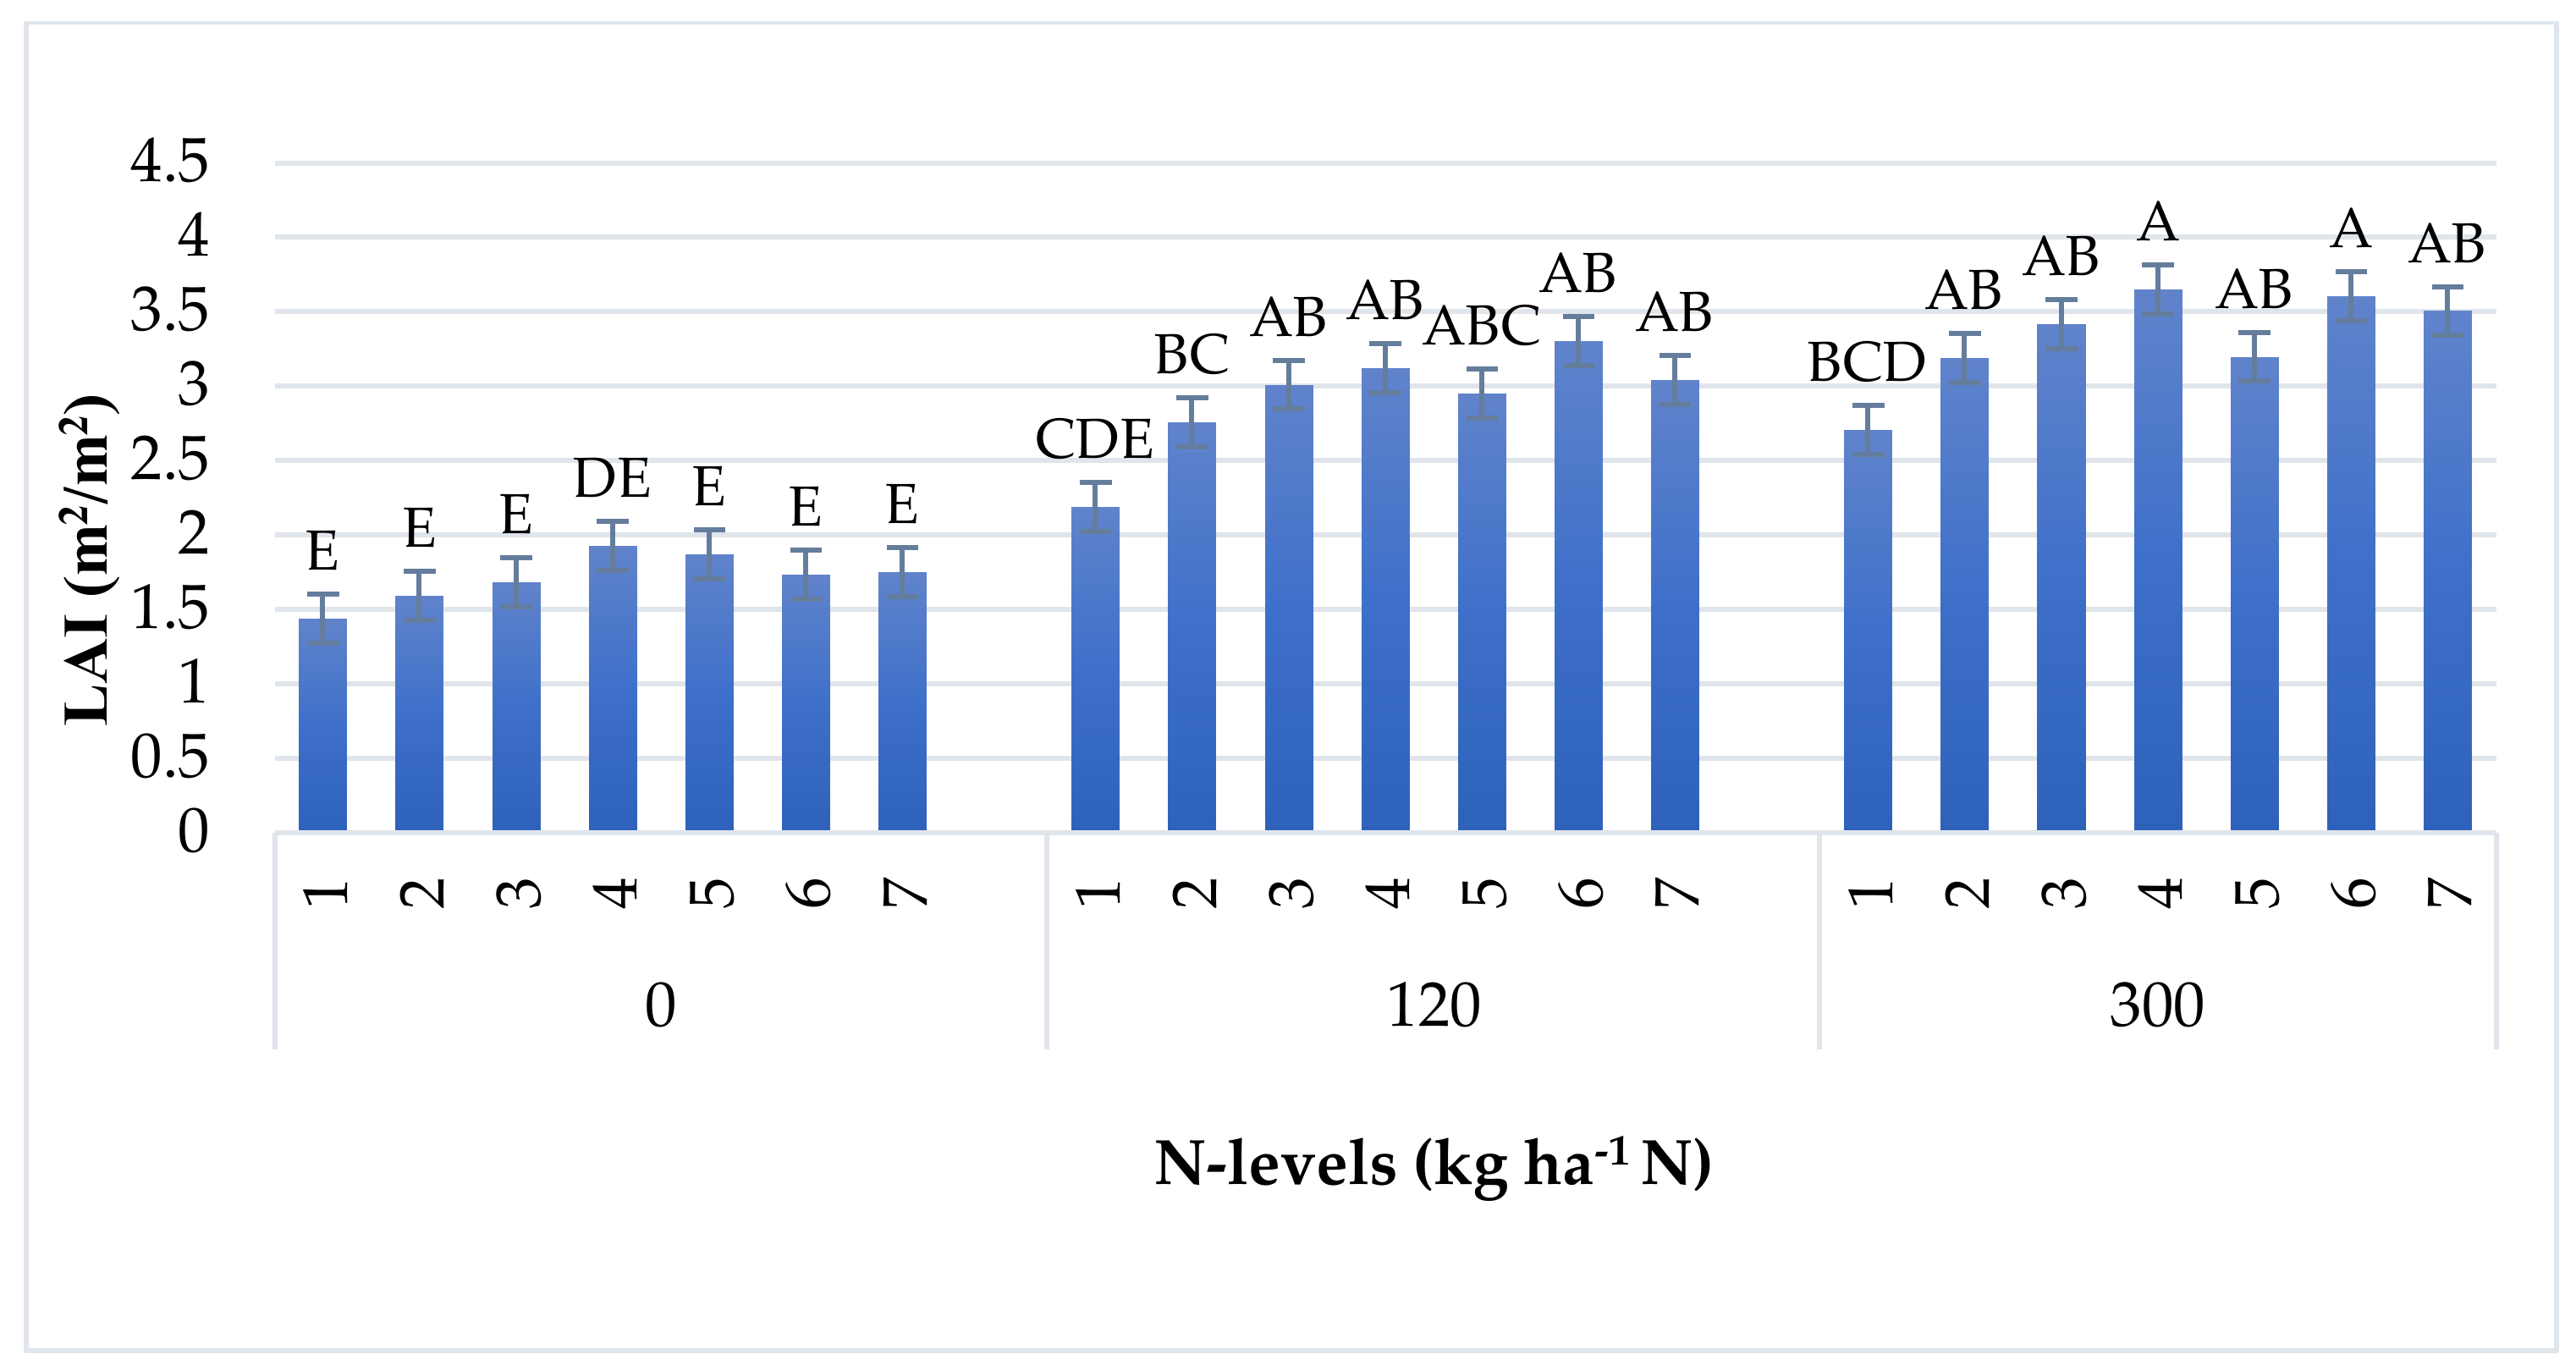
| Parameters | Nitrogen Level | Group | |
|---|---|---|---|
| Yield | 0 | 5.357643 | b |
| 60 | 11.871939 | a | |
| 150 | 12.973433 | a | |
| Protein | 0 | 5.165000 | c |
| 60 | 5.748571 | b | |
| 150 | 6.375000 | a | |
| Starch | 0 | 65.52500 | ab |
| 60 | 65.73821 | a | |
| 150 | 65.33357 | b | |
| ENDVI | 0 | 0.07021143 | a |
| 60 | 0.06441199 | b | |
| 150 | 0.06255039 | b | |
| GNDVI | 0 | 0.1463726 | b |
| 60 | 0.1567136 | a | |
| 150 | 0.1609305 | a |
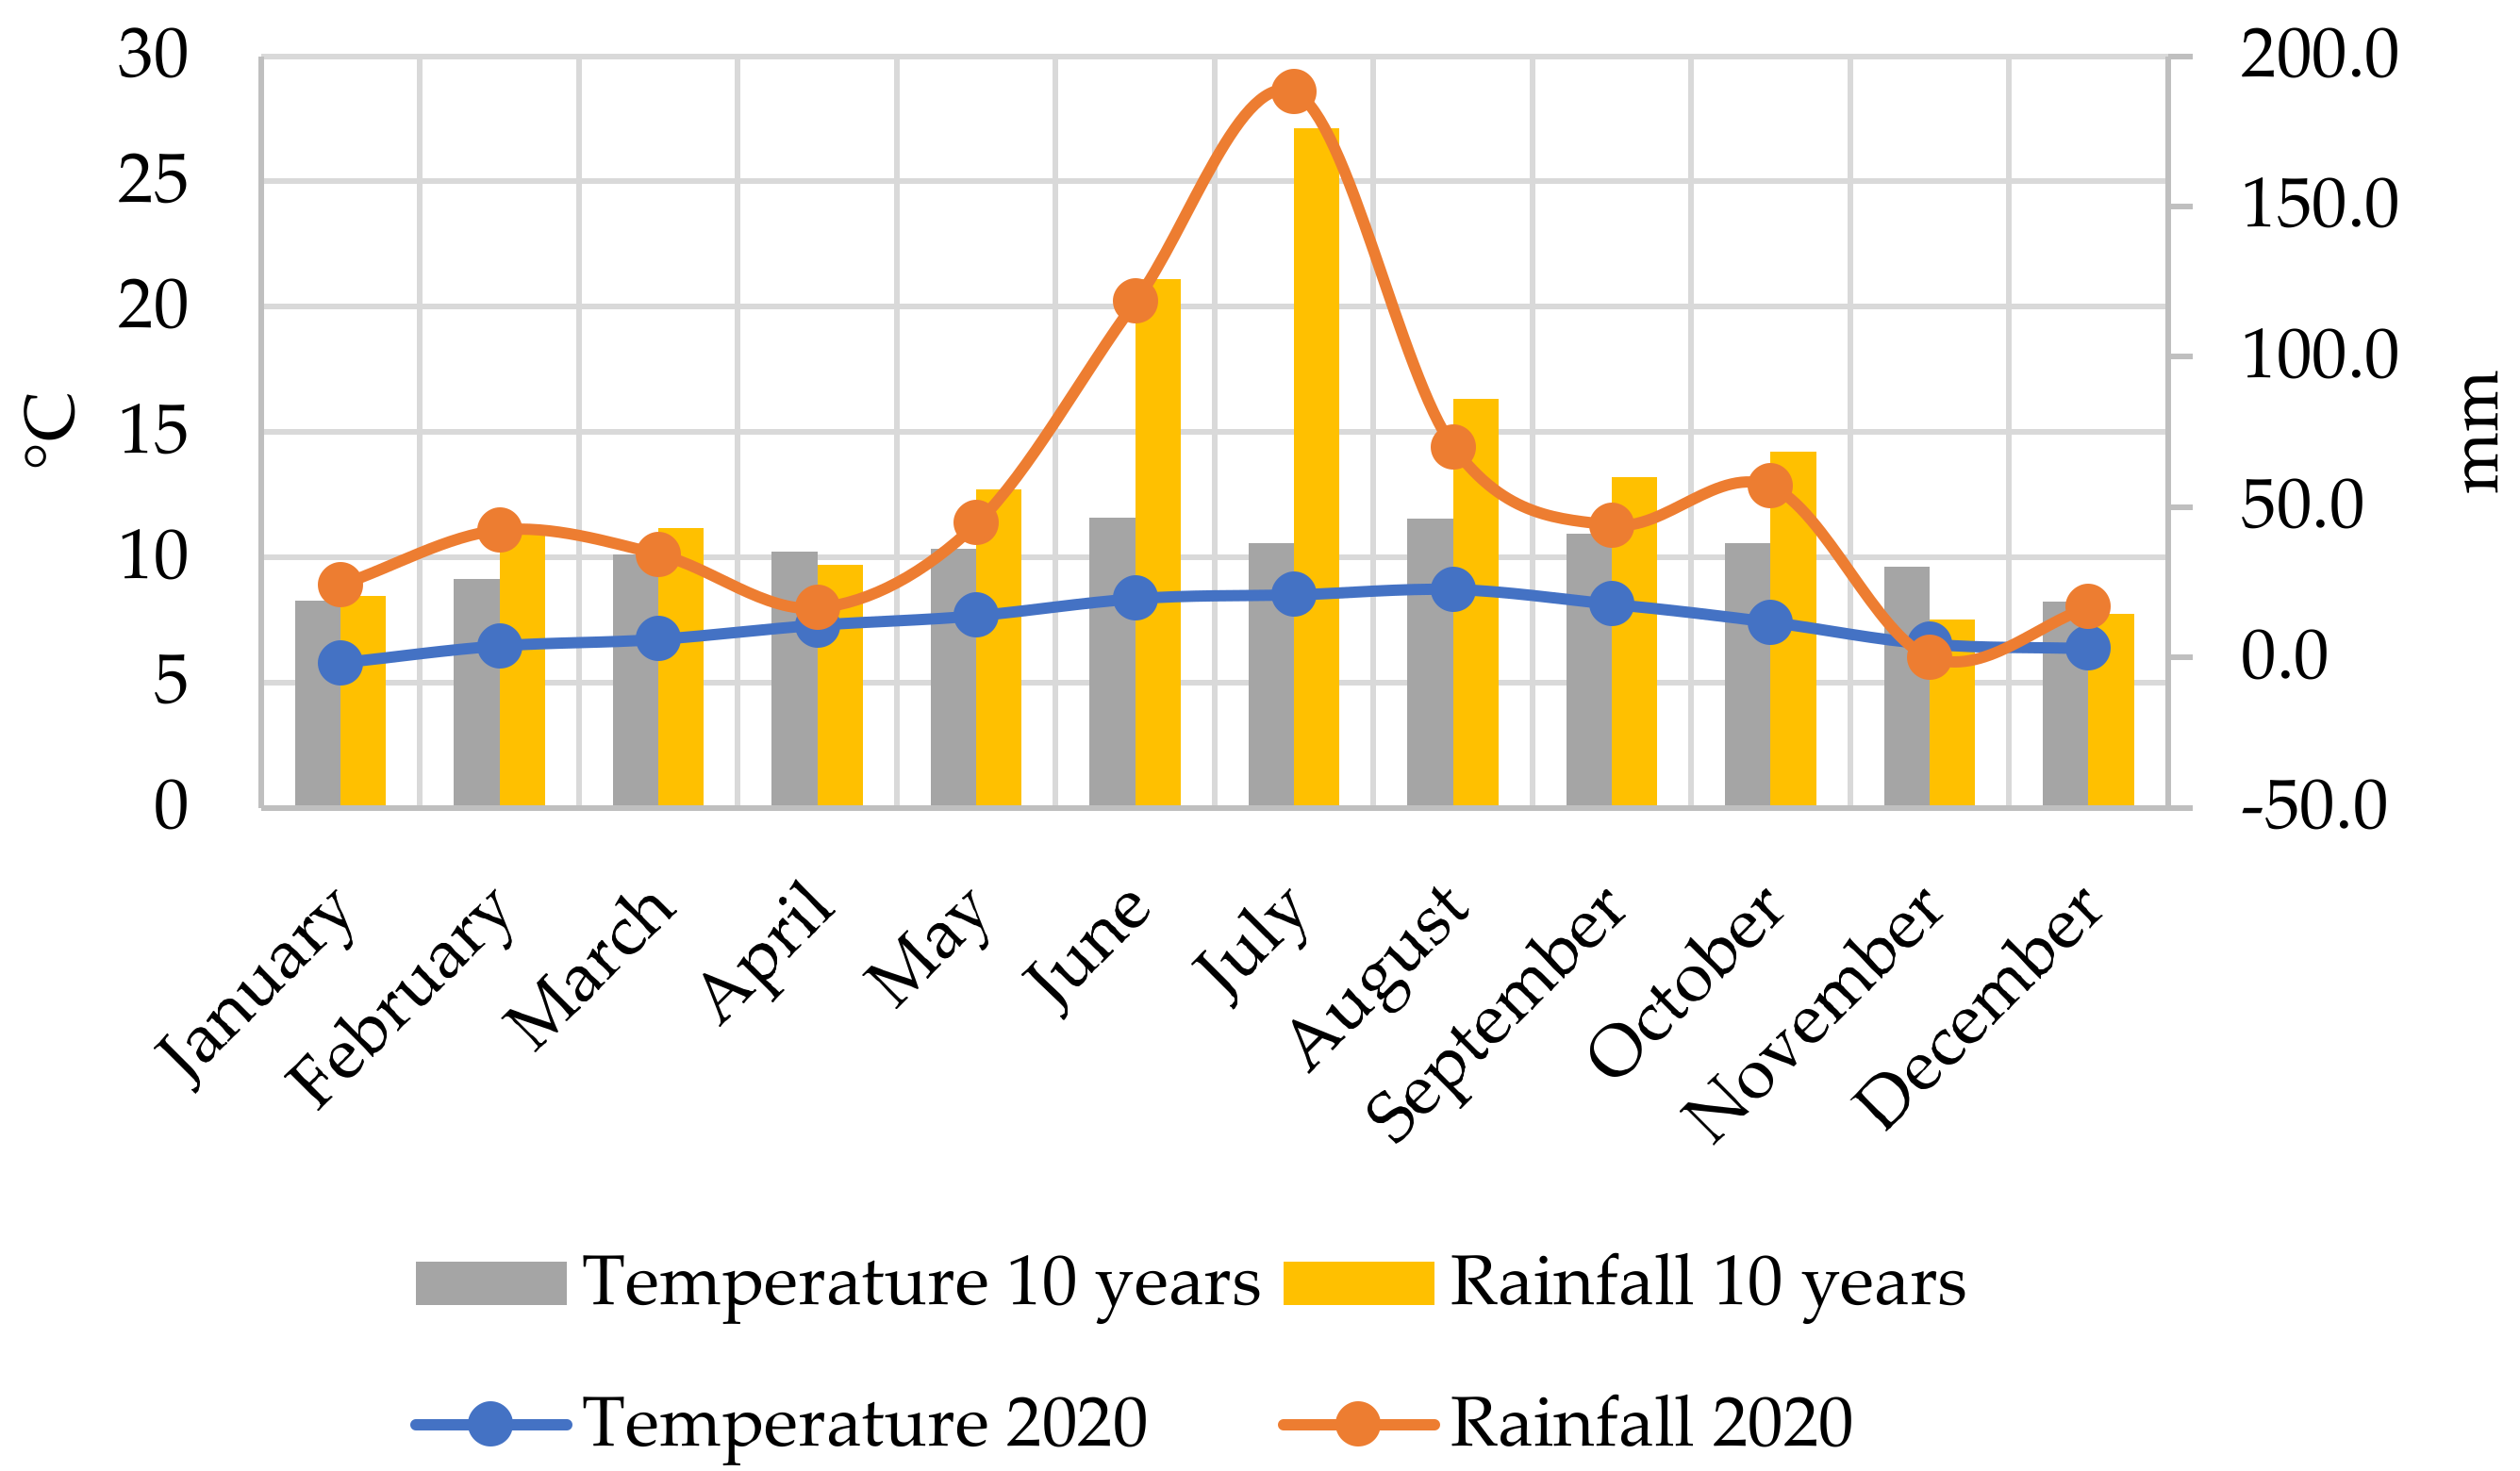
| Fertilisation Levels | pH (KCl 1:2,5) | KA | Salt Content [m/m%] | CaCO3 [m/m%] | Organic Matter [m/m%] | Nitrogen [mg/kg] | Magnesium [mg/kg] | Potassium Oxide [mg/kg] | Phosphorus Pentoxide [mg/kg] |
|---|---|---|---|---|---|---|---|---|---|
| 0 | 6.15 | 38.56 | <0.02 | <0.1 | 2.16 | 1.17 | 362.30 | 185.28 | 52.90 |
| 1 | 5.70 | 40.28 | <0.02 | <0.1 | 2.23 | 2.30 | 346.15 | 277.44 | 146.65 |
| 2 | 5.57 | 36.81 | <0.02 | <0.1 | 2.02 | 2.11 | 359.00 | 277.02 | 129.12 |
Publisher’s Note: MDPI stays neutral with regard to jurisdictional claims in published maps and institutional affiliations. |
© 2022 by the authors. Licensee MDPI, Basel, Switzerland. This article is an open access article distributed under the terms and conditions of the Creative Commons Attribution (CC BY) license (https://creativecommons.org/licenses/by/4.0/).
Share and Cite
Szabó, A.; Mousavi, S.M.N.; Bojtor, C.; Ragán, P.; Nagy, J.; Vad, A.; Illés, Á. Analysis of Nutrient-Specific Response of Maize Hybrids in Relation to Leaf Area Index (LAI) and Remote Sensing. Plants 2022, 11, 1197. https://doi.org/10.3390/plants11091197
Szabó A, Mousavi SMN, Bojtor C, Ragán P, Nagy J, Vad A, Illés Á. Analysis of Nutrient-Specific Response of Maize Hybrids in Relation to Leaf Area Index (LAI) and Remote Sensing. Plants. 2022; 11(9):1197. https://doi.org/10.3390/plants11091197
Chicago/Turabian StyleSzabó, Atala, Seyed Mohammad Nasir Mousavi, Csaba Bojtor, Péter Ragán, János Nagy, Attila Vad, and Árpád Illés. 2022. "Analysis of Nutrient-Specific Response of Maize Hybrids in Relation to Leaf Area Index (LAI) and Remote Sensing" Plants 11, no. 9: 1197. https://doi.org/10.3390/plants11091197
APA StyleSzabó, A., Mousavi, S. M. N., Bojtor, C., Ragán, P., Nagy, J., Vad, A., & Illés, Á. (2022). Analysis of Nutrient-Specific Response of Maize Hybrids in Relation to Leaf Area Index (LAI) and Remote Sensing. Plants, 11(9), 1197. https://doi.org/10.3390/plants11091197