Article

Genome-Wide Identification of Cotton (Gossypium spp.) Trehalose-6-Phosphate Phosphatase (TPP) Gene Family Members and the Role of GhTPP22 in the Response to Drought Stress

1
Key Laboratory of Tobacco Improvement and Biotechnology, Tobacco Research Institute of Chinese Academy of Agricultural Sciences, Qingdao 266100, China
2
College of Agriculture, Liaocheng University, Liaocheng 252059, China
3
Key Laboratory of Cell and Gene Circuit Design, Shenzhen Institute of Synthetic Biology, Shenzhen Institute of Advanced Technology, Chinese Academy of Sciences, Shenzhen 518055, China
4
Shanghai Institutes for Biological Sciences, Chinese Academy of Sciences, Shanghai 201602, China
5
Beijing Capital Agribusiness Future Biotechnology, Beijing 100088, China
*
Authors to whom correspondence should be addressed.
These authors contributed equally to this work.
Plants 2022, 11(8), 1079; https://doi.org/10.3390/plants11081079
Submission received: 22 March 2022 / Revised: 11 April 2022 / Accepted: 12 April 2022 / Published: 15 April 2022
(This article belongs to the Special Issue Molecular Mechanism of Resistance to Stress in Cotton)

Abstract

:
Trehalose-6-phosphate phosphatase (TPP) is a key enzyme involved in trehalose synthesis in higher plants. Previous studies have shown that TPP family genes increase yields without affecting plant growth under drought conditions, but their functions in cotton have not been reported. In this study, 17, 12, 26 and 24 TPP family genes were identified in Gossypium arboreum, Gossypium raimondii, Gossypium barbadense and Gossypium hirsutum, respectively. The 79 TPP family genes were divided into three subgroups by phylogenetic analysis. Virus-induced gene silencing (VIGS) of GhTPP22 produced TRV::GhTPP22 plants that were more sensitive to drought stress than the control plants, and the relative expression of GhTPP22 was decreased, as shown by qRT–PCR. Moreover, we analysed the gene structure, targeted small RNAs, and gene expression patterns of TPP family members and the physicochemical properties of their encoded proteins. Overall, members of the TPP gene family in cotton were systematically identified, and the function of GhTPP22 under drought stress conditions was preliminarily verified. These findings provide new information for improving drought resistance for cotton breeding in the future.

1. Introduction

Trehalose is a nonreducing disaccharide that is common in bacteria, fungi, yeasts, invertebrates and plants. In addition to being a carbon source and structural component, trehalose is a good protective agent against stress under adverse conditions such as high salinity, hypoxia and nutrient starvation [1,2]. Recent studies have found that many species, such as drought-tolerant cypress, can protect themselves by synthesizing trehalose under adverse conditions such as drought and freezing [3]. An increase in trehalose reserves in plants helps them maintain their metabolism at an extremely low state under abiotic stress conditions and thus plays an indispensable protective role in plants.
The trehalose biosynthetic pathway in plants mainly involves the synthesis of trehalose 6-phosphate (T6P), which is catalysed by trehalose-6-phosphate synthase (TPS), followed by the formation of trehalose, which is catalysed by trehalose-6-phosphate phosphatase (TPP) [4,5]. Hilde et al. found that overexpression of the trehalase (TRE) gene TRE1 could increase the drought tolerance of Arabidopsis thaliana and that TRE1 is involved in abscisic acid (ABA)-induced stomatal closure [6]. Tobacco plants overexpressing TPS were significantly more tolerant to drought and more resistant to salt, but some of these tobacco plants displayed growth and differentiation defects, such as dwarfism and abnormal root differentiation. Based on the above results, scientists have hypothesized that trehalose and its metabolites are likely involved in the regulation of plant growth and differentiation and also enhance stress tolerance [7,8].
As a key enzyme involved in trehalose synthesis, TPP can improve crop yields in response to abiotic stresses and plays an important role in plant growth and development [9,10,11,12,13,14,15]. For example, in rice, both OsTPP1 and OsTPP2 exhibit TPP enzyme activity, and the expression of OsTPP1 is rapidly upregulated in response to salt and ABA treatment, while the induction effect of cold treatment is relatively slow [16]. As another example, deletion of RAMOSA3 (RA3), a TPP homologue, in maize alters pistil branching and stamen inflorescence differentiation, and the trehalose content in inflorescence primordia in the deletion mutant ra3 is very low [17]. Mads is the promoter that drives the expression of OsTPP1 in maize, and overexpression of Mads6 in maize ears can significantly improve maize yields under drought conditions [18]. Taken together, the above-described results show that the expression of TPP gene family members is closely related to cold, drought, ABA levels, etc., and that their expression varies among organs and developmental stages [19].
Cotton is planted worldwide and provides a natural fibre source for the textile industry. The allotetraploid cotton G. hirsutum and G. barbadense are the main cultivated species that have two sets of subgenomes: At and Dt [20]. If the role of TPP in cotton is similar to that in rice and maize, TPP will clearly bear great value for improving the stress tolerance of cotton. To date, no studies on TPP family members in cotton have been reported. In this study, to deeply investigate evolution, gene expression patterns and the function response to stress of the TPP family genes in cotton growth, development and stress response, TPP family members were comprehensively and systematically identified by using genome sequencing data [21,22,23]. The physicochemical properties, subcellular localization prediction, collinearity analysis, cis-element analysis, and miRNA prediction were performed in this study, and the functions of GhTPP22 were also preliminary verified in G. hirsutum. The results provide a theoretical basis for subsequent studies on the functions of TPP family genes.

2. Results

2.1. Identification and Fundamental Analysis of TPP Genes

By combining the BLASTP, CD-search and HMMER results, we identified a total of 79 TPP family genes in the four cotton species: 17 in G. arboreum, 12 in G. raimondii, 24 in G. hirsutum and 26 in sea island cotton (G. barbadense). To facilitate description, these genes were renamed according to their chromosomal positions. The amino acid lengths of the TPP family proteins ranged from 134 to 422, the average relative molecular weight was 39.54 kDa, and the average isoelectric point was 8.41 (Table 1). Subcellular location prediction indicated that TPP genes were distributed in almost all organelles and most were located in chloroplasts, which illustrated their functional diversity and complexity.

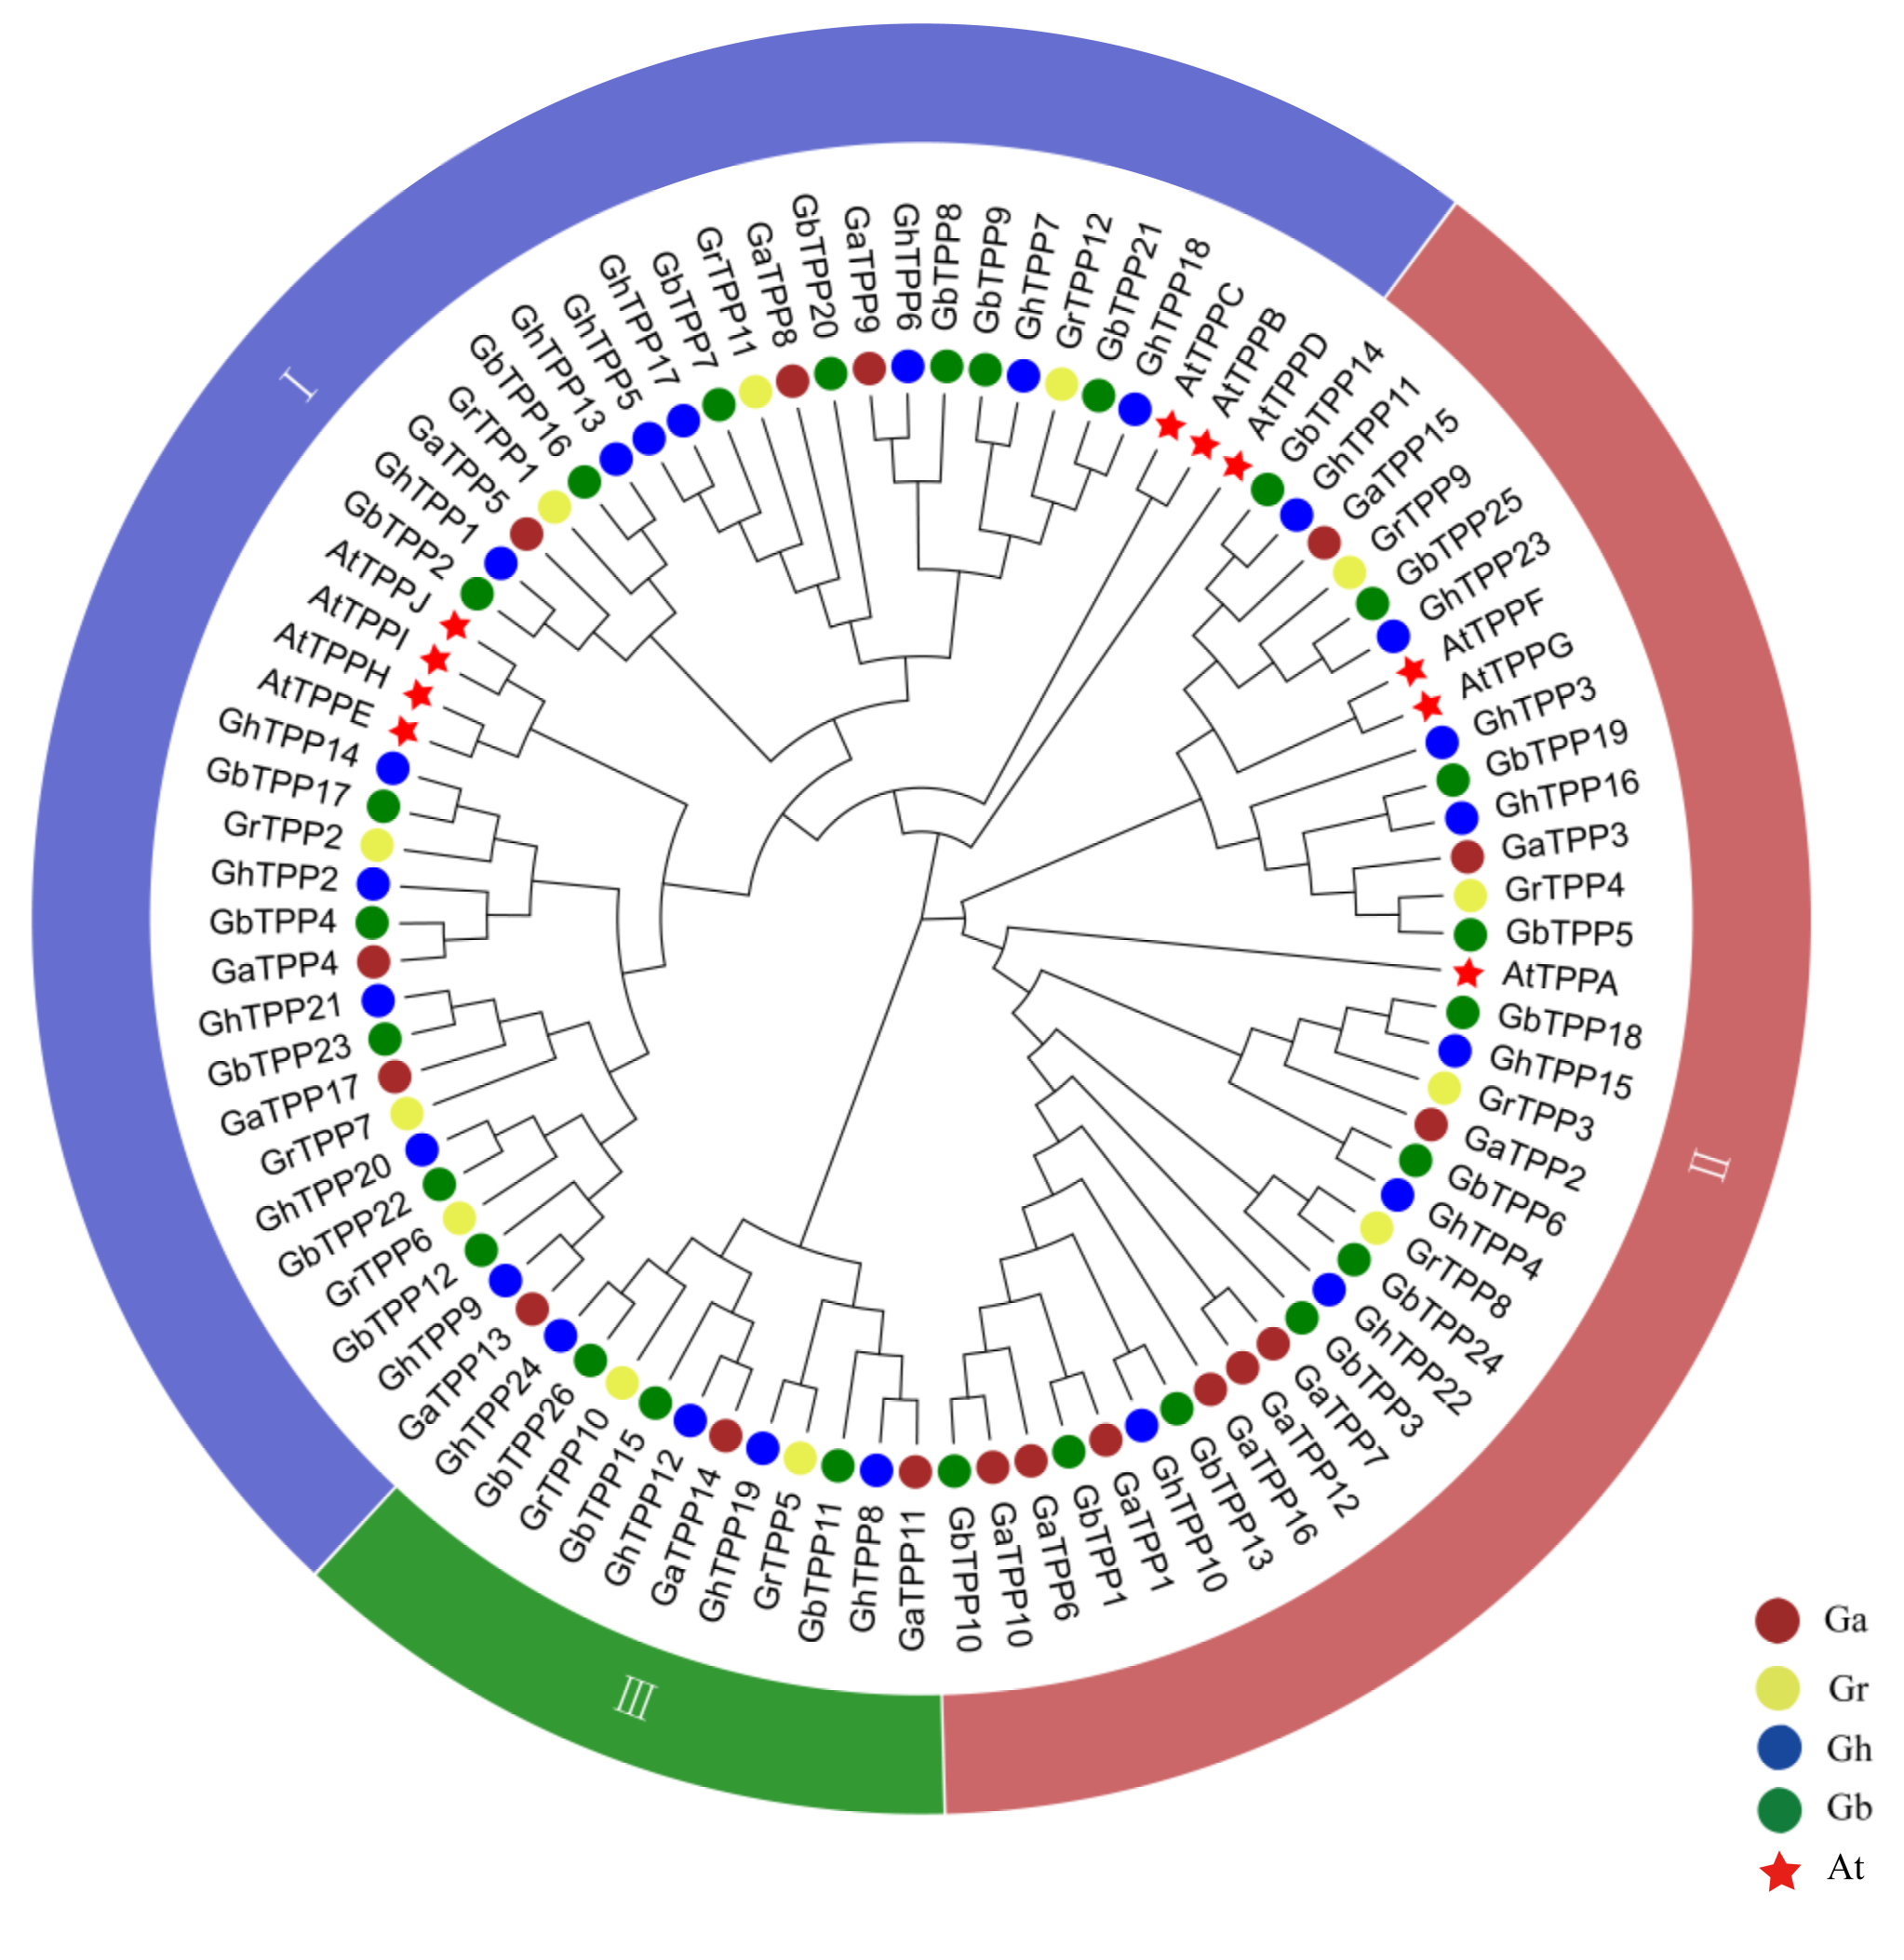
2.2. Phylogenetic Analysis of TPP Family Genes

The protein sequences encoded by the TPP gene family members in Arabidopsis (10 TPP family genes) and cotton were aligned using MEGA 7.0 to construct a phylogenetic tree. The phylogenetic tree divided the TPP family genes in Arabidopsis and cotton into three subgroups, and groups I to III are indicated in blue, red, and green colour, respectively in Figure 1. Genes assigned to the same group were more closely related. The TPP family genes in the At subgroup of G. hirsutum and G. barbadense were closely grouped on the same branch as the TPP family genes of G. arboreum. Similarly, the TPP genes in the Dt subgroup were grouped on the same branch as the TPP family genes of G. raimondii. This phenomenon also confirmed the origin of G. barbadense and G. hirsutum [22]. No TPP genes of Arabidopsis were found in group III. According to the evolutionary tree, G. hirsutum and G. barbadense are more easily divided into the same branch, indicating the closer relationship between these two species.

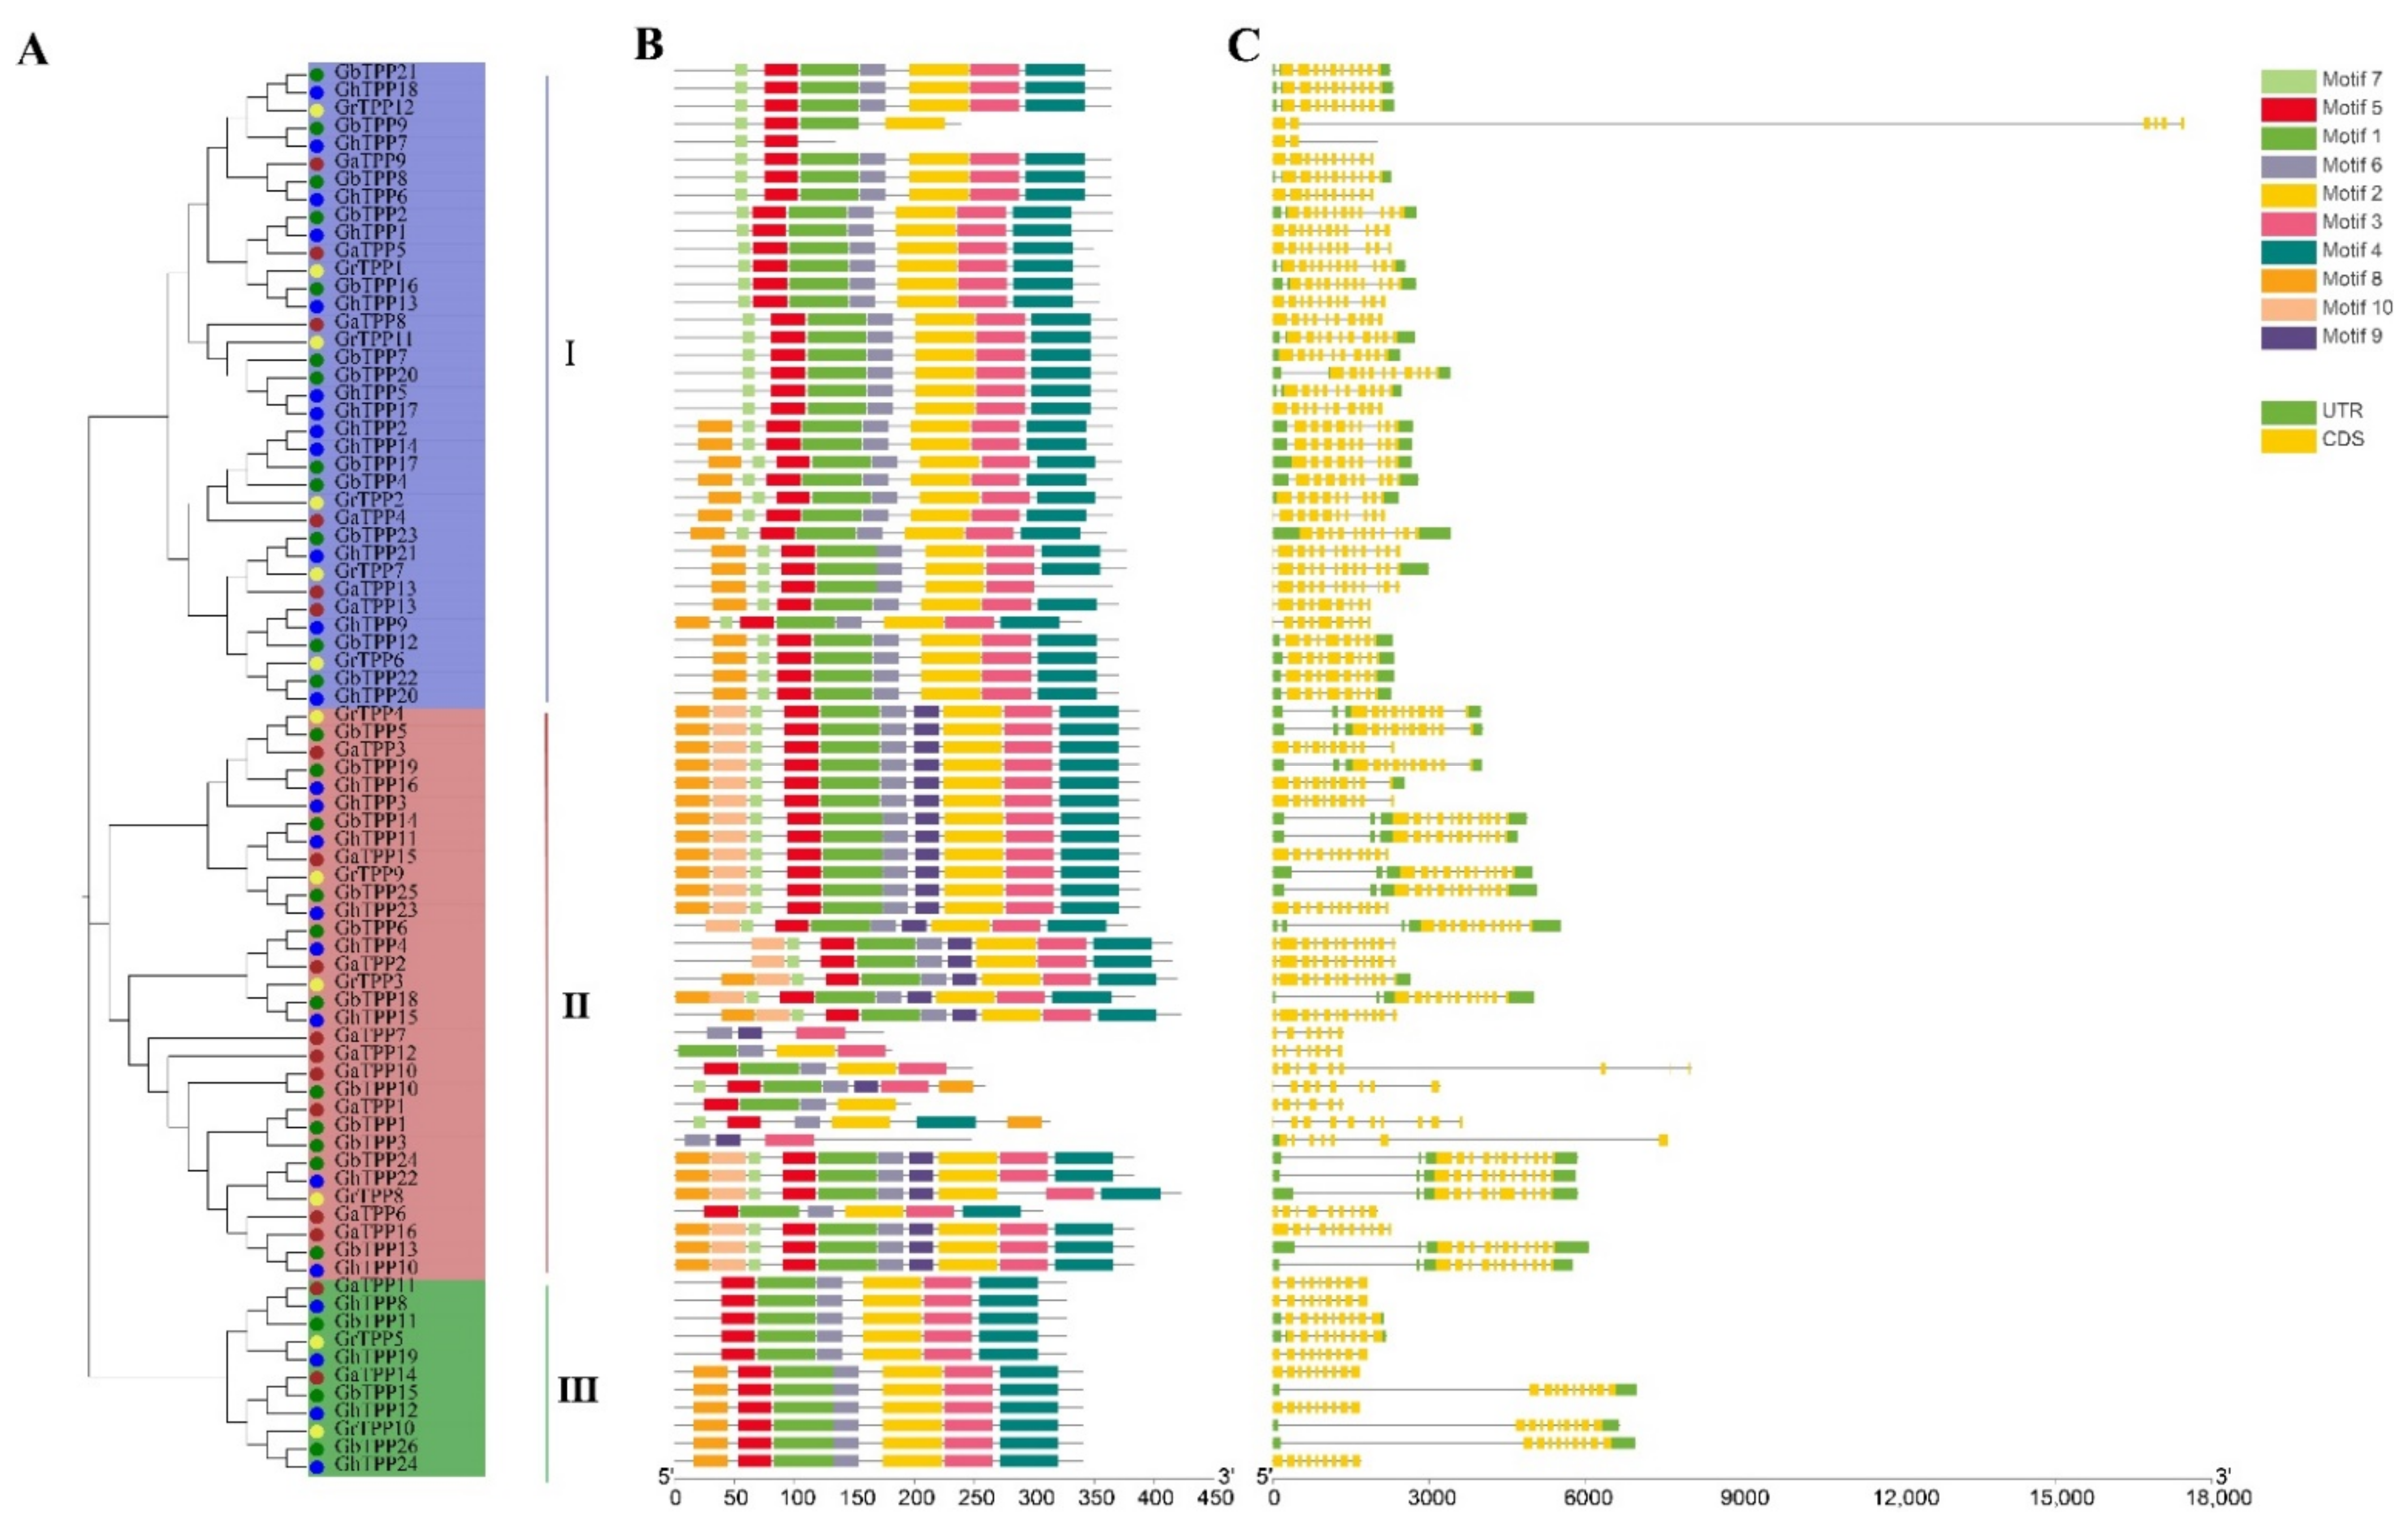
2.3. Conserved Motif and Gene Structure Analyses of TPP Proteins

To understand the functions of TPP family genes, we analysed their conserved sequences and structures in the four cotton species. A total of 79 TPP family genes in the four cotton species could be divided into groups I, II, and III in the phylogenetic tree (Figure 2A), and these groups contained 36, 32, and 11 genes, respectively.
The structures of the TPP gene family were complex (Figure 2C); more than 5 exons were observed in all TPP gene family members except GhTPP7, and 53 genes had more than 10 exons. Conserved motif analysis of TPP family genes performed with MEME (Figure 2B) revealed that motifs 1–6 were present in most members, indicating that these motifs are chronologically conserved motifs in the family and may play a role in maintaining the basic functions of the family members. Different TPP genes differ somewhat in terms of their structure and conserved sequences, but TPPs on the same branch have similar conserved sequences, such as GrTPP4-GhTPP23, which contains all the identified motifs. As shown in Figure 2, differences in gene structure and conserved motifs were found among groups, whereas genes on the same branch were conserved. Information on each motif is provided in Table S1.

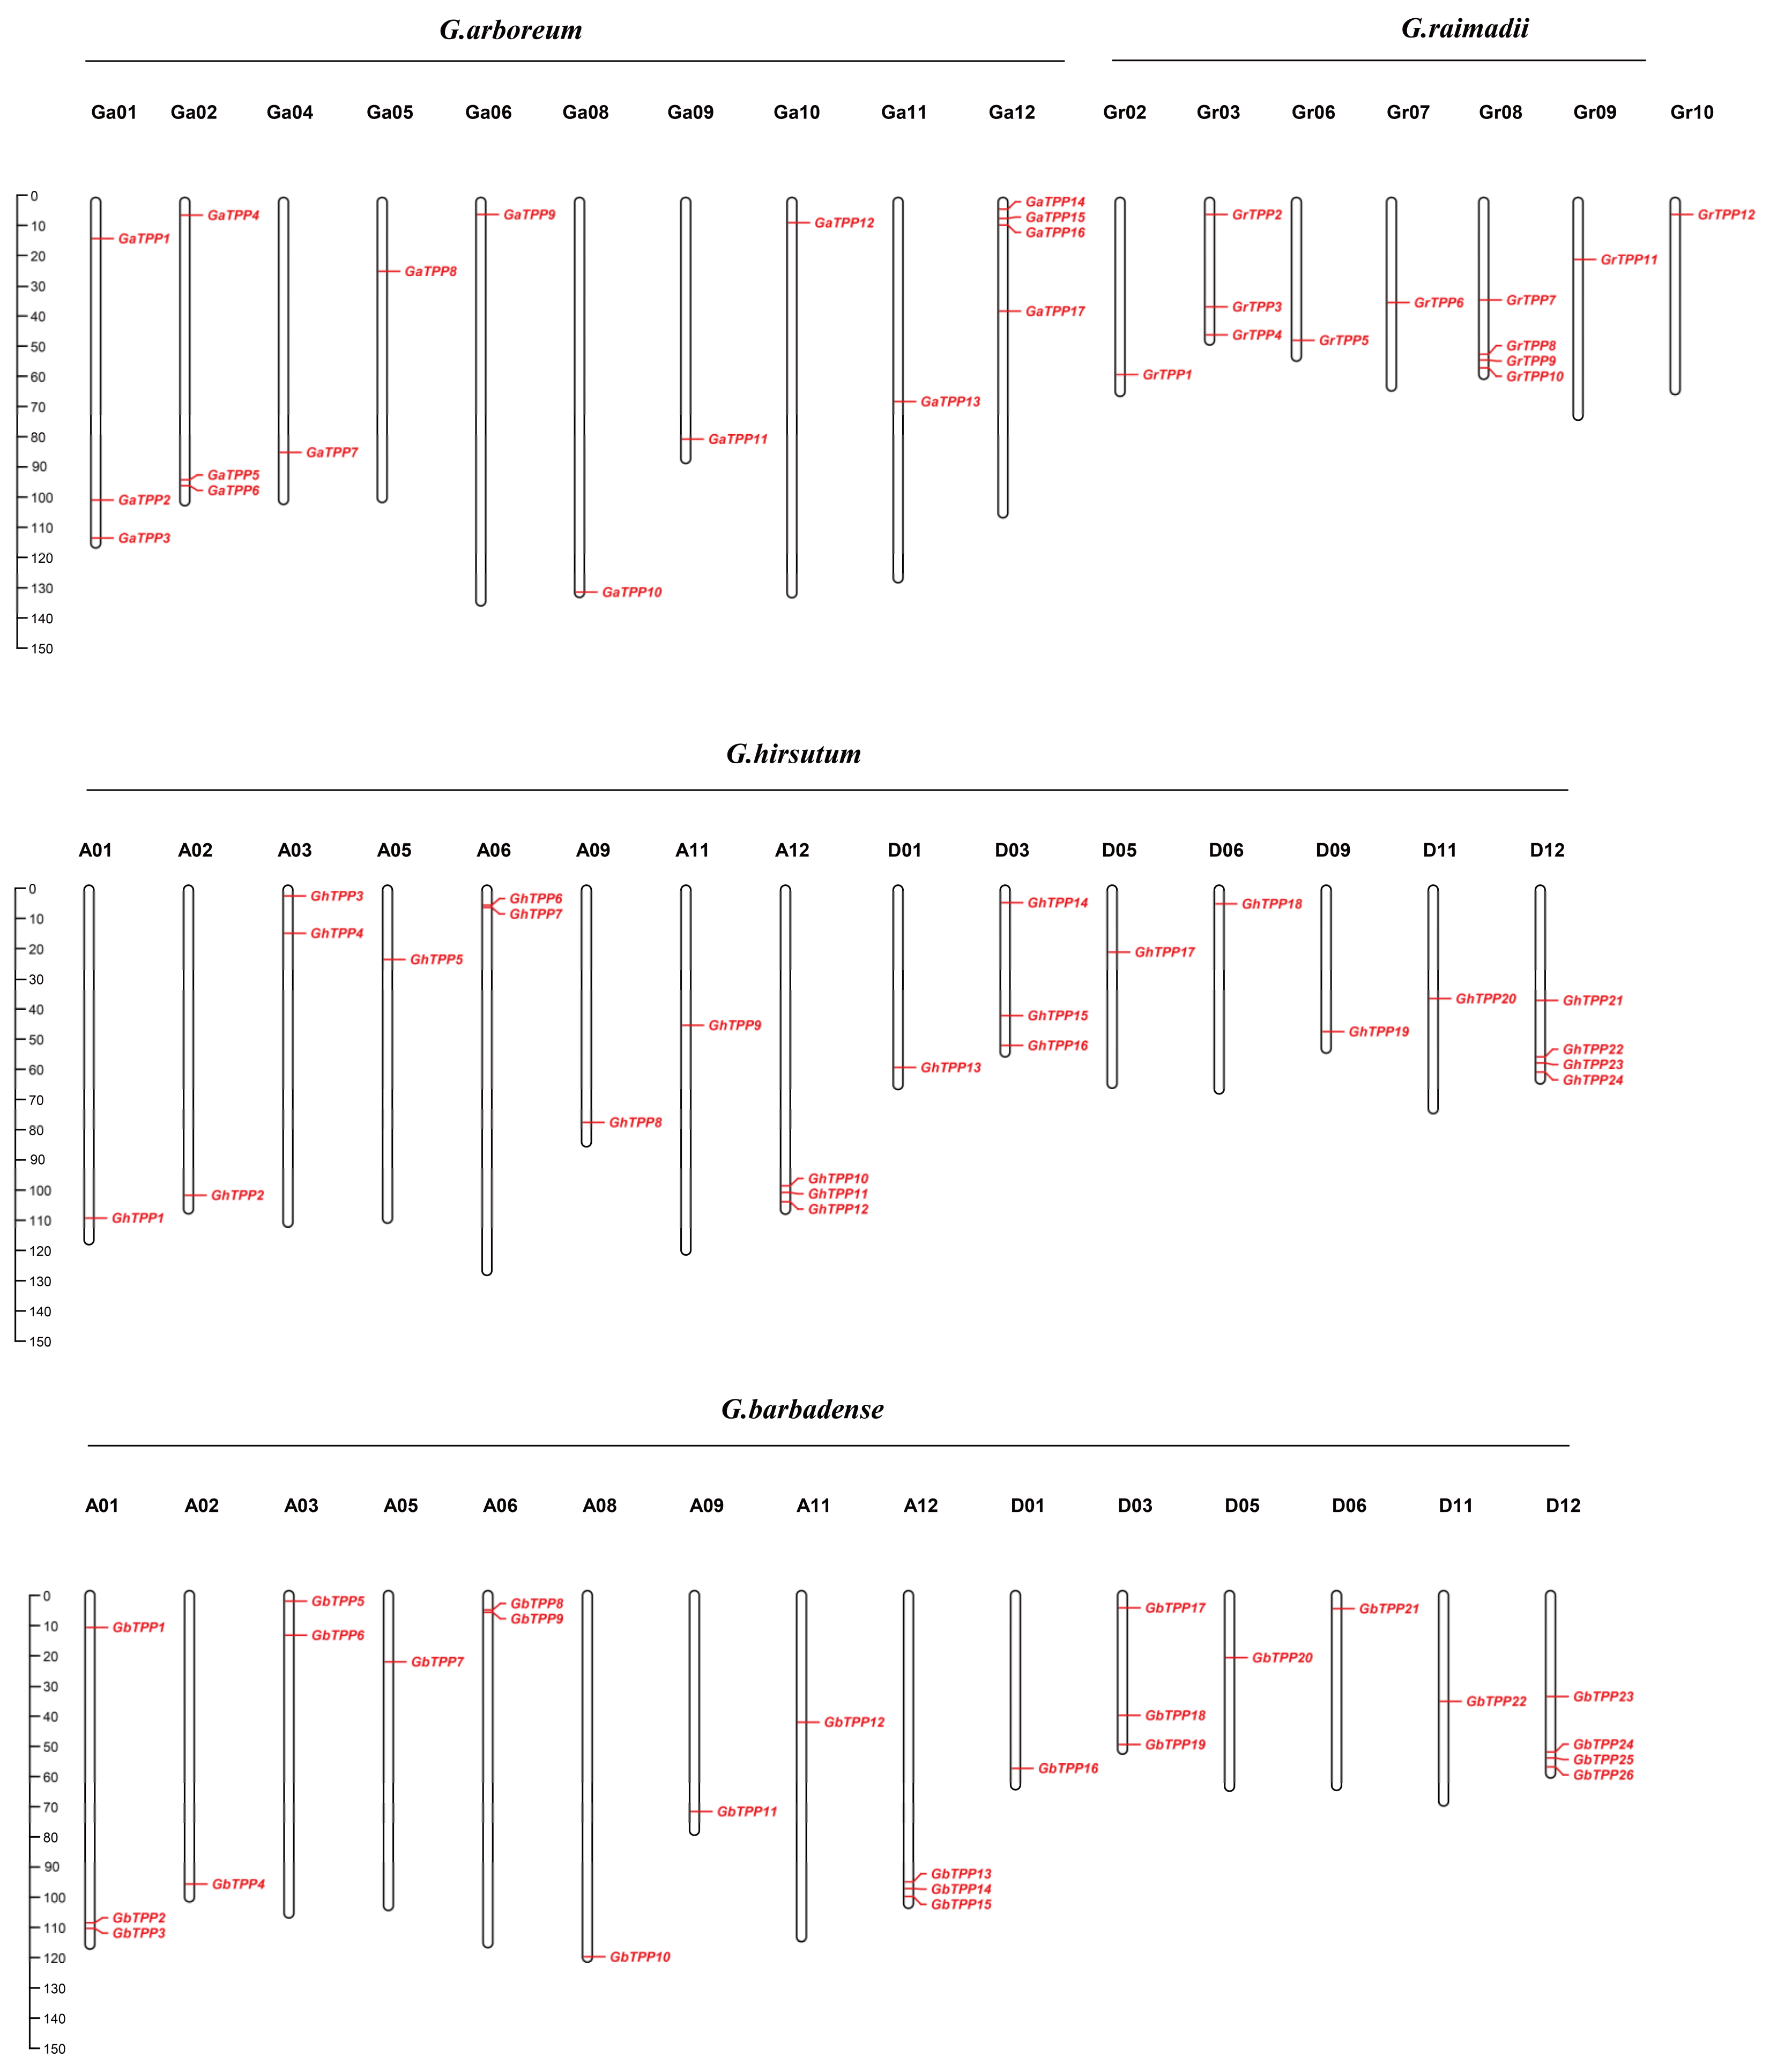
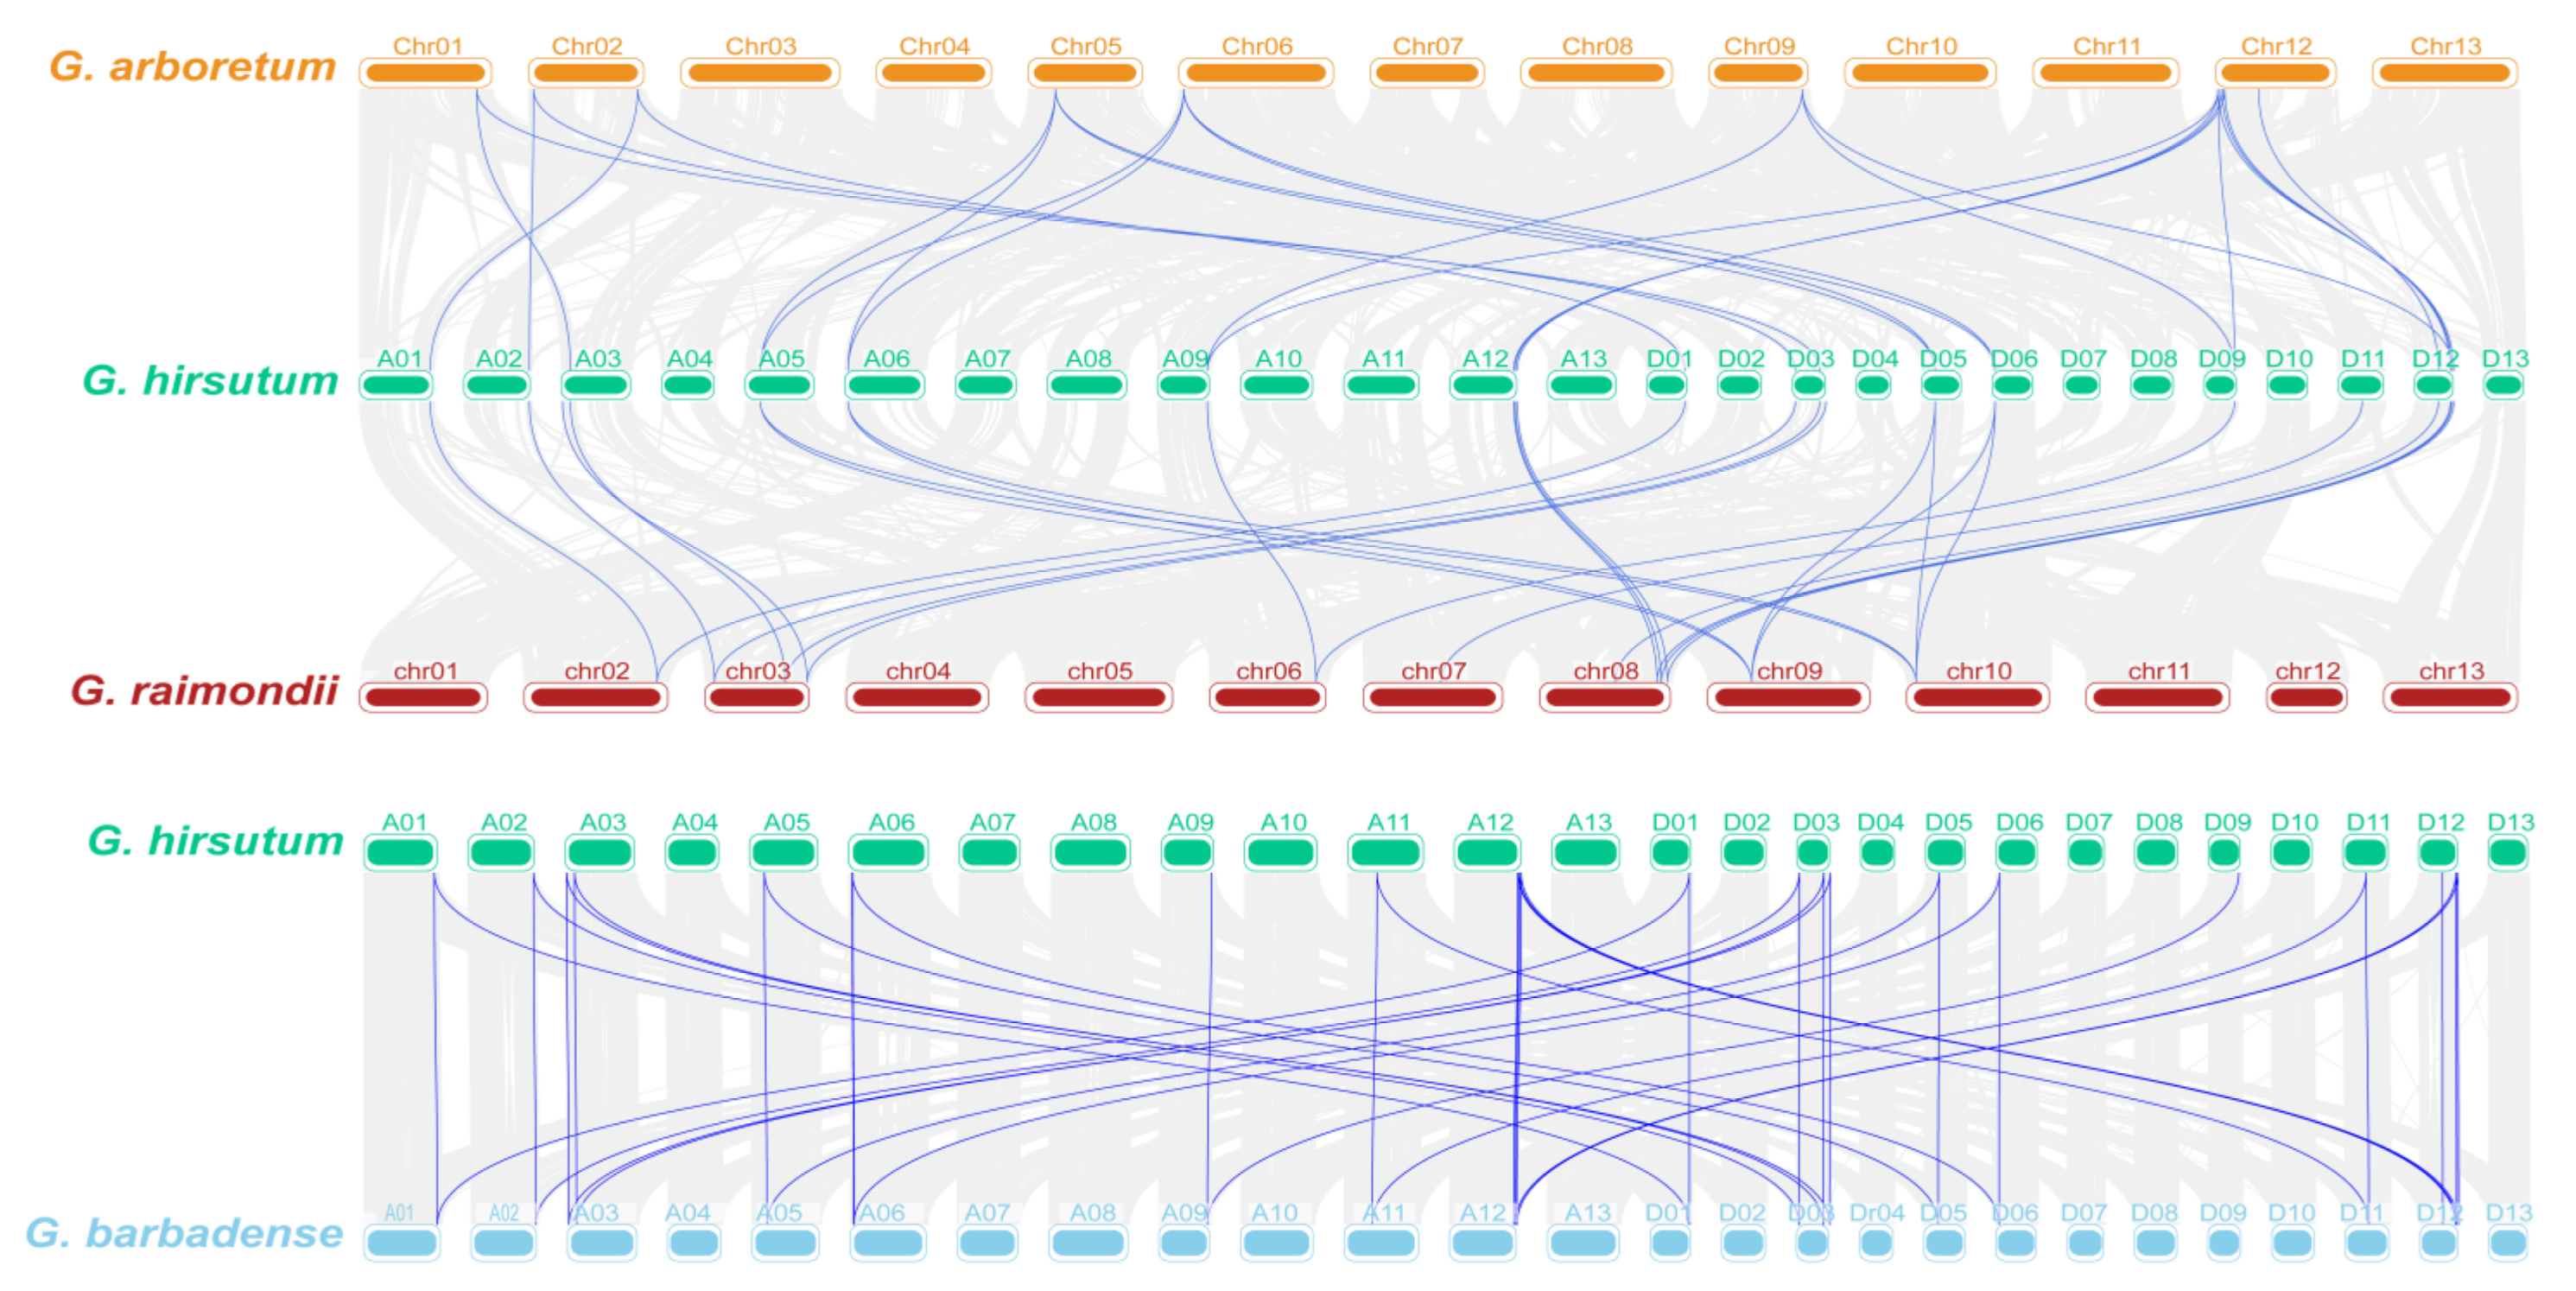
2.4. Chromosomal Distribution and Homology Analysis of TPP Genes

Based on the structural annotation information of the 79 TPP family genes, we generated chromosomal distribution maps for G. arboreum, G. raimondii, G. hirsutum and G. barbadense (Figure 3). In the G. arboreum A genome, 17 TPP family genes were located on 10 chromosomes; of these chromosomes, Ga01, Ga02 and Ga12 contained 3, 3 and 4 GaTPPs, respectively, and the remaining 7 GhTPPs were distributed across the other 7 chromosomes. A total of 12 GrTPPs were located on 7 chromosomes in the G. raimondii D genome, of which the Gr03 and Gr08 chromosomes contained 3 and 4 GrTPPs, respectively. The remaining 5 GrTPPs were located on Gr02, Gr06, Gr07, Gr09, and Gr10. In G. hirsutum, 24 GhTPPs were localized to 15 chromosomes; chromosomes A12, D03, and D12 contained 3, 3, and 4 GhTPPs, respectively; and the remaining 12 chromosomes had only 1 or 2 GhTPPs. A total of 26 GbTPPs were found on 15 chromosomes in G. barbadense, with 3, 3, 3 and 4 GbTPPs located on chromosomes A01, A12, D03 and D12, and the remaining 14 GbTPPs were located on 11 chromosomes. Differences in chromosomes A01, A08 and D09 were found between G. hirsutum and G. barbadense, which suggested that duplication and deletion possibly occurred during evolution.
To further explore the evolutionary relationship of the TPP gene family in cotton, we identified all homologous genes between G. hirsutum and G. arboreum, G. hirsutum and G. raimondii, and G. hirsutum and G. barbadense and then analysed the collinearity of the TPP family genes (Figure 4). The results showed that no tandem duplications occurred in the four cotton species. The 24 TPP family genes of G. hirsutum had corresponding homologues in G. arboreum and G. raimondii, among these genes, 19 TPP genes had homologues in both G. arboreum and G. raimondii, 2 had homologues only in G. arboreum, and 3 had homologues only in G. raimondii. The collinear relationships between G. barbadense and G. hirsutum indicated that GbTPP1 and GbTPP10 had no corresponding homologues in G. hirsutum; thus, these genes might have originated from independent events during the evolutionary process of G. barbadense and TPP genes may have evolved divergently in G. barbadense.

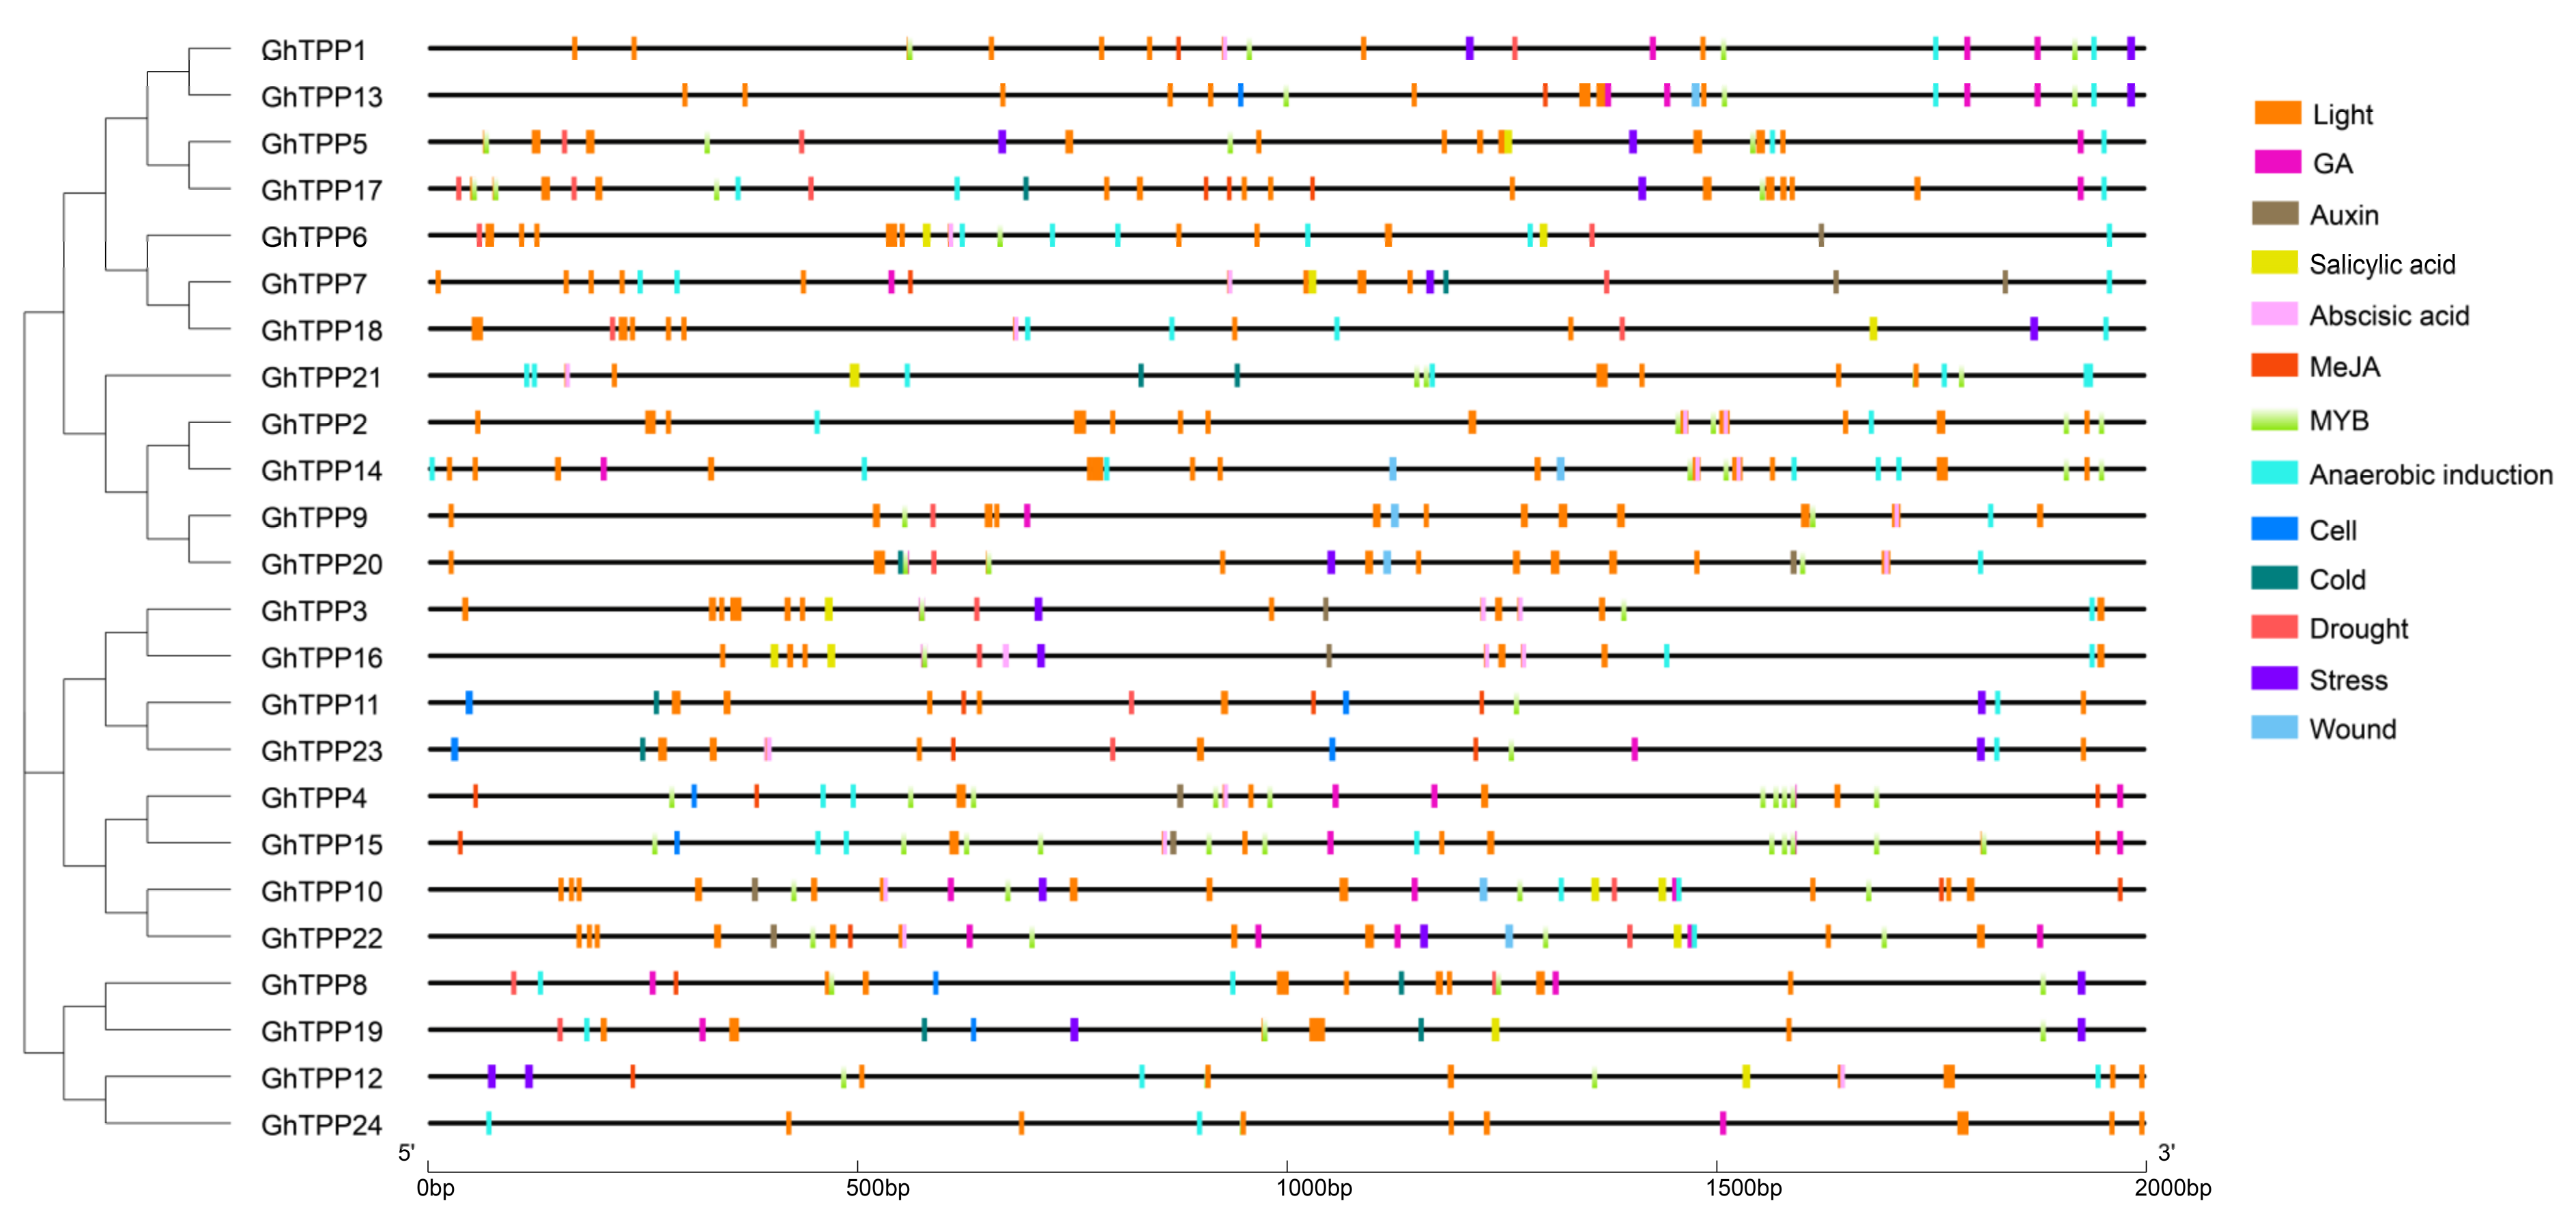
2.5. Prediction and Analysis of Cis-Acting Elements in Promoter Regions

Cis-acting elements can influence and regulate gene expression by binding to transcription factors. We predicted and analysed the cis-acting elements within the promoter regions of the TPP family genes in G. hirsutum and found that TATA boxes, CAAT boxes and other typical cis-acting elements were present in the promoter regions of TPP genes. The relevant details are presented in Table S2. We investigated the cis-acting elements related to hormones and stress responses (Figure 5); based on the analysis, the promoter regions of TPP genes in G. hirsutum did not contain elements related to the response to high-temperature stress but contained a large number of light signal response elements (G-boxes, GT1 motifs, TCT motifs, etc.). With the exception of GhTPP5/8/11/17/19, all TPP genes contained ABA-associated elements (ABREs). Most members of the TPP family contained various hormone-responsive elements as well as environmental stress-responsive elements, e.g., gibberellic acid (GA) response elements (GARE motifs, P-boxes and TATC boxes), indoleacetic acid (IAA) response elements (AuxRR cores and TGA elements), methyl jasmonate (MeJA) response elements (CGTCA motifs and TGACG motifs), salicylic acid (SA) response elements (TCA elements), drought response elements (MBSs), low-temperature response elements (LTRs), defence elements, stress response elements (DRSs) and antioxidant response elements (AREs). It is hypothesized that the TPP family genes of G. hirsutum may be involved in the response to hormone regulation and resistance to abiotic stress.

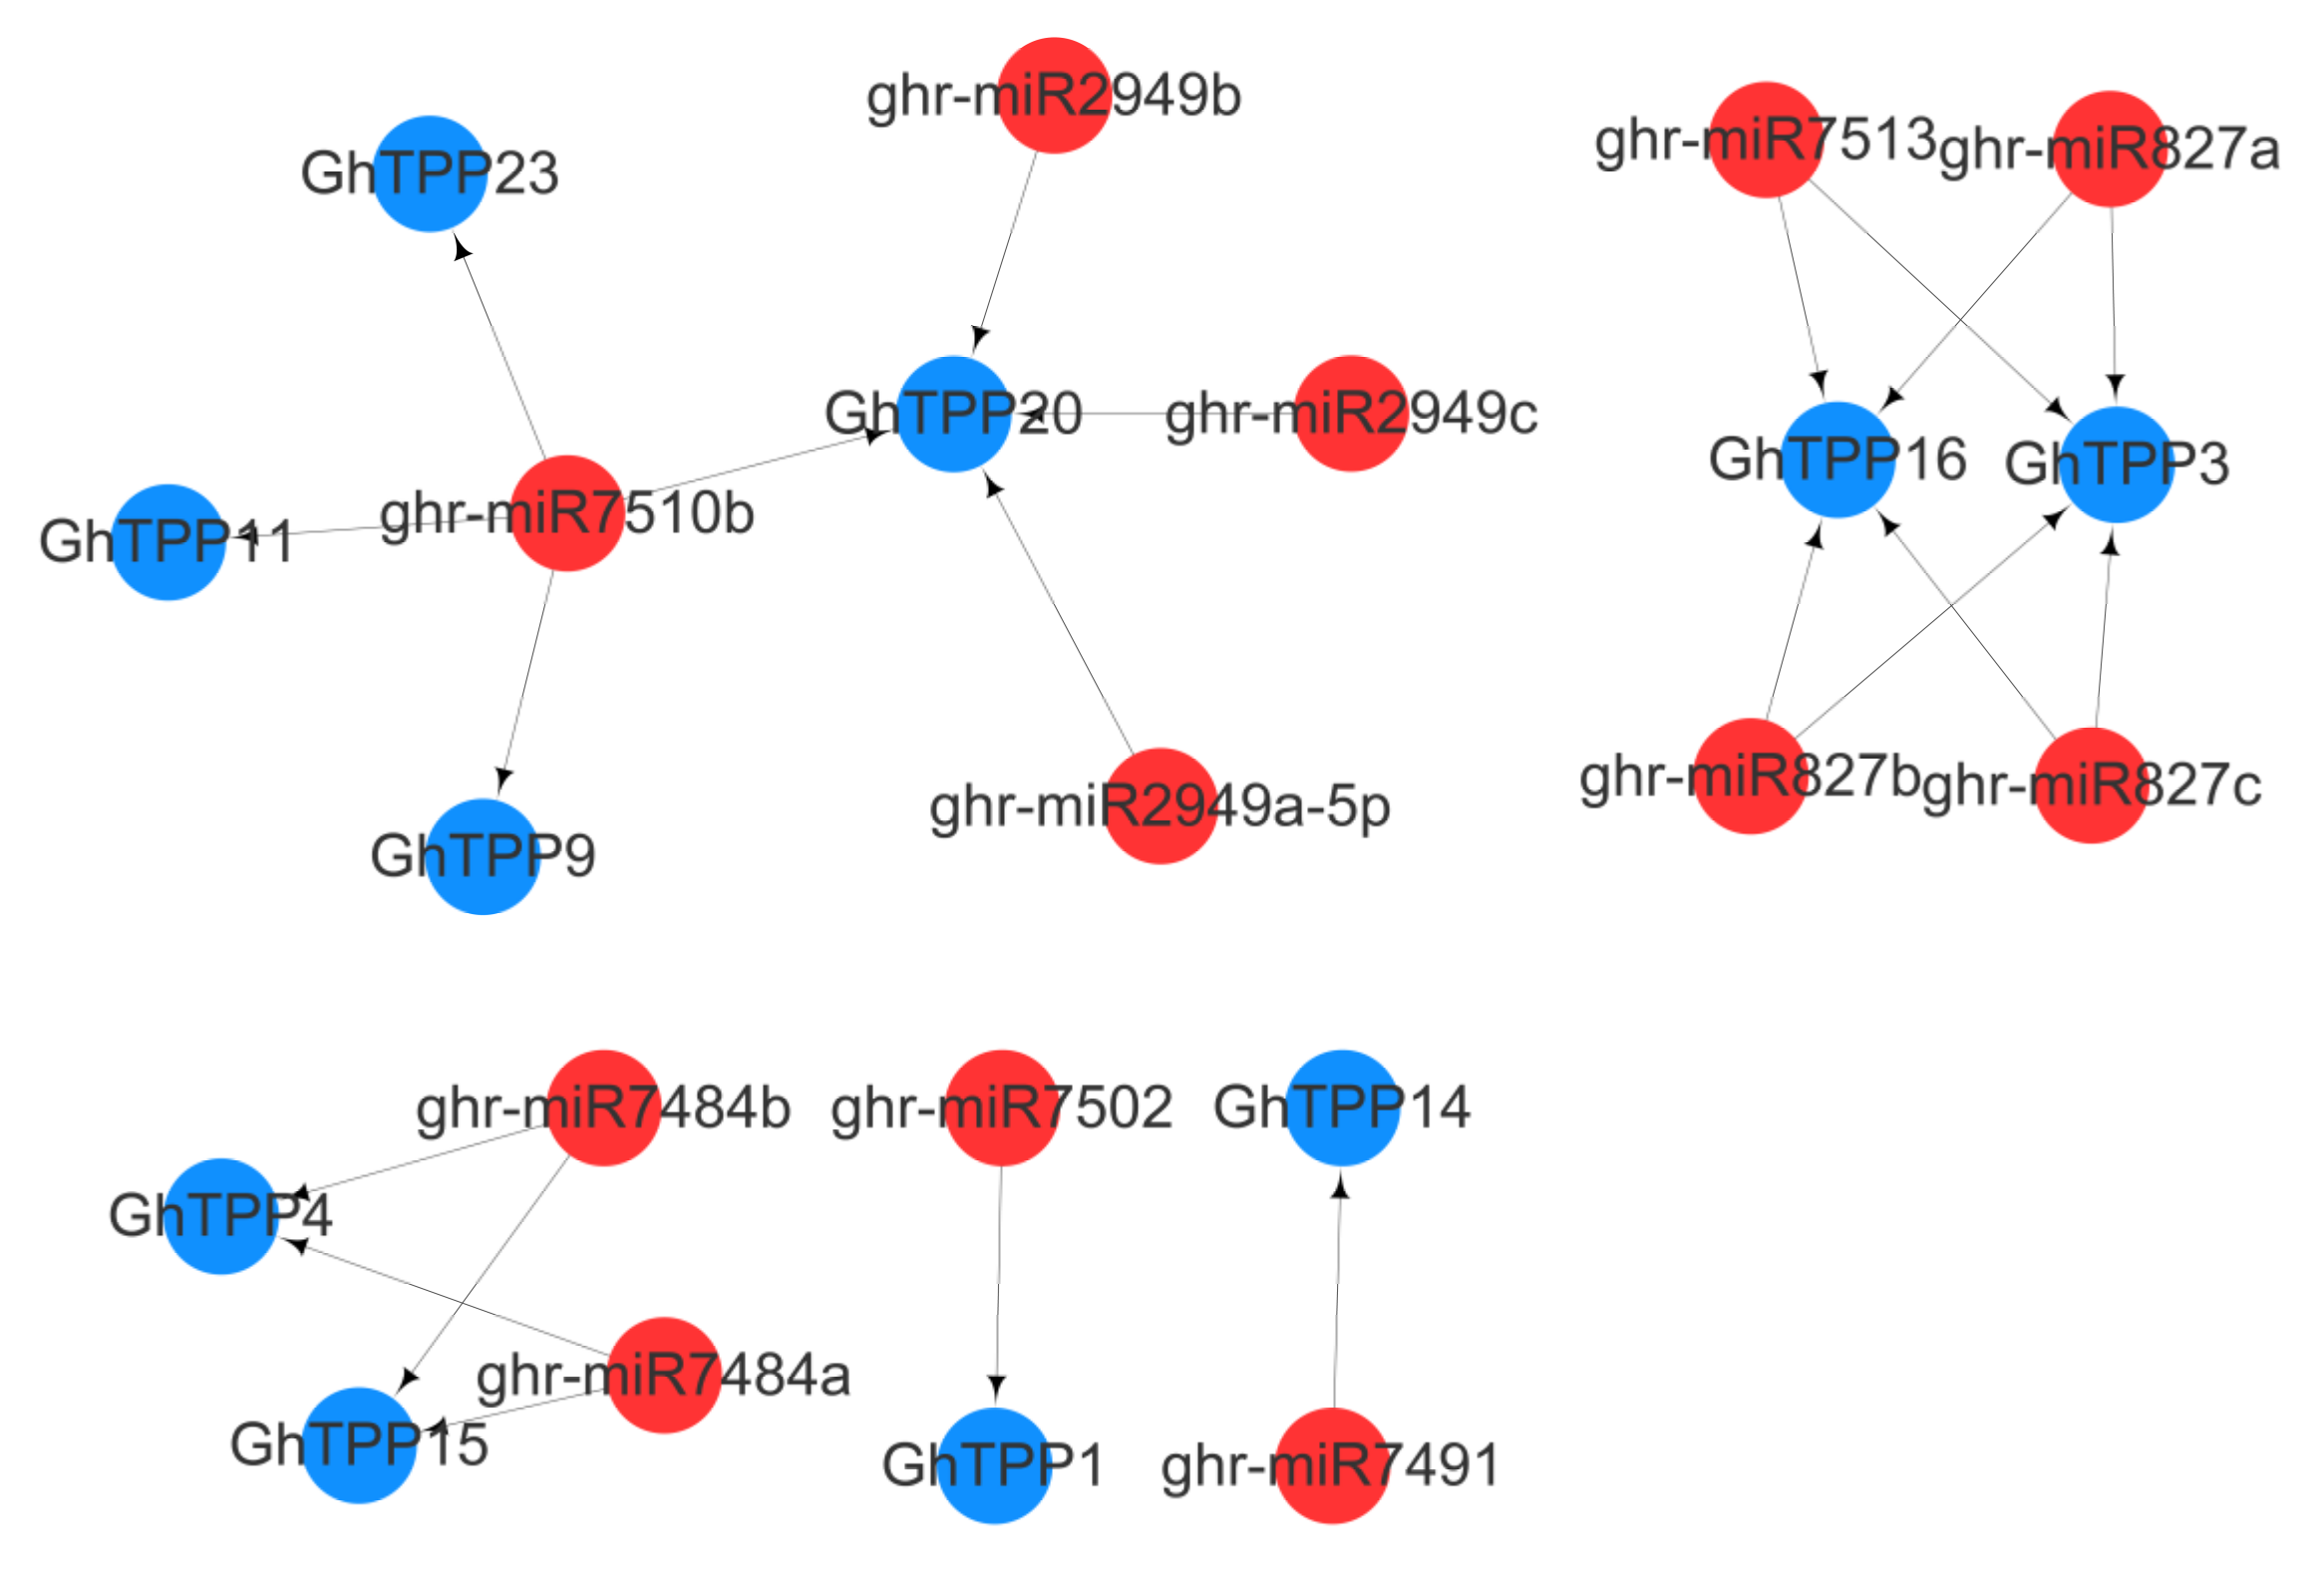
2.6. Prediction of miRNAs Targeting TPP Family Genes

The miRNAs are a class of noncoding single-stranded RNA molecules that have a length of approximately 22 nucleotides, are encoded by endogenous genes and are involved in gene expression regulation and responses to biotic and abiotic stress in plants. We predicted miRNA-targeting gene networks of TPP family genes in G. hirsutum (Figure 6) and identified a total of 21 interaction relationships. The interaction network comprised 12 miRNAs, and 10 TPP family genes were targeted. Among the genes, ghr-miR7510b was involved in regulation of the expression of four TPP genes, GhTPP9/11/20/23. GhTPP3, GhTPP16, and GhTPP20 are each targeted by four miRNAs, and GhTPP3 and GhTPP16 are targeted by the same miRNAs. GhTPP1, GhTPP4, GhTPP14 and GhTPP15 are the target genes of ghr-miR7484b, ghr-miR7484a, ghr-miR7502 and ghr-miR7491, respectively.

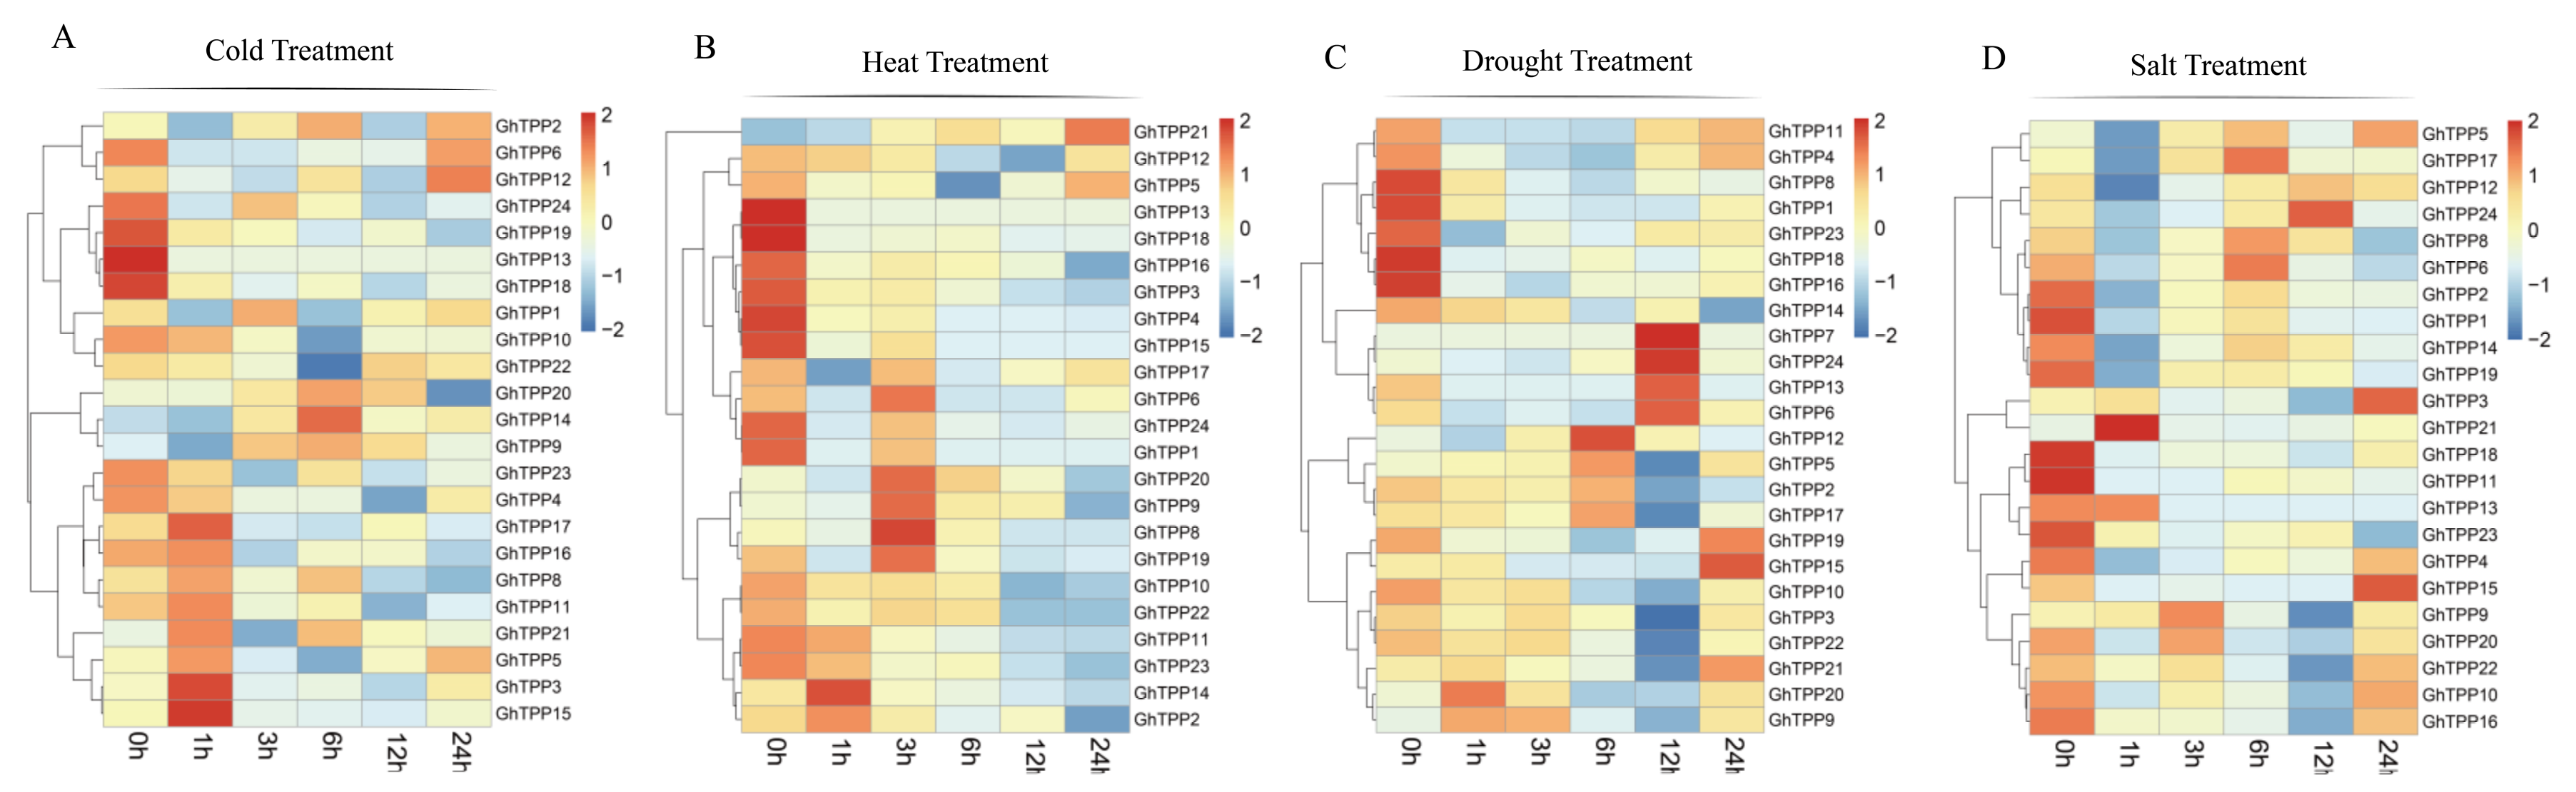
2.7. Analysis of the Expression Patterns of TPP Family Members in Response to Abiotic Stress

Previous studies have confirmed that plants can respond to abiotic stresses through the synthesis of trehalose. Therefore, studying the expression patterns of genes that encode TPPs under various stresses is very important. Therefore, we obtained and analysed the expression patterns of TPP family members in TM-1 plants under cold, heat, drought and salt stress conditions.
The expression patterns of TPP family genes differed under the same stress conditions, and the expression patterns of the same genes also differed under different stresses. The expressions of GhTPP23, GhTPP4, GhTPP17, GhTPP16, GhTPP8, GhTPP11, GhTPP21, GhTPP5, GhTPP3, and GhTPP15 were induced after cold treatment for 1 h (Figure 7A) and may thus be more sensitive to cold stress. GhTPP17, GhTPP6, GhTPP24, GhTPP1, GhTPP20, GhTPP9, GhTPP8, and GhTPP19 were upregulated after 3 h of high-temperature treatment, and the expression of GhTPP21 continued to increase with increasing high-temperature treatment (Figure 7B). The expression levels of GhTPP11, GhTPP4, GhTPP8, GhTPP1, GhTPP23, GhTPP16, and GhTPP18 were low during the first 6 h under drought stress but began to increase after 12 h. GhTPP7, GhTPP24, GhTPP13, and GhTPP6 were highly expressed at 12 h, while GhTPP12, GhTPP5, GhTPP2, and GhTPP17 were upregulated at 6 h. The expression levels of the remaining eight genes (GhTPP19, GhTPP15 GhTPP10, GhTPP3, GhTPP22, GhTPP21, GhTPP20, and GhTPP9) ranged from high to low, but the expression of these genes increased later (Figure 7C). Compared with other stresses, TPP genes were not sensitive to the onset of salt stress (Figure 7D); most genes were expressed at low levels before 6 h, and GhTPP4, GhTPP15, GhTPP9, GhTPP20, GhTPP22, GhTPP10 and GhTPP16 did not play a role until 24 h. In summary, the results indicated that the expression of most TPP genes was induced in response to different stresses.

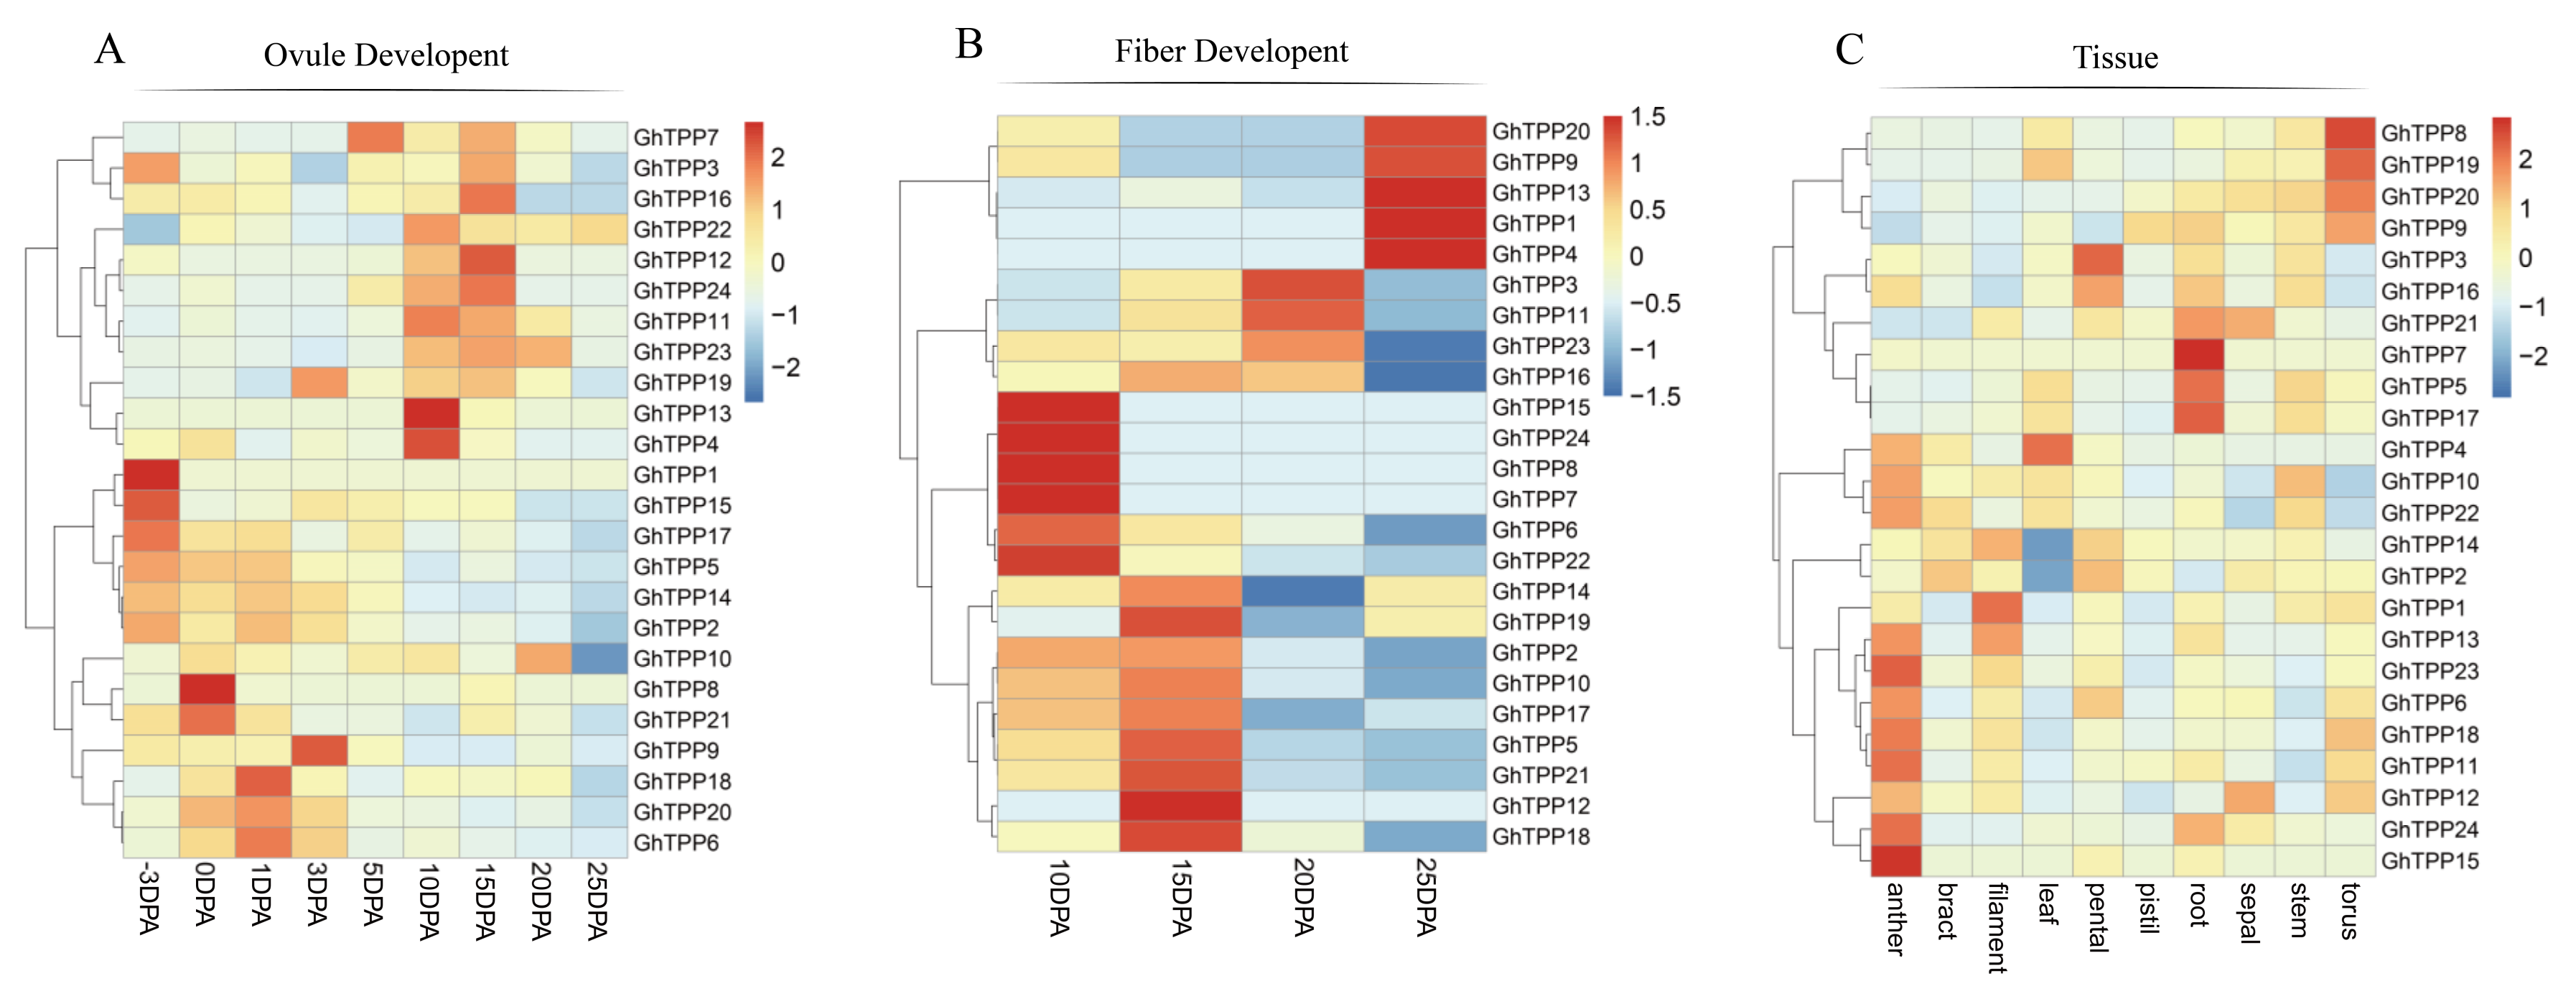
2.8. Expression Pattern Analysis in Different Tissues and at Different Growth Stages

To further understand the specific functions of TPP family genes in cotton growth and development, we downloaded and analysed the transcriptomic data of TPP family genes for ovule tissue at −3/0/1/3/5/10/15/20/25 days post-anthesis (DPA); fibre tissue at 10/15/20/25 DPA; and anther, bract, filament, leaf, petal, pistil, root, sepal, stem and torus tissues from TM-1 plants.
During ovule development, the TPP family genes could be divided into two groups based on a cluster analysis (Figure 8A). The first group of TPP genes (GhTPP7-GhTPP4) were upregulated at 10 DPA and 15 DPA, whereas the other group of TPP family genes were functional at the fibre initiation stage (−3 to 3 DPA). During fibre development, TPP family genes were expressed at all four time points (10/15/20/25 DPA), and each gene showed high expression at only one time point (Figure 8B). In conclusion, TPP family genes are expressed at both the initiation and elongation stages of cotton fibres, and different TPP genes function at different time points.
The expression levels of different TPP family genes also differed among different tissues (Figure 8C). GhTPP8/19/20 were more highly expressed in the torus, and GhTPP21/7/5/17 were highly expressed in roots, and GhTPP7 was specifically expressed only in the roots. GhTPP13/23/6/18/11/12/24/15 were most highly expressed in the anthers, which is consistent with previous reports that TPPs could regulate the development of floral organs by regulating the sucrose status of plants. Therefore, the expression of TPP family genes is induced by stress, but these genes may also participate in the growth and development processes of different organs of cotton.

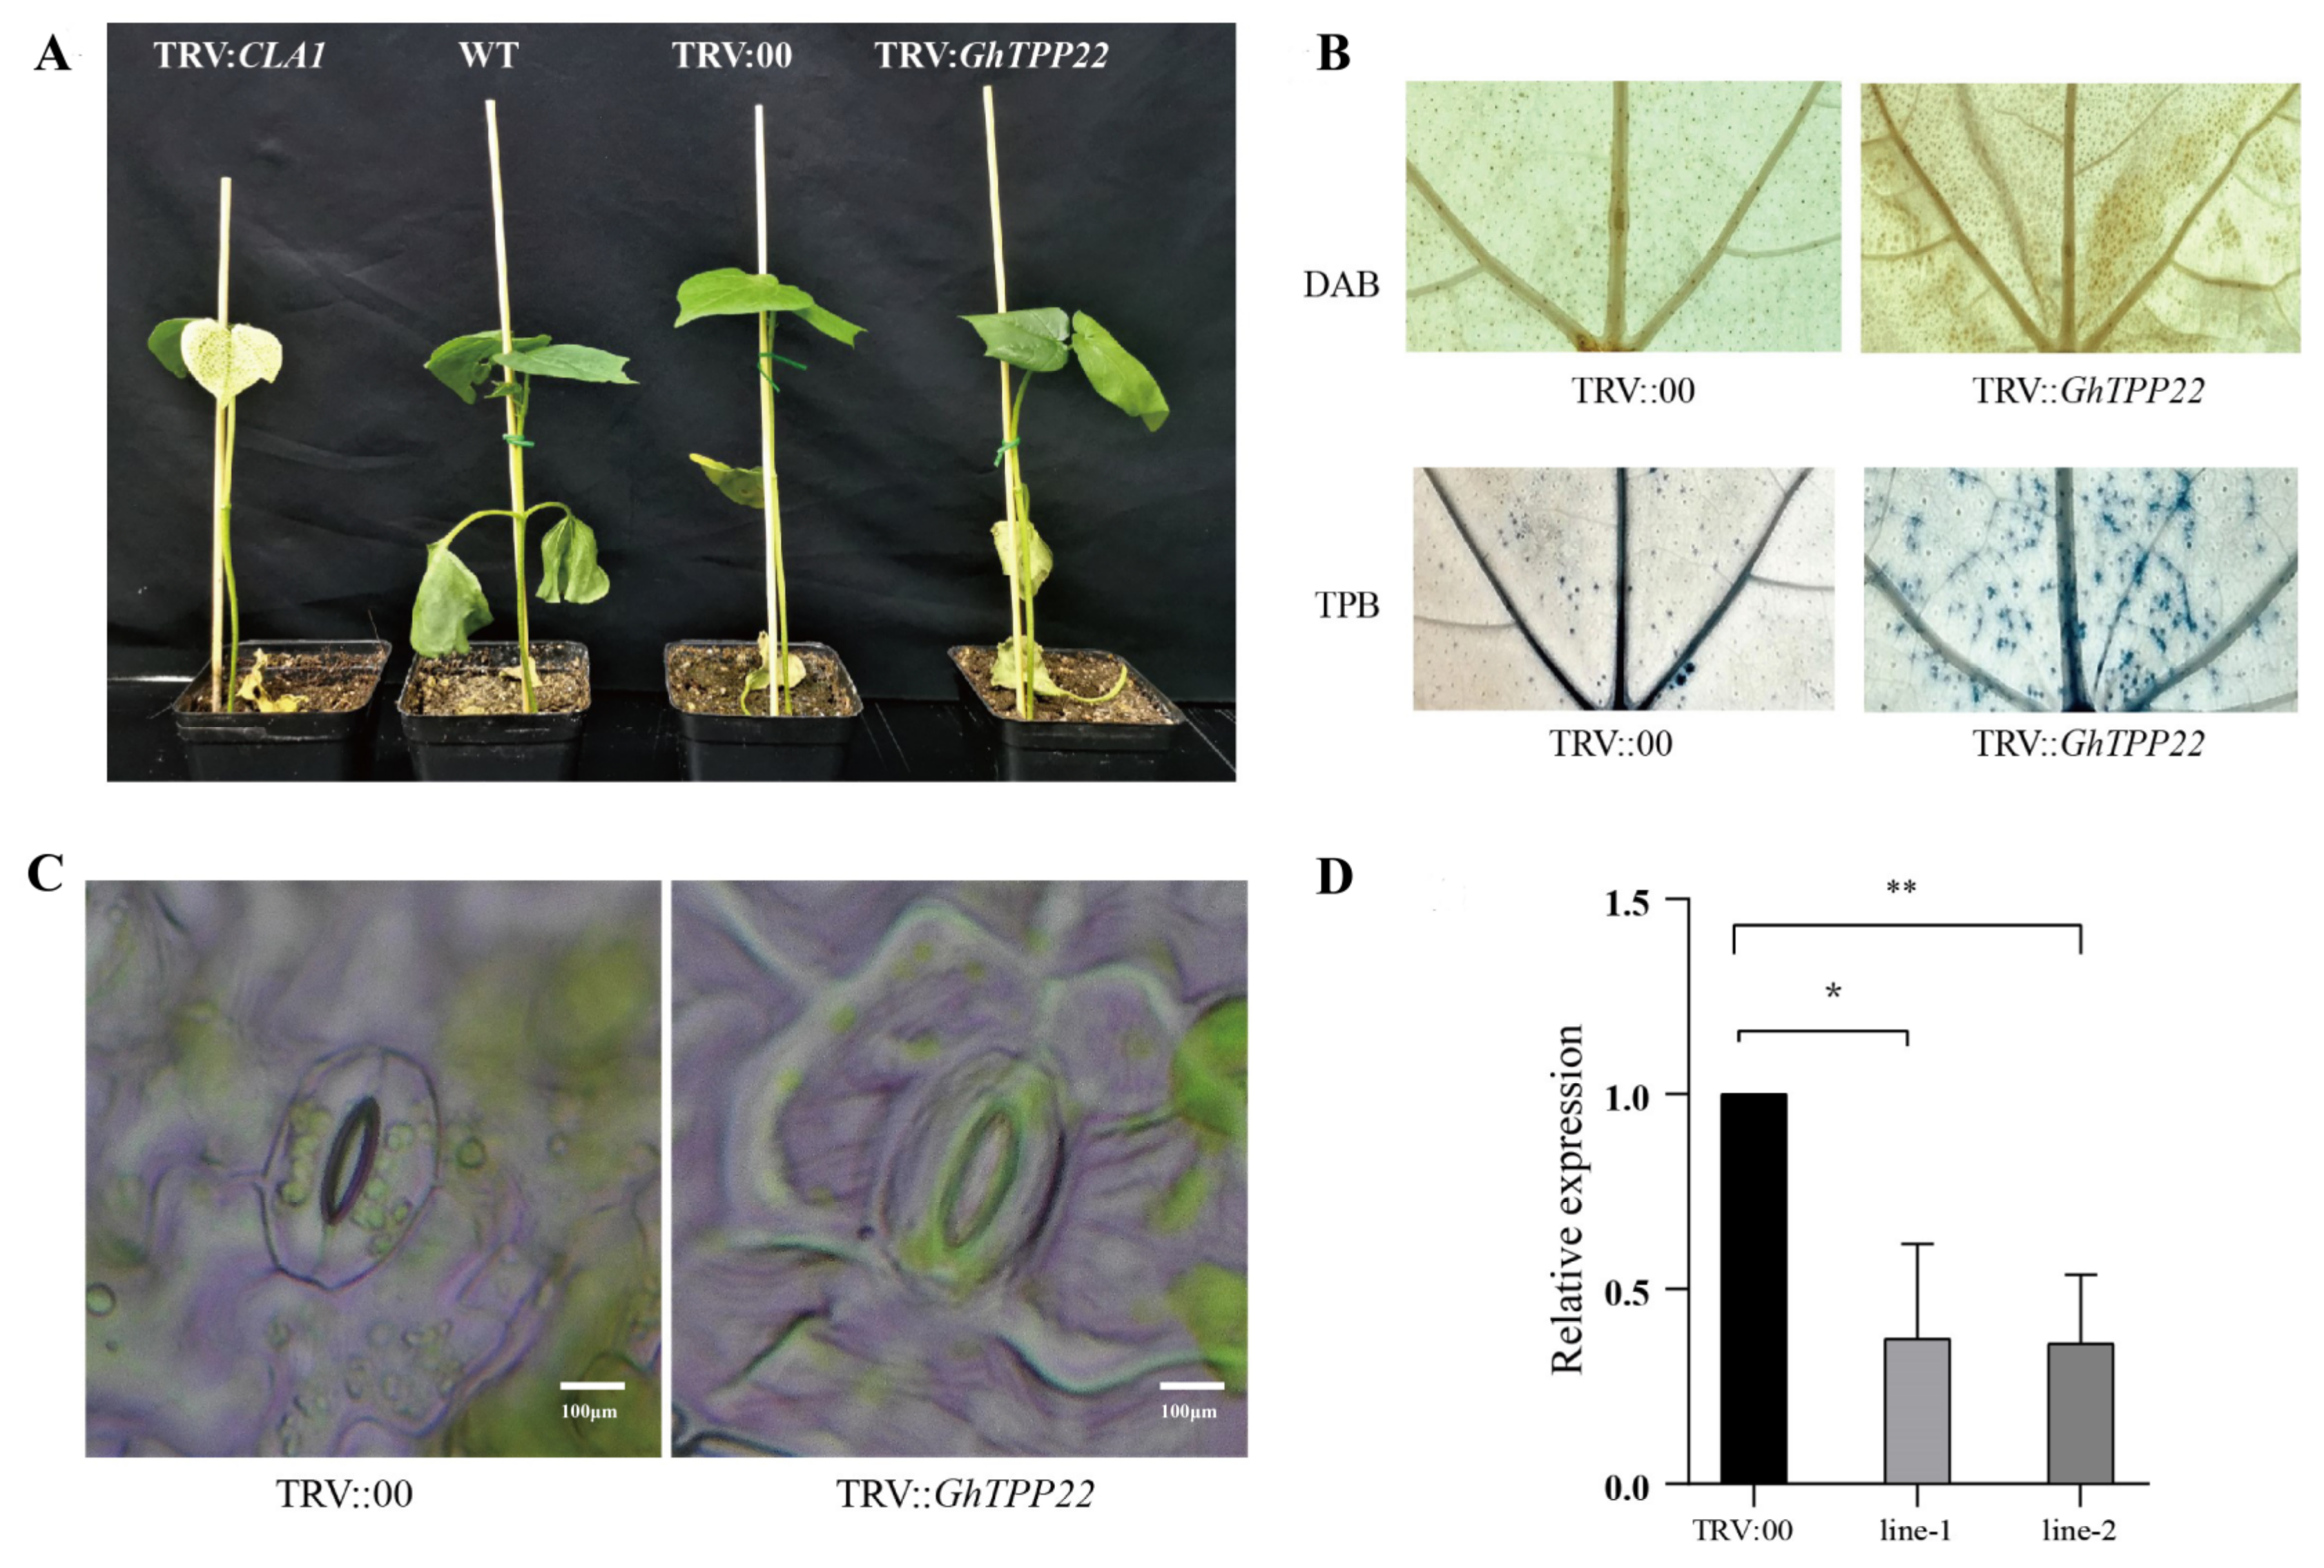
2.9. Analysis of the Function of GhTPP22 in Cotton in Response to Stress

In this experiment, the effects of GhTPP22 on plant development under drought stress were preliminarily studied due to its higher expression level. We constructed a TRV:GhTPP22 virus-induced gene silencing (VIGS) vector and subjected the test plants to drought treatment. The results showed that after 15 days of drought treatment, TRV:00 and wild-type (WT) plants developed normally, whereas the leaves of GhTPP22-silenced plants were wilted (Figure 9A), which indicated that plants were more sensitive to drought stress after the silencing of GhTPP22. It was previously reported that genes tend to help plants resist drought stress through stomatal closure, thus, we assessed the stomatal closure of the tested plants. Most stomata of the TRV:GhTPP22 plants were partially closed, and the degree of closure was greater in TRV:00 plants (Figure 9C). According to the qPCR assay results, the relative expression of GhTPP22 in the TRV:GhTPP22 plants was lower than that in the TRV:00 plants, which indicated that GhTPP22 was silenced (Figure 9D).
Under drought stress, plants generate a large number of reactive oxygen species (ROS), which damage cells. In Arabidopsis, the ROS content was significantly higher in AtTPPB mutants under drought stress, whereas the ROS content was lower in plants overexpressing AtTPPB, which suggested that TPPs may protect the stability of cell membranes by interfering with the removal of ROS and thus participate in the drought resistance of plants. To verify whether the function of TPPs in cotton is the same as that of AtTPPB, the H2O2 content in the different lines was determined by the DAB staining of TRV:00 and TRV:GhTPP22 leaves. The results showed that the TRV:GhTPP22 plants exhibited larger brown areas and showed deeper staining, and trypan blue staining revealed more dead cells in the TRV:GhTPP22 plants (Figure 9B), which indicated that the silencing of GhTPP22 reduced the ability of plants to scavenge ROS and led to cell death.

3. Discussion

With the continuous development of sequencing technology, the genomes of G. arboreum, G. raimondii, G. hirsutum, and G. barbadense have been sequenced successively [20,21,24], and studies on gene families have shown gradual increases in detail and comprehensiveness. Here, we identified 17, 12, 24, and 26 TPP family genes in the G. arboreum, G. raimondii, G. hirsutum, and G. barbadense genomes, respectively, and carefully studied their structure and evolutionary selection, the cis-elements in their promoters and the physicochemical properties of their encoded proteins. G. arboreum and G. raimondii provided the At and Dt subgenomes for G. hirsutum and G. barbadense, respectively, via genome-wide replication events [20,25], which is the main method of gene family expansion, followed by tandem duplication, segmental duplication via retrotransposition and exon duplication and shuffling [26,27]. In this study, no tandem duplication was observed in the TPP gene family, but the genes may have undergone independent evolutionary processes in G. hirsutum and G. barbadense according to the collinearity analysis. Duplication events such as segmental replication have played critical roles in expanding the gene family members in plants [28,29]. In addition, mutation event coding sequences and regulatory regions can cause variations in the functions of gene family members [30,31].
Trehalose plays important roles in embryonic development, inflorescence formation, cellular morphogenesis and signal transduction. Differences in tissue expression are the result of selective gene expression. The expression of TPP genes, which encode the expression of the key enzyme in the last step of trehalose synthesis, directly affects the trehalose content. In this study, we analysed the expression patterns of TPP genes in different tissues of G. hirsutum and found that the expression of TPP genes exhibited significant differences among different tissues, with higher expression occurring mainly in the roots, torus and anthers, which is consistent with the results for Arabidopsis [32]. Moreover, TPP genes were highly expressed in the ovules from −3 to 3 DPA and 10 to 25 DPA in fibre, which suggested that these genes may also play a key role in fibre initiation and elongation. Trehalose exerts a specific effect on improving the resistance of plants to different stresses [33], but the amount of trehalose that accumulates in plants is not sufficient for it to act as a sole regulator in improving plant resistance; instead, trehalose is more likely to participate in signal transduction as a signalling molecule to regulate the expression of other downstream genes and improve stress resistance [16].
As the intermediate of the trehalose synthesis process, T6P is an important signal transduction mediator that participates in the regulation of plant growth and development, and the treatment of Arabidopsis with T6P can lead to stomatal closure and thus a response to drought stress. Plants with TPP gene silencing may accumulate T6P, which may lead to stomatal closure. Changes in the T6P content have an important impact on plant growth and development [34]. A mutant TPS1 phenotype in Arabidopsis is reportedly lethal to embryos, and deletion of the TPS gene leads to a reduction in the T6P content in plants and thus results in abnormal growth. In addition, the accumulation of T6P in Arabidopsis under trehalose treatment can inhibit growth [35]. SnRK1s constitute a class of protein kinases that are widely present in eukaryotes, can sense the balance of energy and homeostasis in plants, and are involved in the stress response [36]. In plants, the accumulation of T6P can inhibit the activity of SnRK1 protein kinase [15,37,38], and in peas (Pisum sativum) specifically, it can inhibit the activity of SnRK1, and increase the concentration of T6P in embryos. The T6P/SnRK1 signalling pathway plays an extremely important role in signal regulation for plant sucrose metabolism [39]. For example, this pathway is involved in plant respiration, starch synthesis, starch and sucrose metabolism, and even ABA accumulation. Baena-González et al. [40] observed that overexpression of AtKIN10 in Arabidopsis affected the inflorescence structure and also delayed the flowering period. By studying the growth of wheat at 10 DPA, Martinez-Barajas et al. [41] noted that the T6P/SnRK1 signalling pathway is involved in multiple growth and developmental stages of barley, including in the physiological regulation of grains, seeds coats and embryos, and can also regulate the “library” organs or cells of plants such as potato, sugarcane and cucumber [42,43,44]. In addition, a study found that Arabidopsis mutants lacking TPS6 exhibited more inflorescence branches [45]. Therefore, decreased SnRK1 activity may indirectly affect the concentration of T6P. Under normal circumstances, after drought stress, TPP gene products consume T6P to synthesize trehalose, and SnRK1 activity increases, leading to increased resistance to drought stress. Thus, TPP genes may be involved in regulating the balance between T6P and SnRK1 in response to abiotic stress in plants. A recent report suggested that accumulated T6P may destroy actin organization, which would further impair the cell wall and influence fungal development and pathogenicity [46]. The above reports reveal the diversity of T6P functions. TPP genes can catalyse the decomposition of T6P to trehalose-6-phosphate and a phosphate group [32]; thus, we speculated that TPP genes may affect the normal growth of plants by regulating the concentration of T6P.
Stomatal closure is an important strategy used by plants to resist drought stress and is induced by a complex regulatory network. To date, the regulation of stomatal closure by trehalose and TPP genes has been reported only in A. thaliana [12,47]. The application of exogenous trehalose and ABA can lead to stomatal closure in plants with superimposed effects [47]. Water use efficiency is important for plants under drought stress [48]. Recent studies have shown that AtTPPI can reduce transpiration through stomatal closure and thereby improve water use efficiency [12]. In our experiment, GhTPP22 silencing resulted in significantly increased stomatal opening compared with that in the control, and the TRV:TPP22 plants were more sensitive to drought, which indicated that GhTPP22 may have the same function in the resistance to drought stress in cotton.
Plants subjected to adverse stress generate ROS, resulting in oxidative stress and damage to cells. Studies have shown that TPP genes can respond to drought stress by inducing ROS scavenging. Some studies have also shown that ROS are involved in trehalose-induced stomatal closure [49], while another study found that AtTPPE stimulated metabolism by inducing the accumulation of ROS in roots [47]. Our findings support the former result. In the present study, the DAB staining results revealed substantial accumulation of ROS in the TRV:TPP22 plants compared with the control plants. These results indicated that the ROS scavenging capacity decreased after gene silencing.
TPP family genes are key genes involved in trehalose synthesis, and their transcription and expression may be important for plant protection under adverse conditions. Members of the TPP gene family have been identified in Arabidopsis [11,12,50,51], rice [13,16,52], maize [10,18] and dicotyledonous short-stalked grass species [9], and among these, Arabidopsis and rice have been studied in greater detail. Overexpression of OsTPP1 in rice can enhance tolerance to stress, and an analysis of overexpression lines showed that OsTPP1 can trigger the expression of abiotic stress response-related genes, which suggested that OsTPP1 stress-induced reprogramming may involve transcriptional regulatory pathways [16]. In this study, we used VIGS to silence GhTPP22, and the silenced plants were more sensitive to drought stress than the WT and TRV:00 plants. Moreover, qPCR assays revealed a reduction in GhTPP22 expression. We believe that GhTPP22 can respond to drought stress by regulating the excess ROS content in new leaves and the stomatal radius. However, whether the scavenging of ROS occurs due to osmoprotection caused by trehalose has not been definitively determined.
Trehalose can regulate the characteristics of stomatal movement and effectively induce stomatal closure, which is of great significance for enhancing plant stress resistance, reducing transpiration-related water loss and improving crop water use efficiency. The negative impacts of climate change on the ecological environment and social economy are becoming increasingly prominent. Countermeasures to reduce greenhouse gas emissions are urgently needed. A large number of studies, including this study, have shown that trehalose plays an important role in plant tolerance to abiotic stresses such as drought, high salinity and high temperature. However, because plant stress resistance is an extremely complex physiological process, it is controlled by multiple genes, and the effect of single-gene genetic transformation on improving plant stress resistance is limited. Sazzad et al. [53] proposed that the addition and application of promoters of TPS/TPP genes can solve the change in plant shape of TPS/TPP genes. It is one of the research hotspots to use the defence reactions of trehalose to breed varieties with drought and salt stresses. With the deepening understanding of the specific biological functions of trehalose, it is expected to play a more important role in crop stress resistance breeding.

4. Conclusions

In this study, 17, 12, 26, and 24 TPP family genes were identified in G. arboreum, G. raimondii, G. barbadense and G. hirsutum, respectively, and the chromosomal location, structure, and evolution of these TPP family genes in cotton as well as the physicochemical properties of their encoded proteins were analysed. The 79 TPP genes were divided into three groups by phylogenetic analysis. There was no tandem duplication in the TPP gene family, but different evolutionary directions were observed in G. hirsutum and G. barbadense. VIGS experiments showed that plants were more sensitive to drought stress after GhTPP22 was silenced. Further research revealed that stomatal closure and scavenging of ROS decreased in silenced plants compared to the control. Overall, GhTPP22 plays a key role in drought stress. Our experiment provides new ideas for improving drought resistance for cotton breeding in the future.

5. Materials and Methods

5.1. Identification and Physicochemical Properties of the TPP Gene Family in Cotton

The genome files, general feature format files (GFF3) and the protein sequences of G. hirsutum (CRI), G. barbadense (HAU), G. arboreum (CRI) and G. raimondii (JGI) were downloaded from the Cotton Functional Genomics Database (CottonFGD, https://cottonfgd.org/ (accessed on 13 April 2022)) [54]. Similarly, sequence information for 10 members of the Arabidopsis TPP family was downloaded from the Arabidopsis Information Resource (TAIR) database (https://www.arabidopsis.org/ (accessed on 13 April 2022)). The sequences of the TPP family genes in Arabidopsis were aligned with those in cotton, and the sequences of the corresponding TPP family genes in cotton were obtained. The obtained protein sequences were then queried in the Conserved Domain Database on the NCBI website (https://www.ncbi.nlm.nih.gov/Structure/bwrpsb/bwrpsb.cgi (accessed on 13 April 2022)) [55] to identify their conserved structural domains and further confirmed using the HMM search function in HMMER 3.0. [56]. Information on the isoelectric point and relative molecular mass of the proteins was obtained using an online tool (https://web.expasy.org/compute_pi/ (accessed on 13 April 2022)) [57], and MapChart software (https://www.wur.nl/en/show/Mapchart/ (accessed on 13 April 2022)) [58] was used to visualize the chromosomal locations of the TPP family genes. The CELLO program (http://cello.life.nctu.edu.tw/ (accessed on 13 April 2022)) [59] was used to predict subcellular localization.

5.2. Phylogenetic Analysis

The protein sequences of TPPgenes in cotton and Arabidopsis were used to construct the phylogenetic tree. The MUSCLE module of MEGA 7.0 [60] software was used to align the sequences of the TPP gene family members in cotton and identify the best base substitution model. The JTT + G model was selected, and the maximum likelihood (ML) method was used to construct the phylogenetic tree; the bootstrap value was set to 1000. The results were visualized by EvolView (https://evolgenius.info//evolview-v2/#login (accessed on 13 April 2022)).

5.3. Gene Structure and Conserved Motif Analysis

The MEME online tool (http://meme-suite.org/ (accessed on 13 April 2022)) [61] was used to analyse the conserved motifs of the protein sequences encoded by TPP gene family members. The maximum number of lookups was set to 10, and the other parameters were set to the default values.

5.4. Analysis of the Promoters of the TPP Genes in G. Hirsutum

TBtools [62] was used to extract the 2000-bp sequence upstream of the coding DNA sequence (CDS) of TPP family genes by genome sequence file and GFF3 file. The PlantCARE (http://bioinformatics.psb.ugent.be/webtools/plantcare/html/ (accessed on 13 April 2022)) [63] was used for the analysis, and the obtained results were organized and visualized using the Genome Structure Display Server (GSDS) (http://gsds.gao-lab.org/index.php (accessed on 13 April 2022)) [64] online tool.

5.5. Homology Analysis of the TPP Gene Family Members

The protein sequences of the whole genomes of all four cotton species were aligned using BLAST, and MCScanX [65] software was used for collinearity analysis of the whole genomes to obtain block information and gene pair information data, which were subsequently visualized by TBtools.

5.6. Expression Profile Analysis of the TPP Gene Family in Different Tissues of Cotton and under Stress Conditions

Expression levels (FPKMs) of G. hirsutum TPP gene family members in eight tissues (roots, stems, leaves, pistils, stamens, calyxes, petals, and receptacles), ovules, and fibres at different developmental stages and under four types of stress (cold, heat, drought and salt stress) were from PRJNA490626 [20] and downloaded from CottonFGD. The transcriptomic data were normalized via log2(1 + fragments per kilobase of transcript per million mapped reads (FPKM)).

5.7. Prediction of microRNAs (miRNAs)

The psRNATarget server (https://www.zhaolab.org/psRNATarget/ (accessed on 13 April 2022)) [66] was used to predict the target relationships between miRNA and TPP genes in G. hirsutum. The miRNA data were also provided by the website. Steps were as follows: The CDS sequence of TPP genes in G. hirsutum were submitted as target candidates, and then, the published miRBase of G. hirsutum was chosen. The default option was selected for other parameters. The results were visualized by Cytoscape [67].

5.8. Functional Validation of the GhTPP22 Gene in G. Hirsutum

Using G. hirsutum TM-1 as the material, the function of GhTPP22 was preliminarily verified by VIGS. The 319-bp fragment of GhTPP22 was amplified from the cDNA library to construct the TRV::GhTPP22 vector and then transformed into Agrobacterium tumefaciens GV3101. TRV1, TRV:00, TRV:CLA1 and TRV::GhTPP22 were cultured overnight in LB medium supplemented with kanamycin and rifampicin (50 mg/L), and the cells were incubated in osmotic medium containing 10 mM MgCl2, 10 mM MES and 20 μM acetosyringone. After dark treatment for 3–6 h, A. tumefaciens medium containing TRV:00, TRV:CLA1 and TRV::GhTPP22 was mixed with TRV1 at 1:1 and injected into cotton cotyledons. The infiltrated plants were kept in darkness for one day at room temperature and then grown at 20 °C under a 16 h light/8 h dark cycle. The plants were kept without water to simulate drought conditions. After 15 days of VIGS treatment, the leaves of the cotton treatment group and control group were carefully removed and placed in l mg/mL 3,3’-diaminobenzidine (DAB) staining solution (pH = 3.8) overnight. The staining solution was then removed, and the leaves were decolorized with 96% ethanol for 12 h. The leaves were suspended in water, and a stereomicroscope was used to observe and photograph the leaves. Three sets of samples from different plants (15 days after injection) were collected as three biological replicates. RNA was extracted from each group of samples and reverse-transcribed to cDNA using Full-Style Gold EasyScript® One-Step gDNA Removal and cDNA Synthesis SuperMix. The same design was repeated three times for quantitative analysis. The qPCR tests were performed on QuantStudio 6 Flex thermocyclers (Applied Biosystems, Foster City, CA, USA) with a total volume of 10 μL, the protocol was as follows: (1) 95 °C for 5 min; (2) 95 °C for 30 s, 58 °C for 30 s, and 72 °C for 45 s for 40 cycles; and (3) 72 °C for 10 min. GhHistone3 was used as the endogenous standard control. The 2−ΔΔCT method [68] was used to calculate the relative expression level of TPP genes. The data were analysed by a t-text using GraphPad Prism. All the primers used in this experiment are listed in Table S3.

Supplementary Materials

The following supporting information can be downloaded at: https://www.mdpi.com/article/10.3390/plants11081079/s1, Table S1: The information of motifs; Table S2: The prediction details of cis-elements; Table S3: The primers in this experiment.

Author Contributions

W.W.: Data curation, Formal analysis, Visualization, Methodology, Writing original draft. H.C. and X.X.: Methodology, Investigation, Writing—original draft, Investigation. J.S.: Methodology, Conceptualization, Writing—review and editing. B.W.: Data curation, Formal analysis. Y.Z. (Yaxin Zhang): Investigation, Visualization. Q.Y. and Y.Z. (Yuping Zhao): Data curation, Formal analysis. T.Q. and G.L.: Funding acquisition, Supervision, Conceptualization, Writing and editing. All authors have read and agreed to the published version of the manuscript.

Funding

We would like to thank the Science and Technology Development Project of Henan Province (212102110054, 222102110146); Key Scientific Research Projects of Higher Education of Henan Province (22A210014);, Natural Science Foundation of Shandong Province (ZR2020QC026), and State Key Laboratory of Cotton Biology Open Fund (CB2021A02).

Institutional Review Board Statement

Not applicable.

Informed Consent Statement

Not applicable.

Data Availability Statement

The genome of four cotton species and RNA-seq data were downloaded from the CottonFGD website (https://cottonfgd.org/ (accessed on 13 April 2022)).

Conflicts of Interest

The authors declare no conflict of interest.

References

  1. Elbein, A.D.; Pan, Y.T.; Pastuszak, I.; Carroll, D. New insights on trehalose: A multifunctional molecule. Glycobiology 2003, 13, 17R–27R. [Google Scholar] [CrossRef] [PubMed]
  2. Paul, M.J.; Gonzalez-Uriarte, A.; Griffiths, C.A.; Hassani-Pak, K. The Role of Trehalose 6-Phosphate in Crop Yield and Resilience. Plant Physiol. 2018, 177, 12–23. [Google Scholar] [CrossRef] [PubMed] [Green Version]
  3. Bohnert, H.J. What makes desiccation tolerable? Genome Biol. 2000, 1, 1–4. [Google Scholar] [CrossRef] [PubMed] [Green Version]
  4. Avonce, N.; Mendoza-Vargas, A.; Morett, E.; Iturriaga, G. Insights on the evolution of trehalose biosynthesis. BMC Evol. Biol. 2006, 6, 109. [Google Scholar] [CrossRef] [PubMed] [Green Version]
  5. Iordachescu, M.; Imai, R. Trehalose Biosynthesis in Response to Abiotic Stresses. J. Integr. Plant Biol. 2008, 50, 1223–1229. [Google Scholar] [CrossRef]
  6. Van Houtte, H.; Vandesteene, L.; López-Galvis, L.; Lemmens, L.; Kissel, E.; Carpentier, S.; Feil, R.; Avonce, N.; Beeckman, T.; Lunn, J.E.; et al. Overexpression of the Trehalase Gene AtTRE1 Leads to Increased Drought Stress Tolerance in Arabidopsis and Is Involved in Abscisic Acid-Induced Stomatal Closure. Plant Physiol. 2013, 161, 1158–1171. [Google Scholar] [CrossRef] [Green Version]
  7. Glinski, M.; Weckwerth, W. Differential Multisite Phosphorylation of the Trehalose-6-phosphate Synthase Gene Family in Arabidopsis thaliana: A mass spectrometry-based process for multiparallel peptide library phosphorylation analysis. Mol. Cell. Proteom. 2005, 4, 1614–1625. [Google Scholar] [CrossRef] [Green Version]
  8. Prasad, Y.U.; Alexander, I.; Regina, F.; You, D.G.; Dirk, W.; Patrick, G.; Maria, P.; Petronia, C.; Hans-Michael, H.; Mark, S.; et al. The sucrose-trehalose 6-phosphate (Tre6P) nexus: Specificity and mechanisms of sucrose signalling by Tre6P. J. Exp. Bot. 2014, 65, 1051–1068. [Google Scholar]
  9. Wang, S.; Ouyang, K.; Wang, K. Genome-Wide Identification, Evolution, and Expression Analysis of TPS and TPP Gene Families in Brachypodium distachyon. Plants 2019, 8, 362. [Google Scholar] [CrossRef] [Green Version]
  10. Acosta-Pérez, P.; Camacho-Zamora, B.D.; Espinoza-Sánchez, E.A.; Gutiérrez-Soto, G.; Zavala-García, F.; Abraham-Juárez, M.J.; Sinagawa-García, S.R. Characterization of Trehalose-6-phosphate Synthase and Trehalose-6-phosphate Phosphatase Genes and Analysis of its Differential Expression in Maize (Zea mays) Seedlings under Drought Stress. Plants 2020, 9, 315. [Google Scholar] [CrossRef] [Green Version]
  11. Krasensky-Wrzaczek, J.; Broyart, C.; Rabanal, F.; Jonak, C. The Redox-Sensitive Chloroplast Trehalose-6-Phosphate Phosphatase AtTPPD Regulates Salt Stress Tolerance. Antioxid. Redox Signal. 2014, 21, 1289–1304. [Google Scholar] [CrossRef] [PubMed] [Green Version]
  12. Lin, Q.; Wang, S.; Dao, Y.; Wang, J.; Wang, K.; Wang, S. Arabidopsis thaliana trehalose-6-phosphate phosphatase gene TPPI enhances drought tolerance by regulating stomatal apertures. J. Exp. Bot. 2020, 71, 4285–4297. [Google Scholar] [CrossRef] [PubMed] [Green Version]
  13. Wang, G.; Li, X.; Ye, N.; Huang, M.; Feng, L.; Li, H.; Zhang, J. OsTPP1 regulates seed germination through the crosstalk with abscisic acid in rice. New Phytol. 2021, 230, 1925–1939. [Google Scholar] [CrossRef] [PubMed]
  14. Zhao, M.-L.; Ni, J.; Chen, M.-S.; Xu, Z.-F. Ectopic Expression of Jatropha curcas TREHALOSE-6-PHOSPHATE PHOSPHATASE J Causes Late-Flowering and Heterostylous Phenotypes in Arabidopsis but not in Jatropha. Int. J. Mol. Sci. 2019, 20, 2165. [Google Scholar] [CrossRef] [PubMed] [Green Version]
  15. Smeekens, S. From Leaf to Kernel: Trehalose-6-Phosphate Signaling Moves Carbon in the Field. Plant Physiol. 2015, 169, 912–913. [Google Scholar] [CrossRef] [Green Version]
  16. Ge, L.; Chao, D.-Y.; Shi, M.; Zhu, M.-Z.; Gao, J.-P.; Lin, H.-X. Overexpression of the trehalose-6-phosphate phosphatase gene OsTPP1 confers stress tolerance in rice and results in the activation of stress responsive genes. Planta 2008, 228, 191–201. [Google Scholar] [CrossRef]
  17. Satoh-Nagasawa, N.; Nagasawa, N.; Malcomber, S.; Sakai, H.; Jackson, D. A trehalose metabolic enzyme controls inflorescence architecture in maize. Nat. Int. Wkly. J. Sci. 2006, 441, 227–230. [Google Scholar] [CrossRef]
  18. Nuccio, M.L.; Wu, J.; Mowers, R.; Zhou, H.-P.; Meghji, M.; Primavesi, L.; Paul, M.; Chen, X.; Gao, Y.; Haque, E.; et al. Expression of trehalose-6-phosphate phosphatase in maize ears improves yield in well-watered and drought conditions. Nat. Biotechnol. 2015, 33, 862–869. [Google Scholar] [CrossRef]
  19. Li, P.; Ma, S.; Bohnert, H.J. Coexpression characteristics of trehalose-6-phosphate phosphatase subfamily genes reveal different functions in a network context. Physiol. Plant. 2008, 133, 544–556. [Google Scholar] [CrossRef]
  20. Hu, Y.; Chen, J.; Fang, L.; Zhang, Z.; Ma, W.; Niu, Y.; Ju, L.; Deng, J.; Zhao, T.; Lian, J.; et al. Gossypium barbadense and Gossypium hirsutum genomes provide insights into the origin and evolution of allotetraploid cotton. Nat. Genet. 2019, 51, 739–748. [Google Scholar] [CrossRef] [Green Version]
  21. Wang, M.; Tu, L.; Yuan, D.; Zhu, D.; Shen, C.; Li, J.; Liu, F.; Pei, L.; Wang, P.; Zhao, G.; et al. Reference genome sequences of two cultivated allotetraploid cottons, Gossypium hirsutum and Gossypium barbadense. Nat. Genet. 2018, 51, 224–229. [Google Scholar] [CrossRef] [PubMed] [Green Version]
  22. Fang, L.; Wang, Q.; Hu, Y.; Jia, Y.; Chen, J.; Liu, B.; Zhang, Z.; Guan, X.; Chen, S.; Zhou, B.; et al. Genomic analyses in cotton identify signatures of selection and loci associated with fiber quality and yield traits. Nat. Genet. 2017, 49, 1089–1098. [Google Scholar] [CrossRef] [PubMed]
  23. Ma, Z.; Zhang, Y.; Wu, L.; Zhang, G.; Sun, Z.; Li, Z.; Jiang, Y.; Ke, H.; Chen, B.; Liu, Z.; et al. High-quality genome assembly and resequencing of modern cotton cultivars provide resources for crop improvement. Nat. Genet. 2021, 53, 1385–1391. [Google Scholar] [CrossRef] [PubMed]
  24. Wang, K.; Wang, Z.; Li, F.; Ye, W.; Wang, J.; Song, G.; Yue, Z.; Cong, L.; Shang, H.; Zhu, S.; et al. The draft genome of a diploid cotton Gossypium raimondii. Nat. Genet. 2012, 44, 1098–1103. [Google Scholar] [CrossRef]
  25. Du, X.; Huang, G.; He, S.; Yang, Z.; Sun, G.; Ma, X.; Li, N.; Zhang, X.; Sun, J.; Liu, M.; et al. Resequencing of 243 diploid cotton accessions based on an updated A genome identifies the genetic basis of key agronomic traits. Nat. Genet. 2018, 50, 796–802. [Google Scholar] [CrossRef]
  26. Babushok, D.V.; Ostertag, E.M.; Kazazian, H.H., Jr. Current topics in genome evolution: Molecular mechanisms of new gene formation. Cell Mol. Life Sci. 2006, 64, 542–554. [Google Scholar] [CrossRef]
  27. Flagel, L.E.; Wendel, J.F. Evolutionary rate variation, genomic dominance and duplicate gene expression evolution during allotetraploid cotton speciation. New Phytol. 2009, 186, 184–193. [Google Scholar] [CrossRef]
  28. Heidari, P.; Faraji, S.; Ahmadizadeh, M.; Ahmar, S.; Mora-Poblete, F. New Insights Into Structure and Function of TIFY Genes in Zea mays and Solanum lycopersicum: A Genome-Wide Comprehensive Analysis. Front. Genet. 2021, 12, 657970. [Google Scholar] [CrossRef]
  29. Abdullah; Faraji, S.; Mehmood, F.; Malik, H.M.T.; Ahmed, I.; Heidari, P.; Poczai, P. The GASA Gene Family in Cacao (Theobroma cacao, Malvaceae): Genome Wide Identification and Expression Analysis. Agronomy 2021, 11, 1425. [Google Scholar] [CrossRef]
  30. Musavizadeh, Z.; Najafi-Zarrini, H.; Kazemitabar, S.K.; Hashemi, S.H.; Faraji, S.; Barcaccia, G.; Heidari, P. Genome-Wide Analysis of Potassium Channel Genes in Rice: Expression of the OsAKT and OsKAT Genes under Salt Stress. Genes 2021, 12, 784. [Google Scholar] [CrossRef]
  31. Faraji, S.; Heidari, P.; Amouei, H.; Filiz, E.; Abdullah; Poczai, P. Investigation and Computational Analysis of the Sulfotransferase (SOT) Gene Family in Potato (Solanum tuberosum): Insights into Sulfur Adjustment for Proper Development and Stimuli Responses. Plants 2021, 10, 2597. [Google Scholar] [CrossRef] [PubMed]
  32. Vandesteene, L.; López-Galvis, L.; Vanneste, K.; Feil, R.; Maere, S.; Lammens, W.; Rolland, F.; Lunn, J.E.; Avonce, N.; Beeckman, T.; et al. Expansive Evolution of the TREHALOSE-6-PHOSPHATE PHOSPHATASE Gene Family in Arabidopsis. Plant Physiol. 2012, 160, 884–896. [Google Scholar] [CrossRef] [PubMed] [Green Version]
  33. Van Houtte, H.; López-Galvis, L.; Vandesteene, L.; Beeckman, T.; Van Dijck, P. Redundant and non-redundant roles of the trehalose-6-phosphate phosphatases in leaf growth, root hair specification and energy-responses in Arabidopsis. Plant Signal. Behav. 2013, 8, e23209. [Google Scholar] [CrossRef] [PubMed] [Green Version]
  34. Wingler, A.; Delatte, T.L.; O’Hara, L.E.; Primavesi, L.F.; Deveraj, J.; Paul, M.J.; Schluepmann, H. Trehalose 6-Phosphate Is Required for the Onset of Leaf Senescence Associated with High Carbon Availability. Plant Physiol. 2012, 158, 1241–1251. [Google Scholar] [CrossRef] [PubMed] [Green Version]
  35. Schluepmann, H.; van Dijken, A.; Aghdasi, M.; Wobbes, B.; Paul, M.; Smeekens, S. Trehalose Mediated Growth Inhibition of Arabidopsis Seedlings Is Due to Trehalose-6-Phosphate Accumulation. Plant Physiol. 2004, 135, 879–890. [Google Scholar] [CrossRef] [PubMed] [Green Version]
  36. Strom, A.R.; Kaasen, I. Trehalose metabolism in Escherichia coli: Stress protection and stress regulation of gene expression. Mol. Microbiol. 1993, 8, 205–210. [Google Scholar] [CrossRef]
  37. Zhang, Y.; Primavesi, L.; Jhurreea, D.; Andralojc, P.J.; Mitchell, R.; Powers, S.J.; Schluepmann, H.; Delatte, T.; Wingler, A.; Paul, M.J. Inhibition of SNF1-Related Protein Kinase1 Activity and Regulation of Metabolic Pathways by Trehalose-6-Phosphate. Plant Physiol. 2009, 149, 1860–1871. [Google Scholar] [CrossRef] [Green Version]
  38. Nunes, C.; Primavesi, L.; Patel, M.K.; Martinez-Barajas, E.; Powers, S.J.; Sagar, R.; Fevereiro, P.; Davis, B.G.; Paul, M.J. Inhibition of SnRK1 by metabolites: Tissue-dependent effects and cooperative inhibition by glucose 1-phosphate in combination with trehalose 6-phosphate. Plant Physiol. Biochem. 2013, 63, 89–98. [Google Scholar] [CrossRef]
  39. Chen, S.L.; Peng, Y.; Zhou, H.; Yu, B.; Teng, S. Research advances in trehalose metabolism and trehalose-6-phosphate signaling in plants. Plant Physiol. J. 2014, 50, 233–242. [Google Scholar]
  40. Baena-González, E.; Rolland, F.; Thevelein, J.; Sheen, J. A central integrator of transcription networks in plant stress and energy signalling. Nature 2007, 448, 938–942. [Google Scholar] [CrossRef]
  41. Martínez-Barajas, E.; Delatte, T.; Schluepmann, H.; de Jong, G.J.; Somsen, G.W.; Nunes, C.; Primavesi, L.; Coello, P.; Mitchell, R.; Paul, M.J. Wheat Grain Development Is Characterized by Remarkable Trehalose 6-Phosphate Accumulation Pregrain Filling: Tissue Distribution and Relationship to SNF1-Related Protein Kinase1 Activity. Plant Physiol. 2011, 156, 373–381. [Google Scholar] [CrossRef] [PubMed] [Green Version]
  42. Wu, L.; Birch, R.G. Physiological basis for enhanced sucrose accumulation in an engineered sugarcane cell line. Funct. Plant Biol. 2010, 37, 1161–1174. [Google Scholar] [CrossRef]
  43. Debast, S.; Nunes-Nesi, A.; Hajirezaei, M.R.; Hofmann, J.; Sonnewald, U.; Fernie, A.R.; Börnke, F. Altering Trehalose-6-Phosphate Content in Transgenic Potato Tubers Affects Tuber Growth and Alters Responsiveness to Hormones during Sprouting. Plant Physiol. 2011, 156, 1754–1771. [Google Scholar] [CrossRef] [PubMed] [Green Version]
  44. Zhang, Z.; Deng, Y.; Song, X.; Miao, M. Trehalose-6-phosphate and SNF1-related protein kinase 1 are involved in the first-fruit inhibition of cucumber. J. Plant Physiol. 2014, 177, 110–120. [Google Scholar] [CrossRef] [PubMed]
  45. Chary, S.N.; Hicks, G.R.; Choi, Y.G.; Carter, D.; Raikhel, N.V. Trehalose-6-Phosphate Synthase/Phosphatase Regulates Cell Shape and Plant Architecture in Arabidopsis. Plant Physiol. 2007, 146, 97–107. [Google Scholar] [CrossRef] [PubMed] [Green Version]
  46. Chen, X.; Abubakar, Y.S.; Yang, C.; Wang, X.; Miao, P.; Lin, M.; Wen, Y.; Wu, Q.; Zhong, H.; Fan, Y.; et al. Trehalose Phosphate Synthase Complex-Mediated Regulation of Trehalose 6-Phosphate Homeostasis Is Critical for Development and Pathogenesis in Magnaporthe oryzae. mSystems 2021, 6, e00462-21. [Google Scholar] [CrossRef]
  47. Wang, W.; Chen, Q.-B.; Xu, S.; Liu, W.; Zhu, X.; Song, C. Trehalose-6-phosphate phosphatase E modulates ABA-controlled root growth and stomatal movement in Arabidopsis. J. Integr. Plant Biol. 2020, 62, 1518–1534. [Google Scholar] [CrossRef] [Green Version]
  48. Abdelraheem, A.; Esmaeili, N.; O’Connell, M.; Zhang, J. Progress and perspective on drought and salt stress tolerance in cotton. Ind. Crop. Prod. 2018, 130, 118–129. [Google Scholar] [CrossRef]
  49. Gao, J.; Wang, N.; Xu, S.S.; Li, Y.; Wang, Y.; Wang, G.X. Exogenous application of trehalose induced H2O2 production and stomatal closure in Vicia faba. Biol. Plant. 2013, 57, 380–384. [Google Scholar] [CrossRef]
  50. Delorge, I.; Figueroa, C.M.; Feil, R.; Lunn, J.E.; Van Dijck, P. Trehalose-6-phosphate synthase 1 is not the only active TPS in Arabidopsis thaliana. Biochem. J. 2015, 466, 283–290. [Google Scholar] [CrossRef]
  51. Jin, Q.; Hu, X.; Li, X.; Wang, B.; Wang, Y.; Jiang, H.; Mattson, N.; Xu, Y. Genome-Wide Identification and Evolution Analysis of Trehalose-6-Phosphate Synthase Gene Family in Nelumbo nucifera. Front. Plant Sci. 2016, 7, 1445. [Google Scholar] [CrossRef] [PubMed]
  52. Li, H.-W.; Zang, B.-S.; Deng, X.-W.; Wang, X.-P. Overexpression of the trehalose-6-phosphate synthase gene OsTPS1 enhances abiotic stress tolerance in rice. Planta 2011, 234, 1007–1018. [Google Scholar] [CrossRef] [PubMed]
  53. Karim, S.; Aronsson, H.; Ericson, H.; Pirhonen, M.; Leyman, B.; Welin, B.; Mäntylä, E.; Palva, E.T.; Van Dijck, P.; Holmström, K.-O. Improved drought tolerance without undesired side effects in transgenic plants producing trehalose. Plant Mol. Biol. 2007, 64, 371–386. [Google Scholar] [CrossRef] [PubMed]
  54. Zhu, T.; Liang, C.; Meng, Z.; Sun, G.; Meng, Z.; Guo, S.; Zhang, R. CottonFGD: An integrated functional genomics database for cotton. BMC Plant Biol. 2017, 17, 101. [Google Scholar] [CrossRef] [PubMed] [Green Version]
  55. Lu, S.; Wang, J.; Chitsaz, F.; Derbyshire, M.K.; Geer, R.C.; Gonzales, N.R.; Gwadz, M.; Hurwitz, D.I.; Marchler, G.H.; Song, J.S.; et al. CDD/SPARCLE: The conserved domain database in 2020. Nucleic Acids Res. 2020, 48, D265–D268. [Google Scholar] [CrossRef] [Green Version]
  56. Potter, S.C.; Luciani, A.; Eddy, S.R.; Park, Y.; López, R.; Finn, R.D. HMMER web server: 2018 update. Nucleic Acids Res. 2018, 46, W200–W204. [Google Scholar] [CrossRef] [Green Version]
  57. Wilkins, M.R.; Gasteiger, E.; Bairoch, A.; Sanchez, J.C.; Williams, K.L.; Appel, R.D.; Hochstrasser, D.F. Protein Identification and Analysis Tools in the ExPASy Server. Methods Mol. Biol. 1999, 112, 531–552. [Google Scholar]
  58. Voorrips, R.E. MapChart: Software for the graphical presentation of linkage maps and QTLs. J. Hered. 2002, 93, 77–78. [Google Scholar] [CrossRef] [Green Version]
  59. Yu, C.S.; Lin, C.J.; Hwang, J.K. Predicting subcellular localization of proteins for Gram-negative bacteria by support vector machines based on n-peptide compositions. Protein Sci. 2004, 13, 1402–1406. [Google Scholar] [CrossRef] [Green Version]
  60. Kumar, S.; Stecher, G.; Tamura, K. MEGA7: Molecular Evolutionary Genetics Analysis Version 7.0 for Bigger Datasets. Mol. Biol. Evol. 2016, 33, 1870–1874. [Google Scholar] [CrossRef] [Green Version]
  61. Bailey, T.L.; Boden, M.; Buske, F.A.; Frith, M.; Grant, C.E.; Clementi, L.; Ren, J.; Li, W.W.; Noble, W.S. MEME SUITE: Tools for motif discovery and searching. Nucleic Acids Res. 2009, 37, w202–w208. [Google Scholar] [CrossRef] [PubMed]
  62. Chen, C.; Chen, H.; Zhang, Y.; Thomas, H.R.; Frank, M.H.; He, Y.; Xia, R. TBtools: An Integrative Toolkit Developed for Interactive Analyses of Big Biological Data. Mol. Plant 2020, 13, 1194–1202. [Google Scholar] [CrossRef] [PubMed]
  63. Lescot, M.; Déhais, P.; Thijs, G.; Marchal, K.; Moreau, Y.; Van de Peer, Y.; Rouzé, P.; Rombauts, S. PlantCARE, a database of plant cis-acting regulatory elements and a portal to tools for in silico analysis of promoter sequences. Nucleic Acids Res. 2002, 30, 325–327. [Google Scholar] [CrossRef] [PubMed]
  64. Hu, B.; Jin, J.; Guo, A.-Y.; Zhang, H.; Luo, J.; Gao, G. GSDS 2.0: An upgraded gene feature visualization server. Bioinformatics 2014, 31, 1296–1297. [Google Scholar] [CrossRef] [Green Version]
  65. Wang, Y.; Tang, H.; DeBarry, J.D.; Tan, X.; Li, J.; Wang, X.; Lee, T.-H.; Jin, H.; Marler, B.; Guo, H.; et al. MCScanX: A toolkit for detection and evolutionary analysis of gene synteny and collinearity. Nucleic Acids Res. 2012, 40, e49. [Google Scholar] [CrossRef] [Green Version]
  66. Dai, X.; Zhuang, Z.; Zhao, P.X. psRNATarget: A plant small RNA target analysis server (2017 release). Nucleic Acids Res. 2018, 46, W49–W54. [Google Scholar] [CrossRef] [Green Version]
  67. Otasek, D.; Morris, J.H.; Bouças, J.; Pico, A.R.; Demchak, B. Cytoscape Automation: Empowering workflow-based network analysis. Genome Biol. 2019, 20, 1–15. [Google Scholar] [CrossRef] [Green Version]
  68. Livak, K.J.; Schmittgen, T.D. Analysis of Relative Gene Expression Data Using Real-Time Quantitative PCR and the 2−ΔΔCT Method. Methods 2001, 25, 402–408. [Google Scholar] [CrossRef]
Figure 1. Phylogenetic analysis of TPP family genes in cotton and Arabidopsis. The brown, yellow, blue, and green circles represent G. arboreum, G. raimondii, G. hirsutum and G. barbadense, respectively, and the red stars represent Arabidopsis. Groups I–III are shown in blue, red, and green colour, respectively.
Plants 11 01079 g001
Figure 2. Conserved motifs and structure of TPP genes in cotton. (A) The phylogenetic tree was constructed using the protein sequences encoded by 79 TPP genes in cotton. The TPP genes were divided into three groups based on the evolutionary tree. (B) The conserved motifs in TPP genes were predicted, and the different colours represent different motifs. (C) The intron/exon structures of the TPP genes were analysed. The yellow boxes represent exons, the grey lines represent introns, and the green boxes represent untranslated regions (UTRs).
Plants 11 01079 g002
Figure 3. Chromosomal distribution of TPP genes. The red gene ID locations correspond to the positions on the chromosomes; the scale of the chromosomes represents millions of base pairs (Mb).
Plants 11 01079 g003
Figure 4. Collinearity analysis of the TPP family members in cotton. From top to bottom, the collinear relationships between G. arboreum and G. hirsutum, between G. barbadense and G. raimondii, and between G. hirsutum and G. barbadense are shown. The grey lines in the background show the collinearity of the entire genome, and the blue lines indicate the collinearity of the TPP genes.
Plants 11 01079 g004
Figure 5. Cis-element analysis of the TPP genes in G. hirsutum. The black line represents the 2000-bp sequence upstream of the CDS, and squares of different colours represent various cis-elements. The evolutionary tree is shown on the left.
Plants 11 01079 g005
Figure 6. Prediction of miRNAs targeting TPP genes. The red circles reflect the predicted miRNAs, and the blue circles depict the targeted TPP genes. The lines between the circles represent their connections.
Plants 11 01079 g006
Figure 7. Expression profiles of TPP genes in G. hirsutum under different stress treatments. The transcriptomic data were normalized via log2 (FPKM+1) to generate a heatmap. Shown from left to right are the data under cold (A), heat (B), drought (C), and salt (D) stress are shown from left to right.
Plants 11 01079 g007
Figure 8. TPP gene expression profiles during different developmental periods and in different tissues of G. hirsutum. The transcriptomic data were normalized via log2 (FPKM+1) to generate a heatmap. (A) Expression of TPP genes in G. hirsutum at different stages of ovule development. (B) Expression of TPP genes at different stages of G. hirsutum fibre development. (C) Expression of TPP genes in different tissues.
Plants 11 01079 g008
Figure 9. Functional study of GhTPP22. (A) Growth and development of TRV::CLA1, WT, TRV::00 and TRV::GhTPP22 plants under drought stress; (B) DAB and trypan blue (represented in the figure as TPB) staining of TRV::00 and TRV::GhTPP22 leaves; (C) The stomatal closure status of TRV::00 and TRV::GhTPP22 under drought conditions; (D) qPCR verification results; the error bars show the standard deviations from three technical replicates, *and ** indicate the significant differences between the control samples (TRV::00) and the samples collected from TRV::GhTPP22 plants, as determined by Student’s t-test, at p-values ≤0.05 and≤0.01, respectively.
Plants 11 01079 g009
Table 1. Basic information of TPP family genes in cotton.
Gene IDGene NameAmino Acid LengthPIMW (Da)Subcellular LocationLocation
Ga01G0805GaTPP11978.7922,151.11chloroplastGa01:12056674−12058006(−)
Ga01G2073GaTPP24155.5346,497.55chloroplastGa01:98691188−98693520(+)
Ga01G2696GaTPP33878.7943,611.07cytoplasm, mitochondrionGa01:111288363−111290680(+)
Ga02G0355GaTPP43659.0141,110.26endoplasmic reticulumGa02:4283490−4285630(+)
Ga02G1338GaTPP53499.3739,003.96mitochondrionGa02:91984769−91987027(+)
Ga02G1426GaTPP63077.1334,427.13chloroplastGa02:93890804−93892792(+)
Ga04G1370GaTPP71749.1519,797.69cell membraneGa04:82923593−82924930(−)
Ga05G2426GaTPP83699.3141,176.46chloroplastGa05:22943084−22945173(−)
Ga06G0361GaTPP93649.0340,884.08peroxisomeGa06:4054349−4056277(−)
Ga08G2961GaTPP102489.328,235.55chloroplastGa08:129160428−129168443(−)
Ga09G2059GaTPP113276.1336,864.31chloroplastGa09:78465375−78467180(−)
Ga10G0429GaTPP121819.0520,501.79chloroplastGa10:6841862−6843187(+)
Ga11G1620GaTPP133709.0341,573.91nucleusGa11:66146228−66148090(−)
Ga12G0284GaTPP143409.0138,454.32endoplasmic reticulumGa12:2329765−2331423(−)
Ga12G0607GaTPP153888.4743,856.03mitochondrionGa12:5363443−5365648(+)
Ga12G0815GaTPP163837.6942,710.69chloroplastGa12:7602925−7605180(−)
Ga12G1996GaTPP173659.1741,099.14chloroplastGa12:36111089−36113512(+)
Gorai.002G219000GrTPP13549.5739,276.39mitochondrionGr02:57218239−57220778(+)
Gorai.003G038300GrTPP23739.1141,994.42endoplasmic reticulumGr03:4115747−4118444(+)
Gorai.003G113900GrTPP34195.6246,886.94chloroplastGr03:34671718−34674357(+)
Gorai.003G169300GrTPP43878.7943,600.99cytoplasm, mitochondrionGr03:43992274−43996267(−)
Gorai.006G200800GrTPP53276.3537,063.49chloroplastGr06:45780176−45782343(−)
Gorai.007G240600GrTPP63709.2341,706.1nucleusGr07:33289543−33291870(−)
Gorai.008G104600GrTPP73779.1342,485.96chloroplastGr08:32381215−32384204(−)
Gorai.008G216700GrTPP84228.447,239.17chloroplastGr08:50362362−50368208(+)
Gorai.008G236800GrTPP93888.4743,922.1mitochondrionGr08:52268635−52273612(−)
Gorai.008G270100GrTPP103408.8738,339.14endoplasmic reticulumGr08:54895162−54901806(+)
Gorai.009G238600GrTPP113699.3141,190.49chloroplastGr09:18961184−18963904(−)
Gorai.010G042600GrTPP123649.2440,853.11peroxisomeGr10:4054502−4056819(−)
Gbar_A01G006620GbTPP13138.5435,142.68chloroplastA01:10624088−10627713(−)
Gbar_A01G018380GbTPP23659.5541,026.49mitochondrionA01:108393899−108396649(+)
Gbar_A01G019190GbTPP32478.4527,951vacuoleA01:110286108−110293672(+)
Gbar_A02G015580GbTPP43659.0541,062.2endoplasmic reticulumA02:95555407−95558198(−)
Gbar_A03G001550GbTPP53878.7943,611.07cytoplasm, mitochondrionA03:1858338−1862358(+)
Gbar_A03G006910GbTPP63775.3942,113.75peroxisomeA03:13211987−13217500(−)
Gbar_A05G022530GbTPP73699.3141,220.52chloroplastA05:22046615−22049049(−)
Gbar_A06G003690GbTPP83649.0340,884.08peroxisomeA06:4817982−4820242(−)
Gbar_A06G003820GbTPP92398.5626,686.69mitochondrionA06:5644700−5662178(+)
Gbar_A08G027440GbTPP102596.0528,424.14nucleusA08:119673859−119677052(−)
Gbar_A09G019400GbTPP113276.1336,909.37chloroplastA09:71628362−71630477(−)
Gbar_A11G020620GbTPP123709.0341,588.89nucleusA11:42027092−42029383(−)
Gbar_A12G021250GbTPP133837.6942,710.69chloroplastA12:94907154−94913205(+)
Gbar_A12G023290GbTPP143888.4743,870.05mitochondrionA12:97098300−97103172(−)
Gbar_A12G026200GbTPP153408.9238,427.25endoplasmic reticulumA12:99713201−99720168(+)
Gbar_D01G019570GbTPP163549.5739,306.42mitochondrionD01:57326568−57329308(+)
Gbar_D03G003620GbTPP173739.1241,978.42endoplasmic reticulumD03:4085281−4087934(+)
Gbar_D03G011280GbTPP183845.7742,710.49peroxisomeD03:39684077−39689078(+)
Gbar_D03G016980GbTPP193878.9643,682.05cytoplasm, mitochondrionD03:49371797−49375803(−)
Gbar_D05G023190GbTPP203699.3141,156.47chloroplastD05:20587648−20591044(−)
Gbar_D06G003870GbTPP213649.2340,886.18chloroplastD06:4415421−4417669(−)
Gbar_D11G023430GbTPP223709.141,707.04nucleusD11:35062160−35064485(−)
Gbar_D12G010160GbTPP233609.2540,613.84mitochondrionD12:33516324−33519721(−)
Gbar_D12G021190GbTPP243838.5242,648.71chloroplastD12:51949877−51955716(+)
Gbar_D12G022910GbTPP253888.4743,922.1mitochondrionD12:53800044−53805108(−)
Gbar_D12G026150GbTPP263408.7438,360.16endoplasmic reticulumD12:56766186−56773133(+)
Gh_A01G209200GhTPP13659.5541,026.49mitochondrionA01:108650087−108652331(+)
Gh_A02G174500GhTPP23659.0541,062.2endoplasmic reticulumA02:101053973−101056656(−)
Gh_A03G016000GhTPP33878.9943,610.13cytoplasm, mitochondrionA03:1987850−1990163(+)
Gh_A03G074500GhTPP44155.6546,558.73chloroplastA03:14292959−14295295(−)
Gh_A05G212200GhTPP53699.3141,190.49chloroplastA05:22966211−22968675(−)
Gh_A06G040600GhTPP63649.0340,884.08peroxisomeA06:4961458−4963382(−)
Gh_A06G042800GhTPP71345.8714,881.02cytoplasmA06:5763598−5765589(+)
Gh_A09G201500GhTPP83276.1336,864.31chloroplastA09:77041091−77042896(−)
Gh_A11G215100GhTPP93399.0538,310.18endoplasmic reticulum, mitochondrion, plastidA11:44824072−44825936(−)
Gh_A12G223300GhTPP103837.6942,710.69chloroplastA12:98041663−98047469(+)
Gh_A12G243500GhTPP113888.4743,870.05mitochondrionA12:100217966−100222660(−)
Gh_A12G275900GhTPP123408.9238,427.25endoplasmic reticulumA12:103292432−103294090(+)
Gh_D01G206700GhTPP133549.5739,306.42mitochondrionD01:58776685−58778828(+)
Gh_D03G037900GhTPP143659.1241,103.3endoplasmic reticulumD03:4191881−4194554(+)
Gh_D03G122800GhTPP154225.7947,156.41chloroplastD03:41577803−41580170(+)
Gh_D03G179600GhTPP163878.6543,629.99cytoplasm, mitochondrionD03:51536913−51539437(−)
Gh_D05G229100GhTPP173699.1941,157.41chloroplastD05:20569568−20571657(−)
Gh_D06G040500GhTPP183649.2340,886.18chloroplastD06:4645870−4648178(−)
Gh_D09G194700GhTPP193276.1437,129.59chloroplastD09:46877954−46879754(−)
Gh_D11G237500GhTPP203709.1141,657.97nucleusD11:35983647−35985917(−)
Gh_D12G107500GhTPP213779.2342,452.94chloroplastD12:36644512−36646944(−)
Gh_D12G217800GhTPP223838.5242,648.71chloroplastD12:55343343−55349138(+)
Gh_D12G238200GhTPP233888.4743,956.12mitochondrionD12:57317788−57319992(−)
Gh_D12G270400GhTPP243408.7438,360.16endoplasmic reticulumD12:60342947−60344621(+)
Publisher’s Note: MDPI stays neutral with regard to jurisdictional claims in published maps and institutional affiliations.

