
Potential Roles of 1-Aminocyclopropane-1-carboxylic Acid Synthase Genes in the Response of Gossypium Species to Abiotic Stress by Genome-Wide Identification and Expression Analysis

 and
and 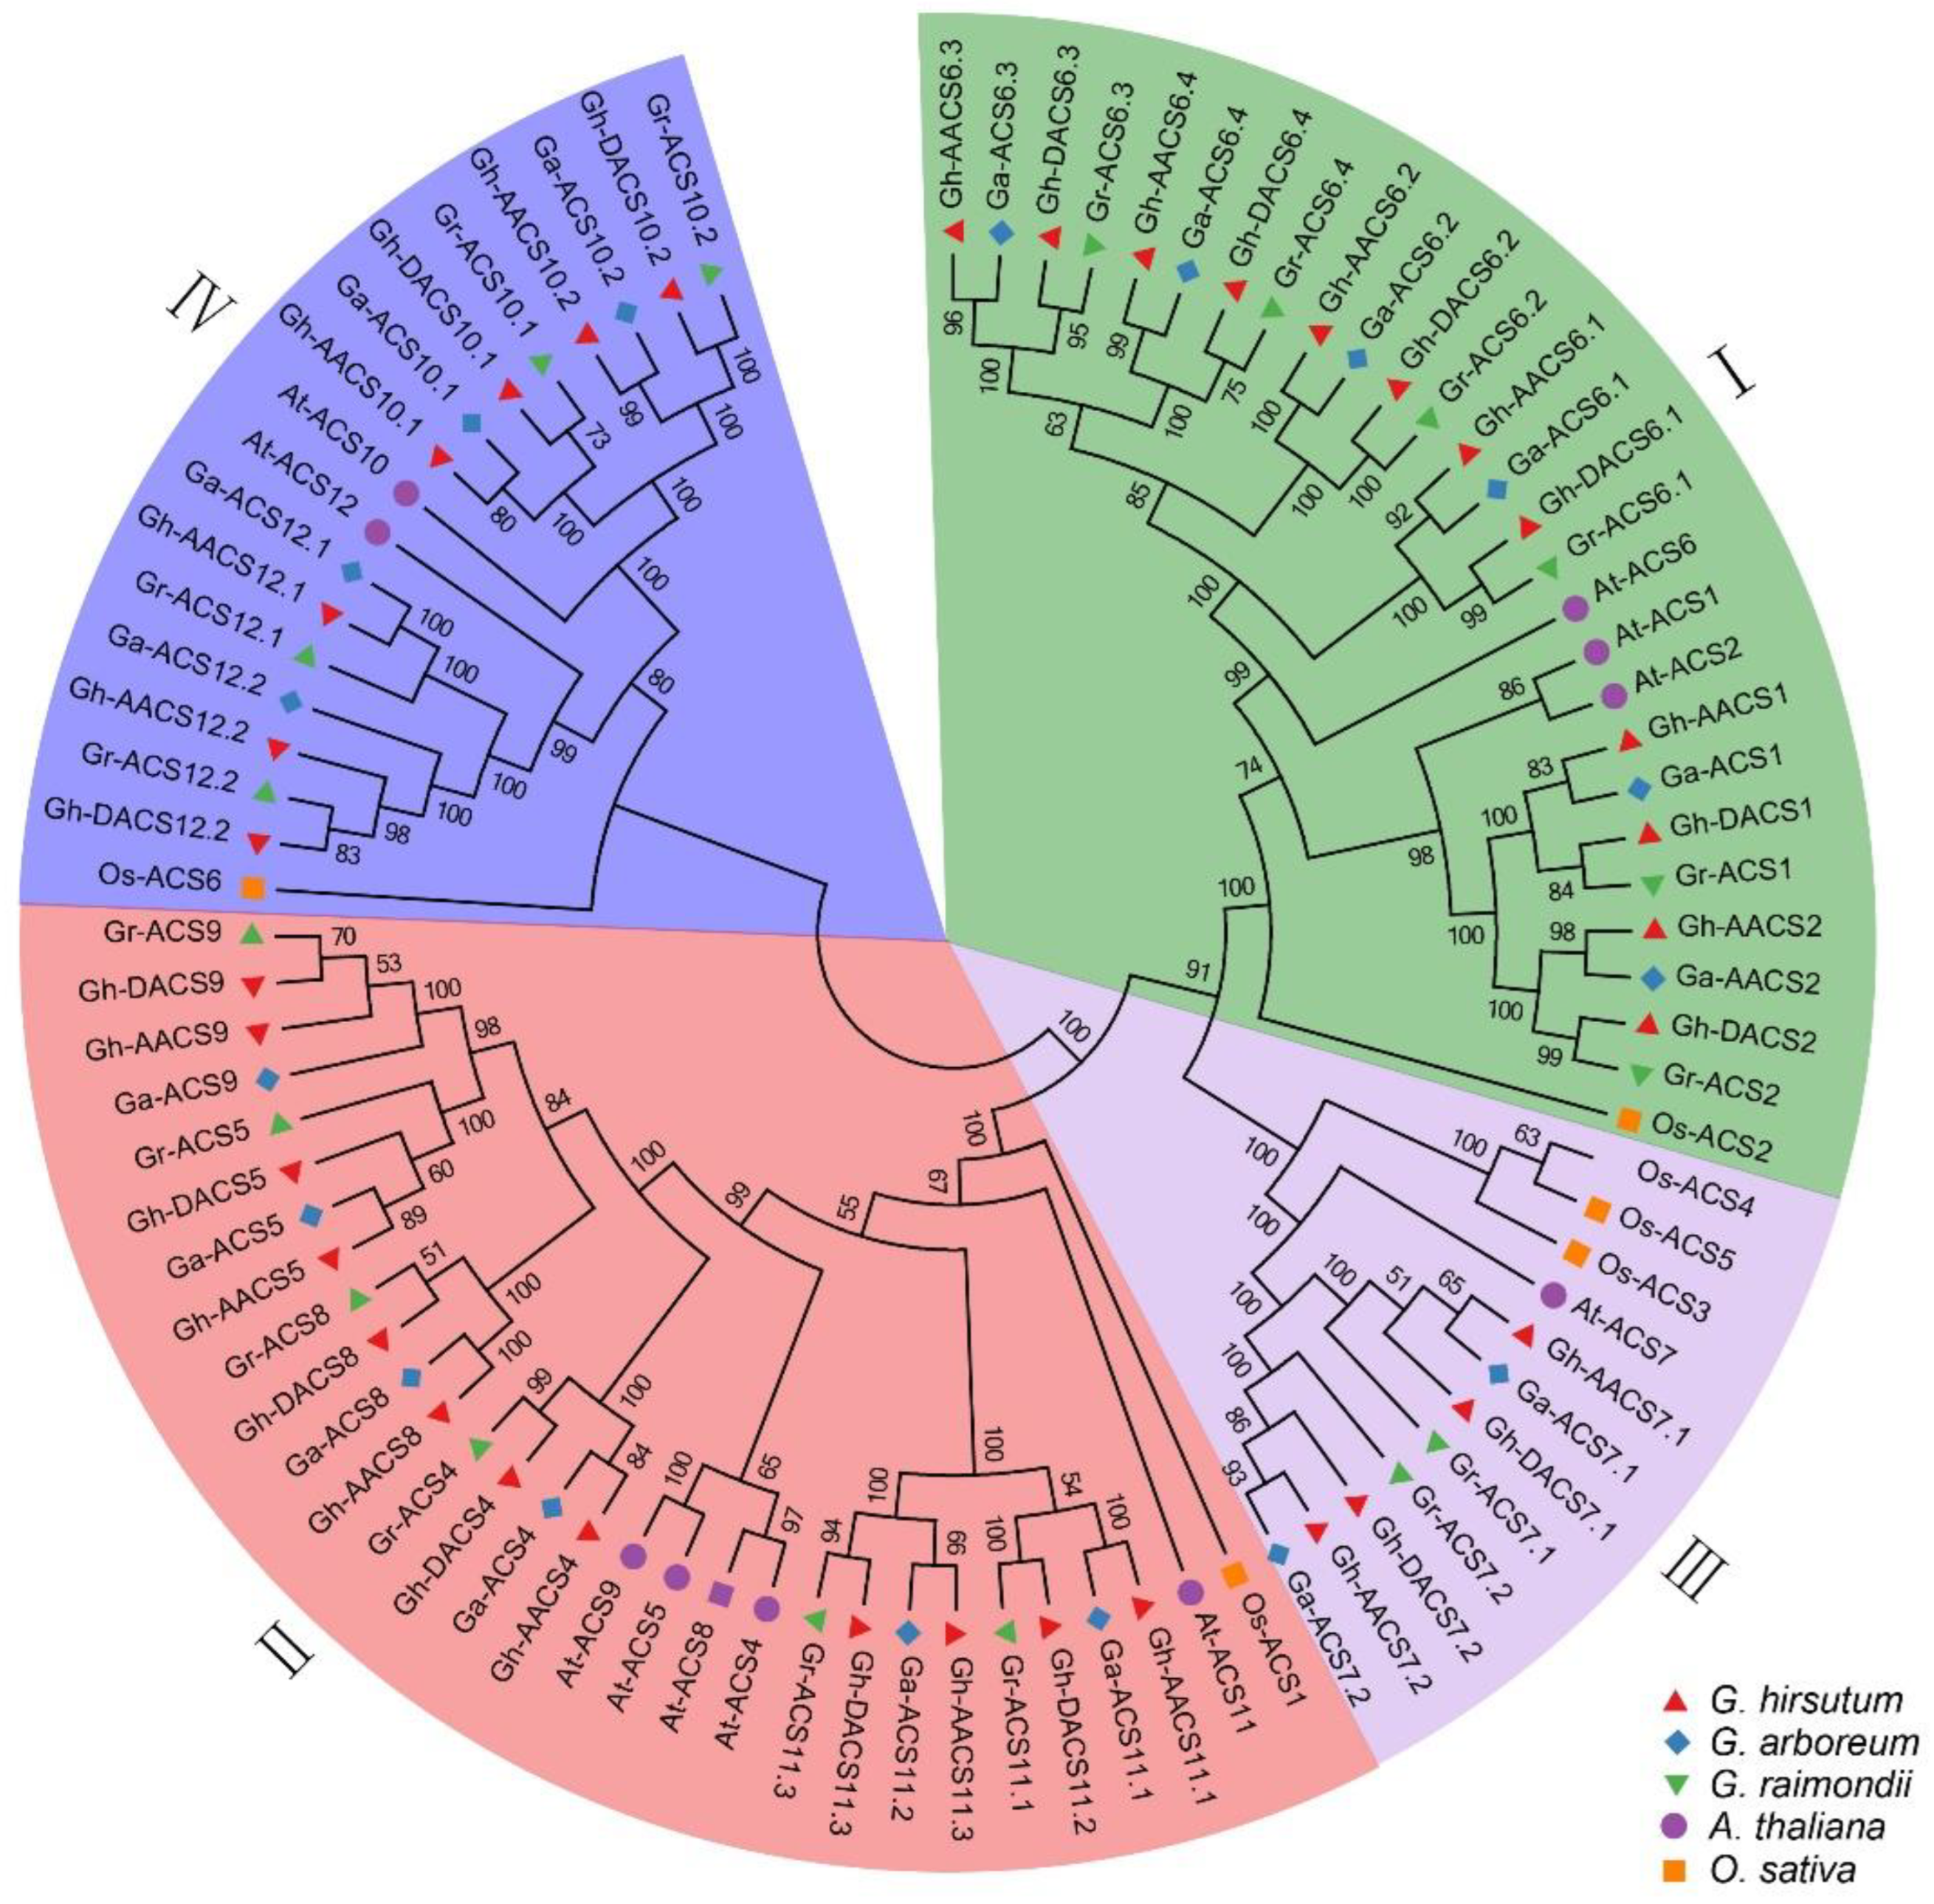
Abstract
1. Introduction
2. Results
2.1. Identification and Phylogeny Analysis of the ACS Gene Family in Cotton
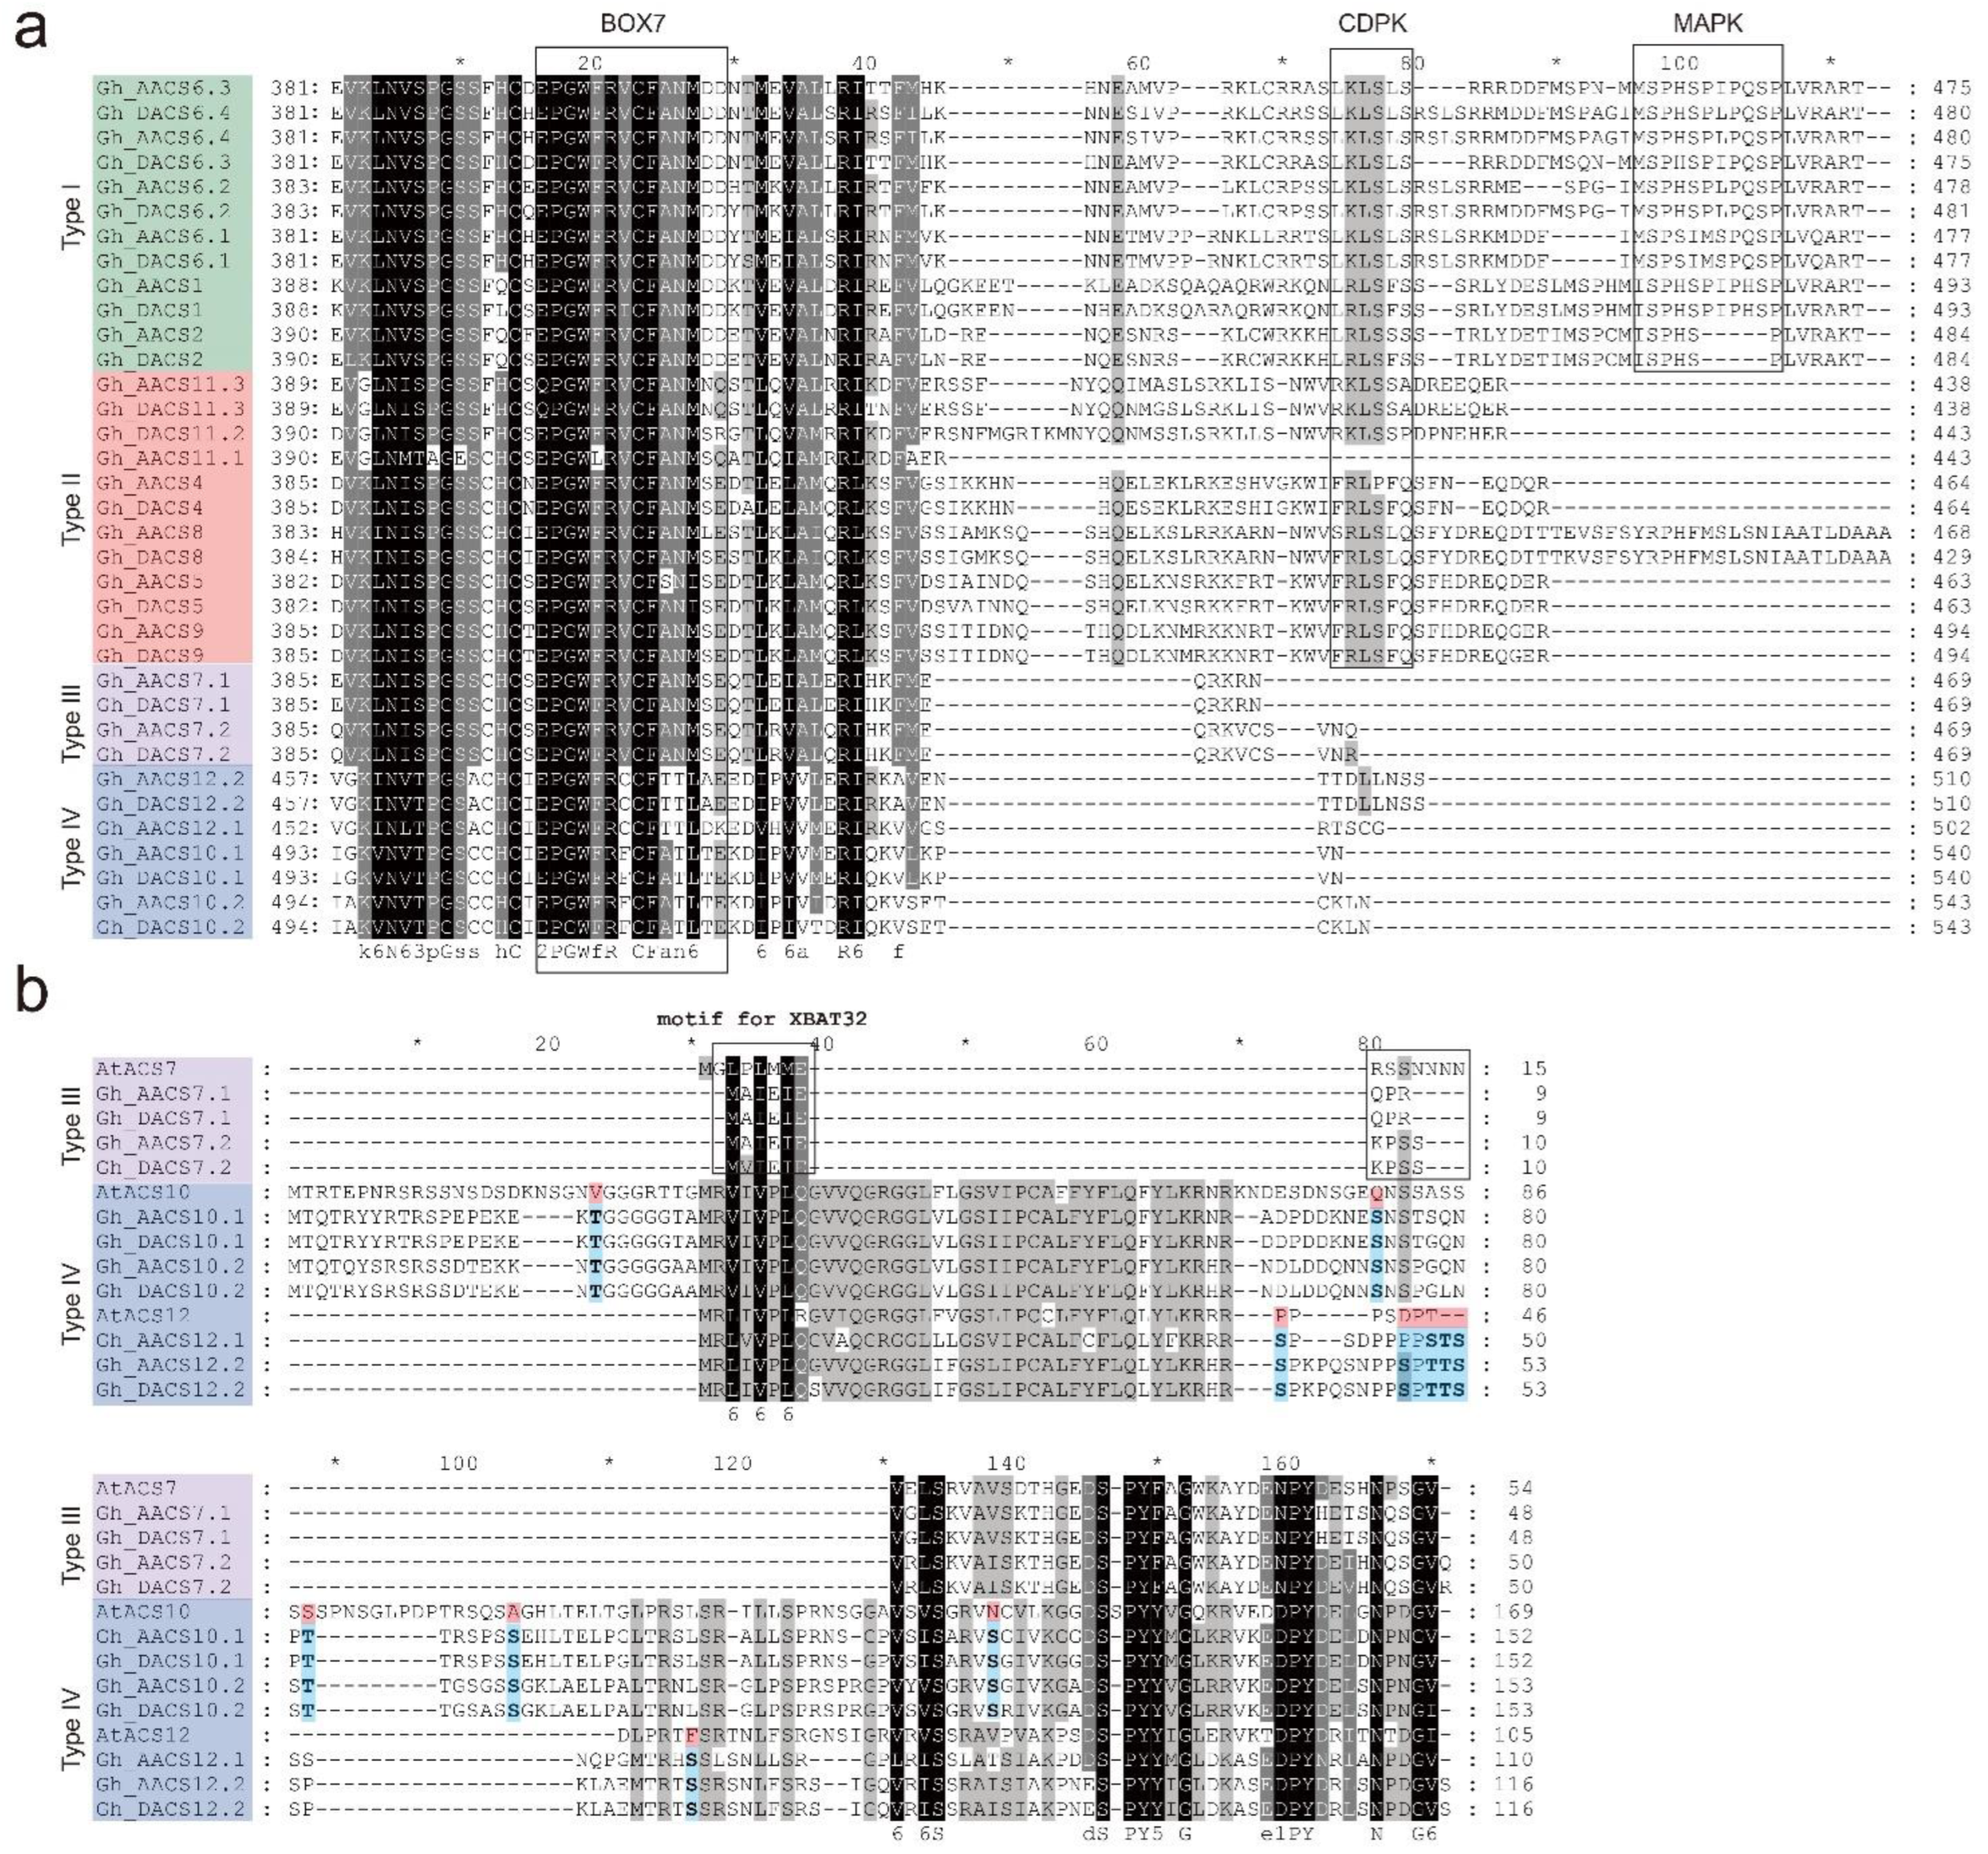
2.2. Analysis of the C-Terminal of the ACS Proteins
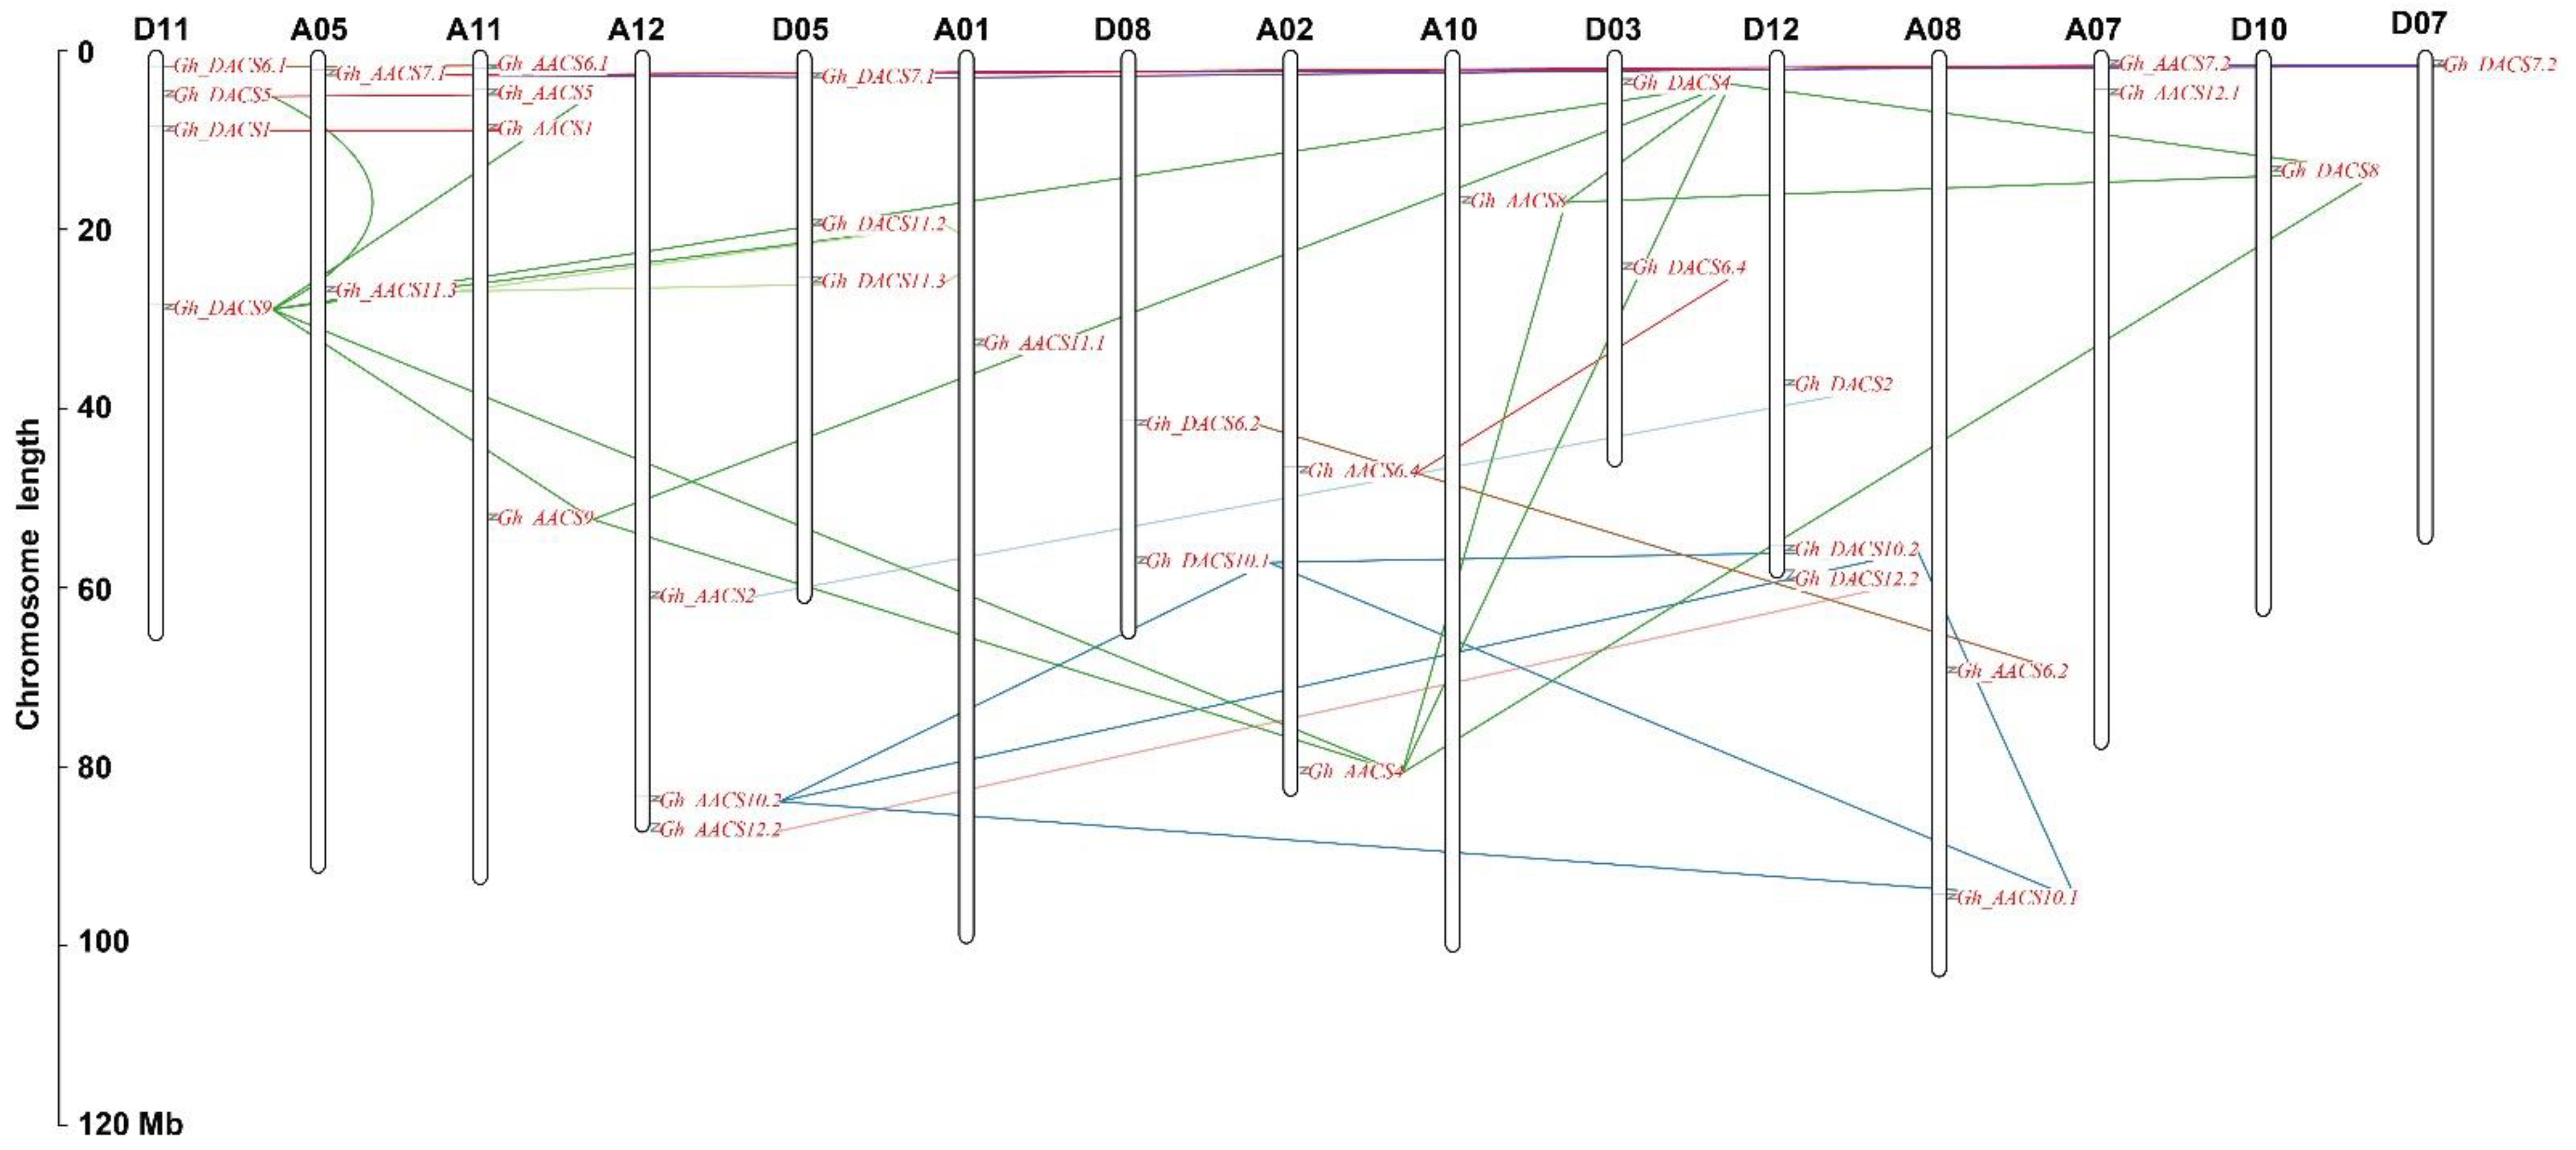
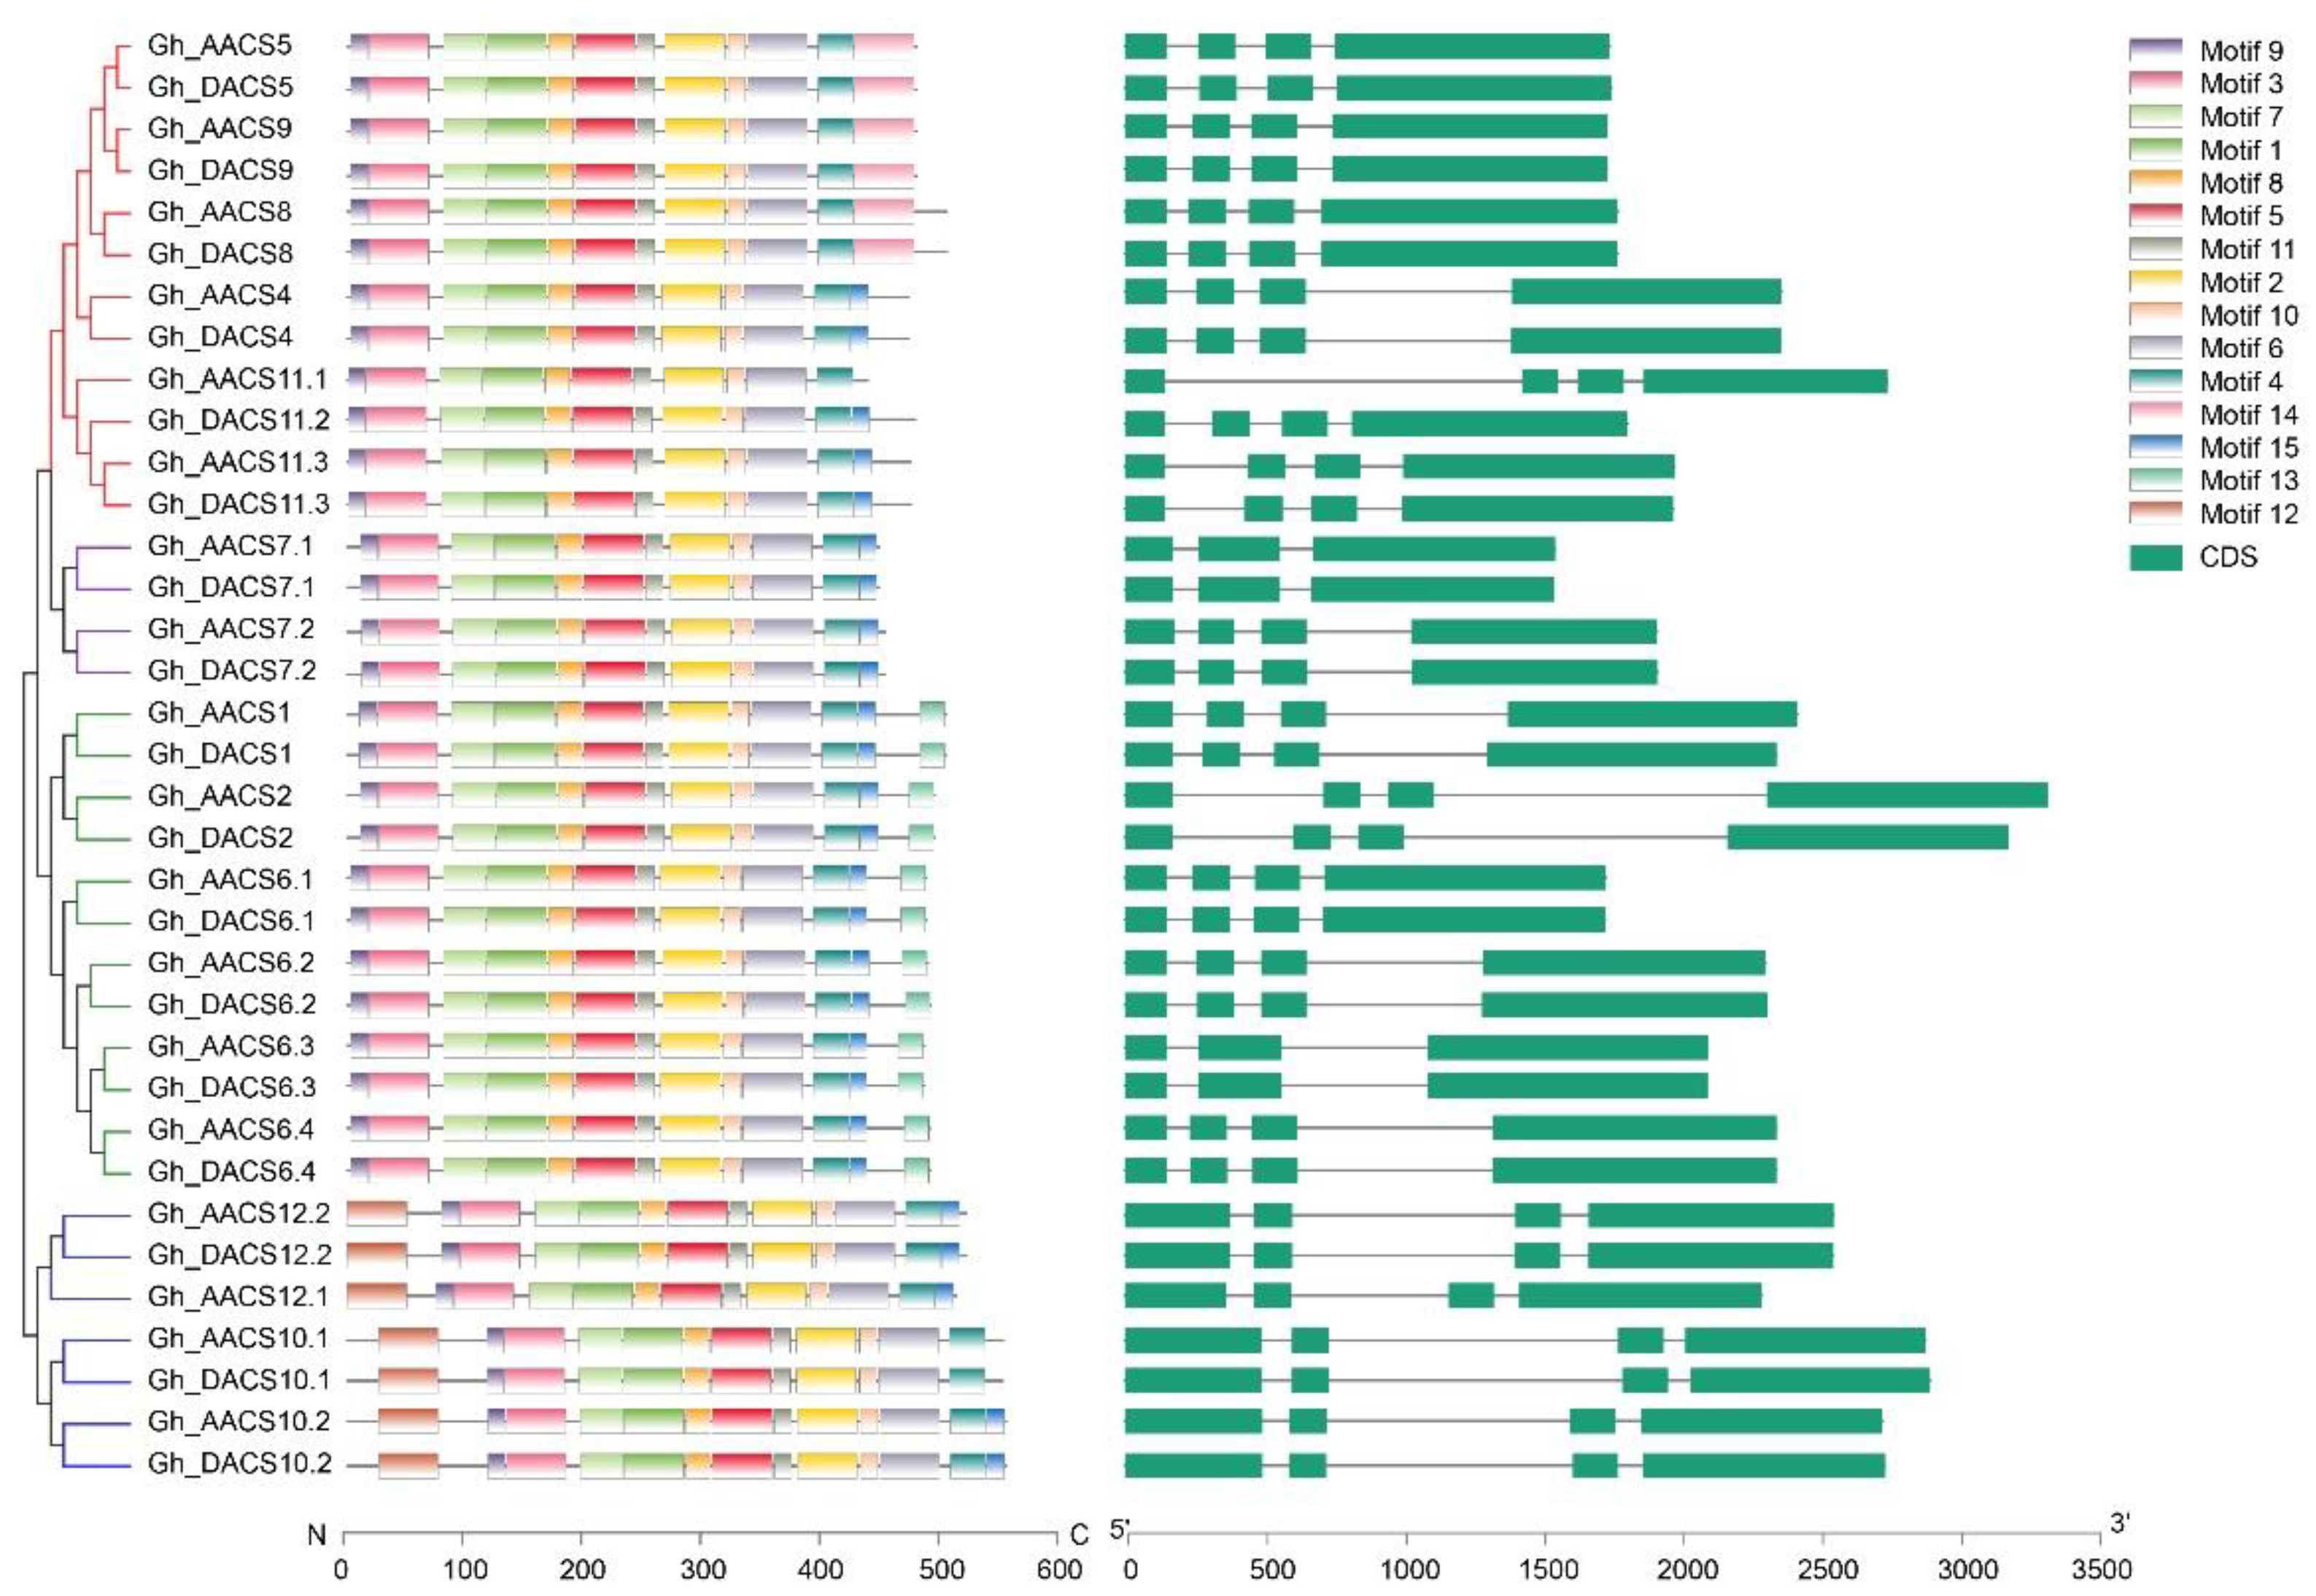
2.3. Analysis of Chromosomal Distribution, Gene Structure, and Motifs
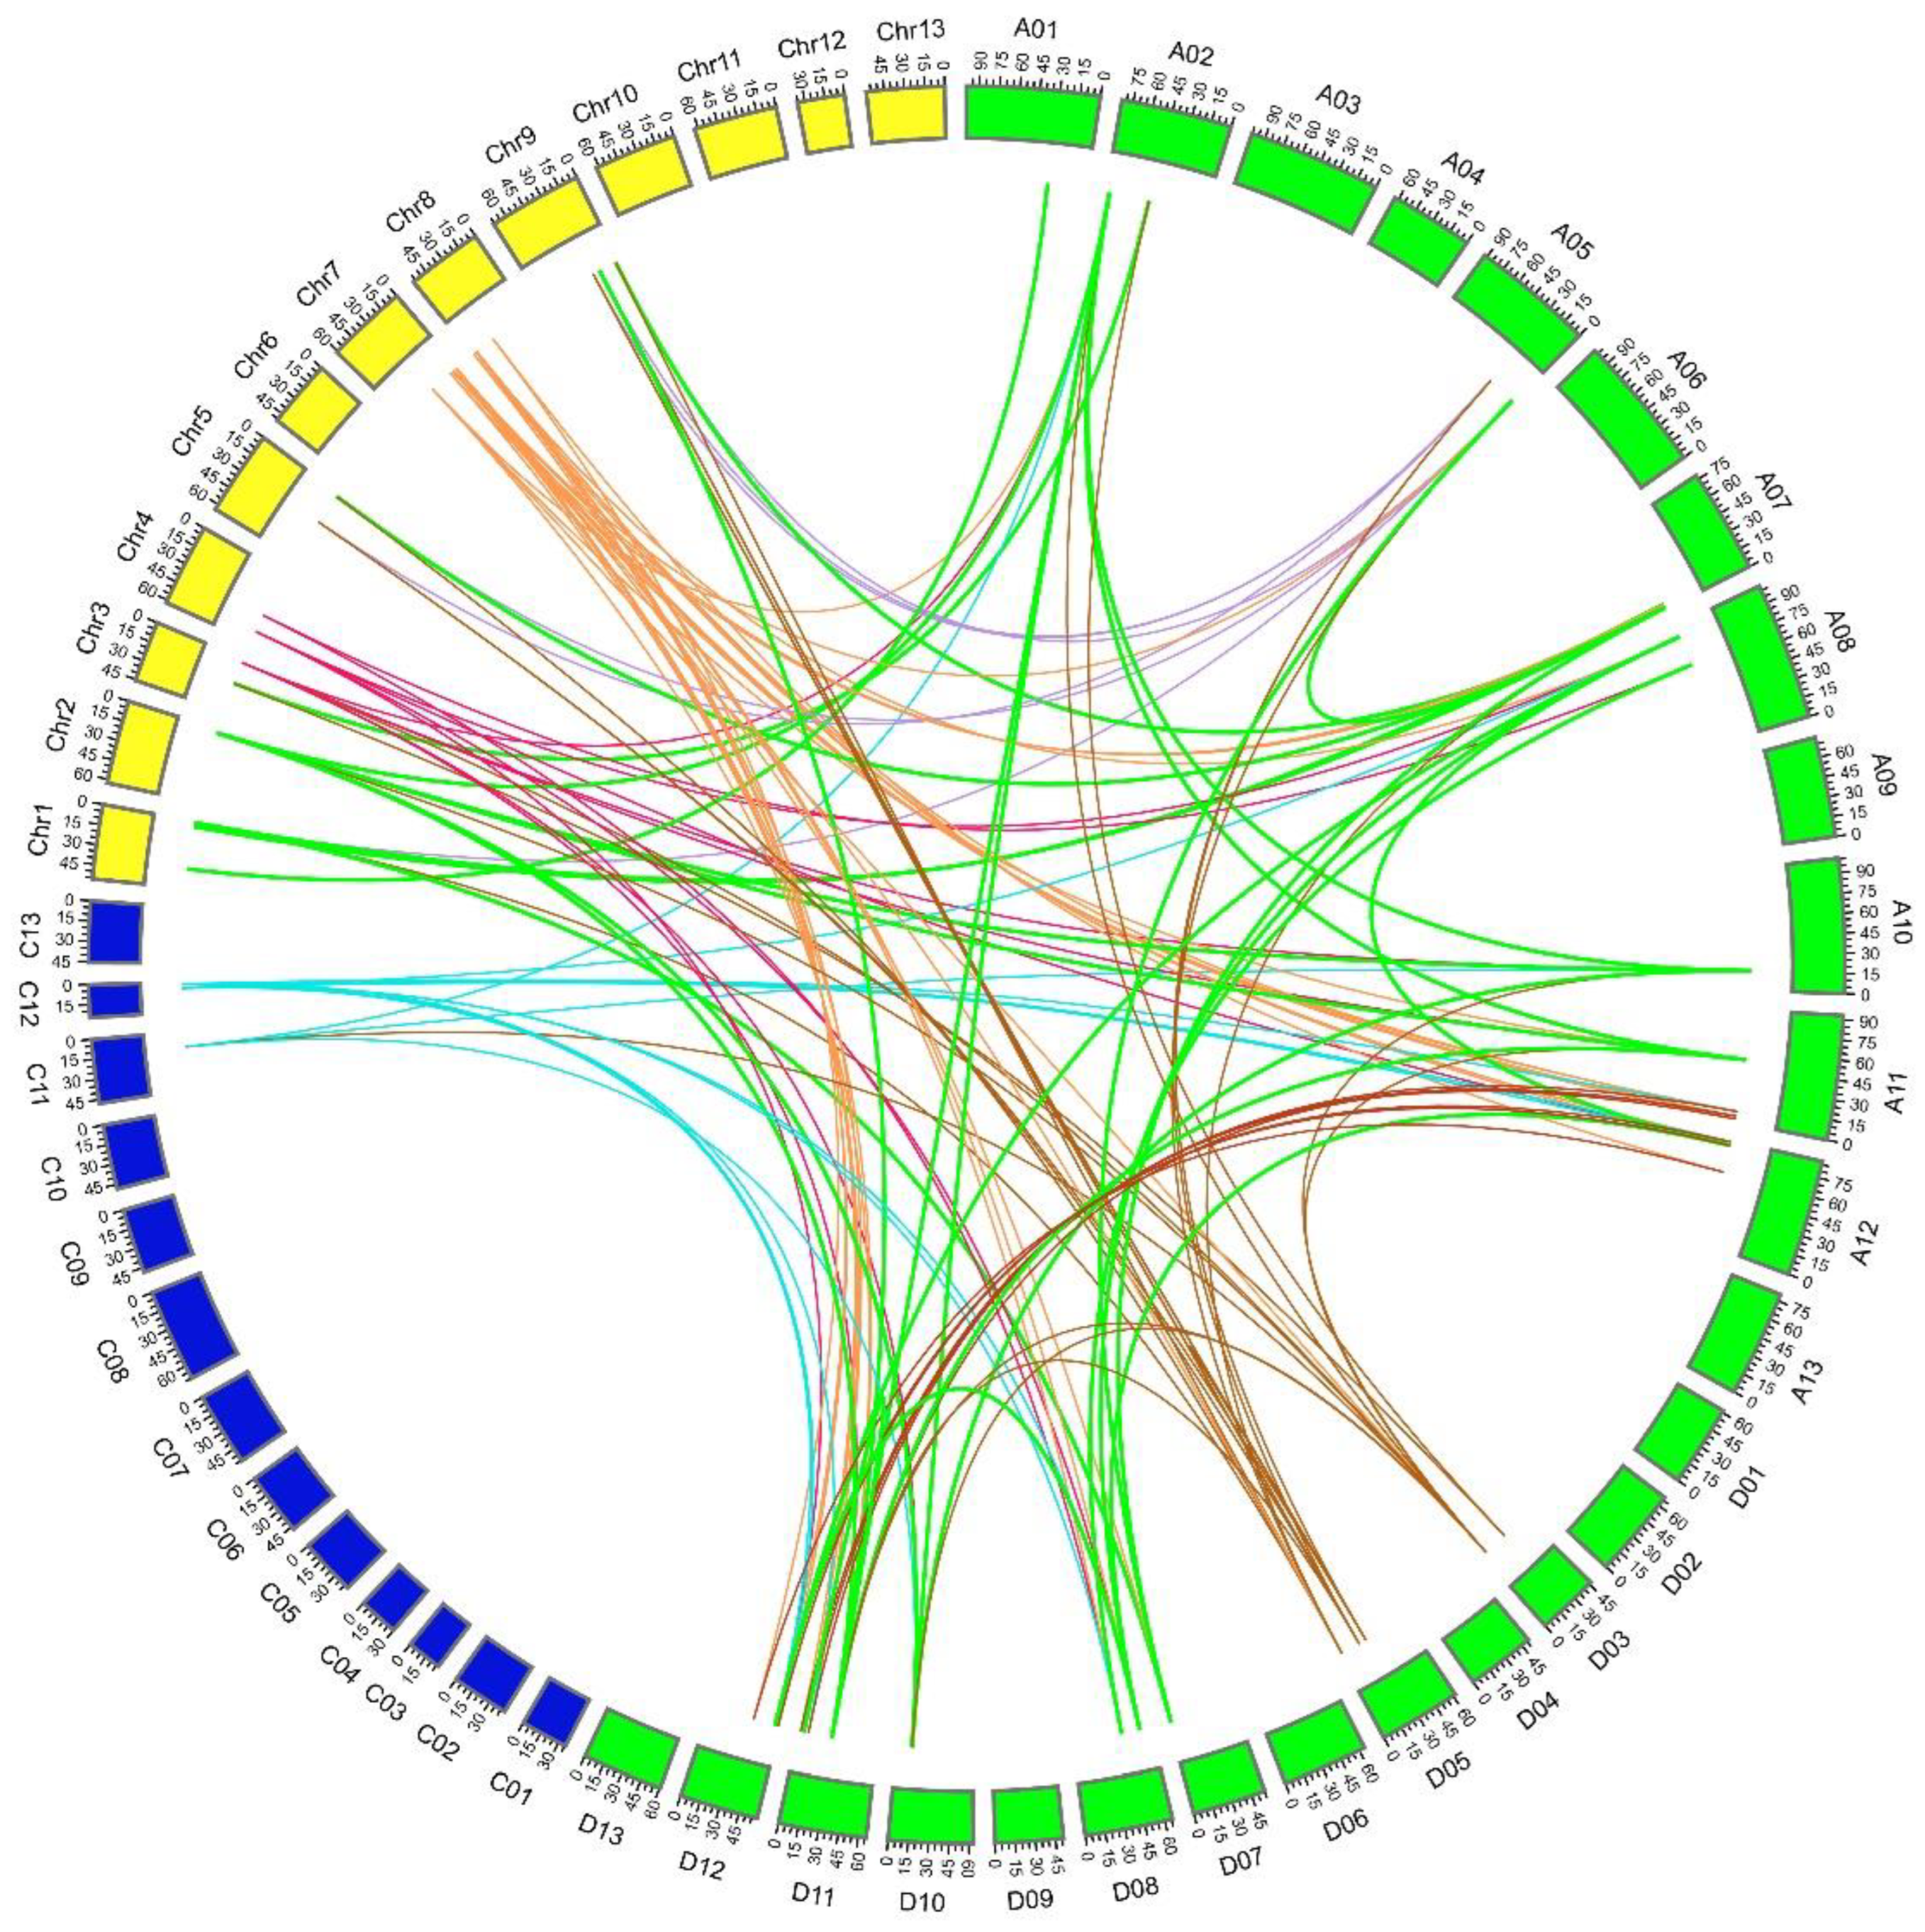
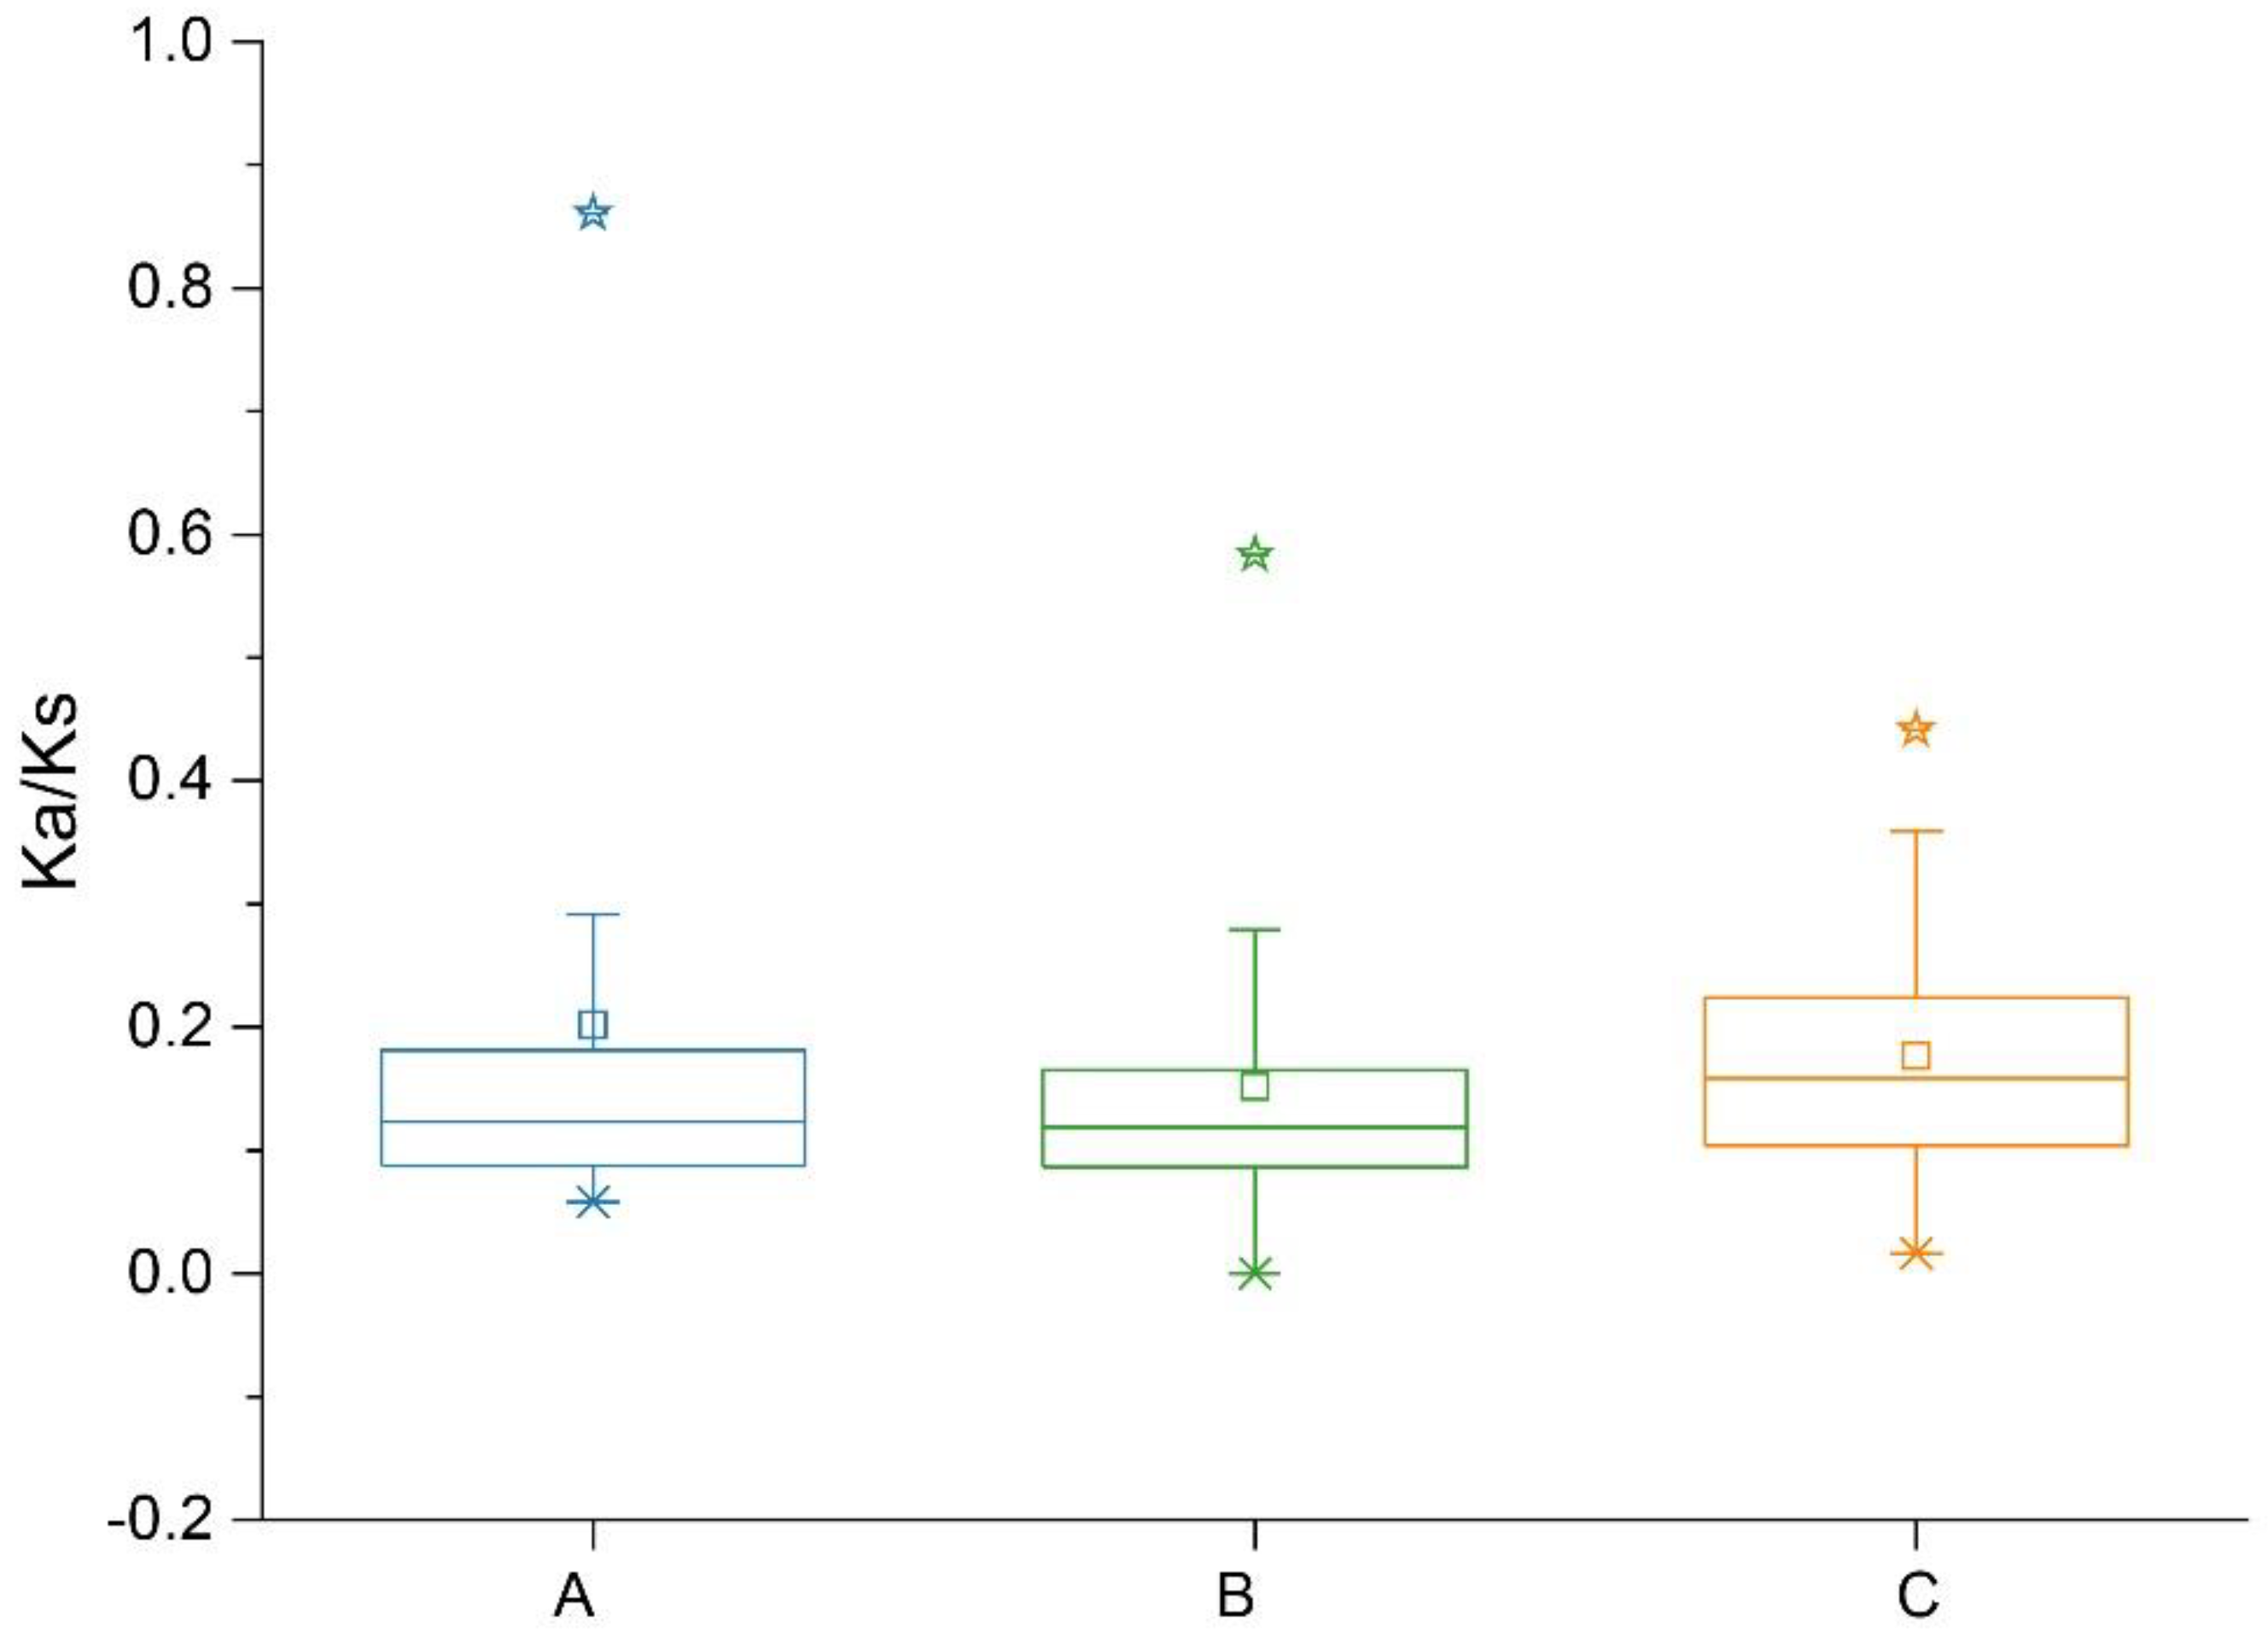
2.4. Collinearity and Ka:Ks Analysis
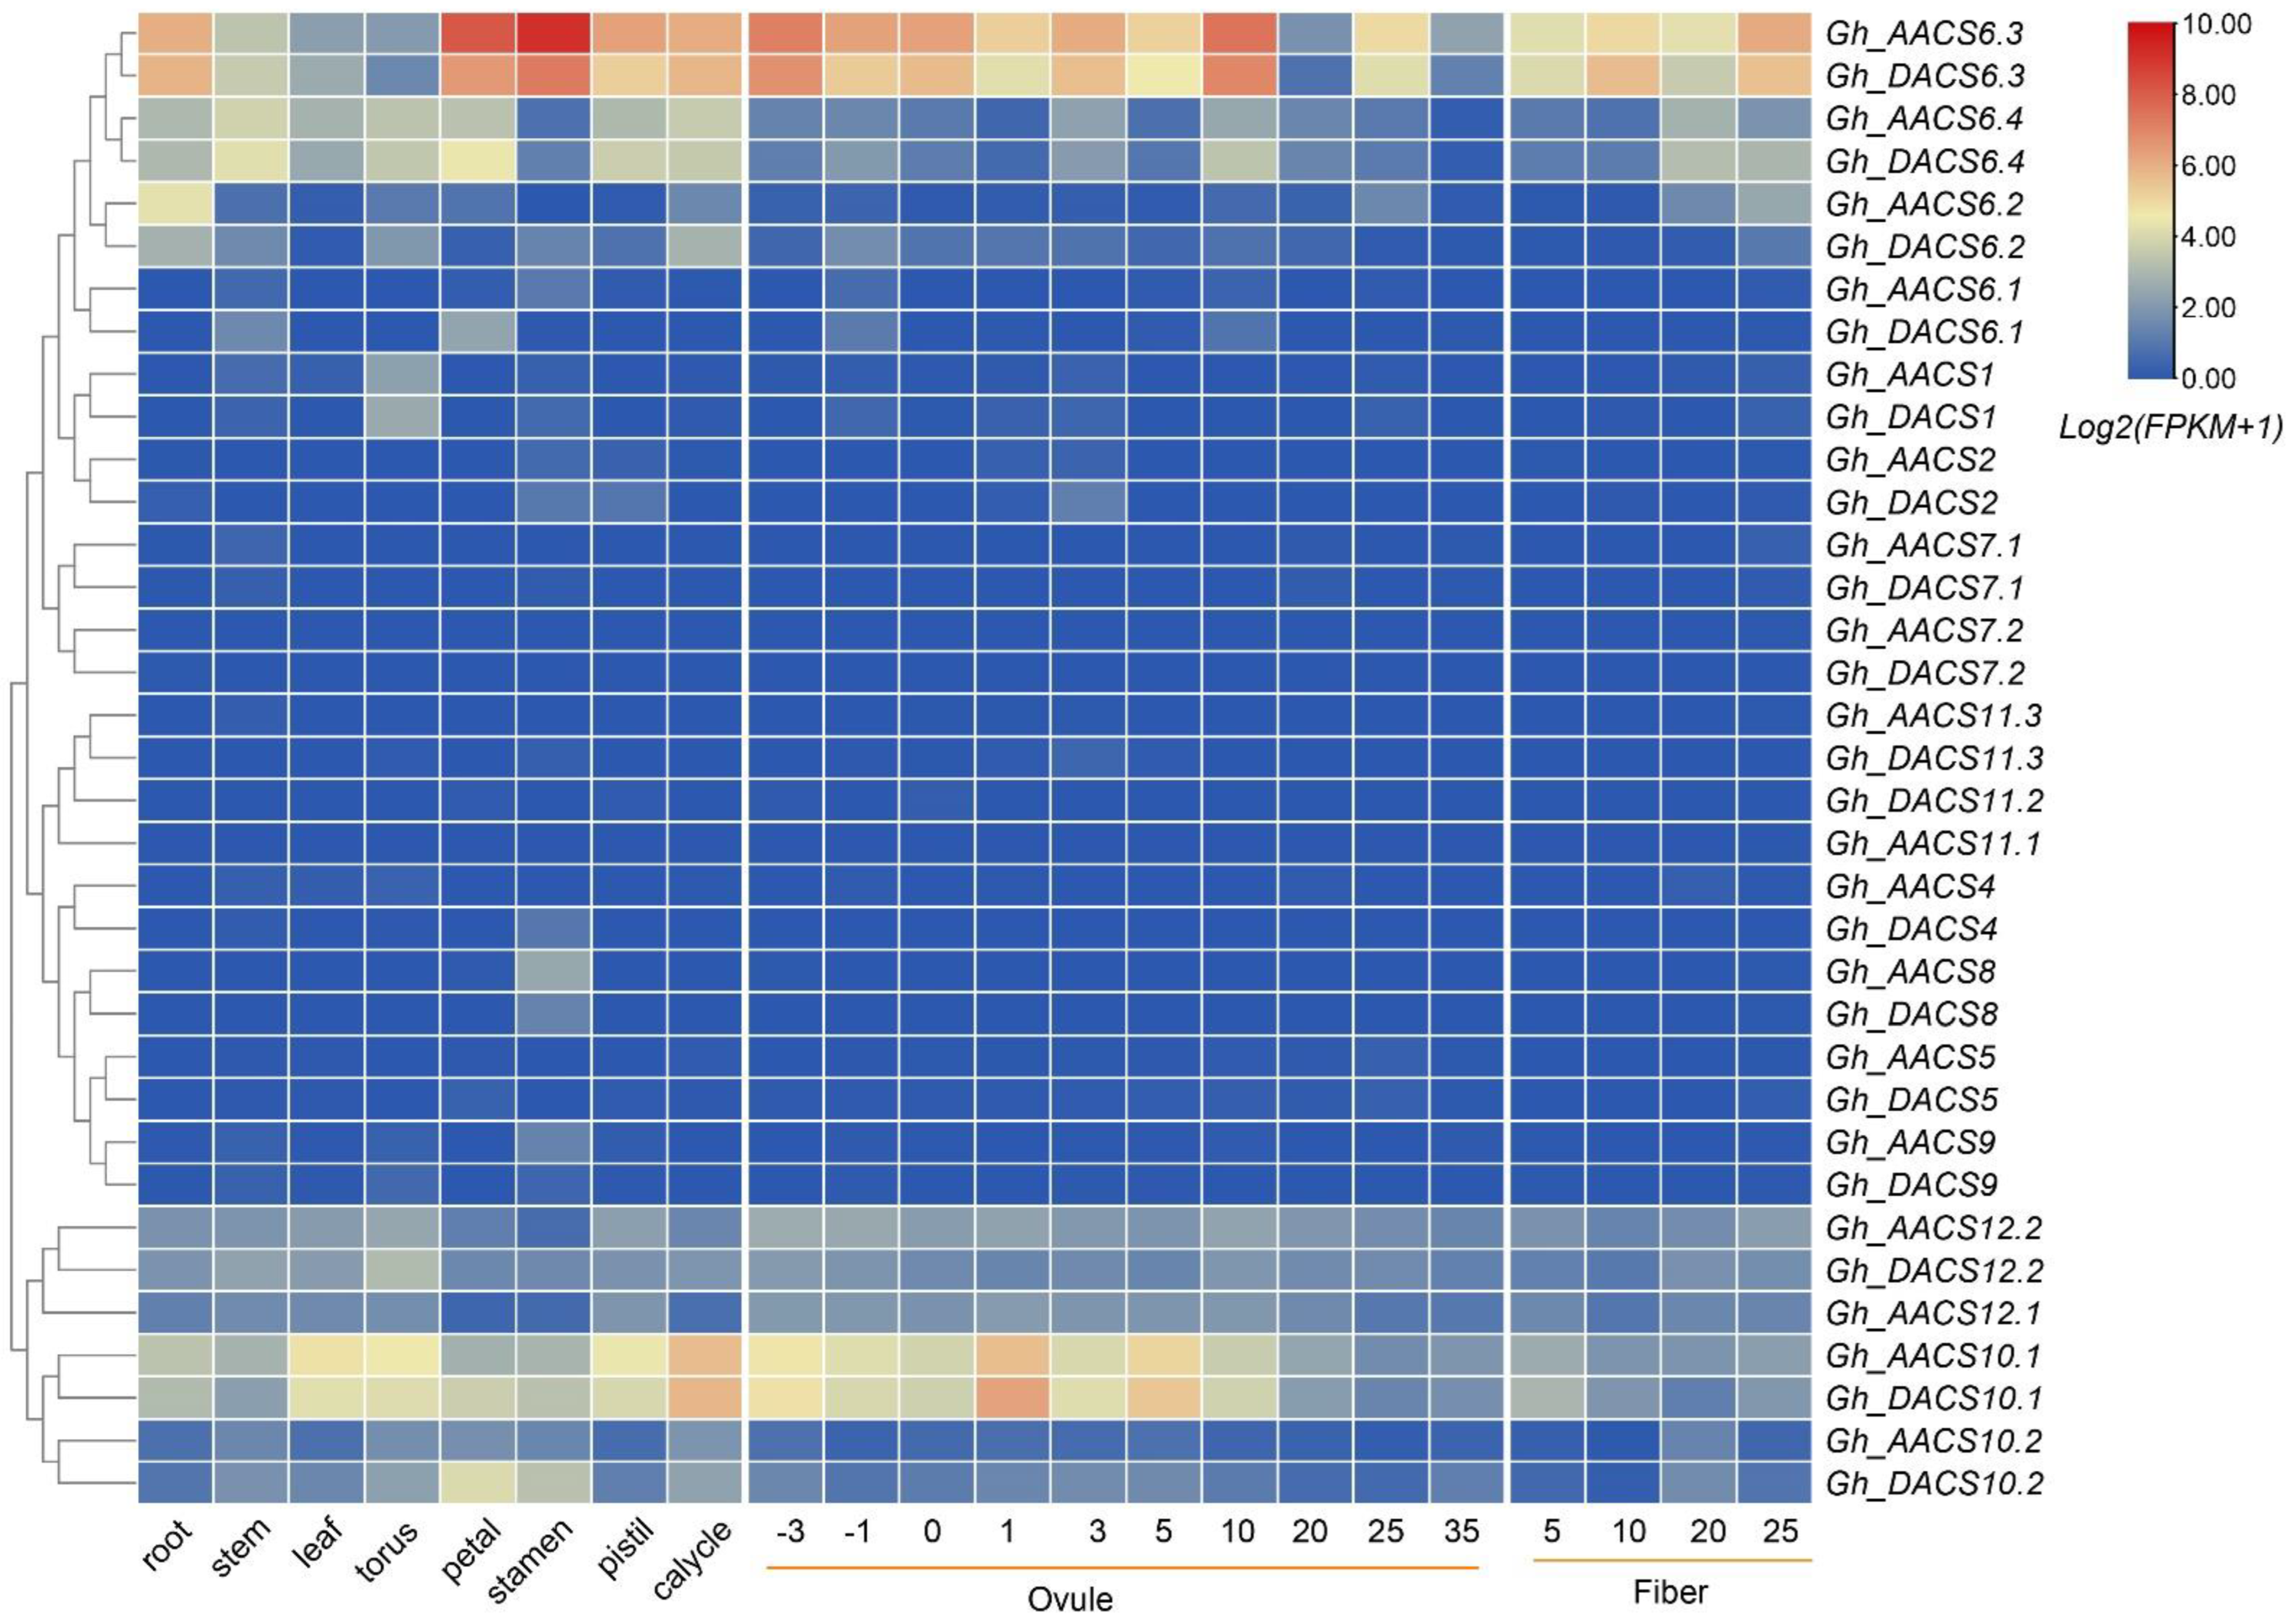
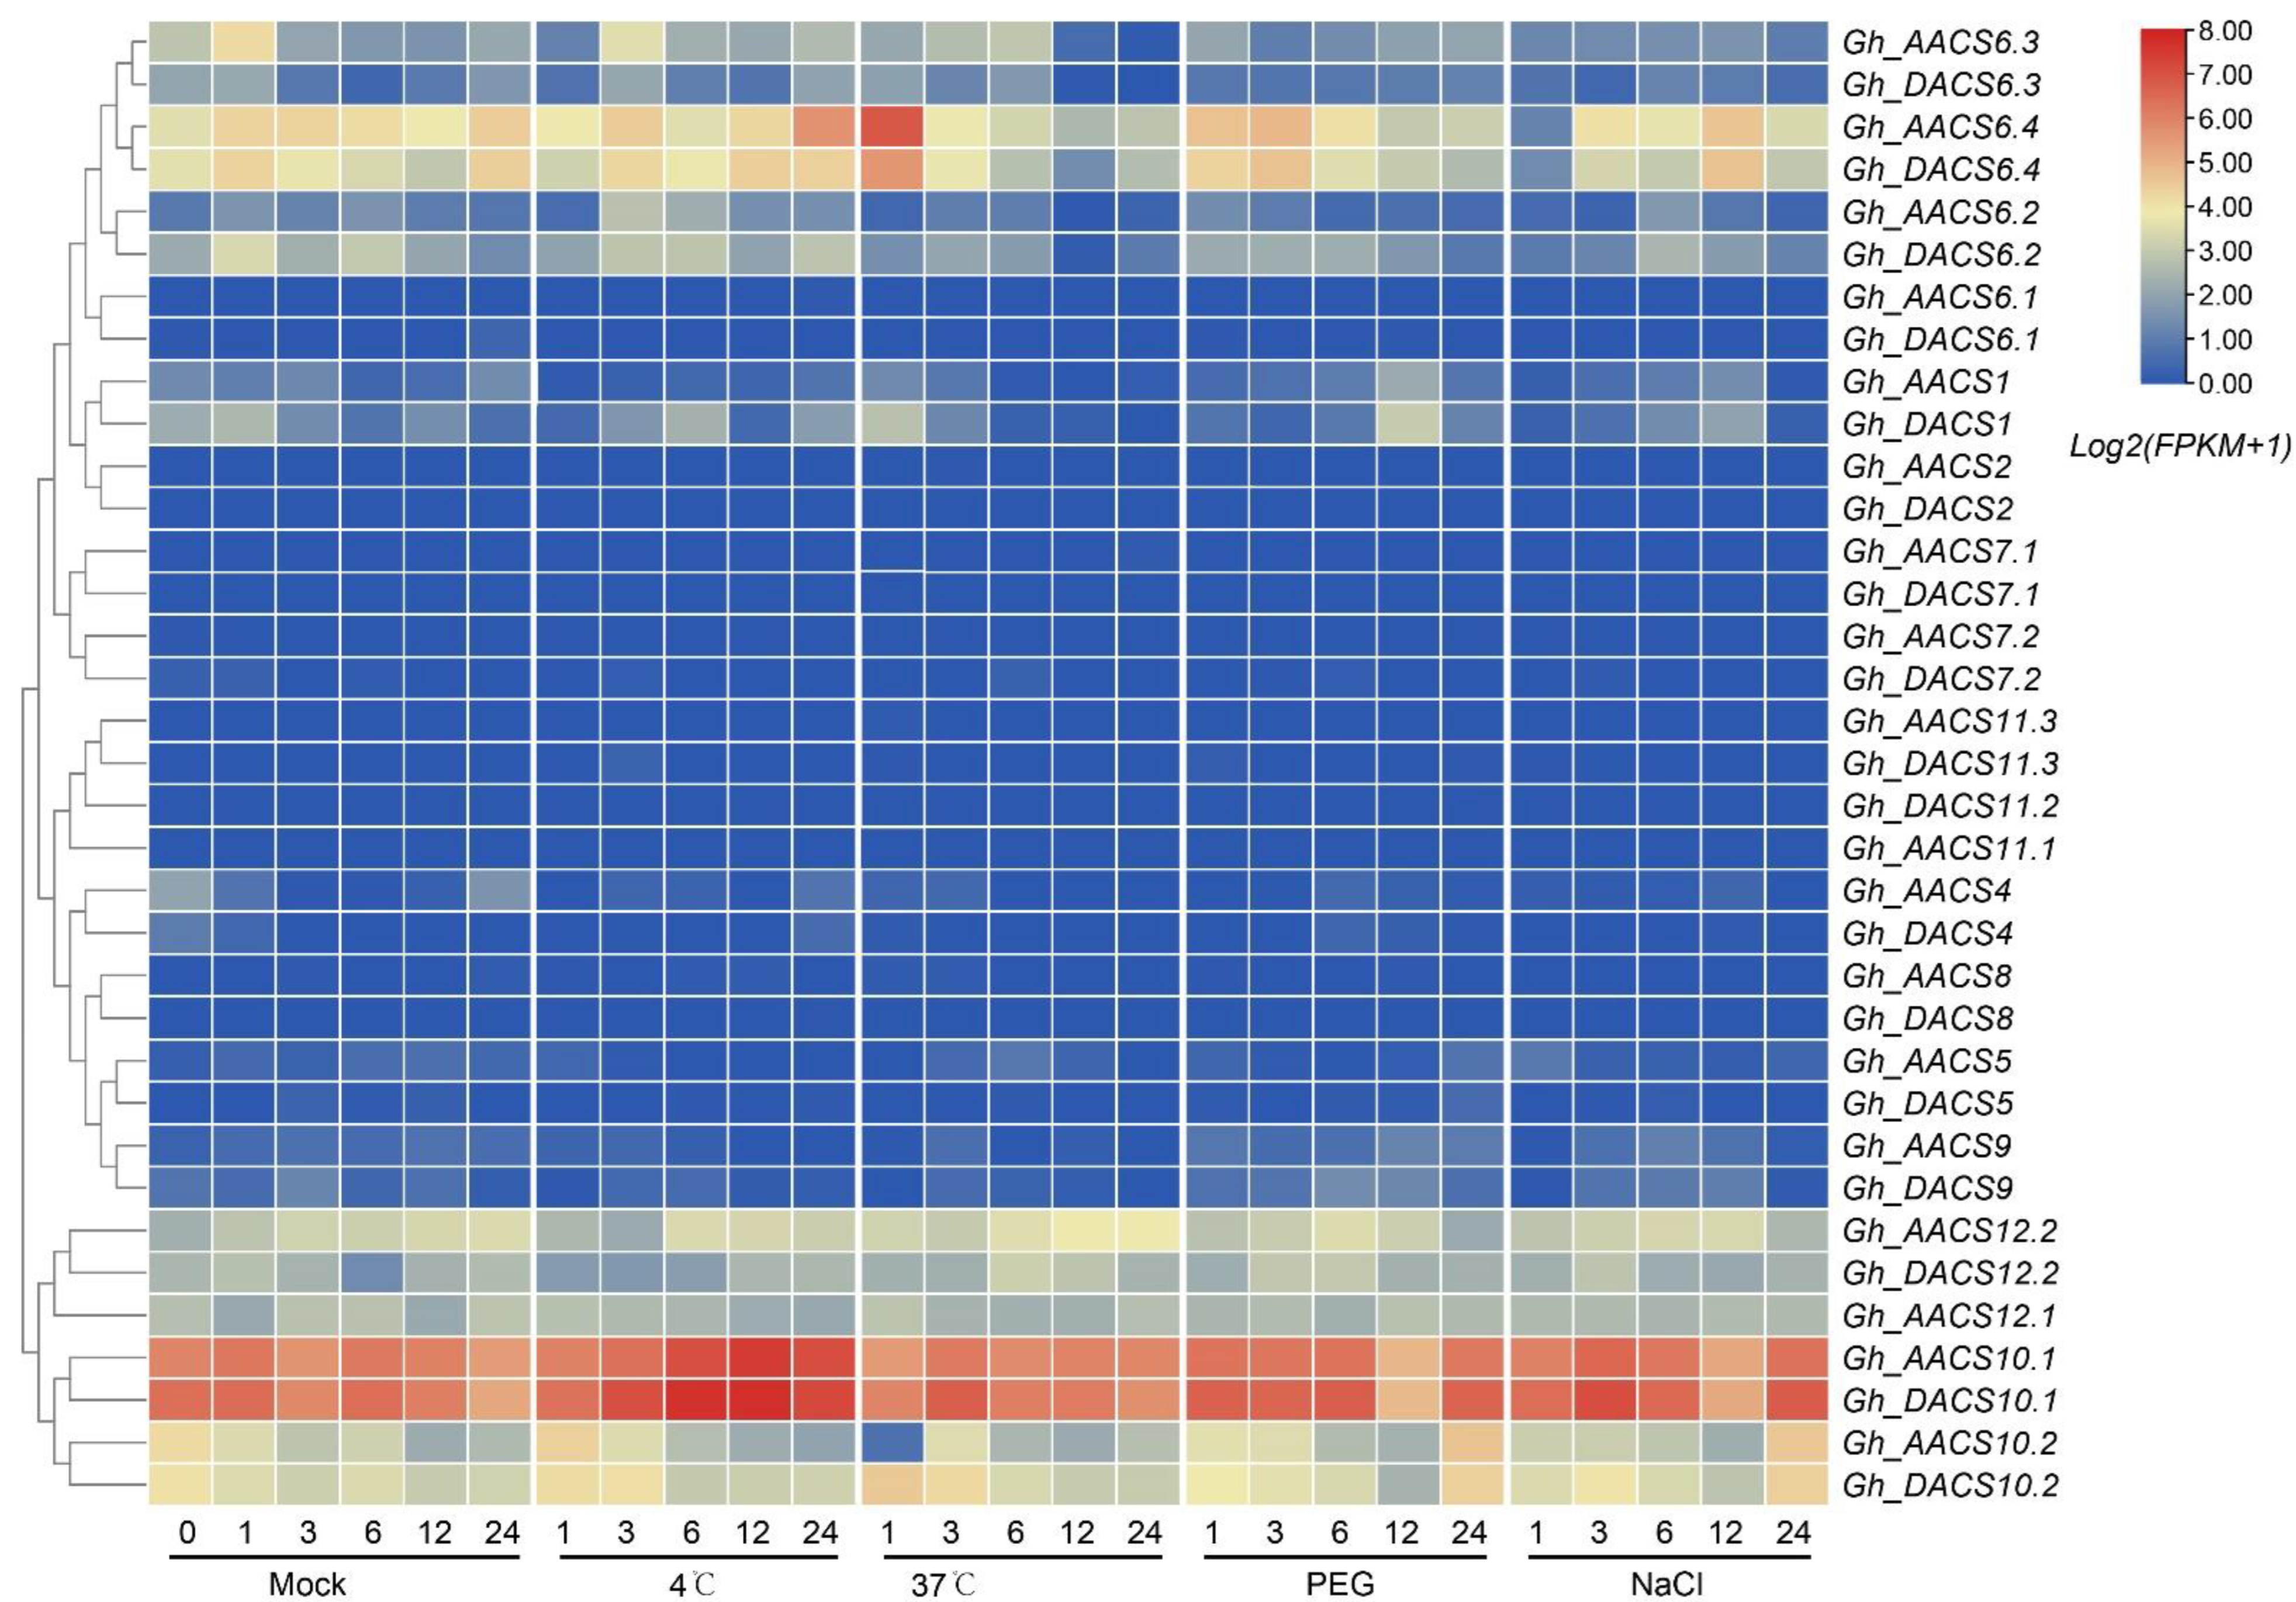
2.5. Analysis of GhACS Expression Patterns in Tissues and in Plants under Stress
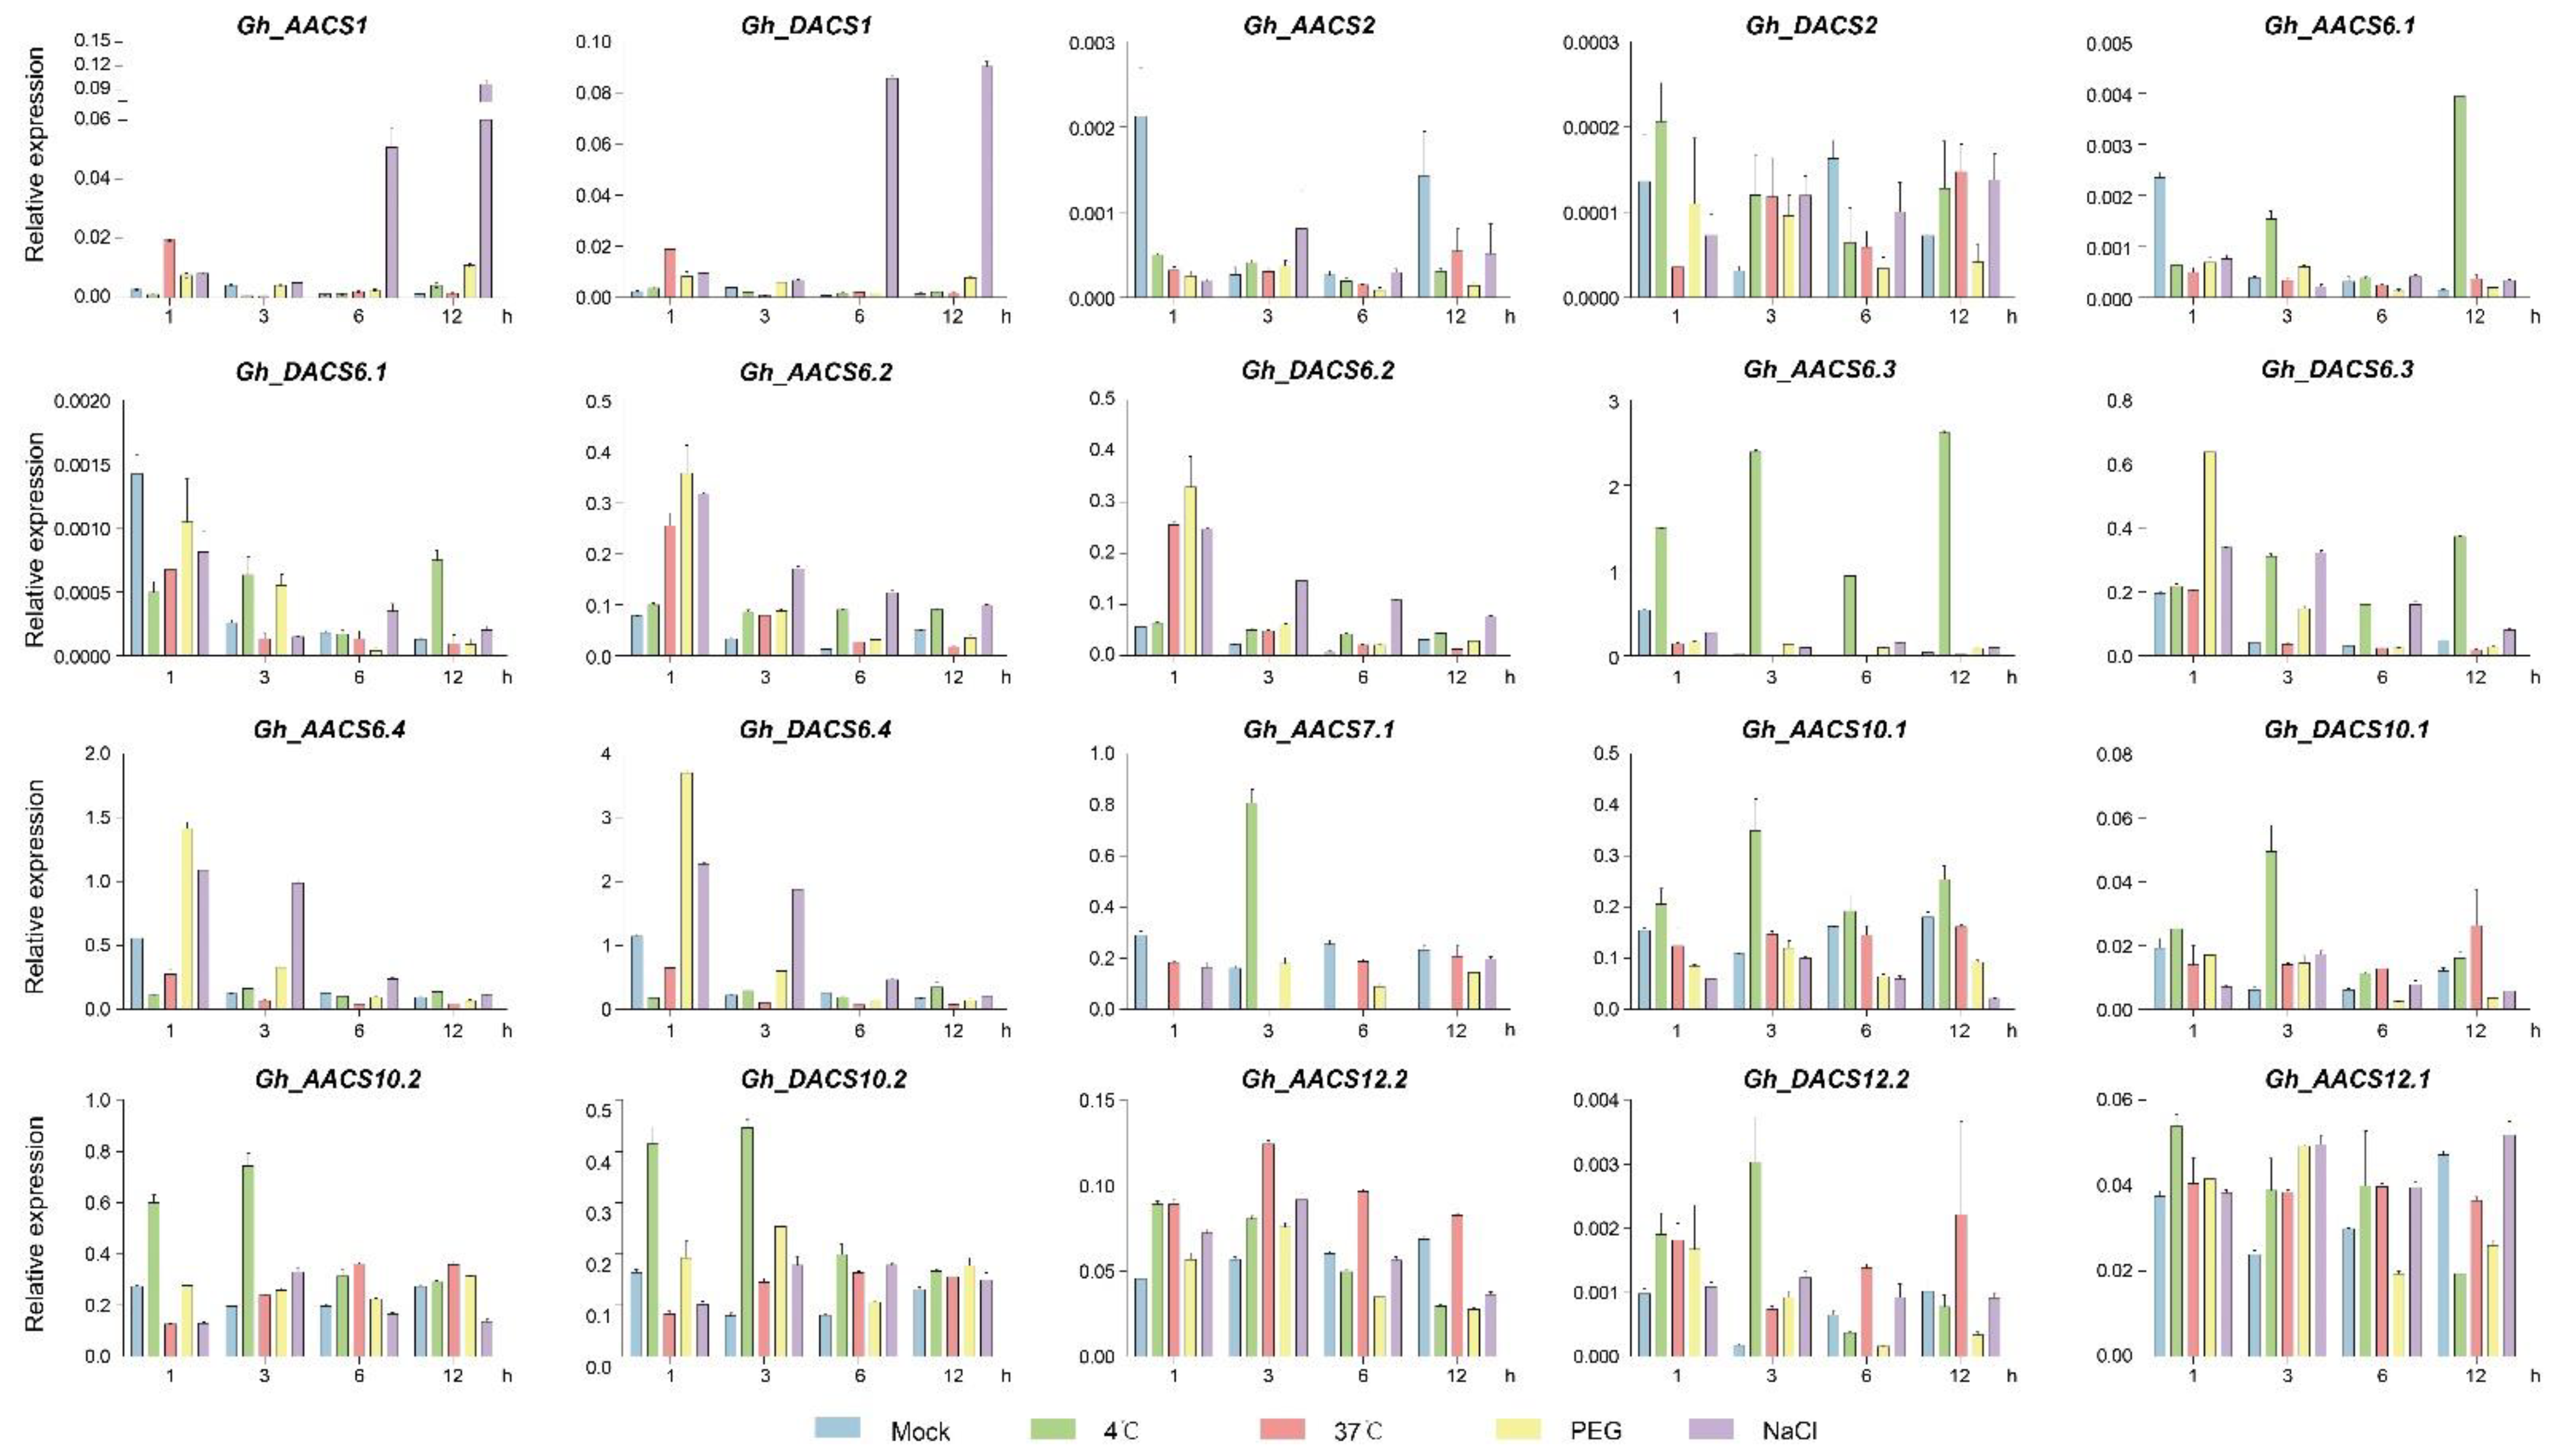
2.6. Analysis of GhACS Genes Expression Patterns in Plants under Abiotic Stress by Quantitative PCR (qPCR)
3. Discussion
4. Material and Methods
4.1. Identification of ACS Genes in Cotton
4.2. Phylogenetic Tree Construction
4.3. Chromosomal Location, Gene Structure, and Motif Analysis
4.4. Plant Growth and Tissue Sampling
4.5. Expression Patterns Analysis
Supplementary Materials
Author Contributions
Funding
Institutional Review Board Statement
Informed Consent Statement
Data Availability Statement
Acknowledgments
Conflicts of Interest
References
- Li, X.; Liu, N.; Sun, Y.; Wang, P.; Ge, X.; Pei, Y.; Liu, D.; Ma, X.; Li, F.; Hou, Y. The cotton GhWIN2 gene activates the cuticle biosynthesis pathway and influences the salicylic and jasmonic acid biosynthesis pathways. BMC Plant Biol. 2019, 19, 379. [Google Scholar] [CrossRef] [PubMed]
- Hughes, P.W. OsGSK2 Integrates Jasmonic Acid and Brassinosteroid Signaling in Rice. Plant Cell 2020, 32, 2669–2670. [Google Scholar] [CrossRef] [PubMed]
- Reid, M.S. Ethylene in Plant Growth, Development, and Senescence. Front. Plant Sci. 2017, 8, 475. [Google Scholar]
- Shi, Y.H.; Zhu, S.W.; Mao, X.Z.; Feng, J.X.; Qin, Y.M.; Zhang, L.; Cheng, J.; Wei, L.P.; Wang, Z.Y.; Zhu, Y.X. Transcriptome profiling, molecular biological, and physiological studies reveal a major role for ethylene in cotton fiber cell elongation. Plant Cell 2006, 18, 651–664. [Google Scholar] [CrossRef]
- Zhao, H.; Yin, C.C.; Ma, B.; Chen, S.Y.; Zhang, J.S. Ethylene signaling in rice and Arabidopsis: New regulators and mechanisms. J. Integr. Plant. Biol. 2021, 63, 102–125. [Google Scholar] [CrossRef] [PubMed]
- Li, D.; Flores-Sandoval, E.; Ahtesham, U.; Coleman, A.; Clay, J.M.; Bowman, J.L.; Chang, C. Ethylene-independent functions of the ethylene precursor ACC in Marchantia polymorpha. Nat. Plants 2020, 6, 1335–1344. [Google Scholar] [CrossRef]
- Iqbal, N.; Masood, A.; Khan, M.I.; Asgher, M.; Fatma, M.; Khan, N.A. Cross-talk between sulfur assimilation and ethylene signaling in plants. Plant Signal. Behav. 2013, 8, e22478. [Google Scholar] [CrossRef]
- Zhao, T.; Xu, X.; Wang, M.; Li, C.; Li, C.; Zhao, R.; Zhu, S.; He, Q.; Chen, J. Identification and profiling of upland cotton microRNAs at fiber initiation stage under exogenous IAA application. BMC Genom. 2019, 20, 421. [Google Scholar] [CrossRef] [PubMed]
- Ding, C.; Lin, X.; Zuo, Y.; Yu, Z.; Baerson, S.R.; Pan, Z.; Zeng, R.; Song, Y. Transcription factor OsbZIP49 controls tiller angle and plant architecture through the induction of indole-3-acetic acid-amido synthetases in rice. Plant J. 2021, 108, 1346–1364. [Google Scholar] [CrossRef] [PubMed]
- Ciarkowska, A.; Ostrowski, M.; Jakubowska, A. A serine carboxypeptidase-like acyltransferase catalyzes synthesis of indole-3-acetic (IAA) ester conjugate in rice (Oryza sativa). Plant Physiol. Biochem. 2018, 125, 126–135. [Google Scholar] [CrossRef]
- Gokani, S.J.; Thaker, V.S. Role of gibberellic acid in cotton fibre development. J. Agric. Sci. 2002, 138, 255–260. [Google Scholar] [CrossRef]
- Zhang, S.; Yang, R.; Huo, Y.; Liu, S.; Yang, G.; Huang, J.; Zheng, C.; Wu, C. Expression of cotton PLATZ1 in transgenic Arabidopsis reduces sensitivity to osmotic and salt stress for germination and seedling establishment associated with modification of the abscisic acid, gibberellin, and ethylene signalling pathways. BMC Plant Biol. 2018, 18, 218. [Google Scholar] [CrossRef] [PubMed]
- Wu, K.; Wang, S.; Song, W.; Zhang, J.; Wang, Y.; Liu, Q.; Yu, J.; Ye, Y.; Li, S.; Chen, J.; et al. Enhanced sustainable green revolution yield via nitrogen-responsive chromatin modulation in rice. Science 2020, 367, 2046. [Google Scholar] [CrossRef]
- Ecker, J.R. The ethylene signal transduction pathway in plants. Science 1995, 268, 667–675. [Google Scholar] [CrossRef] [PubMed]
- Suttle, J.C.; Hultstrand, J.F. Ethylene-induced leaf abscission in cotton seedlings: The physiological bases for age-dependent differences in sensitivity. Plant Physiol. 1991, 95, 29–33. [Google Scholar] [CrossRef][Green Version]
- Hamilton, A.J.; Bouzayen, M.; Grierson, D. Identification of a tomato gene for the ethylene-forming enzyme by expression in yeast. Proc. Natl. Acad. Sci. USA 1991, 88, 7434–7437. [Google Scholar] [CrossRef] [PubMed]
- Freytag, A.H. Ethylene-induced Fine Structure Alterations in Cotton and Sugarbeet Radicle Cells. Plant Physiol. 1977, 60, 140–143. [Google Scholar] [CrossRef]
- Li, F.; Fan, G.; Lu, C.; Xiao, G.; Zou, C.; Kohel, R.J.; Ma, Z.; Shang, H.; Ma, X.; Wu, J.; et al. Genome sequence of cultivated Upland cotton (Gossypium hirsutum TM-1) provides insights into genome evolution. Nat. Biotechnol. 2015, 33, 524–530. [Google Scholar] [CrossRef]
- Adams, D.O.; Yang, S.F. Ethylene biosynthesis: Identification of 1-aminocyclopropane-1-carboxylic acid as an intermediate in the conversion of methionine to ethylene. Proc. Natl. Acad. Sci. USA 1979, 76, 170–174. [Google Scholar] [CrossRef] [PubMed]
- Yang, S.F.; Hoffman, N.E. Ethylene Biosynthesis and its Regulation in Higher Plants. Annu. Rev. Plant Physiol. 1984, 35, 155–189. [Google Scholar] [CrossRef]
- Kende, H. Ethylene Biosynthesis. Annu. Rev. Plant Biol. 1993, 44, 283–307. [Google Scholar] [CrossRef]
- Yamagami, T.; Tsuchisaka, A.; Yamada, K.; Haddon, W.F.; Harden, L.A.; Theologis, A. Biochemical Diversity among the 1-Amino-cyclopropane-1-Carboxylate Synthase Isozymes Encoded by the Arabidopsis Gene Family. J. Biol. Chem. 2003, 278, 49102–49112. [Google Scholar] [CrossRef]
- Pattyn, J.; Vaughan-Hirsch, J.; Van de Poel, B. The regulation of ethylene biosynthesis: A complex multilevel control circuitry. New Phytol. 2021, 229, 770–782. [Google Scholar] [CrossRef] [PubMed]
- Yoon, G.M. New Insights into the Protein Turnover Regulation in Ethylene Biosynthesis. Mol. Cells 2015, 38, 597–603. [Google Scholar] [CrossRef] [PubMed]
- Xiong, L.; Xiao, D.; Xu, X.; Guo, Z.; Wang, N.N. The non-catalytic N-terminal domain of ACS7 is involved in the post-translational regulation of this gene in Arabidopsis. J. Exp. Bot. 2014, 65, 4397–4408. [Google Scholar] [CrossRef] [PubMed]
- Lyzenga, W.J.; Booth, J.K.; Stone, S. The Arabidopsis RING-type E3 ligase XBAT32 mediates the proteasomal degradation of the ethylene biosynthetic enzyme, 1-aminocyclopropane-1-carboxylate synthase 7. Plant J. 2012, 71, 23–34. [Google Scholar] [CrossRef] [PubMed]
- Marczak, M.; Cieśla, A.; Janicki, M.; Kasprowicz-Maluśki, A.; Kubiak, P.; Ludwików, A. Protein Phosphatases Type 2C Group A Interact with and Regulate the Stability of ACC Synthase 7 in Arabidopsis. Cells 2020, 9, 978. [Google Scholar] [CrossRef] [PubMed]
- Tamura, K.; Stecher, G.; Peterson, D.; Filipski, A.; Kumar, S. MEGA6: Molecular Evolutionary Genetics Analysis version 6.0. Mol. Biol. Evol. 2013, 30, 2725–2729. [Google Scholar] [CrossRef] [PubMed]
- Yoon, G.M.; Kieber, J.J. 14-3-3 regulates 1-aminocyclopropane-1-carboxylate synthase protein turnover in Arabidopsis. Plant Cell 2013, 25, 1016–1028. [Google Scholar] [CrossRef] [PubMed]
- Li, G.; Meng, X.; Wang, R.; Mao, G.; Han, L.; Liu, Y.; Zhang, S. Dual-level regulation of ACC synthase activity by MPK3/MPK6 cascade and its downstream WRKY transcription factor during ethylene induction in Arabidopsis. PLoS Genet. 2012, 8, e1002767. [Google Scholar] [CrossRef] [PubMed]
- Lv, B.; Tian, H.; Zhang, F.; Liu, J.; Lu, S.; Bai, M.; Li, C.; Ding, Z. Brassinosteroids regulate root growth by controlling reactive oxygen species homeostasis and dual effect on ethylene synthesis in Arabidopsis. PLoS Genet. 2018, 14, e1007144. [Google Scholar] [CrossRef] [PubMed]
- Li, Z.; Zhang, L.; Yu, Y.; Quan, R.; Zhang, Z.; Zhang, H.; Huang, R. The ethylene response factor AtERF11 that is transcriptionally modulated by the bZIP transcription factor HY5 is a crucial repressor for ethylene biosynthesis in Arabidopsis. Plant J. Cell Mol. Biol. 2011, 68, 88–99. [Google Scholar] [CrossRef]
- Dong, Z.; Yu, Y.; Li, S.; Wang, J.; Tang, S.; Huang, R. Abscisic Acid Antagonizes Ethylene Production through the ABI4-Mediated Transcriptional Repression of ACS4 and ACS8 in Arabidopsis. Mol. Plant 2016, 9, 126–135. [Google Scholar] [CrossRef] [PubMed]
- Klee, H.J.; Giovannoni, J. Genetics and Control of Tomato Fruit Ripening and Quality Attributes. Annu. Rev. Genet. 2011, 45, 41. [Google Scholar] [CrossRef] [PubMed]
- Pearrubia, L.; Aguilar, M.; Margossian, L.; Fischer, R.L. Effect of E8 Protein on Ethylene Biosynthesis during Tomato Fruit Ripening. In Cellular and Molecular Aspects of the Plant Hormone Ethylene; Springer: Berlin/Heidelberg, Germany, 1993. [Google Scholar]
- Christians, M.J.; Gingerich, D.J.; Hansen, M.; Binder, B.M.; Kieber, J.J.; Vierstra, R.D. The BTB ubiquitin ligases ETO1, EOL1 and EOL2 act collectively to regulate ethylene biosynthesis in Arabidopsis by controlling type-2 ACC synthase levels. Plant J. 2009, 57, 332–345. [Google Scholar] [CrossRef] [PubMed]
- Liang, X.; Oono, Y.; Shen, N.F.; Khler, C.; Li, K.; Scolnik, P.A.; Theologis, A.J.G. Characterization of two members (ACS1 and ACS3) of the 1-aminocyclopropane-1-carboxylate synthase gene family of Arabidopsis thaliana. Gene 1995, 167, 17–24. [Google Scholar] [CrossRef]
- Chae, H. The eto1, eto2, and eto3 Mutations and Cytokinin Treatment Increase Ethylene Biosynthesis in Arabidopsis by Increasing the Stability of ACS Protein. Plant Cell 2003, 15, 545–559. [Google Scholar] [CrossRef] [PubMed]
- Zarembinski, T.I.; Theologis, A. Anaerobiosis and plant growth hormones induce two genes encoding 1-aminocyclopropane-1-carboxylate synthase in rice (Oryza sativa L.). Mol. Biol. Cell 1993, 4, 363–373. [Google Scholar] [CrossRef] [PubMed]
- Zhou, Z.; de Almeida Engler, J.; Rouan, D.; Michiels, F.; Van Montagu, M.; Van Der Straeten, D. Tissue localization of a submergence-induced 1-aminocyclopropane-1-carboxylic acid synthase in rice. Plant Physiol. 2002, 129, 72–84. [Google Scholar] [CrossRef] [PubMed][Green Version]
- Trebitsh, T.; Staub, J.E.; O’Neill, S.D. Identification of a 1-aminocyclopropane-1-carboxylic acid synthase gene linked to the female (F) locus that enhances female sex expression in cucumber. Plant Physiol. 1997, 113, 987–995. [Google Scholar] [CrossRef] [PubMed]
- Boualem, A.; Lemhemdi, A.; Sari, M.A.; Pignoly, S.; Troadec, C.; Abou Choucha, F.; Solmaz, I.; Sari, N.; Dogimont, C.; Bendahmane, A. The Andromonoecious Sex Determination Gene Predates the Separation of Cucumis and Citrullus Genera. PLoS ONE 2016, 11, e0155444. [Google Scholar] [CrossRef]
- Shi, H.Y.; Zhang, Y.X. Expression and regulation of pear 1-aminocyclopropane-1-carboxylic acid synthase gene (PpACS1a) during fruit ripening, under salicylic acid and indole-3-acetic acid treatment, and in diseased fruit. Mol. Biol. Rep. 2014, 41, 4147–4154. [Google Scholar] [CrossRef] [PubMed]
- Choudhury, S.R.; Roy, S.; Sengupta, D.N. A Ser/Thr protein kinase phosphorylates MA-ACS1 (Musa acuminata 1-aminocyclopropane-1-carboxylic acid synthase 1) during banana fruit ripening. Planta 2012, 236, 491–511. [Google Scholar] [CrossRef]
- Wang, K.; Wang, Z.; Li, F.; Ye, W.; Wang, J.; Song, G.; Yue, Z.; Cong, L.; Shang, H.; Zhu, S.; et al. The draft genome of a diploid cotton Gossypium raimondii. Nat. Genet. 2012, 44, 1098–1103. [Google Scholar] [CrossRef]
- Jiroutova, P.; Oklestkova, J.; Strnad, M. Crosstalk between Brassinosteroids and Ethylene during Plant Growth and under Abiotic Stress Conditions. Int. J. Mol. Sci. 2018, 19, 3283. [Google Scholar] [CrossRef]
- Kazan, K. Diverse roles of jasmonates and ethylene in abiotic stress tolerance. Trends Plant Sci. 2015, 20, 219–229. [Google Scholar] [CrossRef] [PubMed]
- Husain, T.; Fatima, A.; Suhel, M.; Singh, S.; Sharma, A.; Prasad, S.M.; Singh, V.P. A brief appraisal of ethylene signaling under abiotic stress in plants. Plant Signal. Behav. 2020, 15, 1782051. [Google Scholar] [CrossRef] [PubMed]
- Lu, L.; Qanmber, G.; Li, J.; Pu, M.; Chen, G.; Li, S.; Liu, L.; Qin, W.; Ma, S.; Wang, Y.; et al. Identification and Characterization of the ERF Subfamily B3 Group Revealed GhERF13.12 Improves Salt Tolerance in Upland Cotton. Front. Plant Sci. 2021, 12, 705883. [Google Scholar] [CrossRef]
- Zhang, X.; Li, X.; Zhao, R.; Zhou, Y.; Jiao, Y. Evolutionary strategies drive a balance of the interacting gene products for the CBL and CIPK gene families. New Phytol. 2020, 226, 1506–1516. [Google Scholar] [CrossRef] [PubMed]
- Yu, D.; Li, X.; Li, Y.; Ali, F.; Li, F.; Wang, Z. Dynamic roles and intricate mechanisms of ethylene in epidermal hair development in Arabidopsis and cotton. New Phytol. 2022, 234, 375–391. [Google Scholar] [CrossRef]
- Yue, P.; Lu, Q.; Liu, Z.; Lv, T.; Li, X.; Bu, H.; Liu, W.; Xu, Y.; Yuan, H.; Wang, A. Auxin-activated MdARF5 induces the expression of ethylene biosynthetic genes to initiate apple fruit ripening. New Phytol. 2020, 226, 1781–1795. [Google Scholar] [CrossRef] [PubMed]
- Lee, H.Y.; Park, H.L.; Park, C.; Chen, Y.-C.; Yoon, G.M. Reciprocal antagonistic regulation of E3 ligases controls ACC synthase stability and responses to stress. Proc. Natl. Acad. Sci. USA 2021, 118, e2011900118. [Google Scholar] [CrossRef]
- Tan, S.T.; Xue, H.W. Casein kinase 1 regulates ethylene synthesis by phosphorylating and promoting the turnover of ACS5. Cell Rep. 2014, 9, 1692–1702. [Google Scholar] [CrossRef] [PubMed]
- Manuse, S.; Fleurie, A.; Zucchini, L.; Lesterlin, C.; Grangeasse, C. Role of eukaryotic-like serine/threonine kinases in bacterial cell division and morphogenesis. FEMS Microbiol. Rev. 2016, 40, 41–56. [Google Scholar] [CrossRef] [PubMed]
- Finn, R.D.; Coggill, P.; Eberhardt, R.Y.; Eddy, S.R.; Mistry, J.; Mitchell, A.L.; Potter, S.C.; Punta, M.; Qureshi, M.; Sangrador-Vegas, A.; et al. The Pfam protein families database: Towards a more sustainable future. Nucleic Acids Res. 2016, 44, D279–D285. [Google Scholar] [CrossRef]
- Yu, J.; Jung, S.; Cheng, C.H.; Ficklin, S.P.; Lee, T.; Zheng, P.; Jones, D.; Percy, R.G.; Main, D. CottonGen: A genomics, genetics and breeding database for cotton research. Nucleic Acids Res. 2014, 42, D1229–D1236. [Google Scholar] [CrossRef]
- Chen, C.; Chen, H.; Zhang, Y.; Thomas, H.R.; Frank, M.H.; He, Y.; Xia, R. TBtools: An Integrative Toolkit Developed for Interactive Analyses of Big Biological Data. Mol. Plant 2020, 13, 1194–1202. [Google Scholar] [CrossRef]
- Hu, B.; Jin, J.; Guo, A.-Y.; Zhang, H.; Luo, J.; Gao, G. GSDS 2.0: An upgraded gene feature visualization server. Bioinformatics 2015, 31, 1296–1297. [Google Scholar] [CrossRef] [PubMed]
- Bailey, T.L.; Williams, N.; Misleh, C.; Li, W.W. MEME: Discovering and analyzing DNA and protein sequence motifs. Nucleic Acids Res. 2006, 34, W369–W373. [Google Scholar] [CrossRef]
- Hoagland, D.R.; Arnon, D. The water culture method for growing plants without soil. Circular. Calif. Agric. Exp. Stn. 1950, 347, 32. [Google Scholar]
- Fan, S.; Liu, A.; Zhang, Z.; Zou, X.; Jiang, X.; Huang, J.; Fan, L.; Zhang, Z.; Deng, X.; Ge, Q.; et al. Genome-Wide Identification and Expression Analysis of the Metacaspase Gene Family in Gossypium Species. Genes 2019, 10, 527. [Google Scholar] [CrossRef] [PubMed]
- Hu, Y.; Chen, J.; Fang, L.; Zhang, Z.; Ma, W.; Niu, Y.; Ju, L.; Deng, J.; Zhao, T.; Lian, J.; et al. Gossypium barbadense and Gossypium hirsutum genomes provide insights into the origin and evolution of allotetraploid cotton. Nat. Genet. 2019, 51, 739–748. [Google Scholar] [CrossRef] [PubMed]
- Kim, D.; Langmead, B.; Salzberg, S.L. HISAT: A fast spliced aligner with low memory requirements. Nat. Methods 2015, 12, 357–360. [Google Scholar] [CrossRef]
- Pertea, M.; Kim, D.; Pertea, G.M.; Leek, J.T.; Salzberg, S.L. Transcript-level expression analysis of RNA-seq experiments with HISAT, StringTie and Ballgown. Nat. Protoc. 2016, 11, 1650–1667. [Google Scholar] [CrossRef]
- Kim, D.; Paggi, J.M.; Park, C.; Bennett, C.; Salzberg, S.L. Graph-based genome alignment and genotyping with HISAT2 and HISAT-genotype. Nat. Biotechnol. 2019, 37, 907–915. [Google Scholar] [CrossRef]
- Zou, X.; Ali, F.; Jin, S.; Li, F.; Wang, Z. RNA-Seq with a novel glabrous-ZM24fl reveals some key lncRNAs and the associated targets in fiber initiation of cotton. BMC Plant Biol. 2022, 22, 61. [Google Scholar] [CrossRef] [PubMed]


Publisher’s Note: MDPI stays neutral with regard to jurisdictional claims in published maps and institutional affiliations. |
© 2022 by the authors. Licensee MDPI, Basel, Switzerland. This article is an open access article distributed under the terms and conditions of the Creative Commons Attribution (CC BY) license (https://creativecommons.org/licenses/by/4.0/).
Share and Cite
Li, J.; Zou, X.; Chen, G.; Meng, Y.; Ma, Q.; Chen, Q.; Wang, Z.; Li, F. Potential Roles of 1-Aminocyclopropane-1-carboxylic Acid Synthase Genes in the Response of Gossypium Species to Abiotic Stress by Genome-Wide Identification and Expression Analysis. Plants 2022, 11, 1524. https://doi.org/10.3390/plants11111524
Li J, Zou X, Chen G, Meng Y, Ma Q, Chen Q, Wang Z, Li F. Potential Roles of 1-Aminocyclopropane-1-carboxylic Acid Synthase Genes in the Response of Gossypium Species to Abiotic Stress by Genome-Wide Identification and Expression Analysis. Plants. 2022; 11(11):1524. https://doi.org/10.3390/plants11111524
Chicago/Turabian StyleLi, Jie, Xianyan Zou, Guoquan Chen, Yongming Meng, Qi Ma, Quanjia Chen, Zhi Wang, and Fuguang Li. 2022. "Potential Roles of 1-Aminocyclopropane-1-carboxylic Acid Synthase Genes in the Response of Gossypium Species to Abiotic Stress by Genome-Wide Identification and Expression Analysis" Plants 11, no. 11: 1524. https://doi.org/10.3390/plants11111524
APA StyleLi, J., Zou, X., Chen, G., Meng, Y., Ma, Q., Chen, Q., Wang, Z., & Li, F. (2022). Potential Roles of 1-Aminocyclopropane-1-carboxylic Acid Synthase Genes in the Response of Gossypium Species to Abiotic Stress by Genome-Wide Identification and Expression Analysis. Plants, 11(11), 1524. https://doi.org/10.3390/plants11111524