Article

Predicting the Potential Suitable Climate for Coconut (Cocos nucifera L.) Cultivation in India under Climate Change Scenarios Using the MaxEnt Model

1
Indian Council of Agricultural Research—Central Plantation Crops Research Institute, Kasaragod 671124, Kerala, India
2
Forest Research Institute, Dehradun 248001, Uttarakhand, India
3
Indian Council of Agricultural Research—Central Plantation Crops Research Institute Research Centre, Mohit Nagar 735101, West Bengal, India
4
Sustainable Intensification Innovation Lab, Kansas State University, Manhattan, KS 66506, USA
*
Author to whom correspondence should be addressed.
Plants 2022, 11(6), 731; https://doi.org/10.3390/plants11060731
Submission received: 2 January 2022 / Revised: 7 February 2022 / Accepted: 2 March 2022 / Published: 9 March 2022

Abstract

:
Climate change and climate variability are projected to alter the geographic suitability of lands for crop cultivation. Early awareness of the future climate of the current cultivation areas for a perennial tree crop like coconut is needed for its adaptation and sustainable cultivation in vulnerable areas. We analyzed coconut’s vulnerability to climate change in India, based on climate projections for the 2050s and the 2070s under two Representative Concentration Pathways (RCPs): 4.5 and 8.5. Based on the current cultivation regions and climate change predictions from seven ensembles of Global Circulation Models, we predict changes in relative climatic suitability for coconut cultivation using the MaxEnt model. Bioclimatic variables Bio 4 (temperature seasonality, 34.4%) and Bio 7 (temperature annual range, 28.7%) together contribute 63.1%, which along with Bio 15 (precipitation seasonality, 8.6%) determined 71.7% of the climate suitability for coconuts in India. The model projected that some current coconut cultivation producing areas will become unsuitable (plains of South interior Karnataka and Tamil Nadu) requiring crop change, while other areas will require adaptations in genotypic or agronomic management (east coast and the south interior plains), and yet in others, the climatic suitability for growing coconut will increase (west coast). The findings suggest the need for adaptation strategies so as to ensure sustainable cultivation of coconut at least in presently cultivated areas.

1. Introduction

Coconut (Cocos nucifera L.) is an environmentally friendly smallholder palm of the tropical environment, cultivated in more than 94 countries in the world over 11.99 M ha, producing 67.04 billion nuts with a productivity of 5592 nuts ha−1 [1]. Indonesia is the largest coconut-producing country followed by the Philippines, while India, with 2.1 million ha and 2.73 million t copra, occupies third place in area and second place in production. Around 80 million people depend directly on coconut for their livelihood [2]. The coconut industry, which traditionally relied upon copra and coconut oil, and to some extent coir, is experiencing a tremendous transformation towards product diversification, high value product development, by-product utilization, and more importantly, is now being used as health drink [3]. Of late, the nutraceutical and functional food properties of tender coconut water, virgin coconut oil [4], and inflorescence sap [5,6] are being harnessed for a diversity of health products and preventive medicine applications [7,8,9]. The health benefits of coconut are driving its sales. As a result of this, since 2000, a steady annual increment has been seen for coconut and coconut products and this is predicted to continue increasing further [10].
To strike a balance between future demand and supply, production has to be augmented either through increased productivity or through cultivating a larger area. The global cultivation area of coconut clearly indicates that no significant area expansion has taken place during the 2010 to 2015 period. Meanwhile, during the last decade, coconut growing regions experienced frequent severe weather events like drought and flood and numerous pests and diseases infestations, as a result productivity declined, and global coconut production stagnated [11]. Hence, it may be a great challenge to increase the expected production unless adoptive measures against the predicted threat of climate change are addressed.
Climate variables such as temperature, precipitation, and salinity have enormous impacts on the growth and development of coconut as in other species, and these factors had restricted its cultivation to southern geographical regions of India [12,13,14,15]. These variables alter the physiology, phenology, behavior, and ecological interactions of the crops [16,17,18] and affect the production faster than expected [19]. High temperature, to a large extent, had offset the otherwise positive effect of the rising atmospheric CO2 on coconut seedlings, which occurs in many C3 crops [20]. This suggests that climate change variables must be assessed together to ascertain how a changing climate will impact coconut [21]. The type of combinatorial experiments that study the effects of both warming and elevated CO2 on coconut at different stages of growth are very much limited. Coconut grows well in north India, but when the summer temperature goes up (Tmax > 40 °C) under low humidity nut production is severely dented. Pollen germination on stigma [22] and pollen tube growth through style [23] in coconut is highly sensitive to high temperature resulting in poor fertilization and nut set. Similar to high temperature, water limitation is another common limitation in coconut ecosystems; more than 60% of the crop is grown under rainfed condition. The interaction effects of rising CO2, warming, and water deficit in coconut is not well studied, but is well studied in other perennials like grassland [24,25] or cocoa [26]. The lack of sufficient data on the response of coconut to climatic variables led us to use the correlative model MaxEnt to assess the coconut suitability/unsuitability of a region.
In order to predict resulting changes in the relative climatic suitability of crop-growing regions under future climate scenarios, MaxEnt is widely used and can run with presence data alone [27]. MaxEnt is considered to be the best method among the species distribution modeling (SDM) techniques [27,28] due to its higher success rate and excellent results even with a low sample size [29]. It is an important aid in understanding the influence of climate change on species distributions [30,31,32]. MaxEnt was used to predict the change in climate of some of the plantation growing areas like areas growing cocoa in African countries [33,34], coffee in Zimbabwe [35], and other agricultural crops [36,37,38]. Despite the important role of coconut in safeguarding the livelihood of millions of people in the south Indian region, the literature shows that there has been little research into the future climate suitability of the region for coconut cultivation. The present study aims to evaluate the potential impacts of climate change on the suitability of a habitat for coconut cultivation and fill this key research gap. We used the MaxEnt model with the kuenm framework in R software [39]. The specific objectives of this study were to (a) determine the potential impacts of environmental variables on coconut cultivation; (b) model the current and future suitability for coconut cultivation under two climate scenarios (RCP 4.5 and RCP 8.5) for the years 2050 and 2070; and (c) identify the potential changes in the suitability of the land for coconut cultivation. We also suggest adaptation measures to reduce the vulnerability of coconut to the projected changes.

2. Methods

2.1. Study Area

The coconut palm in India is grown under varying climatic and soil conditions mostly between 8°4′ N and 20° N latitudes. The study area and coconut occurrence points are shown in Figure 1. Major coconut growing states and their district-wise area and climate and soil characteristics are presented in Table 1. During the 1960s, the west coast of India, i.e., Kerala and coastal Karnataka, were the traditional coconut cultivation areas. Out of the total area, the major share of nearly 70% was in Kerala followed by 13.65% in Karnataka, only 7.6% in TN (Tamil Nadu), and 4.8% in AP (Andhra Pradesh). Over the years, cultivation has spread to the plains of Karnataka and TN, resulting in increase in the Karnataka and TN share to 28% and 20.3%, respectively, with only a marginal increase in AP (5.2%) and a sharp decline in the Kerala share to 35% (CDB; https://www.coconutboard.gov.in, accessed on 22 June 2021). The west coast, with its high rainfall (annual rainfall is >2000 mm) and moderate temperature (Tmax, maximum temperature of 34 to 36 °C), is ideal for coconut cultivation. However, on the east coast, the rainfall is low (around 1000 to 1200 mm) and Tmax reaches a maximum of 40 to 42 °C in some of the coconut growing regions.

2.2. Coconut Occurrence Data

The data on major coconut growing states and districts was sourced from the Coconut Development Board (CDB; https://www.coconutboard.gov.in, accessed on 7 January 2021) website. From the list, the districts with a large area under coconut cultivation were selected for the study. From each of these districts, the names and areas of the village with extensive coconut cultivation were obtained from the agriculture/horticulture officer of the respective district. In addition to these, the district and village level data for the state of Karnataka was sourced from the crop survey website (www.cropsurvey.karnataka.gov.in, accessed on 23 February 2021). In India, a village is a clustered human settlement or community, larger than a hamlet but smaller than a town, with a population typically ranging from a few hundred to a few thousand. Villages are the smallest unit for which the coconut cropped areas and production records are maintained by the agricultural or horticultural offices. Through this process, nearly 3000 coconut occurrence points were collected from different coconut growing regions, followed by manual verification using Google Earth map. The Google Earth platform provides high-resolution images of coconut orchards and it is, therefore, suitable for identifying coconut cultivation areas. These data, along with the point data collected using Global Positioning System (GPS) in previous studies, constituted the occurrence points (Figure 1b). To reduce the issue of spatial sampling biases caused by multiple autocorrelated locations, the coconut occurrence points were spatially rarefied at 5 km using the SDM Toolbox 2.0 [40] in ArcGIS v. 10 (Registration Number EFL431708926). The final coconut occurrence dataset used for building SDMs included 1008 occurrence records. Figure 1b presents the final coconut records utilized for the modeling exercise.

2.3. Selection of Environmental Variables

As environmental predictors, we used 19 bioclimatic variables (Table 2) from Paleoclim.org [41] for historical (1979–2013) and current climate (baseline) data and from the World Clim.v1.4 database (http://www.worldclim.org/download, accessed on 15 March 2020) [42] for the future climate data for the 2050s (average for 2041–2060) and 2070s (average for 2061–2080). Variables representing the two future scenarios ((representative concentration pathway RCP 4.5 (intermediate scenario) and RCP 8.5 (very high emission scenario)) were an ensemble of 7 GCM Models (BCC-CSM1-1, GFDL-CM3, HadGEM2-ES, MIROC5, MIROC-CHEM, MIROC-ESM, NorESM1-M), because of their good predictive ability of climate for India [43,44]. Predictors were obtained at two-and-a-half-minute spatial resolution (approximately 5 km2 per pixel), which is an adequate resolution for ecological niche models based only on climate variables [29].
It is recommended to include non-climatic variables to enhance the predictive performance of SDMs [45,46]. Hence, we included soil and two topographical variables elevation and land cover (Table 2), which have a considerable influence on coconut cultivation in India. Soil data were downloaded from FAO (http://www.fao.org/soils-portal/data-hub/soil-maps-anddatabases/harmonized-world-soil-database-v12/en/, accessed on 22 May 2020), and elevation data were sourced from the shuttle radar topography mission dataset (https://cgiarcsi.community/data/srtm-90m-digital-elevation-database-v4-1/, accessed 22 May 2020). The source of land cover data was Glob Cover 2009 (http://due.esrin.esa.int/page_globcover.php, accessed on 22 May 2020). All the data were converted into two-and-half minute spatial resolutions (approximately 5 km2 per pixel), the same as that of climate variables.
To select a distinct set of variables that contributed the most to the models, we used the correlation analysis of the SDM Toolbox 2.0 by eliminating one variable per pair with correlations of (r > 0.85) (Table 3). Seven highly correlated climate variables were eliminated and the remaining 12 bioclimatic variables, along with 2 topographical variables and soil were selected for the model calibration.

2.4. Model

The climate suitability for the cultivation of coconut under the future climate was studied using MaxEnt 3.4.1 [27]. This software is based upon the maximum entropy principle, which is freely available at (url:http://biodiversityinformatics.amnh.org/open_source/MaxEnt/, accessed on 21 November 2021), and holds anything with the maximum entropy closest to its real state under known conditions [47]. The MaxEnt model is used to estimate the target probability distribution by finding the probability distribution of the maximum entropy (i.e., that which is most spread out or closest to uniform) that is subject to a set of constraints that represent our incomplete information regarding the target distribution [48,49].

2.5. Model Calibration

The kuenm R package is used for the detailed calibration of the MaxEnt model, its selection, final model creation, and evaluation [39]. The occurrence data is split into 75–25 subsets for model calibration and internal testing, respectively, using the kuenm_occ_split function. The kuenm varComb function was used to generate 16 sets of environmental predictors for calibration, with the minimum number of variables taken as 14. The model chose variable predictor set 6 (which excluded Bio 5) for final model running. The variables used for the final model running with their description are listed in Table 2, and a detailed description of each variable is available in O’Donnell and Ignizio [50]. We created 2480 candidate models by combining 16 sets of environmental predictors, 5 values of regularization multiplier (0.1, 0.2, 0.3, 0.4, 0.5), and 31 combinations of feature classes (l, q, p, t, h, lq, lp, lt, lh, qp, qt, qh, pt, ph, th, lqp, lqt, lqh, lpt, lph, lth, qpt, qph, qth, pth, lqpt, lqph, lqth, lpth, qpth, lqpth). The candidate model performance was evaluated based on significance (partial ROC, with 500 iterations and 50% of data for bootstrapping), omission rates (E = 5%), and model complexity (AICc). Final model selected is the one with the lowest omission rate and delta AICc values of ≤2. After the creation of the final model with the parameter sets selected as best, the model projections were made for RCP 4.5 and 8.5 for the years 2050 and 2070 using the kuenm_mod function. The free extrapolation transfer was selected for future projections.

2.6. Model Evaluation

The area under the curve (AUC) or receiver operating characteristics (ROC) was used as the MaxEnt predictive performance metric under the ROC curve. The AUC was an effective threshold independent index that could evaluate a model’s ability to discriminate presence from absence (or background) [51]. The MaxEnt output provides an AUC or sensitivity vs 1-specificity graph, which describes the accuracy and fit of the predicted model. An AUC value of 0.5 indicated that the model performance was no better than random, while values close to 1.0 indicated better model performance [51]. The closer the AUC was to 1, the better the model performance.

2.7. Threshold Selection

The logistic output format ranging from 0 (unsuitable) to 1 (maximum suitability) was adopted for the model results, which indicates climate suitability for the cultivation of coconut (probability of presence) [52]. Binary model predictions from each scenario were overlapped in Arc-GIS v. 10.0 to map the current climatic range and potential future expansion and contraction. The binary suitable/unsuitable area was calculated for each scenario (current, RCP 4.5, and RCP 8.5), using ‘maximum training sensitivity plus specificity’ as the logistic threshold cut off value [53] to give an objective numerical overview of potential climatic suitability contraction and expansion. Maximizing the sum of the specificity and sensitivity logistic threshold was used to differentiate between presences and absences, as is recommended for models that use presence-only and background data (e.g., MaxEnt). It minimizes the mean of the error rate for positive observations and the error rate for negative observations [54].
The present and future suitability maps produced by the model ranged from 0 to 1. These maps were reclassified into five suitability classes, i.e., ‘Barely’ (0–0.05), ‘Very Low Suitability’ (0.05–0.25), ‘Low Suitability’ (0.25–0.45), ‘Moderate Suitability’ (0.45–0.65), ‘High Suitability’ (0.65–0.85), and ‘Very High Suitability’ (0.85–1.0). Binary rasters were used to analyze the predicted contraction and expansion areas using the SDM toolbox 2.0. ‘Barely’ and ‘Very Low Suitability’ classes were considered to be unsuitable categories as per the threshold value, and remaining classifications are considered to be suitable categories.

3. Results

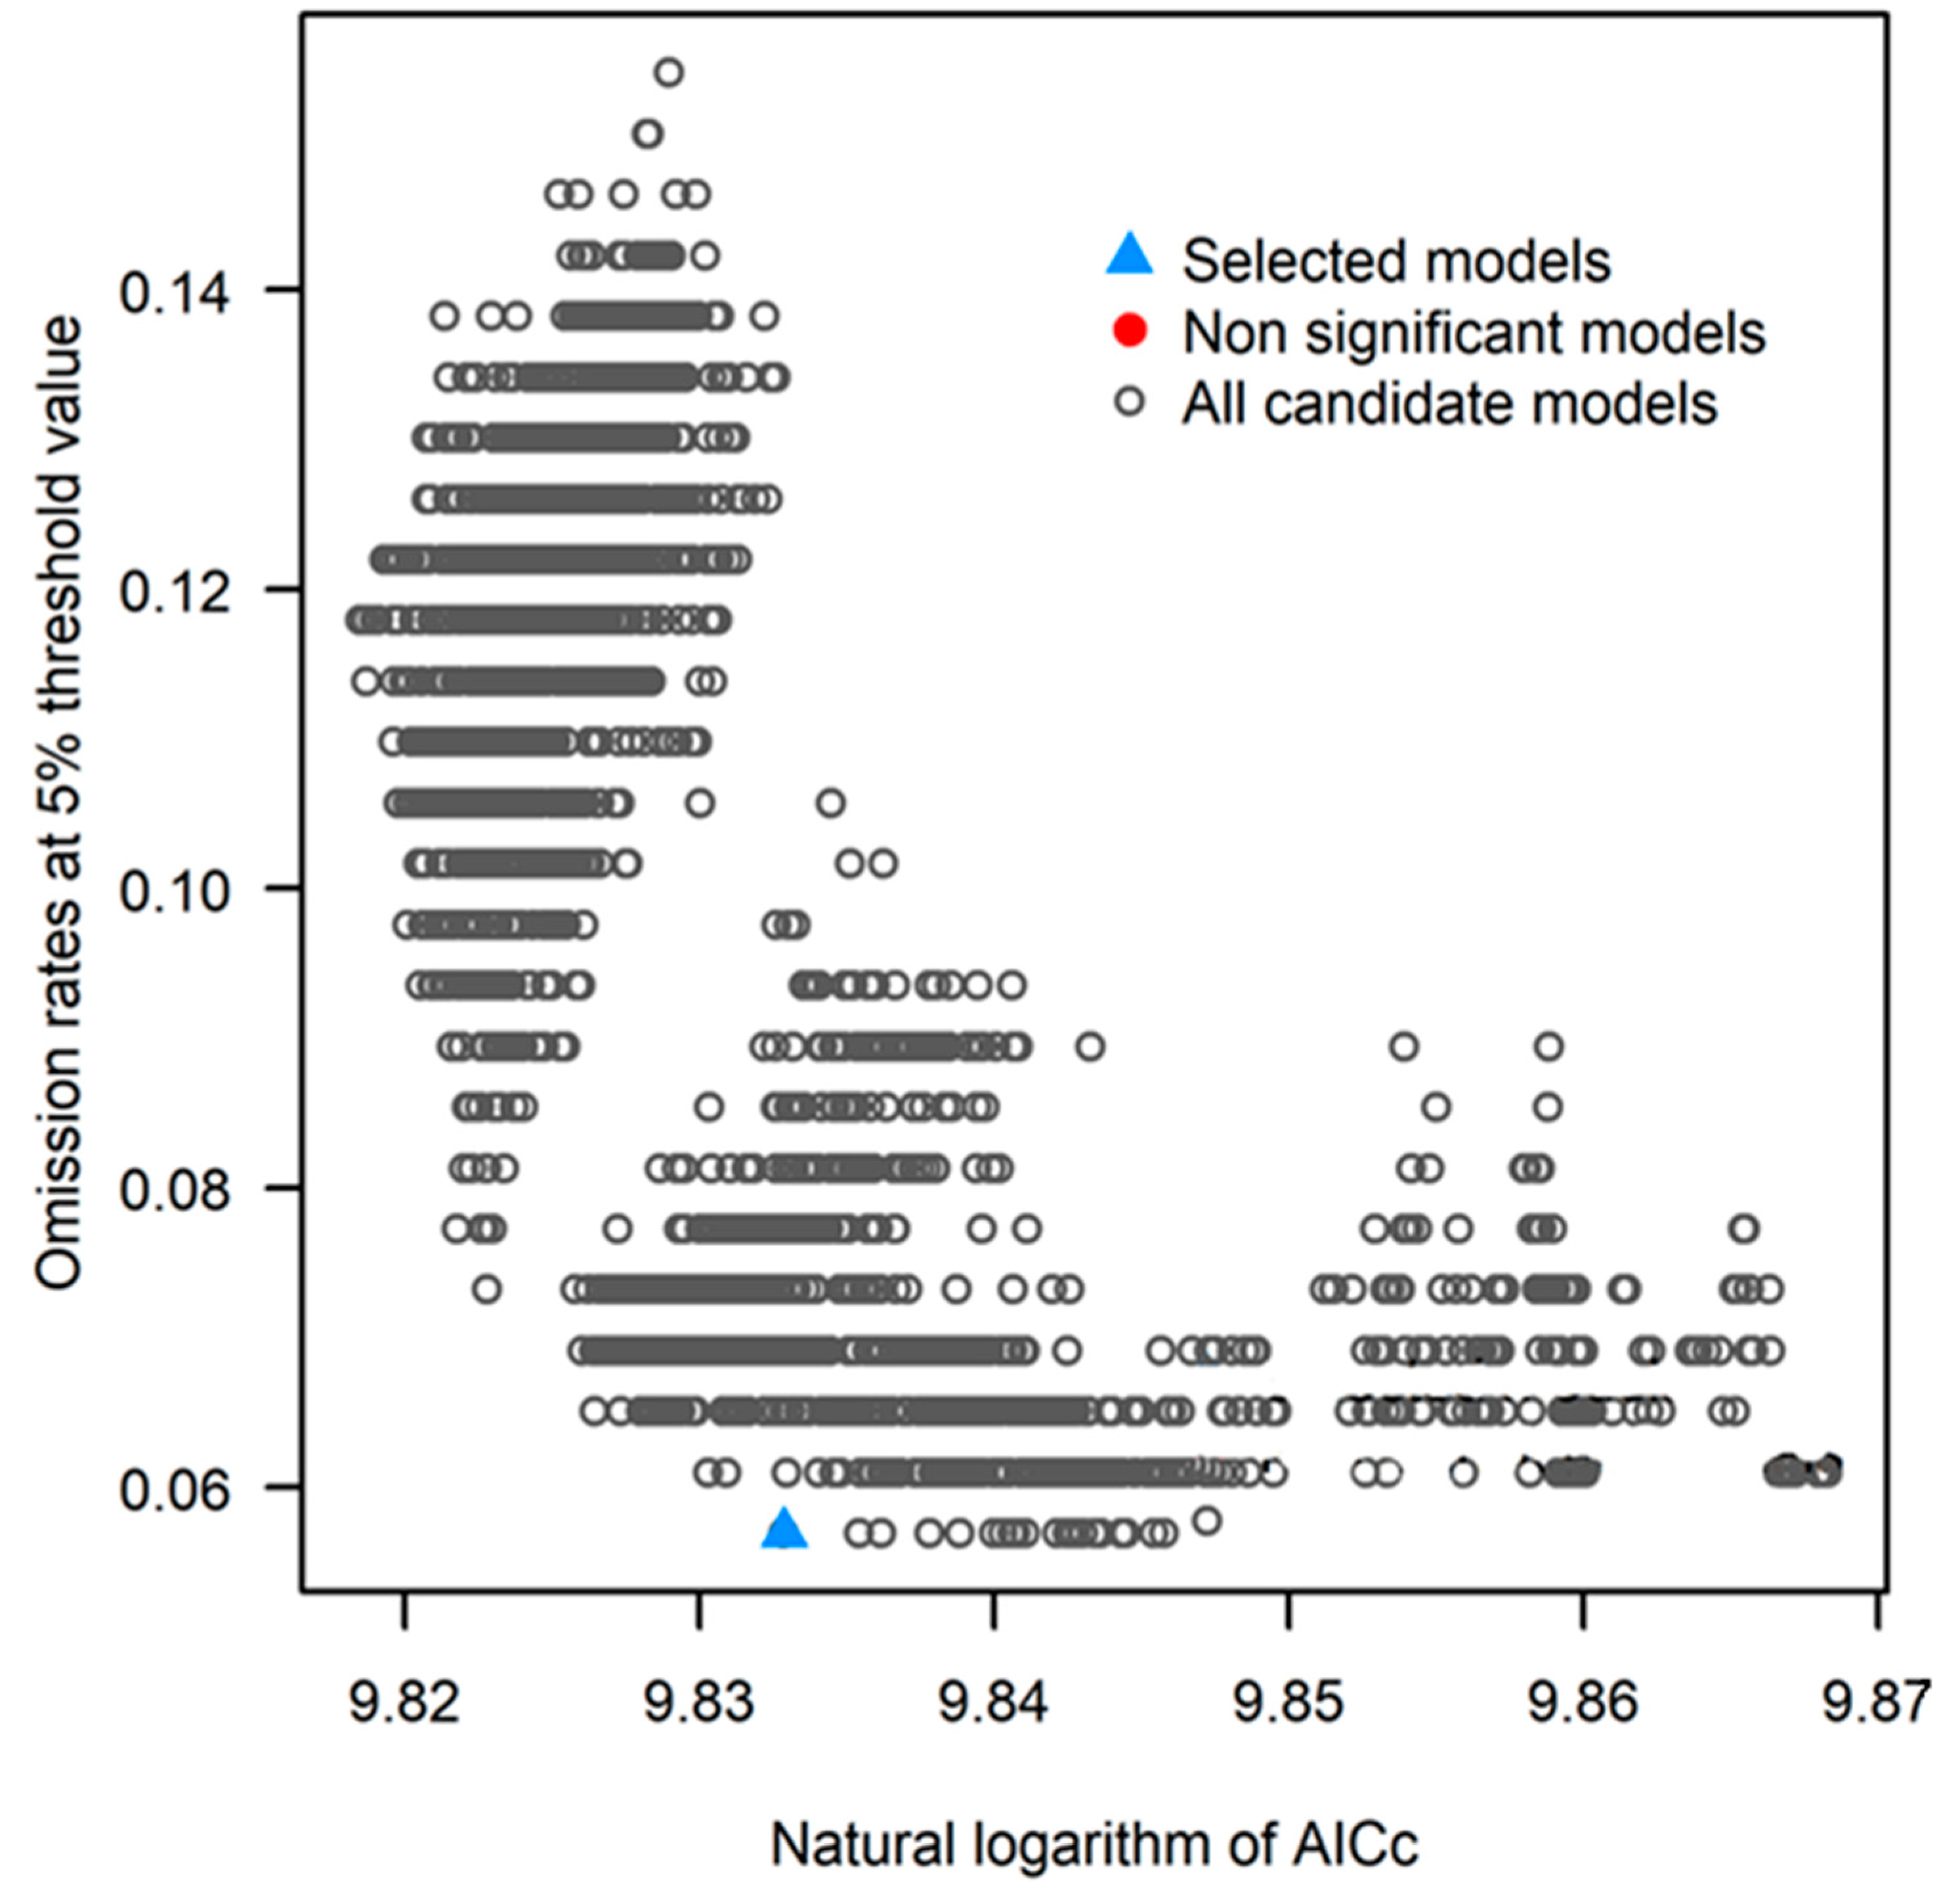
3.1. Outcome of Model Calibration

The candidate models (2480) generated were statistically significant and better than null expectations (i.e., predictions from the models were in conformity with testing occurrence data more frequently than would be expected by random association of points and prediction of that areal extent) (Table 4).
Of the candidate models, none of the models met the omission rate criterion; however, two models had delta AICc values ≤2. Applying the three evaluation criteria together, one candidate model M_0.1_F_qp met the full suite of selection criteria for coconut (Figure 2).

3.2. Model Evaluation

The area under the curve (AUC) or receiver operating characteristics (ROC) was used to evaluate the MaxEnt model performance. The results of the model provided satisfactory output for the climate suitability prediction for coconut (AUC = 0.899 ± 0.002) (Figure 3).

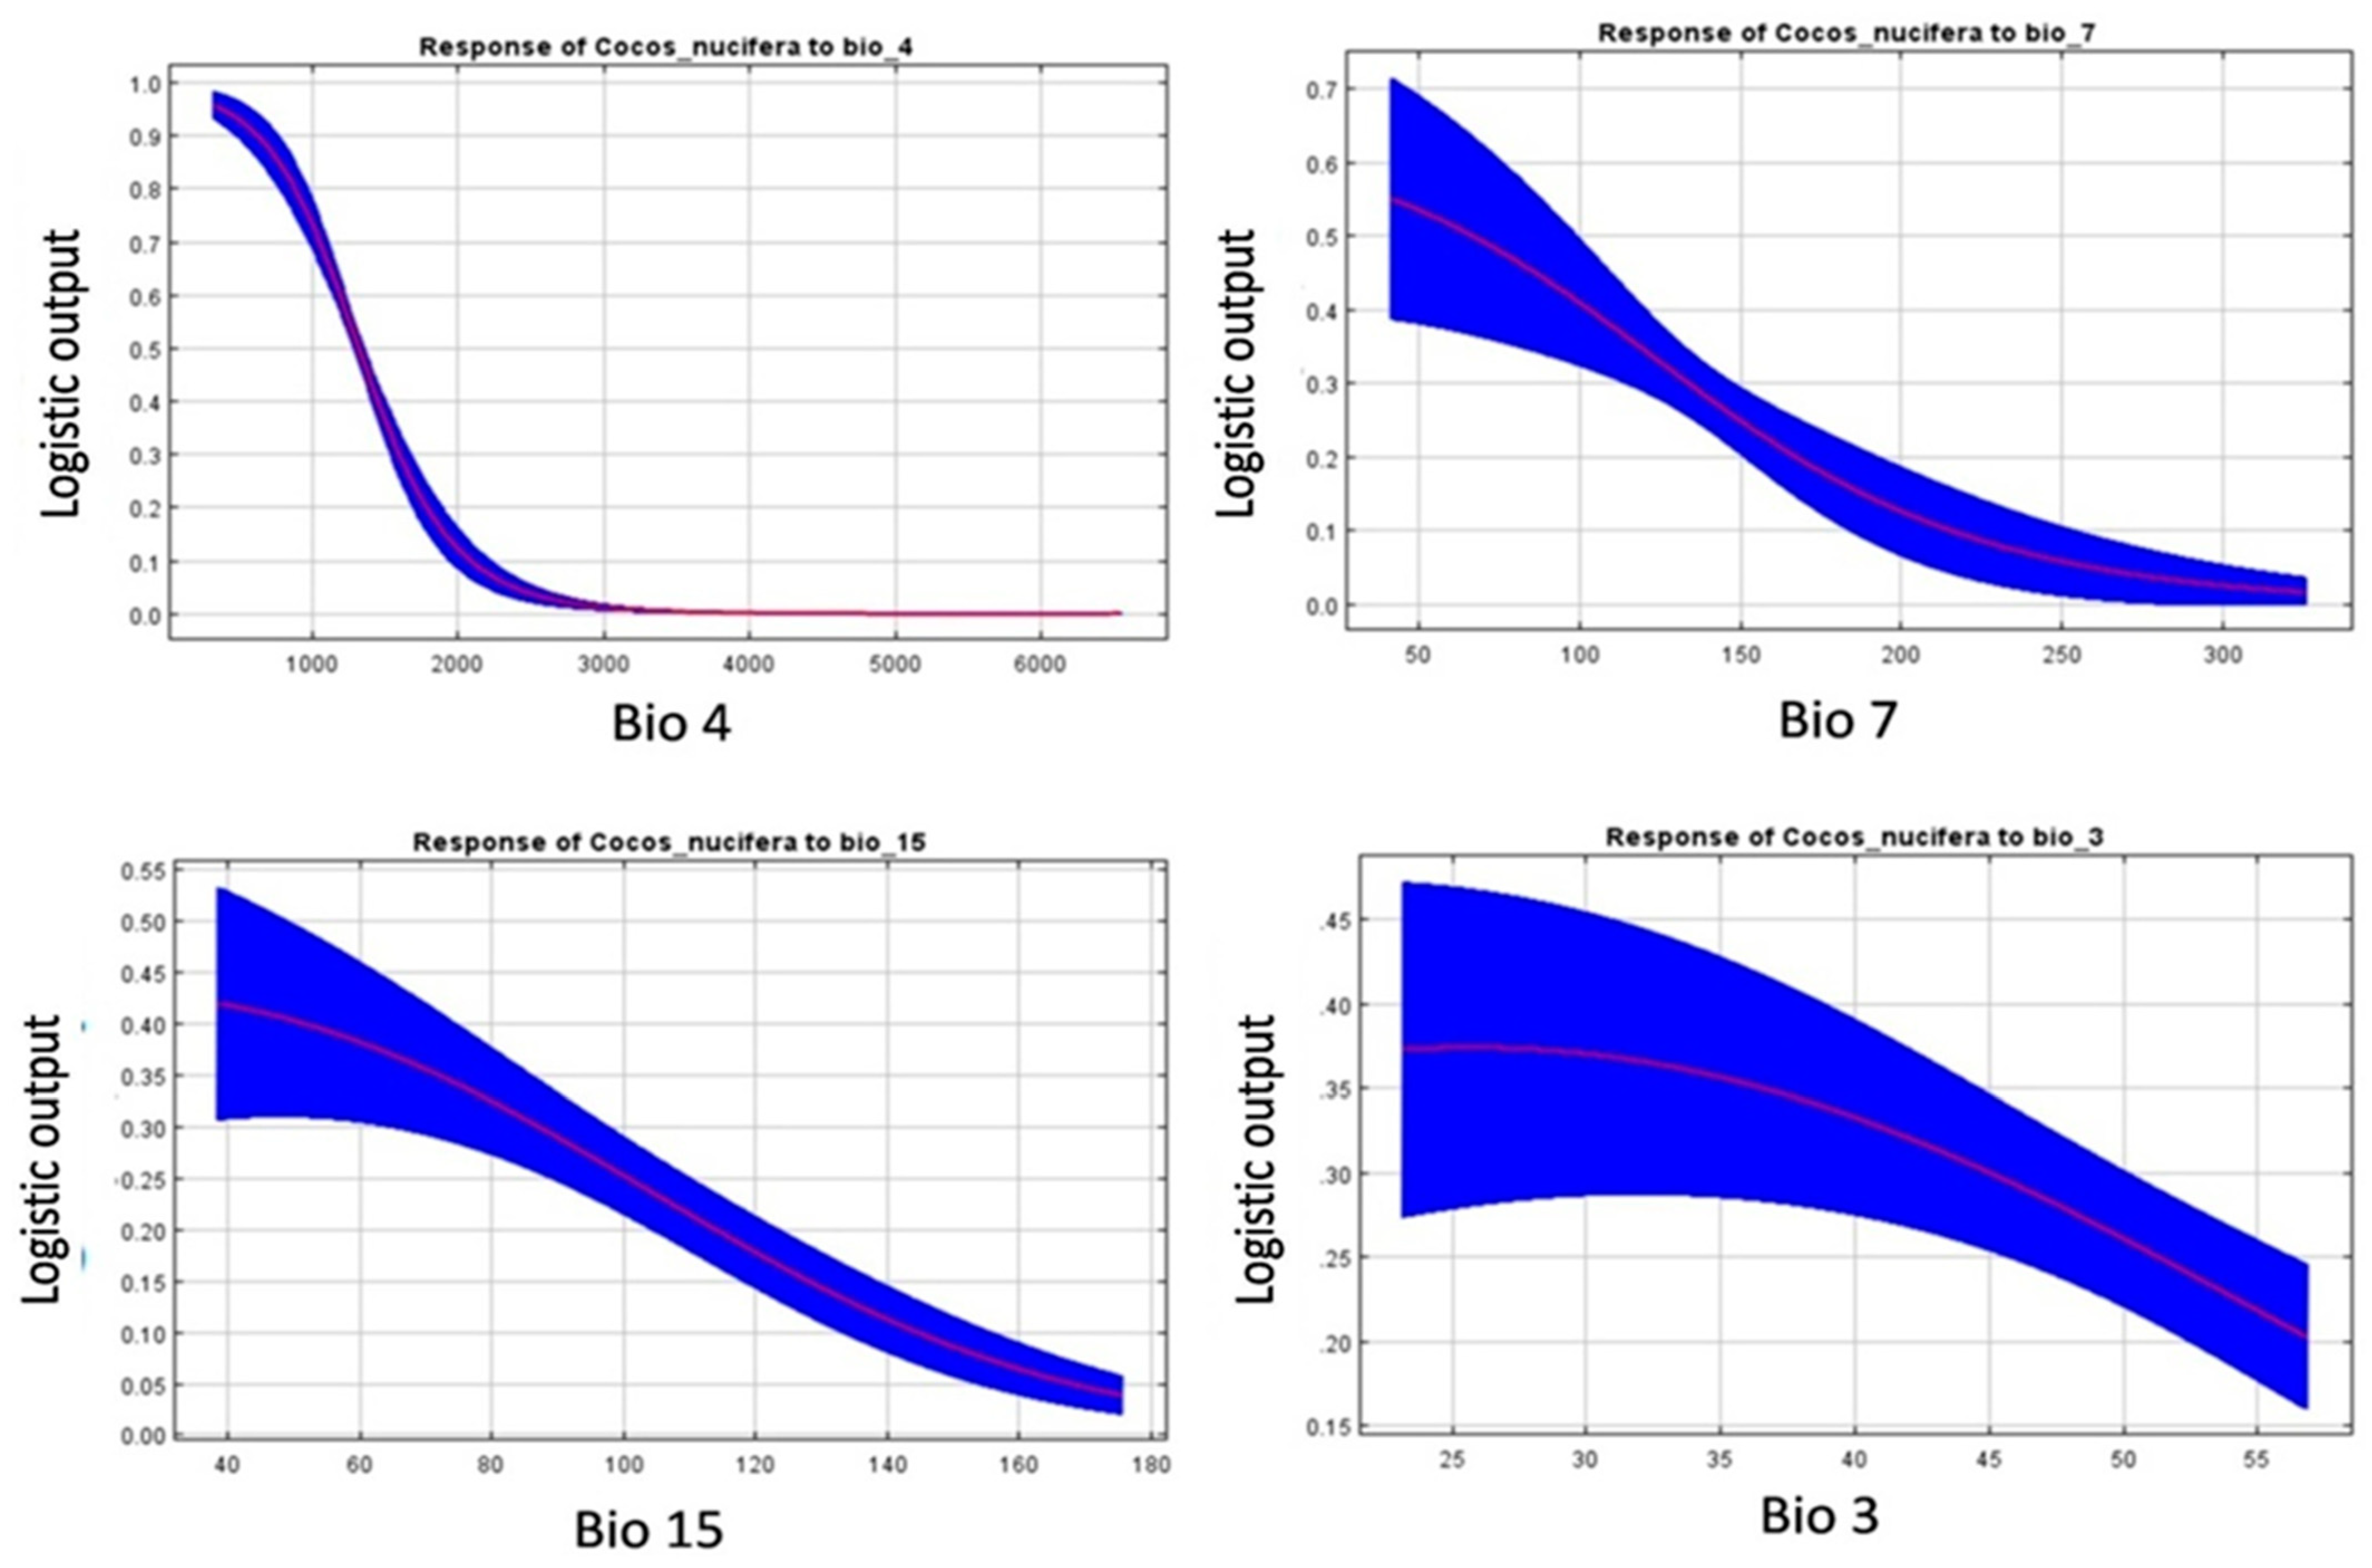
3.3. Predictor Variable Influence

The importance level of predictor variables utilized in the MaxEnt model were identified and highlighted in bold in Table 2. The potential distribution of coconut is more strongly influenced by bioclimatic factors than soil and topographic factors. Bio 4 (temperature seasonality, 34.4%) had the greatest influence followed by Bio 7 (temperature annual range, 28.7%). These two together contributed 63.1%, which along with Bio 15 (precipitation seasonality, 8.6%), determined 71.7% of climate suitability for coconut in India (Table 2). Bio 3 (isothermality), Bio 6 (min. temperature of coldest month), and Bio 14 (precipitation of driest month) are the other major environmental factors and had an influence of 5.6%, 4.4%, and 4.2% respectively. Topographical parameters like elevation, land cover, and soil did not have a marked influence on model prediction (<4%).
The graph (Figure 4) depicts the quadratic relationship between bio variables and climate suitability. Temperature seasonality (Bio 4) was found to have the highest climate suitability at 3% and the relationship was inverse. With the increase in temperature seasonality, the climate suitability of coconut is rapidly decreasing. It ranges from value 3 to 19 (greater than the 0.25-threshold value). Similarly, for temperature annual range (Bio 7), the suitability was the highest at around 3 °C and gradually decreased (range 3 to 15 °C). That is, the regions with low difference between the maximum temperature of the warmest month and the minimum temperature of the coldest month were more suitable for coconut cultivation. Precipitation seasonality (coefficient of variation) ranging from 4% to 10% (>0.25 threshold value), showed higher suitability for coconut cultivation (Figure 4).

3.4. Regional Changes in Predictor Variables

Table 5 shows the model simulated changes in predictor variables under the future scenarios RCP 4.5 and RCP 8.5 of 2050 and 2070 from the current scenarios of coconut cultivation regions. The mean annual temperature over the plantation growing regions of India is 25.64 °C under the present climate, and the model had predicted rise in temperature in all of the scenarios. RCP 4.5 and RCP 8.5 had projected an increase of 1.73 °C and 2.21 °C by the 2050s and 2.1 °C and 3.3 °C during the 2070s, respectively (Table 5).
Bio 4 variability, the bioclimatic variable, was at its lowest for the west coast (Kerala followed by Karnataka) compared with the east coast (TN and AP) (Table 5). The variability was 1.59%, 2.54%, 2.91%, and 3.39% for Kerala, Karnataka, TN, and AP respectively for RCP 8.5, 2070. The trend was similar during the 2050s for both the scenarios, but the increase was relatively less. The variability, however, was at its lowest with RCP 4.5, 2070 (0.88%, 0.99%, 1.46%, 2.62% for Kerala, Karnataka, TN, and AP respectively). Similar to Bio 4, the range of extreme temperature conditions (Bio 7) showed a higher fluctuation on the east coast ((2.38 °C for AP (RCP 4.5, 2050) and 1.77 °C for TN (RCP 8.5, 2070)) compared with the west coast ((1.37 °C for Karnataka (RCP 8.5, 2070) and 1.16 °C for Kerala (RCP 4.5, 2050)).
Precipitation seasonality (Bio 15) showed a relatively high increase under the future scenarios of AP and TN with a relatively smaller increase for Karnataka (Table 5). The increase was high for RCP 8.5, 2070. While it was at its lowest for RCP 4.5, 2070. Kerala, under all of the scenarios, showed marginal decline in precipitation seasonality.

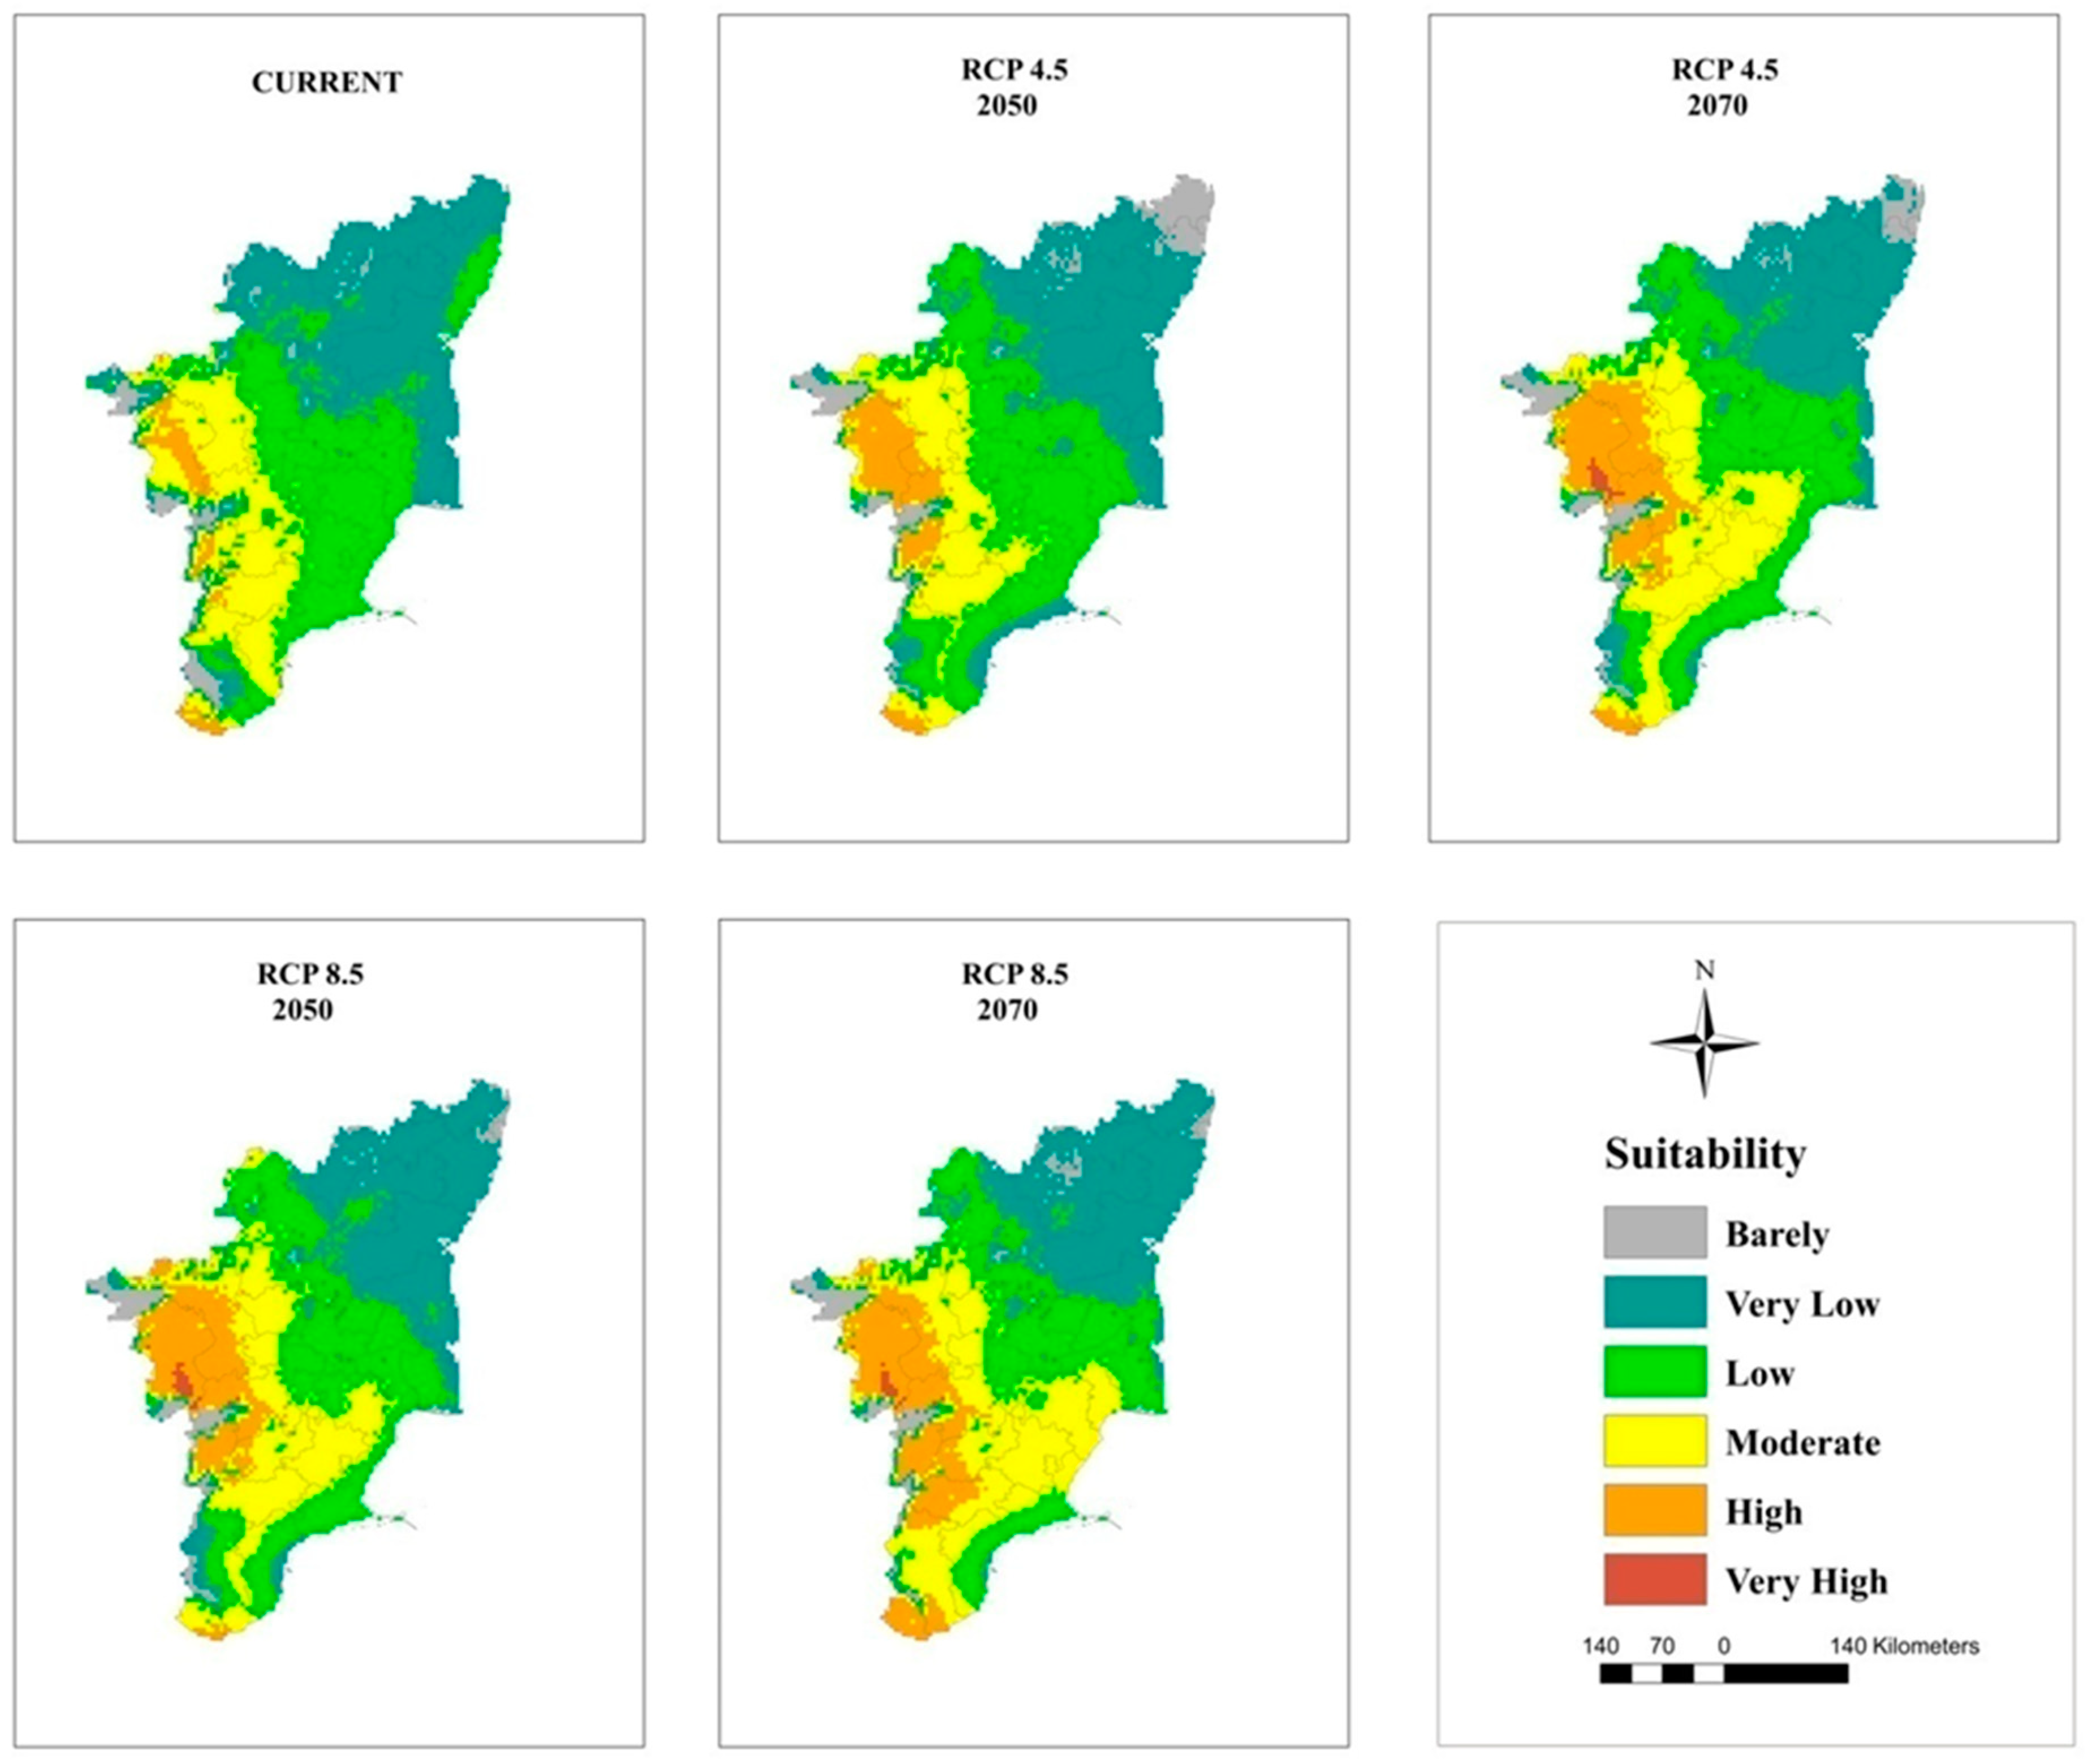
3.5. Current and Future Projections

The maps of potential distribution of coconut at a national level (in India) under the current climate and RCP 4.5 and 8.5 for 2050 and 2070 generated by the MaxEnt model are shown in Figure 5 and Table 6. The model projected that an area of 209,374 km2 is suitable for coconut cultivation under the current climate, which is 15% of the study area in India. However, only 7% of this area is on the west coast and in South Interior Karnataka (Figure 6), Kerala (Figure 7), and TN (Figure 8) has moderate to high suitability, while the east coast and northeast have low to very low suitability. The area suitable for coconut cultivation in India has dropped to 11.6%, 12.1%, 12.4%, and 12% for RCP 4.5, 2050, RCP 4.5, 2070, RCP 8.5, 2050, and RCP 8.5, 2070, respectively (Table 6). The maximum decline was seen in the south interior regions.

3.6. Changes in Coconut Habitat Suitability

In general, the habitat suitability for coconut cultivation at a national level (in India) remained more or less constant at the future climates of RCP 4.5 and 8.5 of the 2050s and 2070s (Figure 9, Table 6). It is roughly 15% with 8% in the low category, 5% in the moderate category, and 2% in the high suitability category (Figure 5 and Figure 9). However, there is a shift in climate suitability category across the coconut cultivation regions of India under the future climate. Karnataka, which has, at present, 22% in the low category, 18% in the moderate category, and 1% in the high suitability category may shift to have 31% to 33% in the low category, 11% to 12% in the moderate category, and 2% to 3% in the high category across the scenarios (Figure 9). The west coast has high suitability, while the south interior moves to the low suitability category (Figure 6). Kerala, on the other hand, which has large area in high suitability category (45%) at current climate will shift to have low suitability and low suitability areas will increase from the current 7% to 16% to 18% under the future climate (Figure 9). South Interior Tamil Nadu (Figure 8) would have 8% to 12% high suitability areas under future scenarios from the present 4% (Figure 9). Area expansion is mostly seen in the barely suitable category, which is not considered for climate suitable area calculation.

4. Discussion

This study was the first to explore the impacts of global climate change on the geographical range and environmental suitability of the habitat of the coconut in India using MaxEnt modeling. As coconut is grown across different agro-ecological zones of India, evaluating the impacts of climate change scenarios on the potential cultivable area will be helpful in understanding the relationships between coconut niches and the corresponding environment, identifying priority cultivation areas and planning adaptation strategies [55,56,57]. Species distribution models like MaxEnt are extensively used to predict the change in climate of some of the plantation growing areas like areas growing cocoa in African countries [33,34], coffee in Zimbabwe [35], and other agricultural crops [36,37,38]. In our study, for model calibration, we could generate 2480 candidate models involving environmental predictors and regularization multiplier and feature classes using the kuenm-R package and select the best candidate model (M_0.1_F_qp) for prediction based on significance, omission rates, and complexity [39]. The results show that the MaxEnt model prediction for coconut, having the mean AUC values of 0.899 + 0.002 and indicating the model prediction, comes under the excellent category, which is consistent with previous studies [29,57,58].
The MaxEnt model showed that future coconut cultivation is mostly determined by bioclimatic variables, while the effects of topographical and soil variables were rather small. In 29 African palm species, the belief that the climate is the most important factor determining palm distribution, and that habitat and human intervention are not, was extensively studied and reported [59,60]. As in our studies, temperature seasonality, which contributed most to the habitat suitability along with cold temperatures, was found to constrain palm species cultivated [61]. In India, the majority of coconut cultivation area is within an elevation of 600 m, and the topographic effect on palms is generally seen at higher elevation of around 2500 m [62]. Though the contribution of soil, a topographic factor, is rather small (0.4%); however, its inclusion in the model made the prediction more accurate as seen in other species [63], otherwise, the model would have predicted more suitable area than currently exists for the actual current coconut distribution. Thus, as seen in previous studies, we have confirmed the dominant role of the climate in the natural cultivation of coconut [29,58].
As coconut is a tropical plant, its cultivation is mainly determined by the temperature. Optimal temperature for its growth and yield is 27 °C ± 5 °C and optimum humidity of >60%. The plant grows well up to an elevation of 600 m above MSL. However, near the equator, productive coconut orchards can be established up to an elevation of about 1000 m above MSL, providing that temperature is not a limitation. A well-distributed rainfall of about 200 cm per year is the best for proper growth and higher yield [64,65,66,67]. South India, comprising the states of Kerala, Karnataka, Tamil Nadu, and Andhra Pradesh, occupies >90% of the total coconut cultivation area in the country. All along the west coast is relatively ideal for coconut cultivation where rainfall is >200 cm, humidity is high, and Tmax reaches as high as 36 °C during the summer (March, April, May). In the south interior, where rainfall is around 60 cm, Tmax reaches as high as 40 °C, and summer humidity is low, coconut grows well wherever there are irrigation facilities. However, in this region, large areas are under rainfed conditions. On the other hand, in the eastern region mostly, coconut is cultivated under irrigation conditions where the rainfall is around 100 cm and Tmax reaches as high as 43 °C. A high temperature (Tmax > 34 °C) decreases the photosynthesis of the coconut seedlings [68] during the reproductive stage. This affects the progamic phase, i.e., causes poor pollen germination [22] and restricts pollen tube growth through style [23]. As a result, there was poor fertilization and nut set. In the field condition, it was observed that a prevailing high temperature (Tmax ≥ 33 °C) during the first three months of inflorescence opening severely reduced the nut set of an inflorescence during the summer months both in India and Sri Lanka [69,70,71]. Furthermore, when water is limited, as is common in coconut ecosystems because more than 60% of the water supply is rainfed, the interaction effects of rising CO2 and warming with water deficit are not known. Therefore, for a crop like coconut, temperature, water, CO2, and their interactions are the important climatic factors determining the suitability of a given region.
The MaxEnt model has predicted that the climate of the region between 8°4′ north and 20° south of the equator under current the conditions is ideal for coconut palm in India, consistent with previous findings [67]. At a national level (in India), the model had predicted that 15% of the total area would be suitable for coconut cultivation under the current climate with the climate being placed in the high suitability category all along the west coast (Karnataka and Kerala), in the moderate suitability category in some parts of South Interior Karnataka and TN, while the rest of the south interior would be placed in the low suitability category and the eastern region (TN, AP, Odisha, West Bengal) and Northeastern states would be placed in the low to very low suitability category, which is in agreement with the actual spread of coconut as in Figure 1a.
Previous studies had concluded that global warming had greatly influenced the climate of the region, thereby causing expansions, shifts, or contractions in the area under cultivation [72,73]. From Figure 9, it is clear that the majority of the area expansion is happening in the barely suitable category, which has <0.25 value of the maximum training sensitivity plus specificity and is, therefore, not taken into account for suitable area calculation. Our predictions showed that under the future climate, at a national level (in India), the total area suitable for coconut cultivation would remain constant (15%). However, at the regional level, the areas with a potentially suitable climate for coconut will shift from different categories like low, moderate, and high suitability. The west coast will be placed in the high suitability category, the south interior will be placed in the moderate to high suitability category, and the east coast will be placed in the low suitability category for coconut cultivation. These results were consistent with previous studies showing that the habitat suitability of plant species was predicted to become vulnerable in some regions under climate change conditions [coffee could be replaced by cocoa in Mesoamerica [74], cocoa in Latin America [75], cocoa in West Africa [34], coffee in Zimbabwe [76], and C. tinctorius in China [73].
Even under high concentration scenarios, the model projection of high climate suitability for coconut all along the west coast showed a high probability of its cultivation. In the south interior, the climate of some of the current areas of high probable occurrence may change to moderate suitability, moderate to low suitability, and low suitability to unsuitable. In the eastern region, the climate is less suitable, and the areas with a suitable climate were found towards the west, especially in TN. Small changes in the temperature and precipitation seasonality could be the reason for low climate vulnerability to climate change for coconut in the west coast. The south interior regions are low rainfall areas, even though the predicted precipitation is less variable, still, the temperature-induced rise in evapotranspiration might subject the plants to drought in areas without irrigation facilities. This is further exasperated by the prevailing low humidity during the summer months. High temperature under low humidity is more detrimental to fertilization [23]. In the eastern region, where the summer temperature is already high (Tmax > 40 °C), the projected temperature rise of 2 °C to 3 °C would make the crop more vulnerable. These regions showed high variability in temperature (Bio 4) and precipitation seasonality (Bio 15) from the current climate. Therefore, the proposed contraction to the area with a suitable will be a potential threat to the increasing demand for coconut and coconut products worldwide. The market demand of coconut is rather great in India due to the rich nutrients and oil provided the coconut, as well as the latest discoveries of its nutraceutical benefits [9].
The suitable area available for the cultivation of coconut will gradually decrease because of urban development and other social causes. Furthermore, there is more area becoming vulnerable under the future climate. Together, these factors add pressure to produce more from each unit land area to meet the growing demand. Therefore, more attention and additional protective measures should be given to extensive coconut cultivation areas in the south interior regions so as to ensure the sustainable cultivation of coconut, at least in presently cultivated areas. In these regions, high temperatures and low humidity are the major problem. The effect of high temperatures, to a certain extent, could be alleviated either by planting genotypes with wider adaptability for water deficit and high temperatures or by adopting some of the agro techniques of fertigation along with soil moisture conservation practices like mulching, bunding, and cropping systems [77]. Soil moisture retention, summer irrigation, drip irrigation, and fertilizer application are only a few of the agronomic adaptations that can not only reduce losses but also boost productivity in the majority of coconut-growing areas because the availability of water to the palms can help them in canopy cooling by transpiration and can partially offset the adverse influences of high temperatures [67]. In the eastern regions, where Tmax is the major issue, adopting genotypes with wider adaptability to high temperatures may sustain the crop under the future climate.

5. Conclusions

Coconut, an important plantation crop grown in coastal belts and plains, is highly vulnerable to climate change, and there is urgent need for its appropriate protection and management. In this study, we used the MaxEnt model to evaluate the bioclimatic variables determining the suitable habitat for coconut cultivation and to predict the regions with a climate that is potentially suitable under the future climate conditions. The MaxEnt model is popularly used for species-distribution due its prediction accuracy even with incomplete data and a small sample size, but it has some limitations, such as underestimating the influence of parameters and spatial bias in the occurrence data and the possibility of overfitting and the lack of its capacity to generalize results from independent data. In addition, the MaxEnt outputs gives environmental suitability rather than predicted probability of occurrence. Considering that we have limited data on coconut, the MaxEnt model was used to obtain an overall understanding of the suitability in different regions of India. Our results have shown that coconut will contract its suitable climate area size and will face a high risk of unfavorable climate in the southern interior and eastern regions of India in response to global climate change. There is shift in climate suitability from high to moderate, moderate to low and low to unsuitable under the future climate. Effective coordination amongst all stakeholders is essential to develop and implement adaptation strategies so as to ensure sustainable cultivation of coconut at least in presently cultivated areas. Future research should be focused on collecting robust data at more granular and complete datasets and use them for modeling the impacts of climate change and their impact on crop yield with better mechanistic models. In addition, using an ensemble of models rather than one single model will improve accuracy of predictions.

Author Contributions

Conceptualization, K.B.H.; methodology, K.B.H., P.S.A., V.S.J., A.S. and S.S.; formal analysis, K.B.H., P.S.A., A.S., S.S. and P.V.V.P.; investigation, K.B.H., P.S.A. and V.S.J.; resources, K.B.H.; writing—original draft preparation, V.S.J., P.N. and K.B.H.; writing—review and editing, P.V.V.P.; supervision, K.B.H.; project administration, K.B.H. All authors have read and agreed to the published version of the manuscript.

Funding

This research received no external funding.

Institutional Review Board Statement

Not applicable.

Informed Consent Statement

Not applicable.

Data Availability Statement

Data is available upon request from the corresponding author.

Acknowledgments

Authors thank Indian Council of Agricultural Research for supporting this research. The senior author (K.B.H.) thanks the Borlaug Fellowship of the United States Department of Agriculture for providing opportunity to establish collaboration with Department of Agronomy at Kansas State University.

Conflicts of Interest

The authors declare no conflict of interest.

References

  1. APCC. Coconut Statistical Yearbook; Asian and Pacific Coconut Community: Jakarta, Indonesia, 2015; 288p. [Google Scholar]
  2. Omont, H. Information Sheet-COCONUT; IPGRI—Commodity Chains; FAO: Rome, Italy, 2001. [Google Scholar]
  3. Rethinam, P. International Scenario of Coconut Sector. In The Coconut Palm (Cocos nucifera L.)—Research and Development Perspectives; Nampoothiri, K.U.K., Krishnakumar, V., Thampan, P.K., Nair, M.A., Eds.; Springer: Singapore, 2018; pp. 21–56. [Google Scholar]
  4. Ramesh, S.V.; Pandiselvam, R.; Thushara, R.; Manikantan, M.R.; Hebbar, K.B.; Beegum, S.; Mathew, A.C.; Neenu, S.; Shil, S. Engineering intervention for production of virgin coconut oil by hot process and multivariate analysis of quality attributes of virgin coconut oil extracted by various methods. J. Food Process Eng. 2020, 43, e13395. [Google Scholar] [CrossRef]
  5. Hebbar, K.B.; Arivalagan, M.; Manikantan, M.R.; Mathew, A.C.; Thamban, C.; Thomas, G.V.; Chowdappa, P. Coconut inflorescence sap and its value addition as sugar—Collection techniques, yield, properties and market perspective. Curr. Sci. 2015, 109, 1411–1417. [Google Scholar] [CrossRef] [Green Version]
  6. Hebbar, K.B.; Arivalagan, M.; Pavithra, K.C.; Roy, T.K.; Gopal, M.; Shivashankara, K.S.; Chowdappa, P. Nutritional profiling of coconut (Cocos nucifera L.) inflorescence sap collected using novel coco-sap chiller method and its value added products. J. Food Meas. Charact. 2020, 14, 2703–2712. [Google Scholar] [CrossRef]
  7. Asghar, M.T.; Yusof, Y.A.; Mokhtar, M.N.; Ya’acob, M.E.; Mohd. Ghazali, H.; Chang, L.S.; Manaf, Y.N. Coconut (Cocos nucifera L.) sap as a potential source of sugar: Antioxidant and nutritional properties. Food Sci. Nutr. 2020, 8, 1777–1787. [Google Scholar] [CrossRef] [Green Version]
  8. Joshi, S.; Kaushik, V.; Gode, V.; Mhaskar, S. Coconut Oil and Immunity: What do we really know about it so far? J. Assoc. Phys. India 2020, 68, 67–72. [Google Scholar]
  9. Ramesh, S.V.; Krishnan, V.; Praveen, S.; Hebbar, K.B. Dietary prospects of coconut oil for the prevention and treatment of Alzheimer’s disease (AD): A review of recent evidences. Trends Food Sci. Technol. 2021, 112, 201–211. [Google Scholar] [CrossRef]
  10. Jose, T.K. Let’s ‘Make in India’ futuristic coconut products. Indian Coconut J. 2015, 28, 1. [Google Scholar]
  11. OECD-FAO. Agricultural Outlook 2017–2026; OECD: Paris, France, 2017. [Google Scholar]
  12. Pachauri, R.K.; Allen, M.R.; Barros, V.R.; Broome, J.; Cramer, W.; Christ, R.; Church, J.A.; Clarke, L.; Dahe, Q.; Dasgupta, P.; et al. Climate Change 2014: Synthesis Report. Contribution of Working Groups I, II and III to the Fifth Assessment Report of the Intergovernmental Panel on Climate Change; IPCC: Geneva, Switzerland, 2014; 151p. [Google Scholar]
  13. Kumar, S.N.; Bai, K.V.K.; Rajagopal, V.; Aggarwal, P.K. Simulating coconut growth, development and yield with the InfoCrop-coconut model (Tree Physiology 28 (1049–1058)). Tree Physiol. 2009, 29, 751. [Google Scholar] [CrossRef] [Green Version]
  14. Wilson, C.D.; Roberts, D.; Reid, N. Applying species distribution modelling to identify areas of high conservation value for endangered species: A case study using Margaritifera (L.). Biol. Conserv. 2011, 144, 821–829. [Google Scholar] [CrossRef]
  15. Hebbar, K.B.; Santhosh, A.; Sukumar, A.P.; Neethu, P.; Ramesh, S.V.; Selvamani, V. Effect of sea water substitution on growth, physiological and biochemical processes of coconut (Cocos nucifera L.) seedlings—A hydroponic study. Sci. Hortic. (Amst.) 2021, 280, 109935. [Google Scholar] [CrossRef]
  16. Walther, G.R.; Post, E.; Convey, P.; Menzel, A.; Parmesan, C.; Beebee, T.J.C.; Fromentin, J.M.; Hoegh-Guldberg, O.; Bairlein, F. Ecological responses to recent climate change. Nature 2002, 416, 389–395. [Google Scholar] [CrossRef] [PubMed]
  17. Parmesan, C.; Yohe, G. A globally coherent fingerprint of climate change impacts across natural systems. Nature 2003, 421, 37–42. [Google Scholar] [CrossRef] [PubMed]
  18. Bellard, C.; Bertelsmeier, C.; Leadley, P.; Thuiller, W.; Courchamp, F. Impacts of climate change on the future of biodiversity. Ecol. Lett. 2012, 15, 365–377. [Google Scholar] [CrossRef] [PubMed] [Green Version]
  19. Staudinger, M.D.; Grimm, N.B.; Staudt, A.; Carter, S.F.; Chapin, F.S.; Kareiva, P.; Ruckelshaus, M.; Stein, B.A. Impacts of climate change on biodiversity, ecosystems, and ecosystem services: Technical input to the 2013 National Climate Assessment. In Cooperative Report to the 2013 National Climate Assessment; Global Change Research Program: Washington, DC, USA, 2012; 296p. [Google Scholar]
  20. Hebbar, K.B.; Sheena, T.L.; Kumari, K.S.; Padmanabhan, S.; Balasimha, D.; Kumar, M.; Thomas, G.V. Response of coconut seedlings to elevated CO2 and high temperature in drought and high nutrient conditions. J. Plant. Crop. 2013, 41, 118–122. [Google Scholar]
  21. Norby, R.J.; DeLucia, E.H.; Gielen, B.; Calfapietra, C.; Giardina, C.P.; Kings, J.S.; Ledford, J.; McCarthy, H.R.; Moore, D.J.P.; Ceulemans, R.; et al. Forest response to elevated CO2 is conserved across a broad range of productivity. Proc. Natl. Acad. Sci. USA 2005, 102, 18052–18056. [Google Scholar] [CrossRef] [Green Version]
  22. Hebbar, K.B.; Rose, H.M.; Nair, A.R.; Kannan, S.; Niral, V.; Arivalagan, M.; Gupta, A.; Samsudeen, K.; Chandran, K.P.; Chowdappa, P.; et al. Differences in In Vitro Pollen Germination and Pollen tube Growth of Coconut (Cocos nucifera L.) Cultivars in Response to High Temperature Stress; Elsevier B.V.: Amsterdam, The Netherlands, 2018; Volume 153, ISBN 9149942328. [Google Scholar]
  23. Hebbar, K.B.; Neethu, P.; Sukumar, P.A.; Sujithra, M.; Santhosh, A.; Ramesh, S.V.; Niral, V.; Hareesh, G.S.; Nameer, P.O.; Prasad, P.V.V. Understanding physiology and impacts of high temperature stress on the progamic phase of coconut (Cocos nucifera L.). Plants 2020, 9, 1651. [Google Scholar] [CrossRef]
  24. Oren, R.; Ellsworth, D.S.; Johnsen, K.H.; Phillips, N.; Ewers, B.E.; Maier, C.; Schäfer, K.V.R.; McCarthy, H.; Hendrey, G.; McNulty, S.G.; et al. Soil fertility limits carbon sequestration by forest ecosystems in a CO2-enriched atmosphere. Nature 2001, 411, 469–472. [Google Scholar] [CrossRef]
  25. Reich, P.B.; Luo, Y.; Bradford, J.B.; Poorter, H.; Perry, C.H.; Oleksyn, J. Temperature drives global patterns in forest biomass distribution in leaves, stems, and roots. Proc. Natl. Acad. Sci. USA 2014, 111, 13721–13726. [Google Scholar] [CrossRef] [Green Version]
  26. Hebbar, K.B.; Apshara, E.; Chandran, K.P.; Prasad, P.V.V. Effect of elevated CO2, high temperature, and water deficit on growth, photosynthesis, and whole plant water use efficiency of cocoa (Theobroma cacao L.). Int. J. Biometeorol. 2020, 64, 47–57. [Google Scholar] [CrossRef]
  27. Phillips, S.J.; Dudík, M.; Schapire, R.E.; Internet. Maxent Software for Modeling Species Niches and Distributions (Version 3.4.1). Available online: http://biodiversityinformatics.amnh.org/open_source/maxent/ (accessed on 15 October 2020).
  28. Elith, J.; Graham, C.H.; Anderson, R.P.; Dudík, M.; Ferrier, S.; Guisan, A.; Hijmans, R.J.; Huettmann, F.; Leathwick, J.R.; Lehmann, A.; et al. Novel methods improve prediction of species’ distributions from occurrence data. Ecography 2006, 29, 129–151. [Google Scholar] [CrossRef] [Green Version]
  29. Pearson, R.G.; Dawson, T.P. Predicting the impacts of climate change on the distribution of species: Are bioclimate envelope models useful? Glob. Ecol. Biogeogr. 2003, 12, 361–371. [Google Scholar] [CrossRef] [Green Version]
  30. Braunisch, V.; Coppes, J.; Arlettaz, R.; Suchant, R.; Schmid, H.; Bollmann, K. Selecting from correlated climate variables: A major source of uncertainty for predicting species distributions under climate change. Ecography 2013, 36, 971–983. [Google Scholar] [CrossRef]
  31. Yang, X.-Q.; Kushwaha, S.P.S.; Saran, S.; Xi, J.; Roy, P.S. Maxent modeling for predicting the potential distribution of medicinal plant, Justicia adhatoda L. in Lesser Himalayan foothill. Ecol. Eng. 2013, 15, 83–87. [Google Scholar] [CrossRef]
  32. Searcy, C.A.; Shaffer, H.B. Do ecological niche models accurately identify climatic determinants of species ranges? Am. Nat. 2016, 187, 423–435. [Google Scholar] [CrossRef] [Green Version]
  33. Läderach, P.; Martinez-Valle, A.; Schroth, G.; Castro, N. Predicting the future climatic suitability for cocoa farming of the world’s leading producer countries, Ghana and Côte d’Ivoire. Clim. Chang. 2013, 119, 841–854. [Google Scholar] [CrossRef] [Green Version]
  34. Schroth, G.; Läderach, P.; Martinez-Valle, A.I.; Bunn, C.; Jassogne, L. Vulnerability to climate change of cocoa in West Africa: Patterns, opportunities and limits to adaptation. Sci. Total Environ. 2016, 556, 231–241. [Google Scholar] [CrossRef] [Green Version]
  35. Pham, Y.; Reardon-Smith, K.; Mushtaq, S.; Cockfield, G. The impact of climate change and variability on coffee production: A systematic review. Clim. Chang. 2019, 156, 609–630. [Google Scholar] [CrossRef]
  36. Kogo, B.K.; Kumar, L.; Koech, R.; Kariyawasam, C.S. Modelling climate suitability for rainfed Maize cultivation in Kenya using a Maximum Entropy (MaxENT) approach. Agronomy 2019, 9, 727. [Google Scholar] [CrossRef] [Green Version]
  37. He, Q.; Zhou, G. Climate-associated distribution of summer maize in China from 1961 to 2010. Agric. Ecosyst. Environ. 2016, 232, 326–335. [Google Scholar] [CrossRef]
  38. Jayasinghe, S.L.; Kumar, L. Modeling the climate suitability of tea [Camellia sinensis (L.) O. Kuntze] in Sri Lanka in response to current and future climate change scenarios. Agric. For. Meteorol. 2019, 272, 102–117. [Google Scholar] [CrossRef]
  39. Cobos, M.E.; Townsend Peterson, A.; Barve, N.; Osorio-Olvera, L. Kuenm: An R package for detailed development of ecological niche models using Maxent. PeerJ 2019, 7, e6281. [Google Scholar] [CrossRef] [PubMed] [Green Version]
  40. Brown, J.L.; Bennett, J.R.; French, C.M. SDMtoolbox 2.0: The next generation Python-based GIS toolkit for landscape genetic, biogeographic and species distribution model analyses. PeerJ 2017, 5, e4095. [Google Scholar] [CrossRef] [PubMed] [Green Version]
  41. Brown, J.L.; Hill, D.J.; Dolan, A.M.; Carnaval, A.C.; Haywood, A.M. Paleoclim, high spatial resolution paleoclimate surfaces for global land areas. Sci. Data 2018, 5, 180254. [Google Scholar] [CrossRef] [Green Version]
  42. Hijmans, R.J.; Cameron, S.E.; Parra, J.L.; Jones, P.G.; Jarvis, A. Very high resolution interpolated climate surfaces for global land areas. Int. J. Climatol. 2005, 25, 1965–1978. [Google Scholar] [CrossRef]
  43. Remya, K.; Ramachandran, A.; Jayakumar, S. Predicting the current and future suitable habitat distribution of Myristicadactyloides Gaertn. Using MaxEnt model in the Eastern Ghats, India. Ecol. Eng. 2015, 82, 184–188. [Google Scholar] [CrossRef]
  44. Jose, V.S.; Nameer, P.O. The expanding distribution of the Indian Peafowl (Pavocristatus) as an indicator of changing climate in Kerala, southern India: A modelling study using MaxEnt. Ecol. Indic. 2020, 110, 105930. [Google Scholar] [CrossRef]
  45. Mod, H.K.; Scherrer, D.; Luoto, M.; Guisan, A. What we use is not what we know: Environmental predictors in plant distribution models. J. Veg. Sci. 2016, 27, 1308–1322. [Google Scholar] [CrossRef]
  46. Shabani, F.; Ahmadi, M.; Kumar, L.; Solhjouy-Fard, S.; Tehrany, M.S.; Shabani, F.; Kalantar, B.; Esmaeili, A. Invasive weed species’ threats to global biodiversity: Future scenarios of changes in the number of invasive species in a changing climate. Ecol. Indic. 2020, 116, 106436. [Google Scholar] [CrossRef]
  47. Jaynes, E.T. Information Theory and Statistical Mechanics. Phys. Rev. 1957, 106, 620–630. [Google Scholar] [CrossRef]
  48. Phillips, S.J.; Anderson, R.P.; Schapire, R.E. Maximum entropy modeling of species geographic distributions. Ecol. Model. 2006, 190, 231–259. [Google Scholar] [CrossRef] [Green Version]
  49. Phillips, S.J.; Dudík, M. Modeling of species distribution with MaxEnt: New extensions and a comprehensive evaluation. Ecography 2008, 31, 161–175. [Google Scholar] [CrossRef]
  50. O’Donnell, M.S.; Ignizio, D.A. Bioclimatic Predictors for Supporting Ecological Applications in the Conterminous United States. US Geol. Surv. Data Ser. 2012, 691, 4–9. [Google Scholar]
  51. Merow, C.; Smith, M.J.; Silander, J.A. A practical guide to MaxEnt for modeling species’ distributions: What it does, and why inputs and settings matter. Ecography 2013, 36, 1058–1069. [Google Scholar] [CrossRef]
  52. Phillips, S.J.; Dudík, M.; Schapire, R.E. A maximum entropy approach to species distribution modeling. In Proceedings of the Twenty-First International Conference on Machine Learning, Banff, AB, Canada, 4–8 July 2004; ACM Press: New York, NY, USA, 2004; pp. 655–662. [Google Scholar]
  53. Al Ruheili, A.M.; Boluwade, A.; Al Subhi, A.M. Assessing the impact of climate change on the distribution of lime (16SRII-b) and alfalfa (16srii-d) phytoplasma disease using maxent. Plants 2021, 10, 460. [Google Scholar] [CrossRef] [PubMed]
  54. Liu, C.; Newell, G.; White, M. On the selection of thresholds for predicting species occurrence with presence-only data. Ecol. Evol. 2016, 6, 337–348. [Google Scholar] [CrossRef] [PubMed] [Green Version]
  55. Davies, T.J.; Purvis, A.; Gittleman, J.L. Quaternary climate change and the geographic ranges of mammals. Am. Nat. 2009, 174, 297–307. [Google Scholar] [CrossRef]
  56. Zhang, L.; Cao, B.; Bai, C.; Li, G.; Mao, M. Predicting suitable cultivation regions of medicinal plants with Maxent modeling and fuzzy logics: A case study of Scutellaria baicalensis in China. Environ. Earth Sci. 2016, 75, 361. [Google Scholar] [CrossRef]
  57. Xu, X.; Zhang, H.; Yue, J.; Xie, T.; Xu, Y.; Tian, Y. Predicting shifts in the suitable climatic distribution of walnut (Juglans regia L.) in China: Maximum entropy model paves the way to forest management. Forests 2018, 9, 103. [Google Scholar] [CrossRef] [Green Version]
  58. Kelly, A.E.; Goulden, M.L. Rapid shifts in plant distribution with recent climate change. Proc. Natl. Acad. Sci. USA 2008, 105, 11823–11826. [Google Scholar] [CrossRef] [Green Version]
  59. Blach-Overgaard, A.; Svenning, J.-C.; Balslev, H. Climate change sensitivity of the African ivory nut palm, Hyphaene petersiana Klotzsch ex Mart. (Arecaceae)—A keystone species in SE Africa. In IOP Conference Series: Earth and Environmental Science; IOP Publishing: Bristol, UK, 2009; Volume 8, p. 012014. [Google Scholar]
  60. Blach-Overgaard, A.; Svenning, J.C.; Dransfield, J.; Greve, M.; Balslev, H. Determinants of palm species distributions across Africa: The relative roles of climate, non-climatic environmental factors, and spatial constraints. Ecography 2010, 33, 380–391. [Google Scholar] [CrossRef]
  61. Lieberman, D.; Lieberman, M.; Peralta, R.; Hartshorn, G.S. Tropical forest structure and composition on a large-scale altitudinal gradient in Costa Rica. J. Ecol. 1996, 84, 137–152. [Google Scholar] [CrossRef]
  62. Walther, G.R.; Gritti, E.S.; Berger, S.; Hickler, T.; Tang, Z.Y.; Sykes, M.T. Palms tracking climate change. Glob. Ecol. 2007, 16, 801–809. [Google Scholar] [CrossRef]
  63. Zuquim, G.; Costa, F.R.C.; Tuomisto, H.; Moulatlet, G.M.; Figueiredo, F.O.G. The importance of soils in predicting the future of plant habitat suitability in a tropical forest. Plant Soil 2020, 450, 151–170. [Google Scholar] [CrossRef] [Green Version]
  64. Child, R. Coconuts, 2nd ed.; Logman: London, UK, 1974; 355p. [Google Scholar]
  65. Persley, G.J. Replanting the Tree of Life towards an International Agenda for Coconut Palm Research; CAB International: Oxford, UK, 1992; p. 156. [Google Scholar]
  66. Rajagopal, V.; Parthasarathy, V.A.; Kumar, S.N.; Reddy, D.V.S.; Rohini, I. Coconut; Parthasarathy, V.A., Chattopadyay, P.K., Bose, T.K., Eds.; Plantation Crops Naya Udyog Pub: Kolkata, India, 2006; Volume 2, pp. 1–178. [Google Scholar]
  67. Kumar, S.N.; Aggarwal, P.K. Climate change and coconut plantations in India Impacts and potential adaptation gains. Agric. Syst. 2013, 117, 45–54. [Google Scholar] [CrossRef]
  68. Hebbar, K.B.; Berwal, M.K.; Chaturvedi, V.K. Plantation crops: Climatic risks and adaptation strategies. Indian J. Plant Physiol. 2016, 21, 428–436. [Google Scholar] [CrossRef]
  69. Ranasinghe, C.S.; Silva, L.R.S.; Premasiri, R.D.N. Major determinants of fruit set and yield fluctuation in coconut (Cocos nucifera L.). J. Natl. Sci. Found. Sri Lanka 2015, 43, 253–264. [Google Scholar] [CrossRef]
  70. Samanta, M.K.; Chattopadhyay, N.; Hore, J.K.; Alam, K. Associationship of weather parameters on the Floral characteristics of coconut. Acta Hortic. 2013, 975, 365–372. [Google Scholar] [CrossRef]
  71. Samarasinghe, C.R.K.; Meegahakumbura, M.K.; Dissanayaka, H.D.M.A.C.; Kumarathunge, D.; Perera, L. Variation in yield and yield components of different coconut cultivars in response to within year rainfall and temperature variation. Sci. Hortic. (Amst.) 2018, 238, 51–57. [Google Scholar] [CrossRef]
  72. Thomas, C.D.; Cameron, A.; Green, R.E.; Bakkenes, M.; Beaumont, L.J.; Collingham, Y.C.; Erasmus, B.F.N.; De Siqueira, M.F.; Grainger, A.; Hannah, L.; et al. Letter to nature: Extinction risk from climate change. Nature 2004, 427, 145–148. [Google Scholar] [CrossRef]
  73. Wei, B.; Wang, R.; Hou, K.; Wang, X.; Wu, W. Predicting the current and future cultivation regions of Carthamus tinctorius L. using MaxEnt model under climate change in China. Glob. Ecol. Conserv. 2018, 16, e00477. [Google Scholar] [CrossRef]
  74. de Sousa, K.; van Zonneveld, M.; Holmgren, M.; Kindt, R.; Ordoñez, J.C. The future of coffee and cocoa agroforestry in a warmer Mesoamerica. Sci. Rep. 2019, 9, 8823. [Google Scholar] [CrossRef] [PubMed]
  75. Fernandez-Manjarrés, J. Using ecological modelling tools to inform policy makers of potential changes in crop distribution: An example with cacao crops in Latin America. In Economics Tools Methods Analysis of Global Change Impacts on Agriculture and Food Security; Springer: Cham, Switzerland, 2019; pp. 11–23. [Google Scholar] [CrossRef]
  76. Chemura, A.; Kutywayo, D.; Chidoko, P.; Mahoya, C. Bioclimatic modelling of current and projected climatic suitability of coffee (Coffea arabica) production in Zimbabwe. Reg. Environ. Chang. 2016, 16, 473–485. [Google Scholar] [CrossRef]
  77. Subramanian, P.; Dhanapal, R.; Mathew, A.C.; Palaniswami, C.; Upadhyaya, A.K.; Naresh Kumar, S.; Reddy, D.V. Effect of fertilizer application through micro-irrigation technique on nutrient availability and coconut productivity. J. Plant. Crops 2012, 40, 168–173. [Google Scholar]
Figure 1. (a) Map showing the spatial distribution of coconut in different regions of India. State-wise and district-wise area data 2018-19 obtained from https://coconutboard.nic.in/Statistics.aspx, accessed on 7 January 2021 Numbers on the map show the coconut growing states viz. Kerala (1), Karnataka (2), Goa (3), Maharashtra (4), Gujarat (5), Tamil Nadu (6), Andhra Pradesh (7), Odisha (8), West Bengal (9), and Assam (10); and (b) the red point indicates the coconut occurrence points used in model running.
Plants 11 00731 g001
Figure 2. Omission rates at 5% and AICc values for all, non-significant, and selected ‘best’ candidate models for coconut. Models were selected based on statistical significance, omission rates, and AICc values.
Plants 11 00731 g002
Figure 3. The receiver operating characteristic (ROC) curve. The values shown are the average of 10 replications.
Plants 11 00731 g003
Figure 4. The Response Curves show how each environmental variable affects the MaxEnt prediction.
Plants 11 00731 g004
Figure 5. Climatically suitable areas for coconut production in India under the current and future climates of the 2050s and 2070s for RCP 4.5 and RCP 8.5 as modeled by MaxEnt.
Plants 11 00731 g005
Figure 6. Climatically suitable areas for coconut production in Karnataka under the current and future climates of the 2050s and 2070s for RCP 4.5 and RCP 8.5 as modeled by MaxEnt.
Plants 11 00731 g006
Figure 7. Climatically suitable areas for coconut production in Kerala under the current and future climates of the 2050s and 2070s for RCP 4.5 and RCP 8.5 as modeled by MaxEnt.
Plants 11 00731 g007
Figure 8. Climatically suitable areas for coconut production in Tamil Nadu under the current and future climates of the 2050s and 2070s for RCP 4.5 and RCP 8.5 as modeled by MaxEnt.
Plants 11 00731 g008
Figure 9. Percentage of total predicted area under different classes for the current and future climate of the study area of India and the regional levels of Karnataka, Kerala, and Tamil Nadu.
Plants 11 00731 g009
Table 1. Characteristics of some of the major coconut growing districts of India from which the occurrence data was collected as input to MaxEnt model. Humidity is the range shown for the summer months (March, April, and May). Occurrence points are the number of points for each location after model rarefaction.
StateArea
(000 ha)
Major DistrictsArea
(000 ha)
LatitudeLongitudeSoil TypeTemperature Range (°C)Humidity (%)
(Range)
Precipitation (mm)Occurrence
Points
MinimumMaximum
Kerala761Kozhikode112.8011.2588° N75.7804° EAlluvial, lateritic16.9–2428.2–3646–92359251
Malappuram105.0911.0510° N76.0711° ELoamy 12–24.223.7–3644–94287760
Kannur85.9711.8745° N75.3704° ESandy loam to clay18.1–23.830–3645–95383151
Thrissur80.5812.4996° N74.9869° ESandy loam to sandy17–24.229.8–3453–99316244
Kasaragod67.0812.4996° N74.9869° ERed sandy loam, sandy20.2–23.831.5–3636–93424538
Karnataka619Tumkur157.3713.3379° N77.1173° ERed loamy & black 15–17.431–37.111–9055489
Hassan52.3213.0033° N76.1004° E-do-14.8–17.730–3634–94127636
Chikkmagaluru40.9313.3161° N75.7720° EClay loam11.8–18.328–3633–93201928
Chitradurga40.8014.2251° N76.3980° ERed sandy loam15.7–17.833.9–3811–9050827
D. Kannada20.3912.8438° N75.2479° ELaterite & sandy loam 13.9–23.228–35.236–93408910
Tamil Nadu436Coimbatore87.4111.0168° N76.9558° ESandy loam10.2–20.923.7–3823–95114948
Thiruppur60.3311.1085° N77.3411° ELoamy & alluvial 10.2–20.923.7–3823–95114930
Thanjavur37.3310.7870° N79.1378° ESandy21.1–23.334.4–4130–9185024
Dindigul29.2210.3624° N77.9695° ELoamy & Sandy loam 8.6–20.522.5–4129–90101525
Kanyakumari24.108.0883° N77.5385° ESaline & Coastal16.4–24.225.7–3647–95125415
Andhra Pradesh111E. Godavari52.3017.3213° N82.0407° ERed clay & alluvial 13–22.231.3–4230–93127412
W. Godavari22.0916.9174° N81.3399° EAlluvial & sandy alluvial15.6–21.334.5–4349–98116636
Table 2. Bioclimatic and topographic variables (in bold texts) used for predicting habitat suitability for coconut in India and their contribution to habitat suitability.
Category UnitsSourcesVariablesAbbreviationsUnits% Contribution
BioclimaticWorldClim—Global Climate
Data
http://www.worldclim.org/, accessed on 22 May 2020
Paleoclim.org
Annual mean temperatureBIO1°C1.0
Mean diurnal rangeBIO2°C3.1
IsothermalityBIO3unitless5.6
Temperature seasonalityBIO4unitless34.4
Max. temperature of warmest monthBIO5°C
Min. temperature of coldest monthBIO6°C4.4
Temperature annual rangeBIO7°C28.7
Mean temp of wettest quarterBIO8°C
Mean temp of driest quarterBIO9°C
Mean temp of warmest quarterBIO10°C
Mean temp of coldest quarterBIO11°C
Annual precipitationBIO12mm2.0
Precipitation of wettest monthBIO13mm
Precipitation of driest monthBIO14mm4.2
Precipitation seasonalityBIO15unitless8.6
Precipitation of wettest quarterBIO16mm
Precipitation of driest quarterBIO17mm
Precipitation of warmest quarterBIO18mm1.1
Precipitation of coldest quarterBIO19mm2.2
Topographicalhttp://www.fao.org/soils, accessed on 22 May 2020Soil unitless0.4
http://due.esrin.esa.int/page_globcover.php, accessed on 22 May 2020Land cover unitless0.7
https://cgiarcsi.community/data/srtm, accessed on 22 May 2020Elevation meter3.5
Table 3. Correlation coefficients (Rs) between 19 environmental variables, 2 topographical variables (elevation, land cover) and soil using the SDM Tool box 2.0.
LayerBio 1Bio 2Bio 3Bio 4Bio 5Bio 6Bio 7Bio 8Bio 9Bio 10Bio 11Bio 12Bio 13Bio 14Bio 15Bio 16Bio 17Bio 18Bio 19SoilLand CoverElevation
Bio 11.000
Bio 20.1781.000
Bio 30.3590.1171.000
Bio 4−0.3220.325−0.7981.000
Bio 50.8480.6200.257−0.0751.000
Bio 60.820−0.1970.649−0.7610.5371.000
Bio 7−0.0510.827−0.4500.7510.405−0.5531.000
Bio 80.7870.137−0.1200.1900.6220.3960.1851.000
Bio 90.8640.1170.651−0.6140.7070.895−0.2720.4801.000
Bio 100.9360.3970.173−0.0580.9440.6310.2480.7820.7391.000
Bio 110.8860.0260.657−0.7060.6980.968−0.3590.4540.9390.7411.000
Bio 12−0.362−0.563−0.277−0.021−0.569−0.207−0.338−0.199−0.368−0.464−0.3031.000
Bio 13−0.226−0.433−0.119−0.167−0.389−0.067−0.311−0.167−0.172−0.335−0.1260.9131.000
Bio 14−0.303−0.529−0.040−0.038−0.524−0.091−0.419−0.218−0.300−0.403−0.2370.2890.0411.000
Bio 150.1830.393−0.0850.1310.338−0.0560.3950.2530.1670.2640.0670.0160.315−0.5601.000
Bio 16−0.249−0.464−0.163−0.128−0.419−0.094−0.311−0.171−0.213−0.351−0.1620.9460.9930.0900.2561.000
Bio 17−0.309−0.556−0.1640.056−0.536−0.149−0.367−0.156−0.363−0.398−0.2960.3430.0620.948−0.5820.1201.000
Bio 18−0.537−0.371−0.4570.389−0.664−0.528−0.084−0.156−0.613−0.543−0.6130.6660.3930.400−0.2650.4560.4471.000
Bio 190.001−0.3390.262−0.395−0.1620.244−0.425−0.1490.148−0.1420.1780.4520.5410.0390.0940.5350.017−0.0391.000
Soil−0.361−0.158−0.3020.242−0.315−0.3180.034−0.205−0.383−0.304−0.3760.0830.0300.218−0.1030.0390.2570.099−0.0431.000
Land Cover−0.267−0.086−0.1470.151−0.290−0.2690.004−0.118−0.270−0.277−0.2900.2370.1670.1600.0460.1820.1630.2660.1020.0611.000
Elevation−0.8090.0510.0170.032−0.555−0.5370.034−0.902−0.556−0.727−0.5630.039−0.0030.108−0.1970.0020.0560.165−0.0050.2390.1281.000
Table 4. Generated and selected candidate models and their fit and validation statistics.
CriteriaNumber_of_Models
All candidate models2480
Statistically significant models2480
Models meeting omission rate criteria0
Models meeting AICc criteria2
Statistically significant models meeting omission rate criteria0
Statistically significant models meeting AICc criteria2
Statistically significant models meeting omission rate and AICc criteria0
Selected modelM_0.1_F_qp
Statistics of the selected model
Mean AUC ratio1.501
Rate of omission > 0.05%0.057
AICc18,636.44
Delta AICc0
Table 5. Annual mean temperature (Bio 1), Isothermality (Bio 3), Temperature Seasonality (Bio 4), Temperature Annual Range (Bio 7), and Precipitation Seasonality (Bio 15) for the current and future scenarios of the 2050s and 2070s under RCP 4.5 and RCP 8.5 of India and major coconut growing states. The values in brackets indicate change from the current value.
Bio VariableCountry/StateCurrentRCP 4.5RCP 8.5
2050s2070s2050s2070s
Bio 1 (°C)India25.6427.37 (1.73)27.78 (2.14)27.85 (2.21)28.94 (3.3)
Andhra Pradesh (AP)27.3729.15 (1.77)29.54 (2.16)29.41 (2.04)30.51 (3.14)
Karnataka25.5527.05 (1.49)27.40 (1.84)27.53 (1.97)28.64 (3.08)
Tamil Nadu (TN)27.2628.96 (1.70)29.30 (2.04)29.43 (2.17)30.44 (3.18)
Kerala26.1327.59 (1.46)27.94 (1.81)28.08 (1.95)29.00 (2.86)
Bio 3 (%)India40.7947.44 (6.65)47.64 (6.85)47.60 (6.81)47.30 (6.51)
AP42.3346.79 (4.46)47.32 (4.99)46.92 (4.59)46.39 (4.06)
Karnataka45.3253.18 (7.86)53.28 (7.96)53.21 (7.89)52.49 (7.17)
TN48.9756.03 (7.06)56.61 (7.64)56.18 (7.21)54.77 (5.80)
Kerala47.6161.63 (14.02)62.12 (14.51)62.25 (14.64)62.17 (14.56)
Bio 4 (%)India29.7931.37 (1.58)30.93 (1.14)31.1 (1.31)31.34 (1.55)
AP26.2729.48 (3.21)28.89 (2.62)28.62 (2.35)29.66 (3.39)
Karnataka20.8521.96 (1.11)21.84 (0.99)22.27 (1.42)23.39 (2.54)
TN19.3721.39 (2.02)20.83 (1.46)21.3 (1.93)22.28 (2.91)
Kerala10.7611.74 (0.98)11.64 (0.88)11.87 (1.11)12.35 (1.59)
Bio 7 (°C)India20.0922.05 (1.96)22.03 (1.91)21.85 (1.76)21.87 (1.78)
AP18.1220.50 (2.38)20.26 (2.14)19.86 (1.75)20.12 (2.00)
Karnataka18.2019.45 (1.26)19.27 (1.08)19.33 (1.14)19.56 (1.37)
TN14.6416.10 (1.45)15.80 (1.16)15.96 (1.32)16.42 (1.77)
Kerala10.7211.88 (1.16)11.65 (0.94)11.71 (0.99)11.86 (1.14)
Bio 15 (%)India103.8106.3 (2.5)104.3 (0.5)105.6 (1.8)107.7 (3.9)
AP88.5992.54 (3.95)91.45 (2.86)92.14 (3.55)94.41 (5.82)
Karnataka98.44101.39 (2.95)99.41 (0.97)100.55 (2.11)103.38 (4.94)
TN76.8183.24 (6.43)79.65 (2.84)81.5 (4.69)84.65 (7.84)
Kerala90.3587.02 (−3.33)83.02 (−7.33)85.79 (−4.56)87.01 (−3.34)
Table 6. Climatically suitable and unsuitable areas for growing coconut under the current and the future climate of RCP 4.5 and RCP 8.5 and the range expansion and contraction (the values in brackets are the difference in percentage from total study area) as modeled by MaxEnt for India and major coconut growing states.
Country/StateCategoryArea (km2)
CurrentRCP 4.5RCP 8.5
2050207020502070
India
(Study area)
Range expansion 52,617 (3.8%)61,642 (4.4%)75,383 (5.4%)65,164 (4.7%)
Unsuitable1,184,077 (85%)1,131,238 (81.2%)1,122,212 (80.5%)1,108,471 (79.6%)1,118,691 (80.3%)
Suitable209,374 (15%)161,776 (11.6%)168,738 (12.1%)173,169 (12.4%)172,036 (12%)
Range contraction 47,578 (3.4%)40,616 (2.9%)36,184 (2.6%)37,317 (2.7%)
KarnatakaRange expansion 27,956 (14.5%)28,348 (14.7%)38,858 (20.2%)24,880 (12.9%)
Unsuitable11,4714 (60)86,759 (45.1%)86,366 (44.9%)75,857 (39.4%)89,835 (46.7%)
Suitable77,591 (40)60,723 (31.6%)62,994 (32.8%)67,846 (35.3%)63,448 (33.0%)
Range contraction 16,869 (8.8%)14,597 (7.6%)9745 (5.1%)14,143 (7.4%)
KeralaRange expansion 1051 (2.8%)798 (2.2%)1009 (2.7%)1807 (4.9%)
Unsuitable7439 (20%)6388 (17.3%)6640 (17.9%)6430 (17.4%)5631 (15.2%)
Suitable29,565 (80%)28,599 (77.3%)28,641 (77.4%)28,536 (77.1%)28,998 (78.4%)
Range contraction 967 (2.6%)925 (2.5%)1030 (2.8%)567 (1.5%)
Tamil NaduRange expansion 9804 (7.5%)15,346 (11.8%)15,283 (11.7%)16,144 (12.4%)
Unsuitable54,141 (42%)44,337 (34.0%)38,795 (29.7%)38,858 (29.8%)37,998 (29.1%)
Suitable76,289 (58%)67,997 (52.1%)71,356 (54.7%)71,041 (54.5%)72,531 (55.6%)
Range contraction 8292 (6.4%)4933 (3.8%)5248 (4.0%)3758 (2.9%)
Publisher’s Note: MDPI stays neutral with regard to jurisdictional claims in published maps and institutional affiliations.

