
Spatial Distribution of Polyphenolic Compounds in Corn Grains (Zea mays L. var. Pioneer) Studied by Laser Confocal Microscopy and High-Resolution Mass Spectrometry

 ,
,  ,
,  ,
,  ,
, 
Abstract
:1. Introduction
2. Results
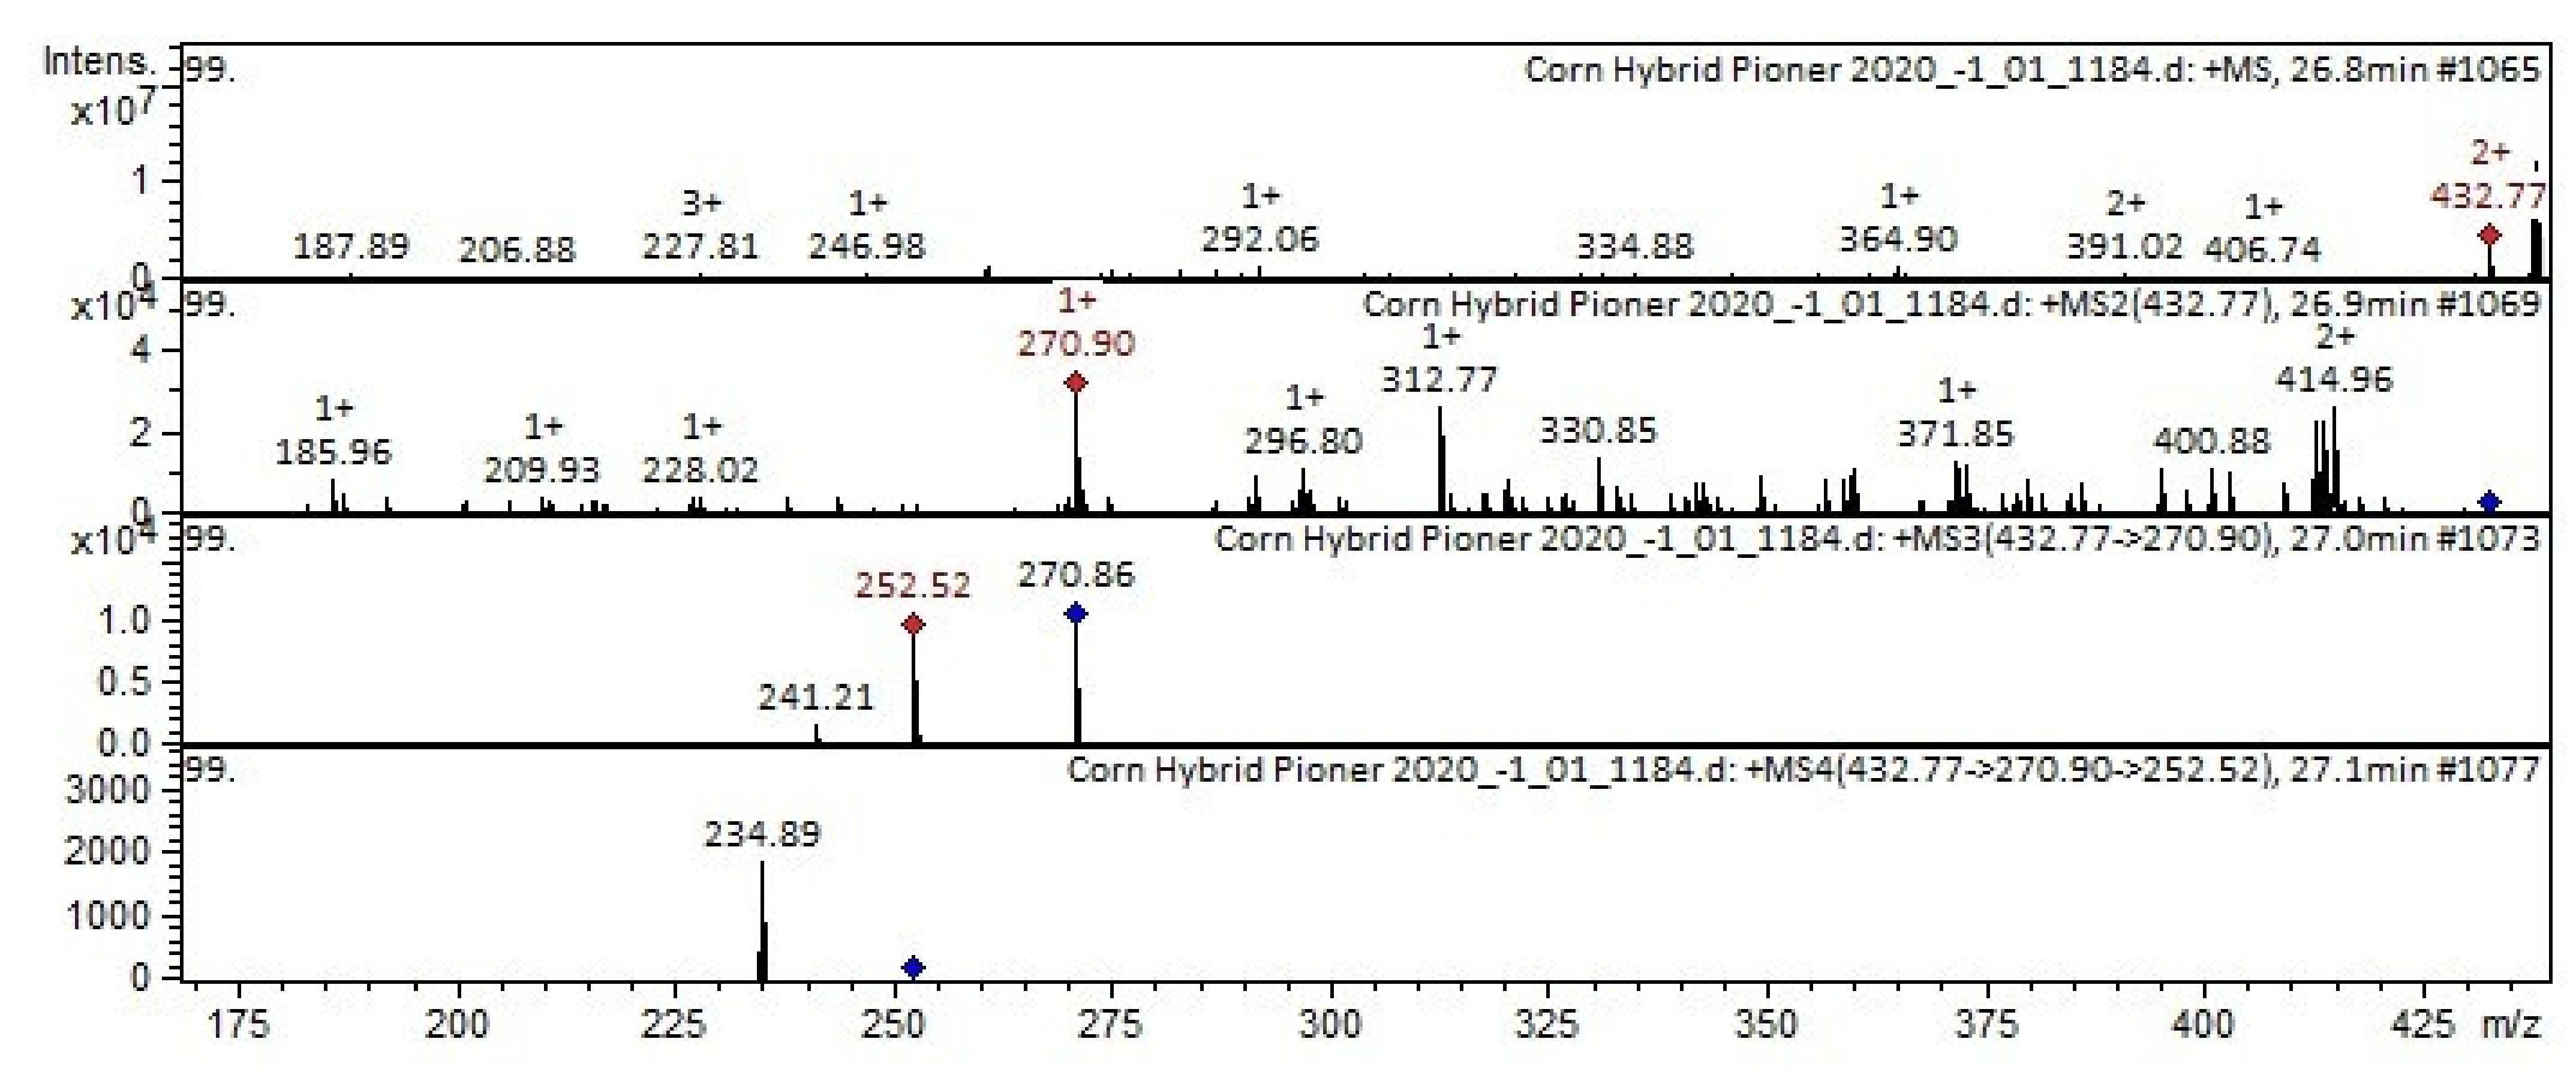
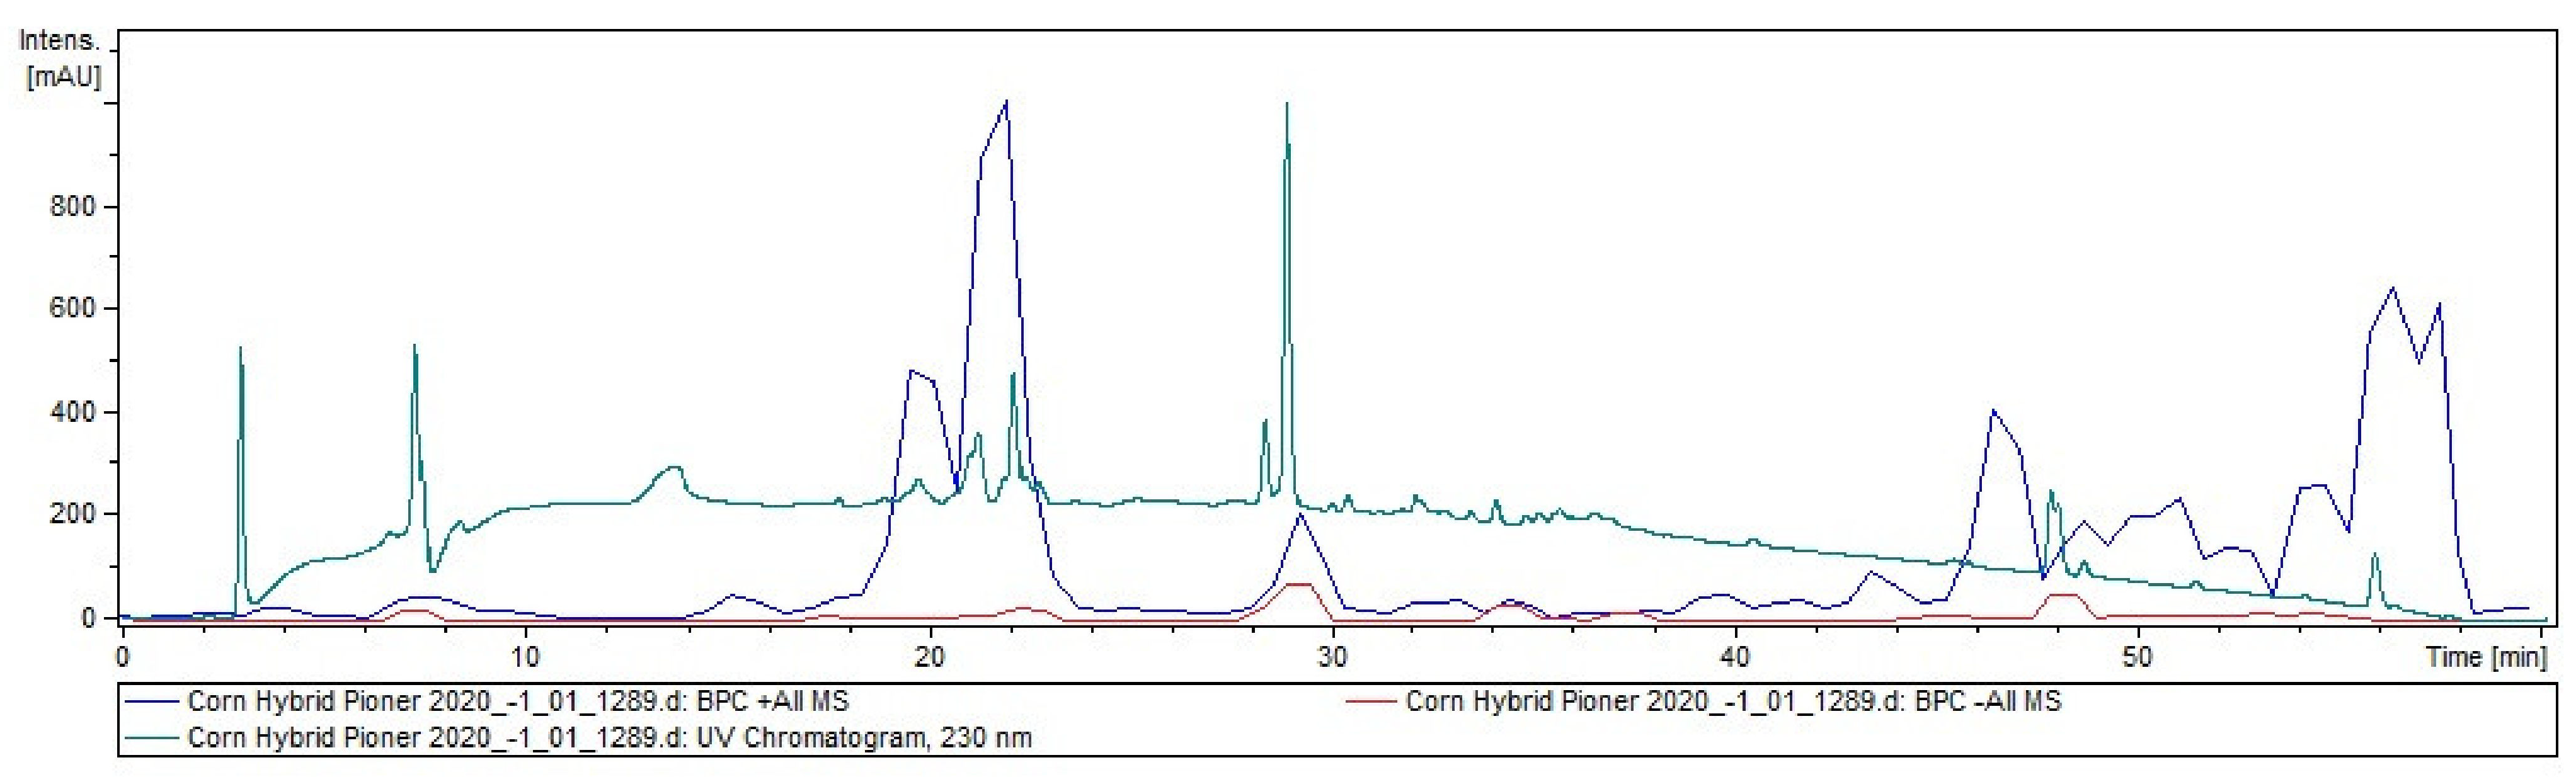
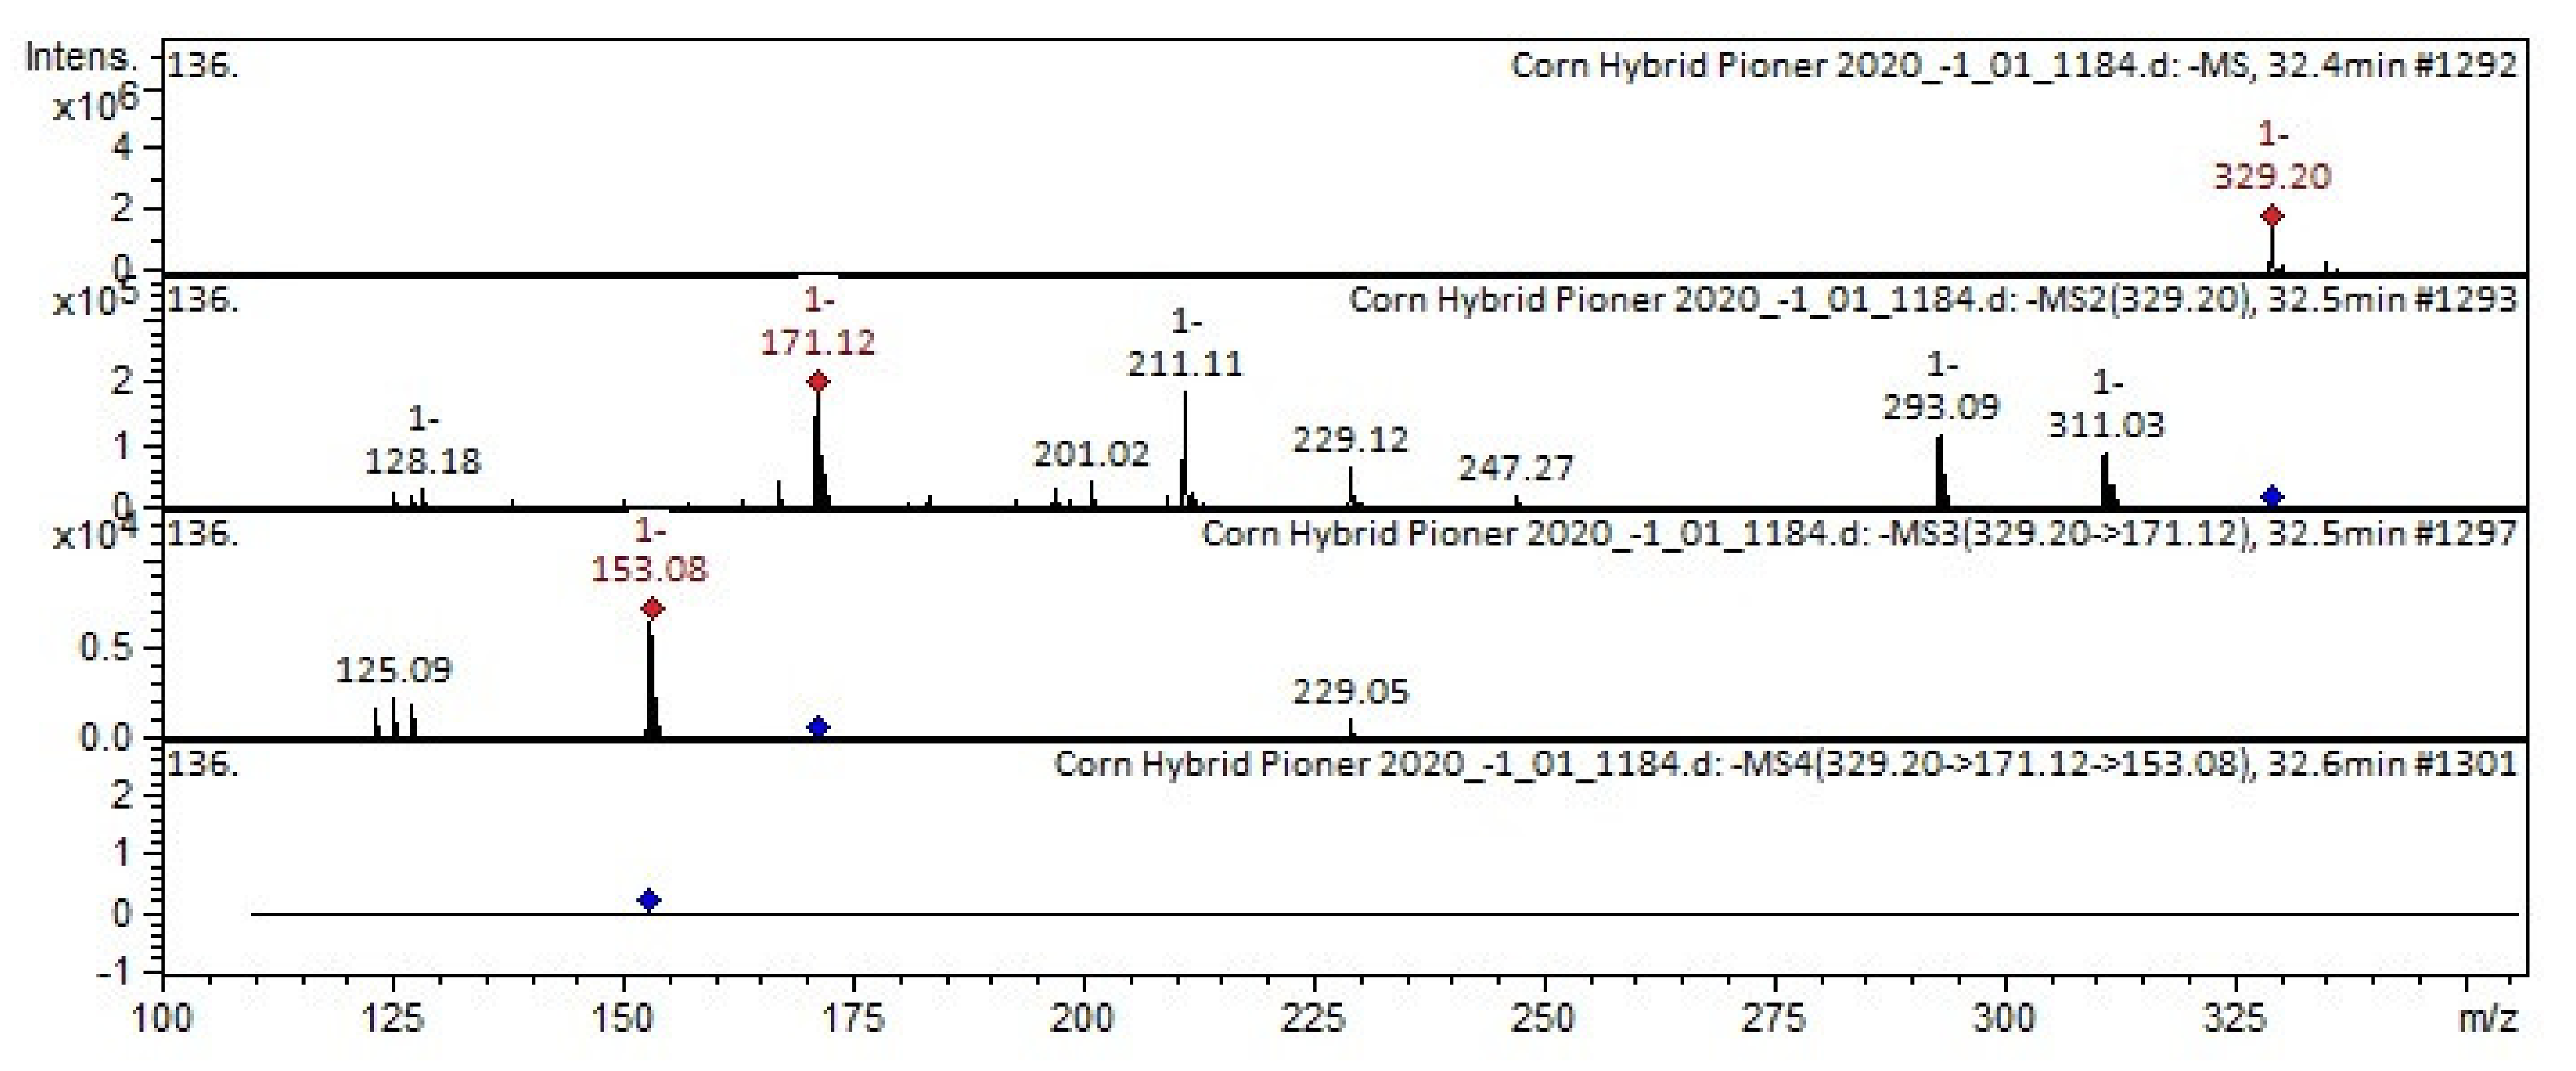
2.1. Tandem Mass Spectrometry
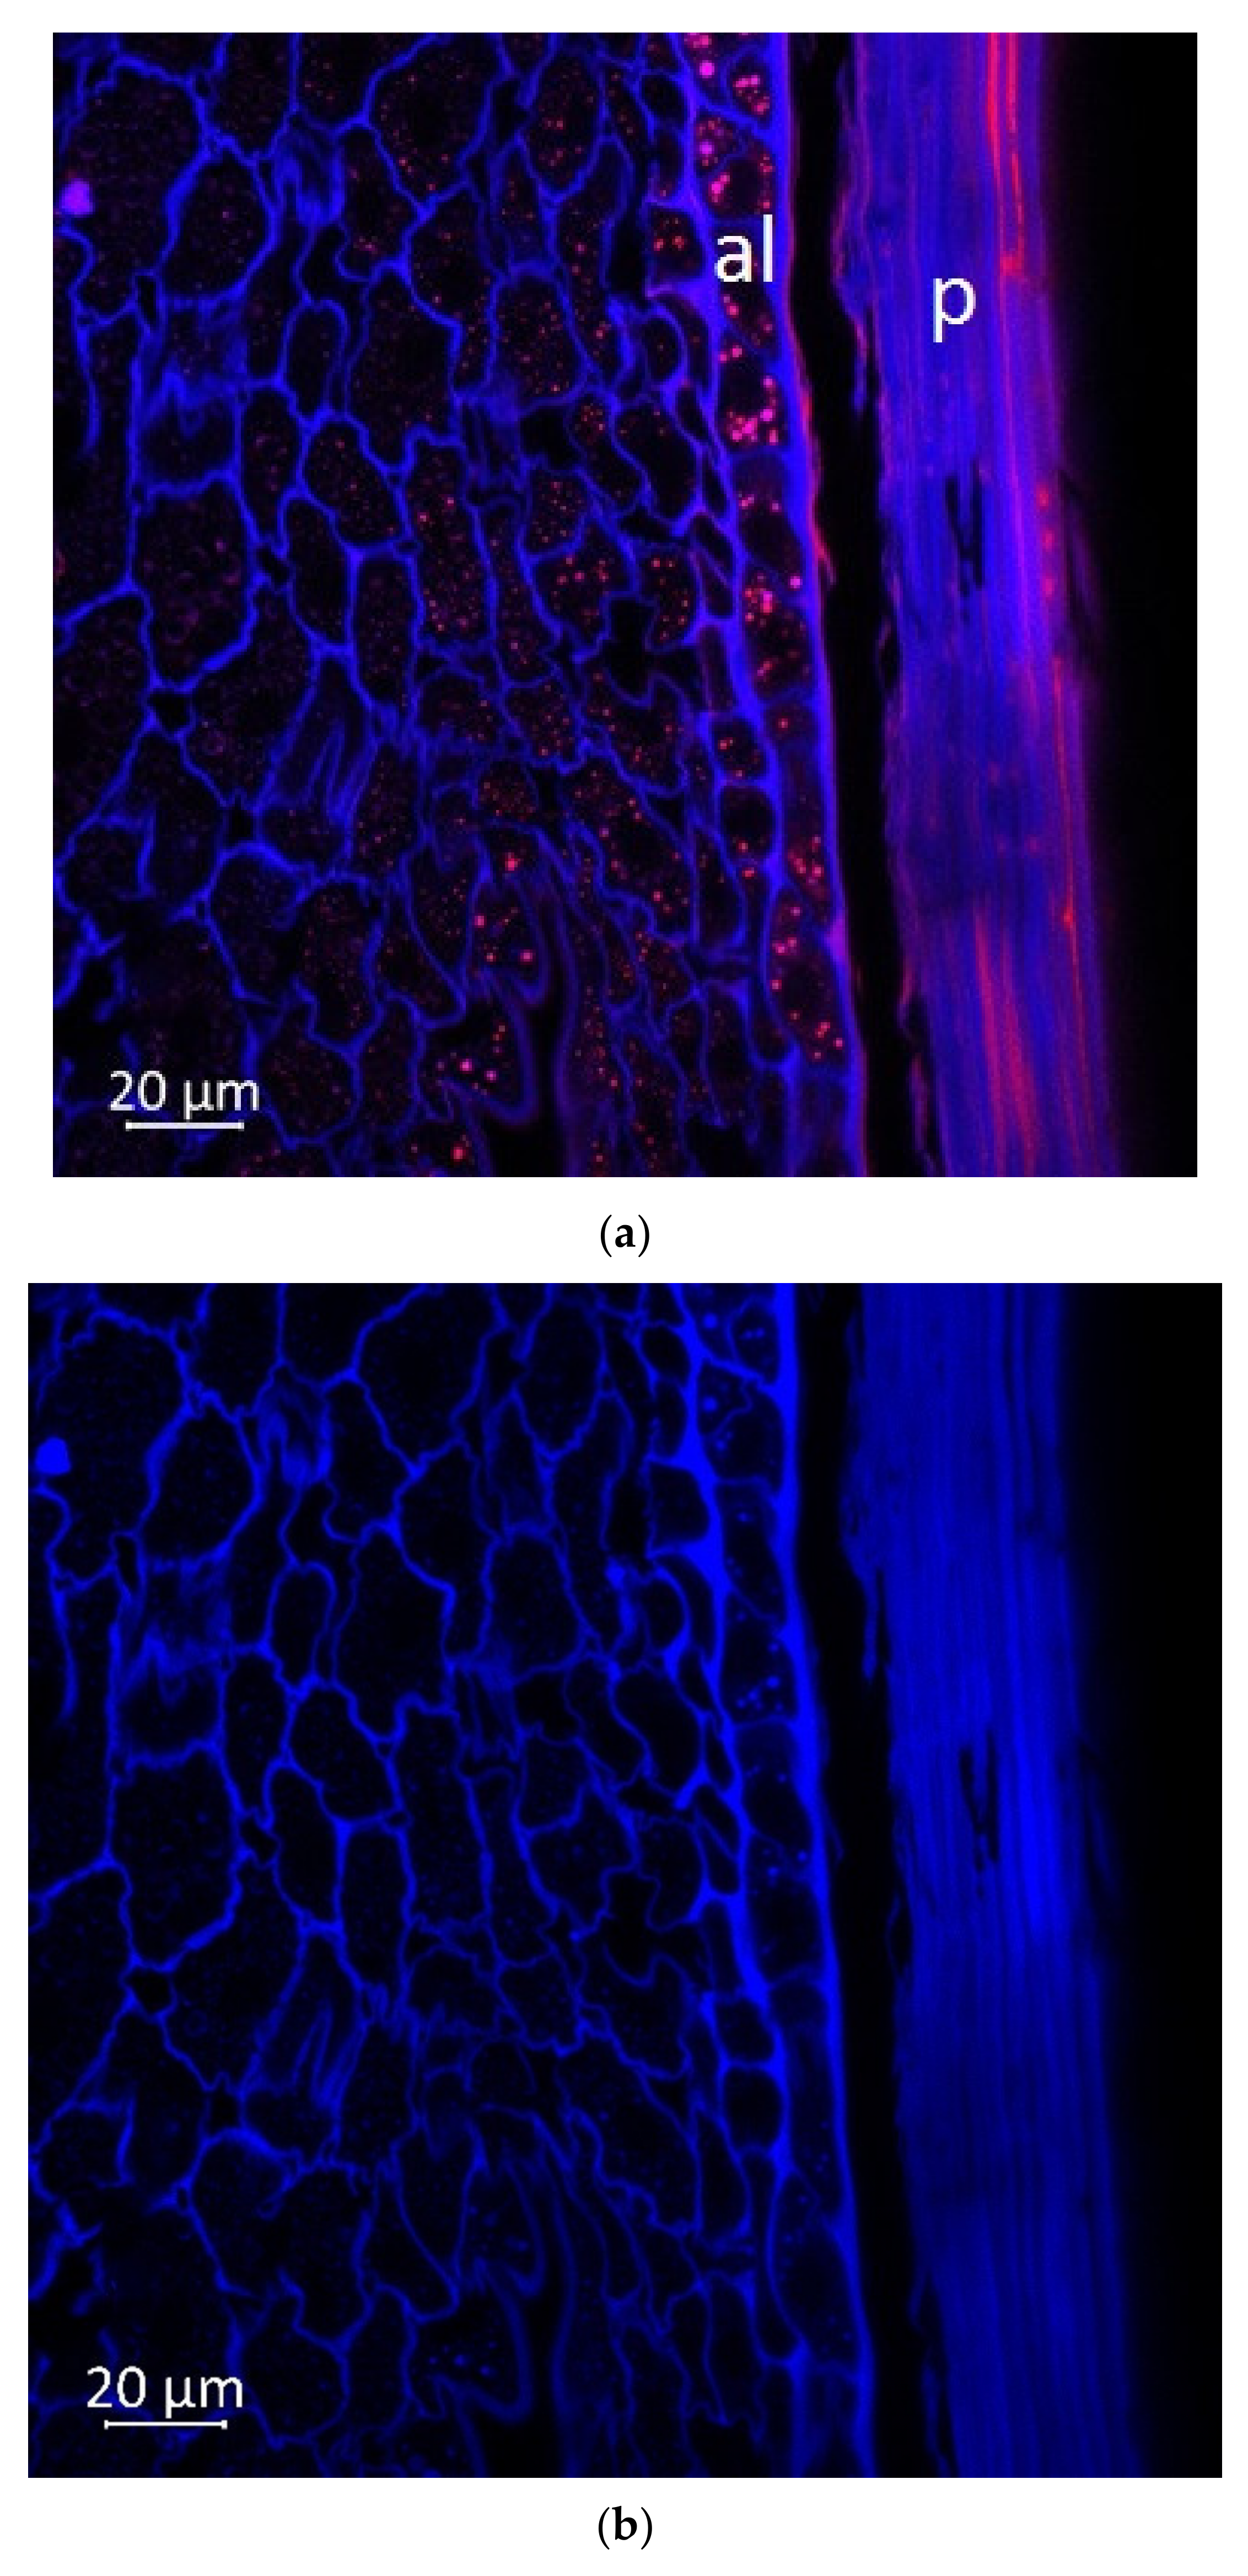
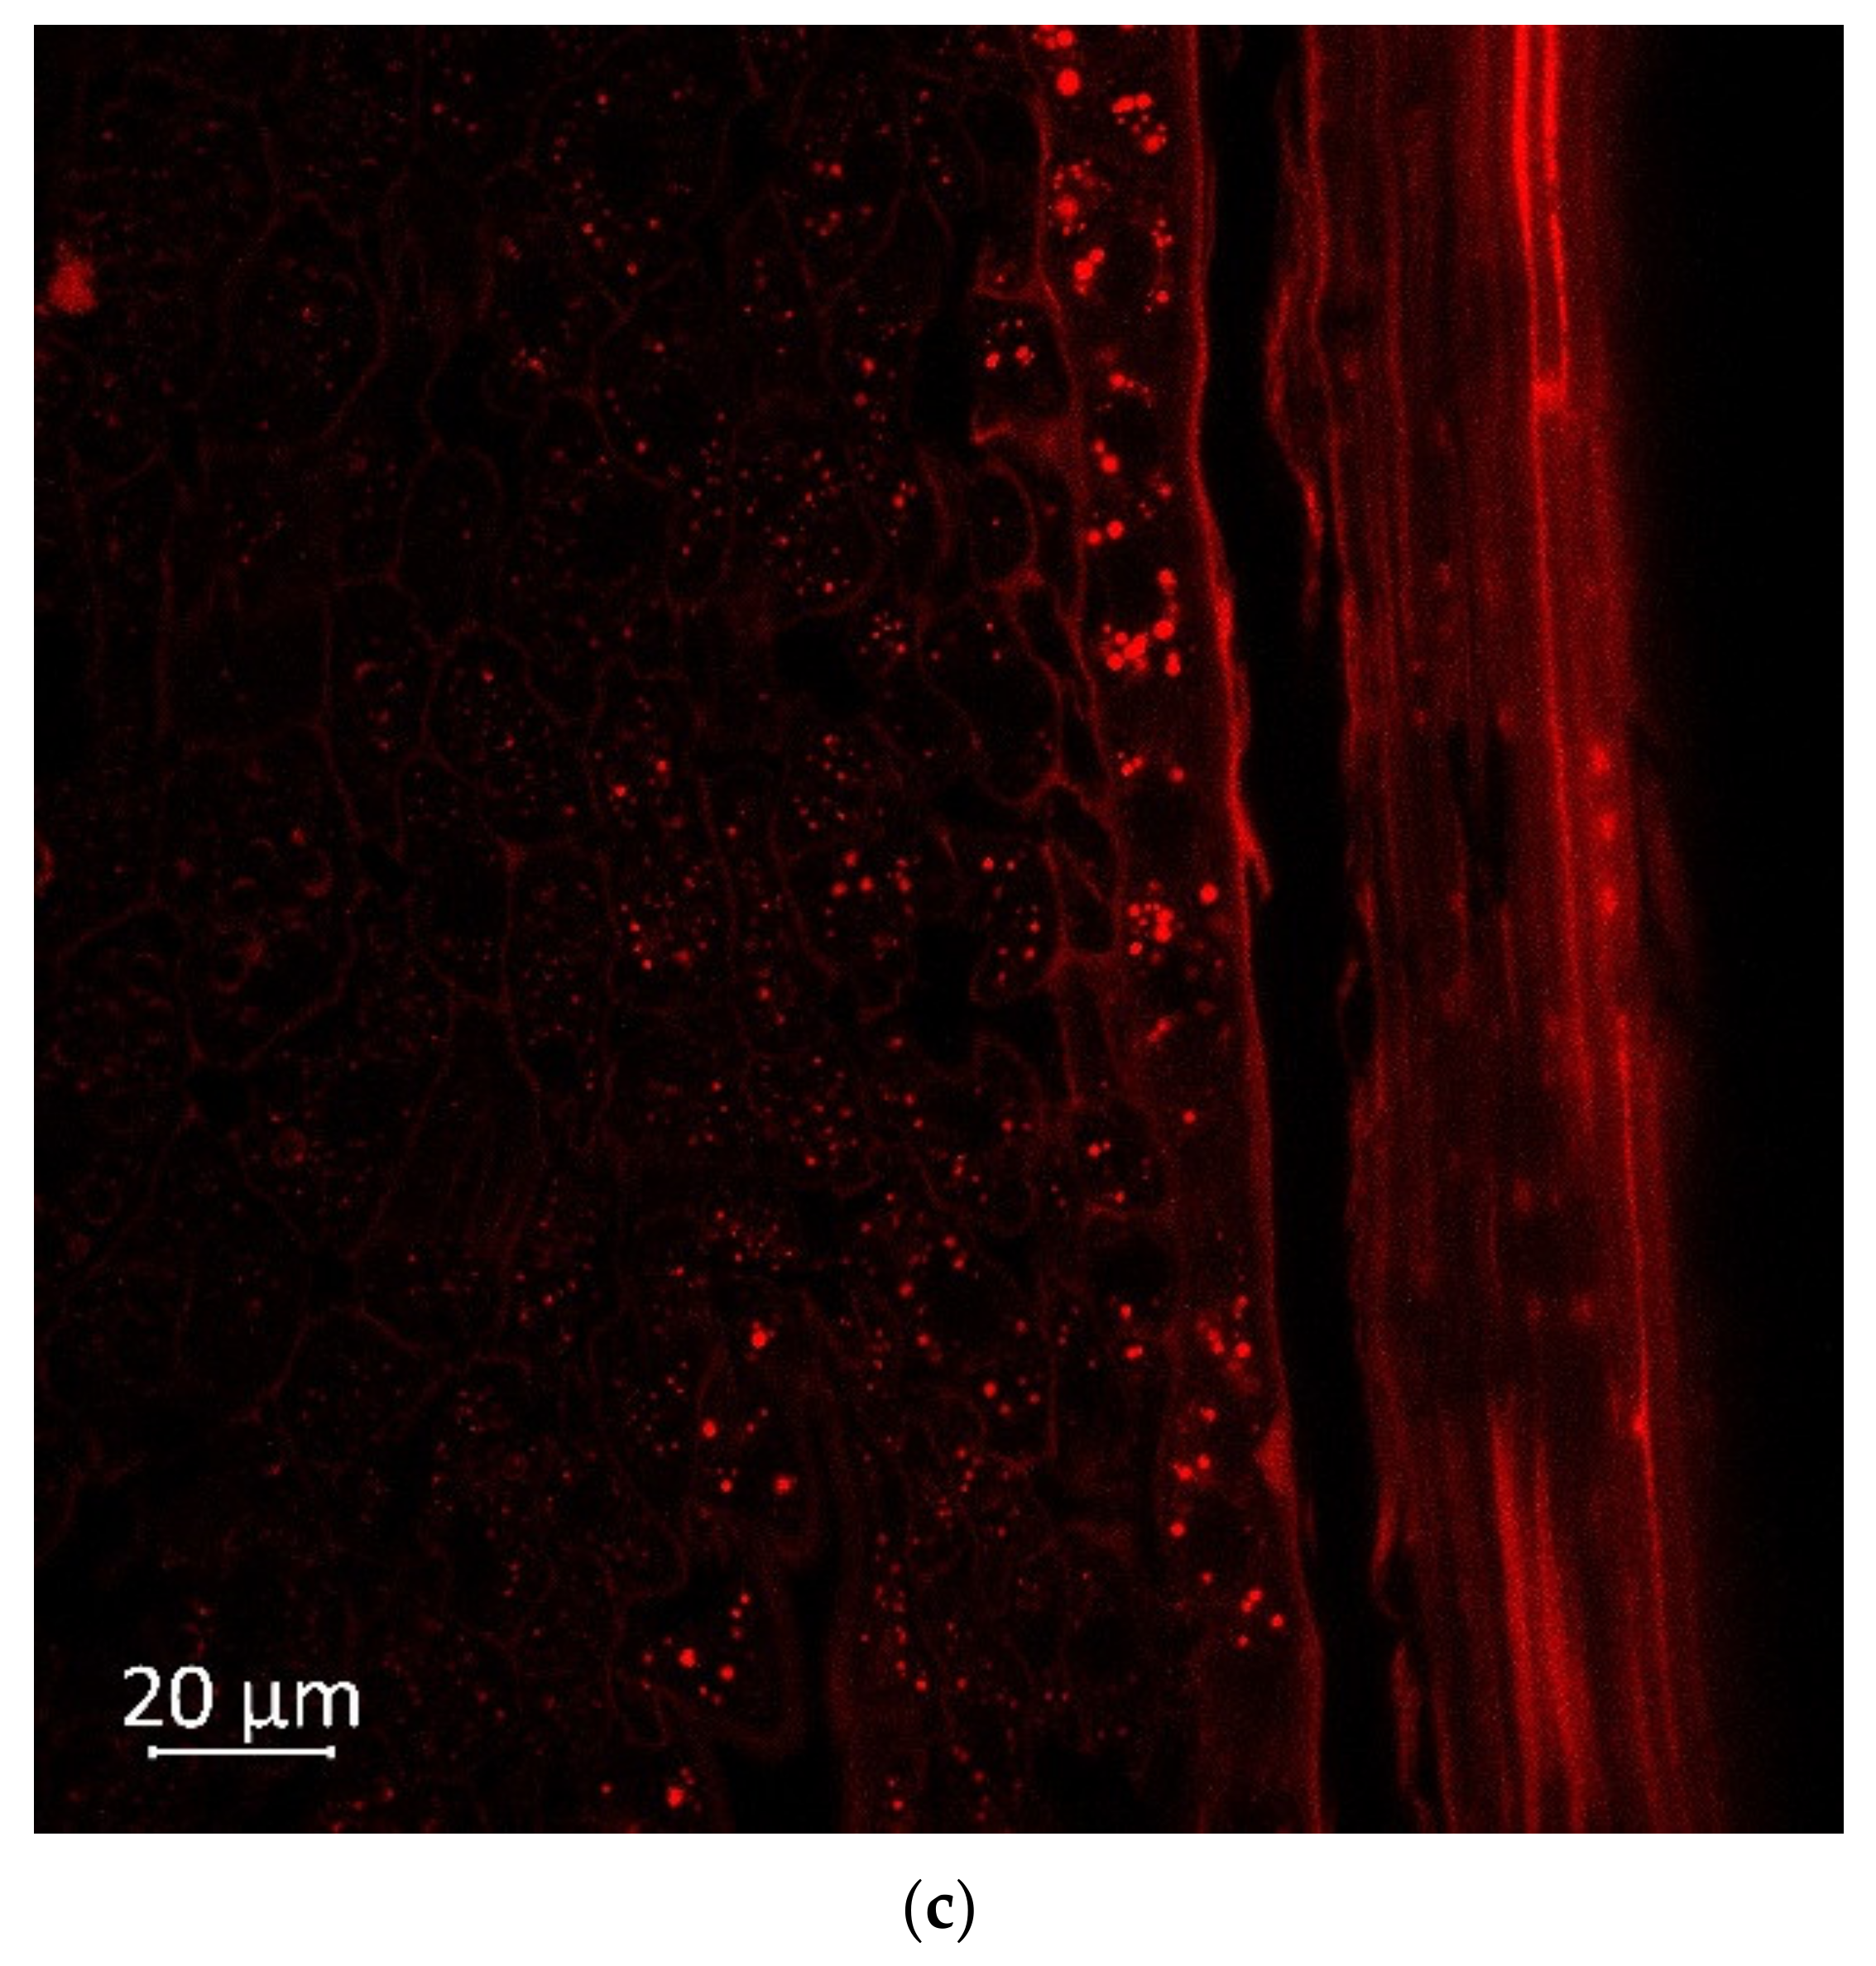
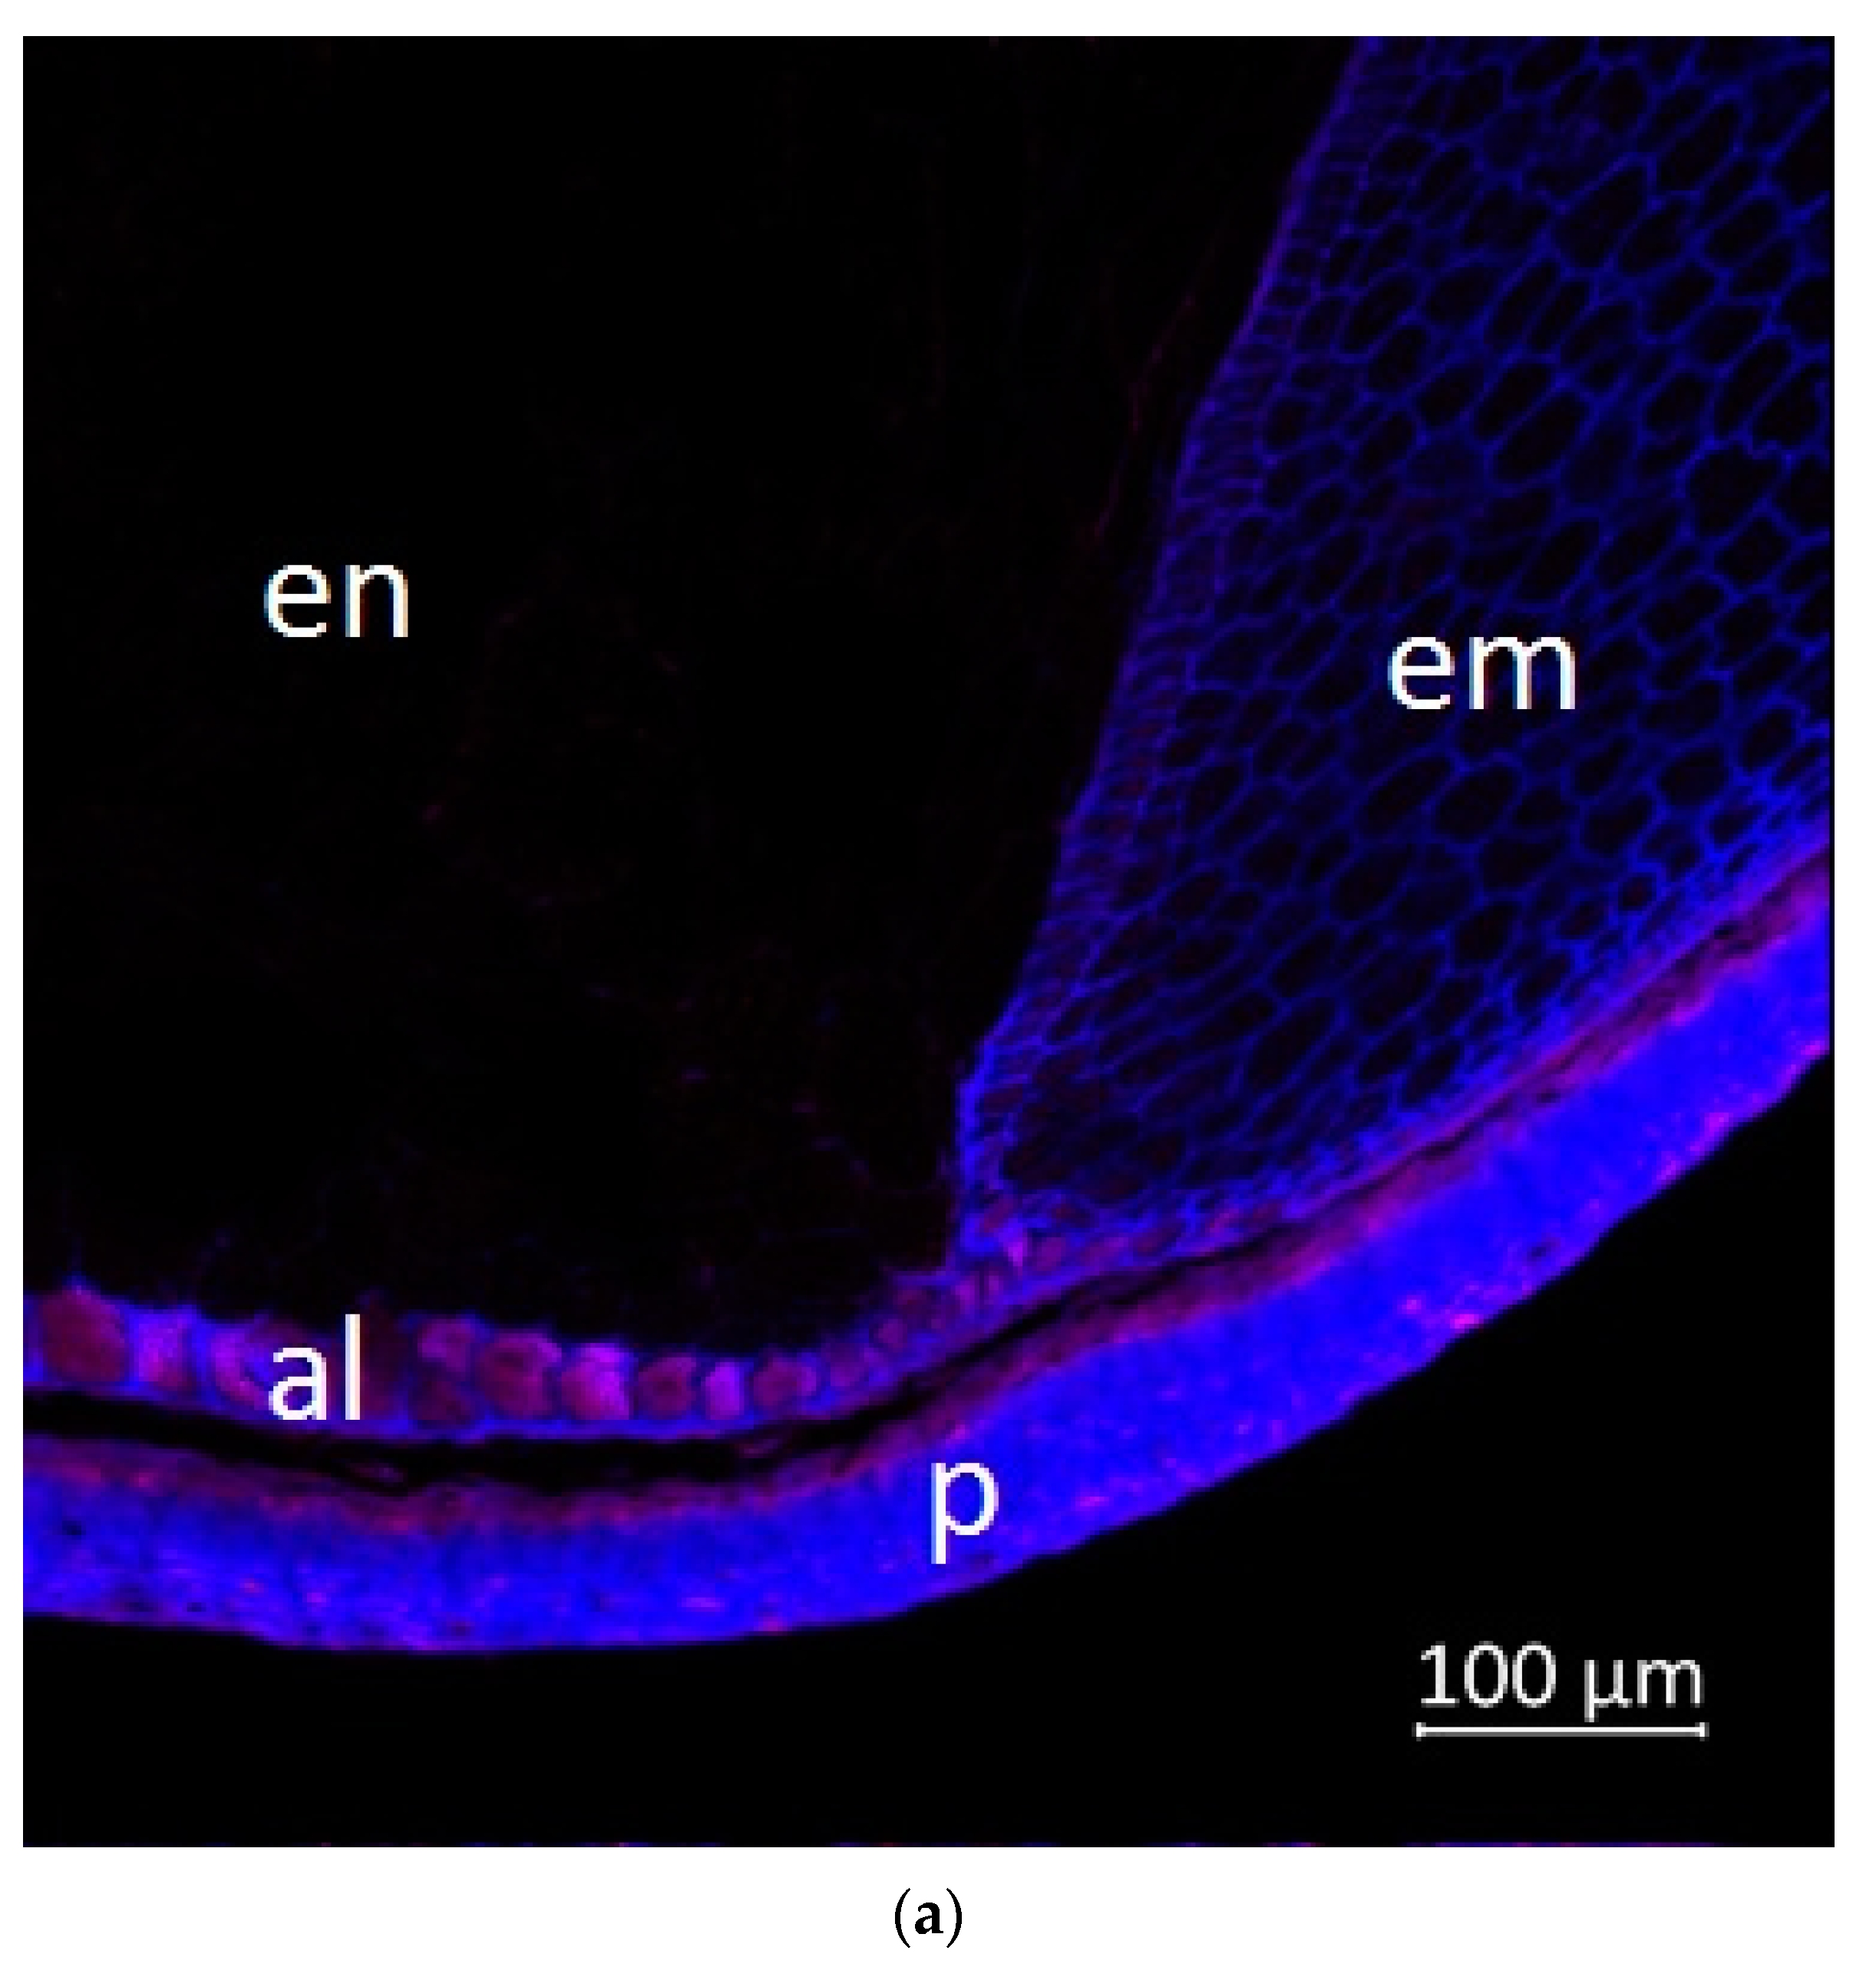
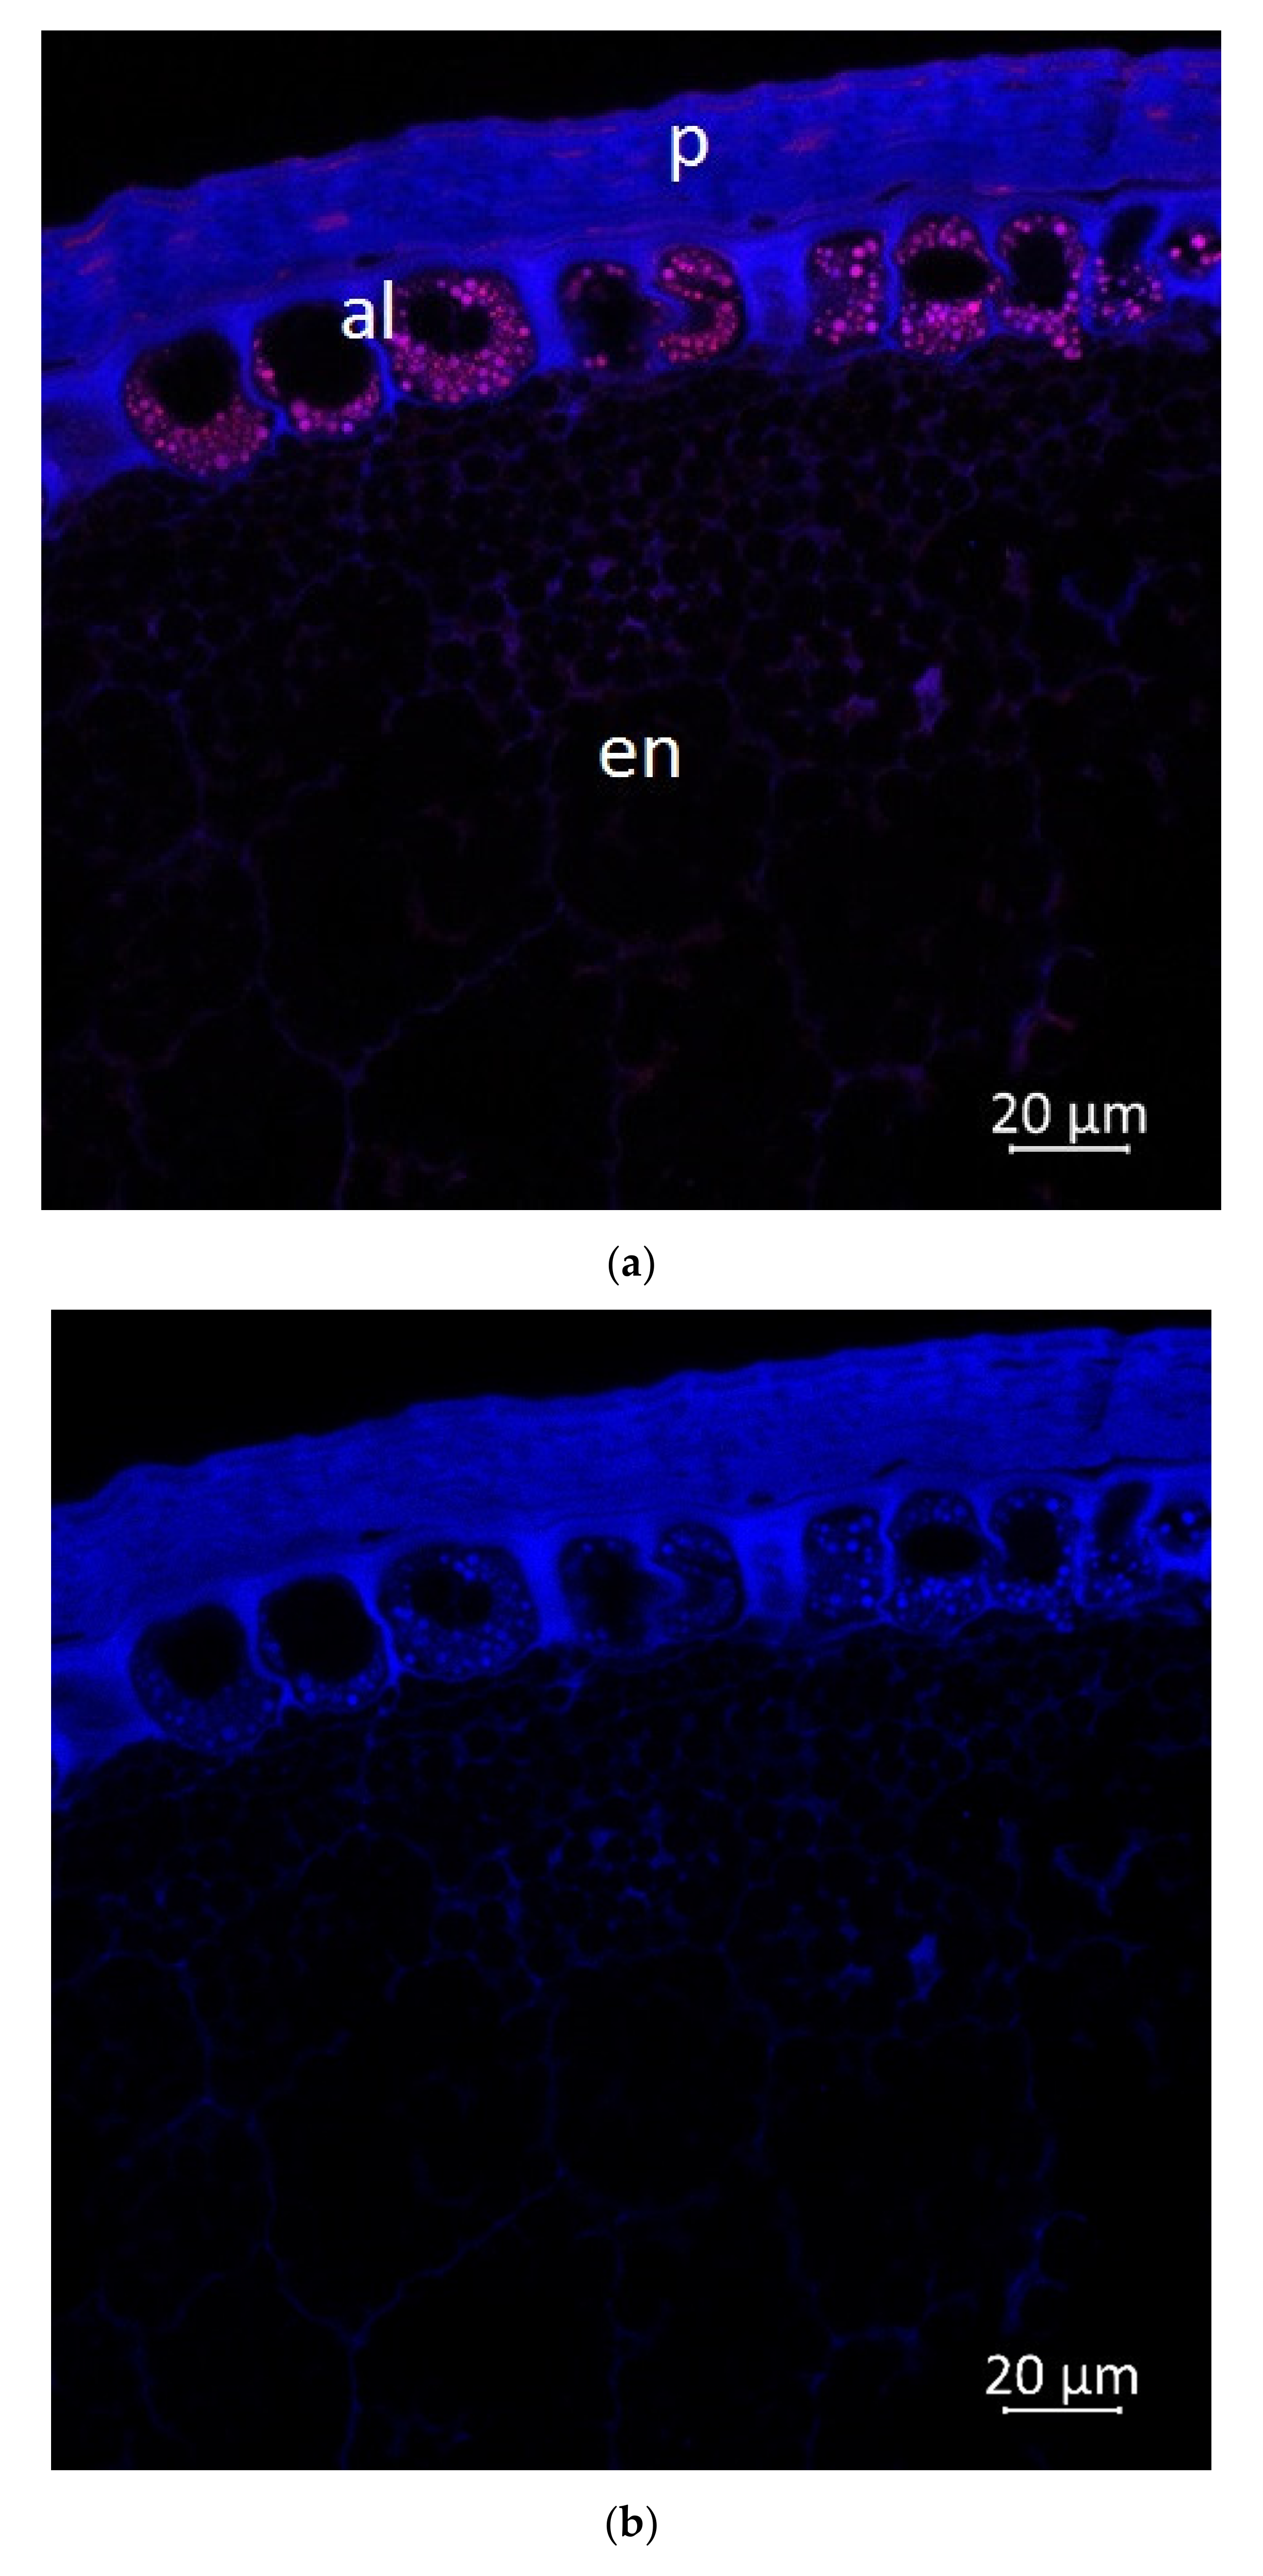
2.2. Confocal Microscopy
3. Discussion
4. Materials and Methods
4.1. Materials and Chemicals
4.2. Fractional Maceration
4.3. Liquid Chromatography
4.4. Mass Spectrometry
4.5. Optical Microscopy
5. Conclusions
Author Contributions
Funding
Institutional Review Board Statement
Informed Consent Statement
Data Availability Statement
Conflicts of Interest
Appendix A

| No. | Class | Compound | Molecular Formula | Calculated Mass | Molecular Ion [M−H]− | Molecular Ion [M+H]+ | Fragmenation Ion MS2 | Fragmentation Ion MS3 | Fragmentation Ion MS4 | References |
|---|---|---|---|---|---|---|---|---|---|---|
| POLYPHENOLS | ||||||||||
| 1 | Phenolic acid | Caffeic acid [(2E)-3-(3,4-Dihydroxyphenyl)acrylic acid] | C9H8O4 | 180.1574 | 181 | 135 | 119 | Dracocephalum palmatum [49]; Eucalyptus [50]; Triticum [51]; Salvia miltiorrhiza [52] | ||
| 2 | Phenolic acid | Hydroxy methoxy dimethylbenzoic acid | C10H12O4 | 196.1999 | 197 | 177; 153 | 125 | F. herrerae; F. glaucescens [53] | ||
| 3 | Phenolic acid | Hydroxyferulic acid | C10H10O5 | 210.1834 | 211 | 193; 125 | Andean blueberry [54]; | |||
| 4 | Stilbene | Resveratrol [trans-Resveratrol; 3,4′,5-Trihydroxystilbene; Stilbentriol] | C14H12O3 | 228.2433 | 229 | 209 | 163 | 146 | A. cordifolia; F. glaucescens; F. herrerae [53]; Radix polygoni multiflori [55] | |
| 5 | Dihydroxybenzoic acid | 3,4-Diacetoxybenzoic acid | C10H11O6 | 238.1935 | 237 | 119 | Potato leaves [56]; Triticum aestivum L. [57]; | |||
| 6 | Flavan-3-ol | Epiafzelechin [(epi)Afzelechin] | C15H14O5 | 274.2687 | 275 | 245; 176 | 175 | Cassia granidis [58]; Cassia abbreviata [59,60]; A. cordifolia; F. glaucescens; F. herrerae [53] | ||
| 7 | Flavonol | Kaempferol [3,5,7-Trihydroxy-2-(4-hydro-xyphenyl)-4H-chromen-4-one] | C15H10O6 | 286.2363 | 285 | 185; 117; 257 | 117 | Rhus coriaria (Sumac) [61]; Lonicera japonicum [62]; Andean blueberry [54]; Potato [63]; Potato leaves [56]; | ||
| 8 | Flavan-3-ol | Catechin [D-Catechol] | C15H14O6 | 290.2681 | 291 | 261; 189 | 173; 242 | 191; 143 | Potato [64]; Triticum [51]; millet grains [65]; Solanaceae [66]; Beer [67]; V. edulis [53]; Vigna inguiculata [68]; Radix polygoni multiflori [55]; Senna singueana [69]; Camellia kucha [70]; | |
| 9 | Flavan-3-ol | (epi)catechin | C15H14O6 | 290.2681 | 291 | 261; 173 | 243; 173 | C. edulis [53]; Radix polygoni multiflori [55]; Camellia kucha [70]; | ||
| 10 | Hydroxycinnamic acid | Caffeoylmalic acid | C13H12O8 | 296.2296 | 295 | 277; 171 | 233; 113 | Potato leaves [56]; Strawberry [71] | ||
| 11 | Flavonol | Quercetin | C15H10O7 | 302.2357 | 303 | 275; 245; 203; 175 | 175 | Rhus coriaria [61]; Potato leaves [56]; Vigna sinensis [72]; Impatiens glandulifera Royle [73]; Eucalyptus [50]; Triticum [51]; millet grains [65]; Tomato [74]; Bougainvillea [75] | ||
| 12 | Flavan-3-ol | Gallocatechin [+(−) Gallocatechin] | C15H14O7 | 306.2675 | 307 | 277; 207 | 207; 159 | millet grains [65]; Solanaceae [66]; Licania ridigna [76]; G. linguiforme [53]; Senna singueana [69]; Vaccinium myrtillus [77] | ||
| 13 | Flavonol | Myricetin | C15H10O8 | 318.2351 | 319 | 291; 219; 174 | 259; 191 | 243; 161 | Dracocephalum palmatum [49]; Potato [63,64]; Perilla frutescens [78]; Tomato [74]; Mentha [79]; Salvia miltiorrhiza [52]; Rubus occidentalis [80]; Sanguisorba officinalis [81]; Radix polygoni multiflori [55] | |
| 14 | Flavone | Cirsiliol | C17H14O7 | 330.2889 | 329 | 229; 171; 293 | 211; 155 | 183 | Ocimum [82] | |
| 15 | Flavone | 5,7-Dimetoxy-3,3′,4′-trihydroxyflavone | C17H14O7 | 330.2889 | 331 | 315; 270 | 313 | 285; 257 | Oxalis corniculata [83] | |
| 16 | Flavone | Luteolin 7,3′-disulphate | C15H10O12S2 | 446.3627 | 447 | 287 | 152 | Zostera marina [84] | ||
| 17 | Flavone | Apigenin 7-sulfate | C15H10O8S | 350.3001 | 351 | 337; 308 | 308; 291 | G. linguiforme [53]; sulphates [85] | ||
| 18 | Lignan | Matairesinol [(−)-Matairesinol; Artigenin Congener] | C20H22O6 | 358.3851 | 359 | 324; 289; 127 | 144 | 127 | Punica granatum [86]; Wheat [87]; Lignans [88] | |
| 19 | Hydroxycinnamic acid derivative | Caffeic acid derivative | C16H18O9Na | 377.2985 | 377 | 341; 215 | 179; 113 | Bougainvillea [75] | ||
| 20 | Gallate ester, derivative of epiafzelechin | Epiafzelechin 3-O-gallate | C22H18O9 | 426.3729 | 427 | 301; 171; 382 | 171 | Camellia kucha [70]; | ||
| 21 | Flavone | Apigenin-C-hexoside | C21H20O10 | 432.3775 | 433 | 418; 314; 265; 219; 155 | 257; 169 | Triticum durum [89]; Beer [67] | ||
| 22 | Anthocyanidin | Pelargonidin-3-O-glucoside (callistephin) | C21H21O10 | 433.3854 | 433 | 271; 185 | 253; 121 | 235 | Triticum aestivum L. [28,29]; strawberry [30] | |
| 23 | Anthocyanidin | Cyanidin-3-O-glucoside [Cyanidin 3-O-beta-D-Glucoside; Kuromarin] | C21H21O11+ | 449.3848 | 447 | 285 | 199 | Triticum [29,51]; acerola [90]; rice [91]; Vigna sinensis [72]; Rapeseed petals [92] | ||
| 24 | Flavone | Luteolin-7-O-beta-glucuronide | C21H18O12 | 462.3604 | 463 | 447; 395; 359; 285; 199; 149 | 287; 199 | Mentha [93,94]; rat plasma [95]; Newbouldia laevis [60] | ||
| 25 | Flavonol | Kaempferol-3-O-glucuronide | C21H18O12 | 462.3604 | 463 | 287; 198 | 269; 198 | Strawberry [71]; A.cordifolia; G. linguiforme [53]; Rhus coriaria [61] | ||
| 26 | Anthocyanidin | Delphinidin malonyl hexoside | C24H23O15 | 551.4304 | 551 | 465; 287; 185 | 287; 115 | F. glaucescens [53] | ||
| 27 | Flavone | Chrysoeriol C-hexoside-C-pentoside | C27H30O15 | 594.5181 | 595 | 578; 536; 509; 425 | 294 | Triticum aestivum L. [57,96]; T. durum [89] | ||
| 28 | Flavonol | Quercetin 3,4′-di-O-beta-glucopyranoside [Quercetin diglucoside] | C27H30O17 | 626.5169 | 627 | 465 | 447; 405; 303 | Potato leaves [56]; Potato [63]; Rapeseed petals [92]; | ||
| 29 | Flavone | Tricin trimethyl ether 7-O-hexosyl-hexoside | C30H36O17 | 668.5966 | 669 | 345; 387; 283 | Triticum aestivum L. [97] | |||
| 30 | Flavan-3-ol | (Epi)fisetinidol-(epi)catechin-A-(epi)fisetinidol | C45H36O16 | 832.7577 | 831 | 721; 693; 609; 575; 537; 506 | Chamaecrista nictitans [98] | |||
| OTHER COMPOUNDS | ||||||||||
| 31 | Amino acid | L-Lysine | C6H14N2O2 | 146.1876 | 147 | 119 | Lonicera japonica [62]; | |||
| 32 | Amino acid | L-threanine | C7H14N2O3 | 174.1977 | 175 | 159 | Camellia kucha [70] | |||
| 33 | Amino acid | L-Tryptophan [Tryptophan; (S)-Tryptophan] | C11H12N2O2 | 204.2252 | 205 | 161; 159 | 143 | Passiflora incarnata [99]; Vigna unguiculata [100]; Camellia kucha [70]; | ||
| 34 | Omega-5 fatty acid | Myristoleic acid [Cis-9-Tetradecanoic acid] | C14H26O2 | 226.3550 | 227 | 209; 168 | 127 | F. glaucescens [53] | ||
| 35 | Monobasic saturated carboxylic acid | Myristic acid [Tetradecanoic acid; N-Tetradecanoic acid] | C14H28O2 | 228.3709 | 229 | 142; 205 | 114 | Rhododendron adamsii [101] | ||
| 36 | Medium-chain fatty acid | Hydroxy dodecanoic acid | C12H22O5 | 246.3001 | 247 | 238 | 203 | 174 | F. glaucescens [53] | |
| 37 | Ribonucleoside composite of adenine (purine) | Adenosine | C10H13N5O4 | 267.2413 | 268 | 136 | Lonicera japonica [62] | |||
| 38 | Omega-3 fatty acid; octadecatetraenoic acid | Stearidonic acid [6,9,12,15-Octadecatetraenoic acid; Moroctic acid] | C18H28O2 | 276.4137 | 277 | 259; 177 | 177 | Salviae Miltiorrhizae [102]; G. linguiforme [53]; Rhus coriaria [61] | ||
| 39 | Omega-3 fatty acid | Linolenic acid (Alpha-Linolenic acid; Linolenate) | C18H30O2 | 278.4296 | 279 | 243; 173 | 173 | 131 | Salviae [102]; rice [91]; Pinus silvestris [103] | |
| 40 | Diterpenoid | Isocryptotanshinone II | C19H20O3 | 296.3603 | 297 | 279; 197 | 173 | Salviae Miltiorrhizae [102] | ||
| 41 | Alpha-omega dicarboxylic acid | Octadecanedioic acid [1,16-Hexadecanedicarboxylic acid] | C18H34O4 | 314.4602 | 313 | 295; 183 | 293; 179 | 275; 177 | F. glaucescens [53] | |
| 42 | Unsaturated essential fatty acid | Oxo-eicosatetraenoic acid | C20H30O3 | 318.4504 | 319 | 301 | 186 | F. potsii [53] | ||
| 43 | Oxylipin | 13- Trihydroxy-Octadecenoic acid [THODE] | C18H34O5 | 330.4596 | 329 | 171; 211; 293 | 153 | Bituminaria [25]; Broccoli [26]; Sasa veitchii [27] | ||
| 44 | Oxylipin | 9,12,13- Trihydroxy-trans-10-octadecenoic acid | C18H34O5 | 330.4596 | 329 | 171; 229 | 127 | Potato leaves [56] | ||
| 45 | Unsaturated essential fatty acid | Eicosatetraenedioic acid | C20H30O4 | 334.4498 | 335 | 321; 124 | 291 | G. linguiforme [53] | ||
| 46 | Isoquinoline alkaloid | Berberine [Berberin; Umbelletine; Berbericine] | C20H18NO4 | 336.3612 | 337 | 321; 225 | 291 | 291 | Tinospora cordifolia [104,105] | |
| 47 | Pentacyclic diterpenoid | Gibberellic acid | C19H22O6 | 346.3744 | 347 | 345; 259 | 329; 173 | 289 | Triticum aestivum [106] | |
| 48 | Berberine alkaloid | Palmatine [Berbericinine; Burasaine] | C21H22NO4 | 352.4037 | 353 | 337; 163 | 308 | 293 | Ocotea [107,108] | |
| 49 | Androgen; anabolic steroid | Vebonol | C30H44O3 | 452.6686 | 453 | 435; 336; 209 | 336; 226 | 209 | Rhus coriaria [61]; Hylosereus polyrhizus [109] | |
| 50 | Triterpenoid | Oleanoic acid | C30H48O3 | 456.7003 | 457 | 411; 249; 183 | 227; 169 | Pear [110]; Ocimum [82] | ||
| 51 | Triterpenoid | Maslinic acid | C30H48O4 | 472.6997 | 473 | 425; 319; 201 | 291 | Pear [110]; Folium Eriobotryae [111]; Malus domestica [112] | ||
| 52 | Thromboxane receptor antagonist | Vapiprost | C30H39NO4 | 477.6350 | 478 | 460; 337; 263; 155 | 263; 155 | 245; 189; 111 | Rhus coriaria [61]; Hylosereus polyrhizus [109] | |
| 53 | Indole sesquiterpene alkaloid | Sespendole | C33H45NO4 | 519.7147 | 520 | 184 | 184; 125 | Rhus coriaria [61]; Hylosereus polyrhizus [109] | ||
| 54 | 2-arylbenzofuran flavonoid | Lithospermic acid A | C27H22O12 | 538.4564 | 539 | 521; 409; 340; 241 | 395; 252; 167 | Mentha [79,93,94]; Salvia multiorrizae [52] | ||
| 55 | Carotenoid | (all-E)-lutein 3′-O-myristate | C40H54O | 550.8562 | 551 | 533; 505; 469;429; 373; 345 | 453; 410 | Carotenoids [113] | ||
| 56 | Triterpenoid | 3-O-glucuronide-29-hydroxyoleanolic acid | C35H52O11 | 648.7808 | 649 | 473; 367; 291; 229 | 456; 385; 269 | 408; 305; 262; 187 | Bougainvillea [75] | |
References
- Loy, D.; Lundy, E. Nutritional properties and feeding value of corn and its coproducts. In Corn; Elsevier: Amsterdam, The Netherlands, 2019; pp. 633–659. [Google Scholar]
- Salinas-Moreno, Y.; García-Salinas, C.; Ramírez-Díaz, J.L.; Alemán-de la Torre, I. Phenolic compounds in maize grains and its nixtamalized products. In Phenolic Compounds-Natural Sources, Importance and Applications, 1st ed.; Soto-Hernandez, M., Palma-Tenango, M., Garcia-Mateos, M.R., Eds.; InTech: Rijeka, Croatia, 2017; Chapter 8; pp. 215–232. [Google Scholar]
- Adom, K.K.; Liu, R.H. Antioxidant activity of grains. J. Agric. Food Chem. 2002, 50, 6182–6187. [Google Scholar] [CrossRef] [PubMed]
- Pigeolet, E.; Corbisier, P.; Houbion, A.; Lambert, D.; Michiels, C.; Raes, M.; Zachary, M.-D.; Remacle, J. Glutathione peroxidase, superoxide dismutase, and catalase inactivation by peroxides and oxygen derived free radicals. Mech. Ageing Dev. 1990, 51, 283–297. [Google Scholar] [CrossRef]
- Dembinska-Kiec, A.; Mykkänen, O.; Kiec-Wilk, B.; Mykkänen, H. Antioxidant phytochemicals against type 2 diabetes. Br. J. Nutr. 2008, 99, ES109–ES117. [Google Scholar] [CrossRef] [PubMed] [Green Version]
- Heim, K.E.; Tagliaferro, A.R.; Bobilya, D.J. Flavonoid antioxidants: Chemistry, metabolism and structure-activity relationships. J. Nutr. Biochem. 2002, 13, 572–584. [Google Scholar] [CrossRef]
- Nijveldt, R.J.; Van Nood, E.; Van Hoorn, D.E.; Boelens, P.G.; Van Norren, K.; Van Leeuwen, P.A. Flavonoids: A review of probable mechanisms of action and potential applications. Am. J. Clin. Nutr. 2001, 74, 418–425. [Google Scholar] [CrossRef]
- Zheng, Y.-Z.; Deng, G.; Guo, R.; Fu, Z.-M.; Chen, D.-F. The influence of the H5⋯ OC4 intramolecular hydrogen-bond (IHB) on the antioxidative activity of flavonoid. Phytochemistry 2019, 160, 19–24. [Google Scholar] [CrossRef]
- Terao, J. Factors modulating bioavailability of quercetin-related flavonoids and the consequences of their vascular function. Biochem. Pharmacol. 2017, 139, 15–23. [Google Scholar] [CrossRef]
- Győri, Z. Corn: Grain-Quality Characteristics and Management of Quality Requirements. In Cereal Grains; Elsevier: Amsterdam, The Netherlands, 2017; pp. 257–290. [Google Scholar]
- Szwajgier, D. Anticholinesterase activity of selected phenolic acids and flavonoids-interaction testing in model solutions. Ann. Agric. Environ. Med. 2015, 22, 690–694. [Google Scholar] [CrossRef]
- Weber, E.J. Carotenoids and tocols of corn grain determined by HPLC. J. Am. Oil Chem. Soc. 1987, 64, 1129–1134. [Google Scholar] [CrossRef]
- Kljak, K.; Grbeša, D. Carotenoid content and antioxidant activity of hexane extracts from selected Croatian corn hybrids. Food Chem. 2015, 167, 402–408. [Google Scholar] [CrossRef]
- Ndolo, V.U.; Beta, T. Distribution of carotenoids in endosperm, germ, and aleurone fractions of cereal grain kernels. Food Chem. 2013, 139, 663–671. [Google Scholar] [CrossRef] [PubMed]
- Li, Q.; Somavat, P.; Singh, V.; Chatham, L.; de Mejia, E.G. A comparative study of anthocyanin distribution in purple and blue corn coproducts from three conventional fractionation processes. Food Chem. 2017, 231, 332–339. [Google Scholar] [CrossRef] [PubMed]
- Farrés-Cebrián, M.; Seró, R.; Saurina, J.; Núñez, O. HPLC-UV polyphenolic profiles in the classification of olive oils and other vegetable oils via principal component analysis. Separations 2016, 3, 33. [Google Scholar] [CrossRef] [Green Version]
- Gálvez Ranilla, L. The application of metabolomics for the study of cereal corn (Zea mays L.). Metabolites 2020, 10, 300. [Google Scholar] [CrossRef] [PubMed]
- Peniche-Pavía, H.A.; Tiessen, A. Anthocyanin profiling of maize grains using DIESI-MSQD reveals that cyanidin-based derivatives predominate in purple corn, whereas pelargonidin-based molecules occur in red-pink varieties from Mexico. J. Agric. Food Chem. 2020, 68, 5980–5994. [Google Scholar] [CrossRef]
- Cuevas Montilla, E.; Hillebrand, S.; Antezana, A.; Winterhalter, P. Soluble and bound phenolic compounds in different Bolivian purple corn (Zea mays L.) cultivars. J. Agric. Food Chem. 2011, 59, 7068–7074. [Google Scholar] [CrossRef]
- Das, A.K.; Singh, V. Antioxidative free and bound phenolic constituents in botanical fractions of Indian specialty maize (Zea mays L.) genotypes. Food Chem. 2016, 201, 298–306. [Google Scholar] [CrossRef]
- Meijering, E. Cell segmentation: 50 years down the road [life sciences]. IEEE Signal Processing Mag. 2012, 29, 140–145. [Google Scholar] [CrossRef]
- Hutzler, P.; Fischbach, R.; Heller, W.; Jungblut, T.P.; Reuber, S.; Schmitz, R.; Veit, M.; Weissenböck, G.; Schnitzler, J.-P. Tissue localization of phenolic compounds in plants by confocal laser scanning microscopy. J. Exp. Bot. 1998, 49, 953–965. [Google Scholar] [CrossRef]
- Jones, A.M.P.; Shukla, M.R.; Chattopadhyay, A.; Zoń, J.; Saxena, P.K. Investigating the roles of phenylpropanoids in the growth and development of Zea mays L. Vitr. Cell. Dev. Biol. -Plant 2013, 49, 765–772. [Google Scholar] [CrossRef]
- Luna-Vital, D.A.; Chatham, L.; Juvik, J.; Singh, V.; Somavat, P.; De Mejia, E.G. Activating effects of phenolics from Apache Red Zea mays L. on free fatty acid receptor 1 and glucokinase evaluated with a dual culture system with epithelial, pancreatic, and liver cells. J. Agric. Food Chem. 2019, 67, 9148–9159. [Google Scholar] [CrossRef] [PubMed]
- Llorent-Martínez, E.J.; Spínola, V.; Gouveia, S.; Castilho, P.C. HPLC-ESI-MSn characterization of phenolic compounds, terpenoid saponins, and other minor compounds in Bituminaria bituminosa. Ind. Crops Prod. 2015, 69, 80–90. [Google Scholar] [CrossRef]
- Park, S.K.; Ha, J.S.; Kim, J.M.; Kang, J.Y.; Lee, D.S.; Guo, T.J.; Lee, U.; Kim, D.-O.; Heo, H.J. Antiamnesic effect of broccoli (Brassica oleracea var. italica) leaves on amyloid beta (Aβ) 1–42-induced learning and memory impairment. J. Agric. Food Chem. 2016, 64, 3353–3361. [Google Scholar] [CrossRef] [PubMed]
- Van Hoyweghen, L.; De Bosscher, K.; Haegeman, G.; Deforce, D.; Heyerick, A. In vitro inhibition of the transcription factor NF-κB and cyclooxygenase by Bamboo extracts. Phytother. Res. 2014, 28, 224–230. [Google Scholar] [CrossRef]
- Dinelli, G.; Segura-Carretero, A.; Di Silvestro, R.; Marotti, I.; Arráez-Román, D.; Benedettelli, S.; Ghiselli, L.; Fernadez-Gutierrez, A. Profiles of phenolic compounds in modern and old common wheat varieties determined by liquid chromatography coupled with time-of-flight mass spectrometry. J. Chromatogr. A 2011, 1218, 7670–7681. [Google Scholar] [CrossRef]
- Garg, M.; Chawla, M.; Chunduri, V.; Kumar, R.; Sharma, S.; Sharma, N.K.; Kaur, N.; Kumar, A.; Mundey, J.K.; Saini, M.K. Transfer of grain colors to elite wheat cultivars and their characterization. J. Cereal Sci. 2016, 71, 138–144. [Google Scholar] [CrossRef]
- Sun, J.; Liu, X.; Yang, T.; Slovin, J.; Chen, P. Profiling polyphenols of two diploid strawberry (Fragaria vesca) inbred lines using UHPLC-HRMSn. Food Chem. 2014, 146, 289–298. [Google Scholar] [CrossRef] [Green Version]
- Corcel, M.; Devaux, M.-F.; Guillon, F.; Barron, C. Identification of tissular origin of particles based on autofluorescence multispectral image analysis at the macroscopic scale. In Proceedings of the EPJ Web of Conferences, Crete, Greece, 17–29 August 2017; p. 05012. [Google Scholar]
- Lichtenthaler, H.K.; Schweiger, J. Cell wall bound ferulic acid, the major substance of the blue-green fluorescence emission of plants. J. Plant Physiol. 1998, 152, 272–282. [Google Scholar] [CrossRef]
- Rudall, P.; Caddick, L. Investigation of the presence of phenolic compounds in monocotyledonous cell walls, using UV fluorescence microscopy. Ann. Bot. 1994, 74, 483–491. [Google Scholar] [CrossRef]
- Philippe, S.; Tranquet, O.; Utille, J.-P.; Saulnier, L.; Guillon, F. Investigation of ferulate deposition in endosperm cell walls of mature and developing wheat grains by using a polyclonal antibody. Planta 2007, 225, 1287–1299. [Google Scholar] [CrossRef]
- Das, A.K.; Singh, V. Antioxidative free and bound phenolic constituents in pericarp, germ and endosperm of Indian dent (Zea mays var. indentata) and flint (Zea mays var. indurata) maize. J. Funct. Foods 2015, 13, 363–374. [Google Scholar] [CrossRef]
- Antoine, C.; Peyron, S.; Mabille, F.; Lapierre, C.; Bouchet, B.; Abecassis, J.; Rouau, X. Individual contribution of grain outer layers and their cell wall structure to the mechanical properties of wheat bran. J. Agric. Food Chem. 2003, 51, 2026–2033. [Google Scholar] [CrossRef] [PubMed]
- Hernanz, D.; Nuñez, V.; Sancho, A.I.; Faulds, C.B.; Williamson, G.; Bartolomé, B.; Gómez-Cordovés, C. Hydroxycinnamic acids and ferulic acid dehydrodimers in barley and processed barley. J. Agric. Food Chem. 2001, 49, 4884–4888. [Google Scholar] [CrossRef] [PubMed]
- Rhodes, D.; Sadek, M.; Stone, B. Hydroxycinnamic acids in walls of wheat aleurone cells. J. Cereal Sci. 2002, 36, 67–81. [Google Scholar] [CrossRef]
- Vanholme, R.; De Meester, B.; Ralph, J.; Boerjan, W. Lignin biosynthesis and its integration into metabolism. Curr. Opin. Biotechnol. 2019, 56, 230–239. [Google Scholar] [CrossRef]
- Talamond, P.; Verdeil, J.-L.; Conéjéro, G. Secondary metabolite localization by autofluorescence in living plant cells. Molecules 2015, 20, 5024–5037. [Google Scholar] [CrossRef] [Green Version]
- Tian, S.; Sun, Y.; Chen, Z.; Yang, Y.; Wang, Y. Functional properties of polyphenols in grains and effects of physicochemical processing on polyphenols. J. Food Qual. 2019, 2019, 2793973. [Google Scholar] [CrossRef]
- Fulcher, R.; O’Brien, T.; Lee, J. Conventional and fluorescence microcopy of the cell wall with emphasis on phenol-carbohydrate complexes in wheat. Aust. J. Biol. Sci. 1972, 25, 23–34. [Google Scholar] [CrossRef]
- Holopainen, U.R.; Wilhelmson, A.; Salmenkallio-Marttila, M.; Peltonen-Sainio, P.; Rajala, A.; Reinikainen, P.; Kotaviita, E.; Simolin, H.; Home, S. Endosperm structure affects the malting quality of barley (Hordeum vulgare L.). J. Agric. Food Chem. 2005, 53, 7279–7287. [Google Scholar] [CrossRef]
- Jääskeläinen, A.-S.; Holopainen-Mantila, U.; Tamminen, T.; Vuorinen, T. Endosperm and aleurone cell structure in barley and wheat as studied by optical and Raman microscopy. J. Cereal Sci. 2013, 57, 543–550. [Google Scholar] [CrossRef]
- Saadi, A.; Lempereur, I.; Sharonov, S.; Autran, J.; Manfait, M. Spatial distribution of phenolic materials in durum wheat grain as probed by confocal fluorescence spectral imaging. J. Cereal Sci. 1998, 28, 107–114. [Google Scholar] [CrossRef]
- Piot, O.; Autran, J.-C.; Manfait, M. Spatial distribution of protein and phenolic constituents in wheat grain as probed by confocal Raman microspectroscopy. J. Cereal Sci. 2000, 32, 57–71. [Google Scholar] [CrossRef]
- Azmir, J.; Zaidul, I.S.M.; Rahman, M.M.; Sharif, K.; Mohamed, A.; Sahena, F.; Jahurul, M.; Ghafoor, K.; Norulaini, N.; Omar, A. Techniques for extraction of bioactive compounds from plant materials: A review. J. Food Eng. 2013, 117, 426–436. [Google Scholar] [CrossRef]
- Zhang, A.; Wan, L.; Wu, C.; Fang, Y.; Han, G.; Li, H.; Zhang, Z.; Wang, H. Simultaneous determination of 14 phenolic compounds in grape canes by HPLC-DAD-UV using wavelength switching detection. Molecules 2013, 18, 14241–14257. [Google Scholar] [CrossRef] [Green Version]
- Olennikov, D.N.; Chirikova, N.K.; Okhlopkova, Z.M.; Zulfugarov, I.S. Chemical composition and antioxidant activity of Tánara Ótó (Dracocephalum palmatum Stephan), a medicinal plant used by the North-Yakutian nomads. Molecules 2013, 18, 14105–14121. [Google Scholar] [CrossRef] [Green Version]
- Santos, S.n.A.; Freire, C.S.; Domingues, M.R.M.; Silvestre, A.J.; Neto, C.P. Characterization of phenolic components in polar extracts of Eucalyptus globulus Labill. bark by high-performance liquid chromatography–mass spectrometry. J. Agric. Food Chem. 2011, 59, 9386–9393. [Google Scholar] [CrossRef]
- Sharma, M.; Sandhir, R.; Singh, A.; Kumar, P.; Mishra, A.; Jachak, S.; Singh, S.P.; Singh, J.; Roy, J. Comparative analysis of phenolic compound characterization and their biosynthesis genes between two diverse bread wheat (Triticum aestivum) varieties differing for chapatti (unleavened flat bread) quality. Front. Plant Sci. 2016, 7, 1870. [Google Scholar] [CrossRef] [Green Version]
- Jiang, R.-W.; Lau, K.-M.; Hon, P.-M.; Mak, T.C.; Woo, K.-S.; Fung, K.-P. Chemistry and biological activities of caffeic acid derivatives from Salvia miltiorrhiza. Curr. Med. Chem. 2005, 12, 237–246. [Google Scholar] [CrossRef]
- Hamed, A.R.; El-Hawary, S.S.; Ibrahim, R.M.; Abdelmohsen, U.R.; El-Halawany, A.M. Identification of Chemopreventive Components from Halophytes Belonging to Aizoaceae and Cactaceae Through LC/MS—Bioassay Guided Approach. J. Chromatogr. Sci. 2021, 59, 618–626. [Google Scholar] [CrossRef]
- Aita, S.E.; Capriotti, A.L.; Cavaliere, C.; Cerrato, A.; Giannelli Moneta, B.; Montone, C.M.; Piovesana, S.; Laganà, A. Andean Blueberry of the Genus Disterigma: A High-Resolution Mass Spectrometric Approach for the Comprehensive Characterization of Phenolic Compounds. Separations 2021, 8, 58. [Google Scholar] [CrossRef]
- Zhu, Z.-W.; Li, J.; Gao, X.-M.; Amponsem, E.; Kang, L.-Y.; Hu, L.-M.; Zhang, B.-L.; Chang, Y.-X. Simultaneous determination of stilbenes, phenolic acids, flavonoids and anthraquinones in Radix polygoni multiflori by LC–MS/MS. J. Pharm. Biomed. Anal. 2012, 62, 162–166. [Google Scholar] [CrossRef]
- Rodríguez-Pérez, C.; Gómez-Caravaca, A.M.; Guerra-Hernández, E.; Cerretani, L.; García-Villanova, B.; Verardo, V. Comprehensive metabolite profiling of Solanum tuberosum L.(potato) leaves by HPLC-ESI-QTOF-MS. Food Res. Int. 2018, 112, 390–399. [Google Scholar] [CrossRef] [PubMed]
- Stallmann, J.; Schweiger, R.; Pons, C.A.; Müller, C. Wheat growth, applied water use efficiency and flag leaf metabolome under continuous and pulsed deficit irrigation. Sci. Rep. 2020, 10, 1–13. [Google Scholar] [CrossRef] [PubMed]
- Fuentes, J.A.M.; López-Salas, L.; Borrás-Linares, I.; Navarro-Alarcón, M.; Segura-Carretero, A.; Lozano-Sánchez, J. Development of an innovative pressurized liquid extraction procedure by response surface methodology to recover bioactive compounds from carao Tree Seeds. Foods 2021, 10, 398. [Google Scholar] [CrossRef]
- Sobeh, M.; Mahmoud, M.F.; Abdelfattah, M.A.; Cheng, H.; El-Shazly, A.M.; Wink, M. A proanthocyanidin-rich extract from Cassia abbreviata exhibits antioxidant and hepatoprotective activities in vivo. J. Ethnopharmacol. 2018, 213, 38–47. [Google Scholar] [CrossRef] [PubMed]
- Thomford, N.E.; Dzobo, K.; Chopera, D.; Wonkam, A.; Maroyi, A.; Blackhurst, D.; Dandara, C. In vitro reversible and time-dependent CYP450 inhibition profiles of medicinal herbal plant extracts Newbouldia laevis and Cassia abbreviata: Implications for herb-drug interactions. Molecules 2016, 21, 891. [Google Scholar] [CrossRef] [PubMed] [Green Version]
- Abu-Reidah, I.M.; Ali-Shtayeh, M.S.; Jamous, R.M.; Arráez-Román, D.; Segura-Carretero, A. HPLC–DAD–ESI-MS/MS screening of bioactive components from Rhus coriaria L.(Sumac) fruits. Food Chem. 2015, 166, 179–191. [Google Scholar] [CrossRef] [PubMed] [Green Version]
- Cai, Z.; Wang, C.; Zou, L.; Liu, X.; Chen, J.; Tan, M.; Mei, Y.; Wei, L. Comparison of multiple bioactive constituents in the flower and the caulis of Lonicera japonica based on UFLC-QTRAP-MS/MS combined with multivariate statistical analysis. Molecules 2019, 24, 1936. [Google Scholar] [CrossRef] [PubMed] [Green Version]
- Oertel, A.; Matros, A.; Hartmann, A.; Arapitsas, P.; Dehmer, K.J.; Martens, S.; Mock, H.-P. Metabolite profiling of red and blue potatoes revealed cultivar and tissue specific patterns for anthocyanins and other polyphenols. Planta 2017, 246, 281–297. [Google Scholar] [CrossRef]
- Deußer, H.; Guignard, C.; Hoffmann, L.; Evers, D. Polyphenol and glycoalkaloid contents in potato cultivars grown in Luxembourg. Food Chem. 2012, 135, 2814–2824. [Google Scholar] [CrossRef]
- Chandrasekara, A.; Shahidi, F. Determination of antioxidant activity in free and hydrolyzed fractions of millet grains and characterization of their phenolic profiles by HPLC-DAD-ESI-MSn. J. Funct. Foods 2011, 3, 144–158. [Google Scholar] [CrossRef]
- Yasir, M.; Sultana, B.; Anwar, F. LC–ESI–MS/MS based characterization of phenolic components in fruits of two species of Solanaceae. J. Food Sci. Technol. 2018, 55, 2370–2376. [Google Scholar] [CrossRef] [PubMed]
- Quifer-Rada, P.; Vallverdú-Queralt, A.; Martínez-Huélamo, M.; Chiva-Blanch, G.; Jáuregui, O.; Estruch, R.; Lamuela-Raventós, R. A comprehensive characterisation of beer polyphenols by high resolution mass spectrometry (LC–ESI-LTQ-Orbitrap-MS). Food Chem. 2015, 169, 336–343. [Google Scholar] [CrossRef]
- Ojwang, L.O.; Yang, L.; Dykes, L.; Awika, J. Proanthocyanidin profile of cowpea (Vigna unguiculata) reveals catechin-O-glucoside as the dominant compound. Food Chem. 2013, 139, 35–43. [Google Scholar] [CrossRef]
- Sobeh, M.; Mahmoud, M.F.; Hasan, R.A.; Cheng, H.; El-Shazly, A.M.; Wink, M. Senna singueana: Antioxidant, hepatoprotective, antiapoptotic properties and phytochemical profiling of a methanol bark extract. Molecules 2017, 22, 1502. [Google Scholar] [CrossRef]
- Qin, D.; Wang, Q.; Li, H.; Jiang, X.; Fang, K.; Wang, Q.; Li, B.; Pan, C.; Wu, H. Identification of key metabolites based on non-targeted metabolomics and chemometrics analyses provides insights into bitterness in Kucha [Camellia kucha (Chang et Wang) Chang]. Food Res. Int. 2020, 138, 109789. [Google Scholar] [CrossRef] [PubMed]
- Spínola, V.; Pinto, J.; Castilho, P.C. Identification and quantification of phenolic compounds of selected fruits from Madeira Island by HPLC-DAD–ESI-MSn and screening for their antioxidant activity. Food Chem. 2015, 173, 14–30. [Google Scholar] [CrossRef]
- Chang, Q.; Wong, Y.-S. Identification of flavonoids in Hakmeitau beans (Vigna sinensis) by high-performance liquid chromatography− electrospray mass spectrometry (LC-ESI/MS). J. Agric. Food Chem. 2004, 52, 6694–6699. [Google Scholar] [CrossRef]
- Vieira, M.N.; Winterhalter, P.; Jerz, G. Flavonoids from the flowers of Impatiens glandulifera Royle isolated by high performance countercurrent chromatography. Phytochem. Anal. 2016, 27, 116–125. [Google Scholar] [CrossRef]
- Vallverdú-Queralt, A.; Jáuregui, O.; Medina-Remón, A.; Lamuela-Raventós, R.M. Evaluation of a method to characterize the phenolic profile of organic and conventional tomatoes. J. Agric. Food Chem. 2012, 60, 3373–3380. [Google Scholar] [CrossRef]
- El-sayed, M.; Abbas, F.A.; Refaat, S.; El-Shafae, A.M.; Fikry, E. UPLC-ESI-MS/MS Profile of The Ethyl Acetate Fraction of Aerial Parts of Bougainvillea’Scarlett O’Hara’Cultivated in Egypt. Egypt. J. Chem. 2021, 64, 6–7. [Google Scholar]
- De Freitas, M.A.; Silva Alves, A.I.; Andrade, J.C.; Leite-Andrade, M.C.; Lucas dos Santos, A.T.; Felix de Oliveira, T.; dos Santos, F.d.A.G.; Silva Buonafina, M.D.; Melo Coutinho, H.D.; Alencar de Menezes, I.R. Evaluation of the antifungal activity of the Licania rigida leaf ethanolic extract against biofilms formed by Candida sp. isolates in acrylic resin discs. Antibiotics 2019, 8, 250. [Google Scholar] [CrossRef] [PubMed] [Green Version]
- Bujor, O.-C. Extraction, Identification and Antioxidant Activity of the Phenolic Secondary Metabolites Isolated from the Leaves, Stems and Fruits of Two Shrubs of the Ericaceae Family; Université d’Avignon: Avignon, France, 2016. [Google Scholar]
- Zhou, X.-J.; Yan, L.-L.; Yin, P.-P.; Shi, L.-L.; Zhang, J.-H.; Liu, Y.-J.; Ma, C. Structural characterisation and antioxidant activity evaluation of phenolic compounds from cold-pressed Perilla frutescens var. arguta seed flour. Food Chem. 2014, 164, 150–157. [Google Scholar] [CrossRef] [PubMed]
- Chen, X.; Zhang, S.; Xuan, Z.; Ge, D.; Chen, X.; Zhang, J.; Wang, Q.; Wu, Y.; Liu, B. The phenolic fraction of Mentha Haplocalyx and its constituent linarin ameliorate inflammatory response through inactivation of NF-κB and MAPKs in lipopolysaccharide-induced RAW264. 7 cells. Molecules 2017, 22, 811. [Google Scholar] [CrossRef] [PubMed] [Green Version]
- Paudel, L.; Wyzgoski, F.J.; Scheerens, J.C.; Chanon, A.M.; Reese, R.N.; Smiljanic, D.; Wesdemiotis, C.; Blakeslee, J.J.; Riedl, K.M.; Rinaldi, P.L. Nonanthocyanin secondary metabolites of black raspberry (Rubus occidentalis L.) fruits: Identification by HPLC-DAD, NMR, HPLC-ESI-MS, and ESI-MS/MS analyses. J. Agric. Food Chem. 2013, 61, 12032–12043. [Google Scholar] [CrossRef]
- Kim, S.; Oh, S.; Noh, H.B.; Ji, S.; Lee, S.H.; Koo, J.M.; Choi, C.W.; Jhun, H.P. In vitro antioxidant and anti-propionibacterium acnes activities of cold water, hot water, and methanol extracts, and their respective ethyl acetate fractions, from Sanguisorba officinalis L. Roots. Molecules 2018, 23, 3001. [Google Scholar] [CrossRef] [Green Version]
- Pandey, R.; Kumar, B. HPLC–QTOF–MS/MS-based rapid screening of phenolics and triterpenic acids in leaf extracts of Ocimum species and their interspecies variation. J. Liq. Chromatogr. Relat. Technol. 2016, 39, 225–238. [Google Scholar] [CrossRef]
- Prasad Pandey, B.; Prakash Pradhan, S.; Adhikari, K. LC-ESI-QTOF-MS for the Profiling of the Metabolites and in Vitro Enzymes Inhibition Activity of Bryophyllum pinnatum and Oxalis corniculata Collected from Ramechhap District of Nepal. Chem. Biodivers. 2020, 17, e2000155. [Google Scholar] [CrossRef]
- Enerstvedt, K.H.; Jordheim, M.; Andersen, Ø.M. Isolation and identification of flavonoids found in Zostera marina collected in Norwegian coastal waters. Am. J. Plant Sci. 2016, 7, 1163–1172. [Google Scholar] [CrossRef] [Green Version]
- Teles, Y.C.; Horta, C.C.R.; Agra, M.D.F.; Siheri, W.; Boyd, M.; Igoli, J.O.; Gray, A.I.; De Souza, M.D.F.V. New sulphated flavonoids from Wissadula periplocifolia (L.) C. Presl (Malvaceae). Molecules 2015, 20, 20161–20172. [Google Scholar] [CrossRef] [Green Version]
- Bonzanini, F.; Bruni, R.; Palla, G.; Serlataite, N.; Caligiani, A. Identification and distribution of lignans in Punica granatum L. fruit endocarp, pulp, seeds, wood knots and commercial juices by GC–MS. Food Chem. 2009, 117, 745–749. [Google Scholar] [CrossRef]
- Čukelj, N.; Jakasa, I.; Sarajlija, H.; Novotni, D.; Ćurić, D. Identification and quantification of lignans in wheat bran by gas chromatography-electron capture detection. Talanta 2011, 84, 127–132. [Google Scholar] [CrossRef] [PubMed]
- Eklund, P.C.; Backman, M.J.; Kronberg, L.Å.; Smeds, A.I.; Sjöholm, R.E. Identification of lignans by liquid chromatography-electrospray ionization ion-trap mass spectrometry. J. Mass Spectrom. 2008, 43, 97–107. [Google Scholar] [CrossRef]
- Cavaliere, C.; Foglia, P.; Pastorini, E.; Samperi, R.; Laganà, A. Identification and mass spectrometric characterization of glycosylated flavonoids in Triticum durum plants by high-performance liquid chromatography with tandem mass spectrometry. Rapid Commun. Mass Spectrom. Int. J. Devoted Rapid Dissem. Minute Res. Mass Spectrom. 2005, 19, 3143–3158. [Google Scholar] [CrossRef] [PubMed]
- De Rosso, V.V.; Hillebrand, S.; Montilla, E.C.; Bobbio, F.O.; Winterhalter, P.; Mercadante, A.Z. Determination of anthocyanins from acerola (Malpighia emarginata DC.) and açai (Euterpe oleracea Mart.) by HPLC–PDA–MS/MS. J. Food Compos. Anal. 2008, 21, 291–299. [Google Scholar] [CrossRef]
- Chen, W.; Gong, L.; Guo, Z.; Wang, W.; Zhang, H.; Liu, X.; Yu, S.; Xiong, L.; Luo, J. A novel integrated method for large-scale detection, identification, and quantification of widely targeted metabolites: Application in the study of rice metabolomics. Mol. Plant 2013, 6, 1769–1780. [Google Scholar] [CrossRef] [Green Version]
- Yin, N.-W.; Wang, S.-X.; Jia, L.-D.; Zhu, M.-C.; Yang, J.; Zhou, B.-J.; Yin, J.-M.; Lu, K.; Wang, R.; Li, J.-N. Identification and characterization of major constituents in different-colored rapeseed petals by UPLC–HESI-MS/MS. J. Agric. Food Chem. 2019, 67, 11053–11065. [Google Scholar] [CrossRef]
- Xu, L.-L.; Xu, J.-J.; Zhong, K.-R.; Shang, Z.-P.; Wang, F.; Wang, R.-F.; Zhang, L.; Zhang, J.-Y.; Liu, B. Analysis of non-volatile chemical constituents of Menthae Haplocalycis herba by ultra-high performance liquid chromatography-high resolution mass spectrometry. Molecules 2017, 22, 1756. [Google Scholar] [CrossRef] [Green Version]
- Bodalska, A.; Kowalczyk, A.; Włodarczyk, M.; Fecka, I. Analysis of Polyphenolic Composition of a Herbal Medicinal Product—Peppermint Tincture. Molecules 2020, 25, 69. [Google Scholar] [CrossRef] [Green Version]
- Shi, F.; Pan, H.; Lu, Y.; Ding, L. An HPLC–MS/MS method for the simultaneous determination of luteolin and its major metabolites in rat plasma and its application to a pharmacokinetic study. J. Sep. Sci. 2018, 41, 3830–3839. [Google Scholar] [CrossRef]
- Geng, P.; Sun, J.; Zhang, M.; Li, X.; Harnly, J.M.; Chen, P. Comprehensive characterization of C-glycosyl flavones in wheat (Triticum aestivum L.) germ using UPLC-PDA-ESI/HRMSn and mass defect filtering. J. Mass Spectrom. 2016, 51, 914–930. [Google Scholar] [CrossRef] [PubMed] [Green Version]
- Wojakowska, A.; Perkowski, J.; Góral, T.; Stobiecki, M. Structural characterization of flavonoid glycosides from leaves of wheat (Triticum aestivum L.) using LC/MS/MS profiling of the target compounds. J. Mass Spectrom. 2013, 48, 329–339. [Google Scholar] [CrossRef] [PubMed]
- Mateos-Martín, M.L.; Fuguet, E.; Jiménez-Ardón, A.; Herrero-Uribe, L.; Tamayo-Castillo, G.; Torres, J.L. Identification of polyphenols from antiviral Chamaecrista nictitans extract using high-resolution LC–ESI–MS/MS. Anal. Bioanal. Chem. 2014, 406, 5501–5506. [Google Scholar] [CrossRef] [PubMed]
- Ozarowski, M.; Piasecka, A.; Paszel-Jaworska, A.; Chaves, D.S.d.A.; Romaniuk, A.; Rybczynska, M.; Gryszczynska, A.; Sawikowska, A.; Kachlicki, P.; Mikolajczak, P.L. Comparison of bioactive compounds content in leaf extracts of Passiflora incarnata, P. caerulea and P. alata and in vitro cytotoxic potential on leukemia cell lines. Rev. Bras. Farmacogn. 2018, 28, 179–191. [Google Scholar] [CrossRef]
- Perchuk, I.; Shelenga, T.; Gurkina, M.; Miroshnichenko, E.; Burlyaeva, M. Composition of Primary and Secondary Metabolite Compounds in Seeds and Pods of Asparagus Bean (Vigna unguiculata (L.) Walp.) from China. Molecules 2020, 25, 3778. [Google Scholar] [CrossRef]
- Rogachev, A.; Fomenko, V.; Sal’nikova, O.; Pokrovskii, L.; Salakhutdinov, N. Comparative analysis of essential oil compositions from leaves and stems of Rhododendron adamsii, R. aureum, and R. dauricum. Chem. Nat. Compd. 2006, 42, 426–430. [Google Scholar] [CrossRef]
- Yang, S.; Wu, X.; Rui, W.; Guo, J.; Feng, Y. UPLC/Q-TOF-MS analysis for identification of hydrophilic phenolics and lipophilic diterpenoids from Radix Salviae Miltiorrhizae. Acta Chromatogr. 2015, 27, 711–728. [Google Scholar] [CrossRef] [Green Version]
- Ekeberg, D.; Flæte, P.-O.; Eikenes, M.; Fongen, M.; Naess-Andresen, C.F. Qualitative and quantitative determination of extractives in heartwood of Scots pine (Pinus sylvestris L.) by gas chromatography. J. Chromatogr. A 2006, 1109, 267–272. [Google Scholar] [CrossRef]
- Mittal, J.; Sharma, M.M. Enhanced production of berberine in In vitro regenerated cell of Tinospora cordifolia and its analysis through LCMS QToF. 3 Biotech 2017, 7, 25. [Google Scholar] [CrossRef] [Green Version]
- Yan, X.; Zhao, Y.; Zhang, Y.; Qu, H. Monoclonal antibodies and immunoassay for medical plant-derived natural products: A review. Molecules 2017, 22, 355. [Google Scholar] [CrossRef] [Green Version]
- Hou, S.; Zhu, J.; Ding, M.; Lv, G. Simultaneous determination of gibberellic acid, indole-3-acetic acid and abscisic acid in wheat extracts by solid-phase extraction and liquid chromatography–electrospray tandem mass spectrometry. Talanta 2008, 76, 798–802. [Google Scholar] [CrossRef] [PubMed]
- Cassiano, D.S.A.; Reis, I.M.A.; de Oliveira Estrela, I.; de Freitas, H.F.; da Rocha Pita, S.S.; David, J.M.; Branco, A. Acetylcholinesterase inhibitory activities and bioguided fractionation of the Ocotea percoriacea extracts: HPLC-DAD-MS/MS characterization and molecular modeling of their alkaloids in the active fraction. Comput. Biol. Chem. 2019, 83, 107129. [Google Scholar] [CrossRef] [PubMed]
- Yang, L.; Meng, X.; Yu, X.; Kuang, H. Simultaneous determination of anemoside B4, phellodendrine, berberine, palmatine, obakunone, esculin, esculetin in rat plasma by UPLC–ESI–MS/MS and its application to a comparative pharmacokinetic study in normal and ulcerative colitis rats. J. Pharm. Biomed. Anal. 2017, 134, 43–52. [Google Scholar] [CrossRef] [PubMed]
- Wu, Y.; Xu, J.; He, Y.; Shi, M.; Han, X.; Li, W.; Zhang, X.; Wen, X. Metabolic profiling of pitaya (Hylocereus polyrhizus) during fruit development and maturation. Molecules 2019, 24, 1114. [Google Scholar] [CrossRef] [PubMed] [Green Version]
- Sun, L.; Tao, S.; Zhang, S. Characterization and quantification of polyphenols and triterpenoids in thinned young fruits of ten pear varieties by UPLC-Q TRAP-MS/MS. Molecules 2019, 24, 159. [Google Scholar] [CrossRef] [Green Version]
- Li, Z.H.; Zhu, H.; Cai, X.P.; He, D.D.; Hua, J.L.; Ju, J.M.; Lv, H.; Ma, L.; Li, W.L. Simultaneous determination of five triterpene acids in rat plasma by liquid chromatography–mass spectrometry and its application in pharmacokinetic study after oral administration of Folium Eriobotryae effective fraction. Biomed. Chromatogr. 2015, 29, 1791–1797. [Google Scholar] [CrossRef]
- Sut, S.; Zengin, G.; Maggi, F.; Malagoli, M.; Dall’Acqua, S. Triterpene acid and phenolics from ancient apples of Friuli Venezia Giulia as nutraceutical ingredients: LC-MS study and in vitro activities. Molecules 2019, 24, 1109. [Google Scholar] [CrossRef] [Green Version]
- Mercadante, A.Z.; Rodrigues, D.B.; Petry, F.C.; Mariutti, L.R.B. Carotenoid esters in foods-A review and practical directions on analysis and occurrence. Food Res. Int. 2017, 99, 830–850. [Google Scholar] [CrossRef]


Publisher’s Note: MDPI stays neutral with regard to jurisdictional claims in published maps and institutional affiliations. |
© 2022 by the authors. Licensee MDPI, Basel, Switzerland. This article is an open access article distributed under the terms and conditions of the Creative Commons Attribution (CC BY) license (https://creativecommons.org/licenses/by/4.0/).
Share and Cite
Razgonova, M.; Zinchenko, Y.; Pikula, K.; Tekutyeva, L.; Son, O.; Zakharenko, A.; Kalenik, T.; Golokhvast, K. Spatial Distribution of Polyphenolic Compounds in Corn Grains (Zea mays L. var. Pioneer) Studied by Laser Confocal Microscopy and High-Resolution Mass Spectrometry. Plants 2022, 11, 630. https://doi.org/10.3390/plants11050630
Razgonova M, Zinchenko Y, Pikula K, Tekutyeva L, Son O, Zakharenko A, Kalenik T, Golokhvast K. Spatial Distribution of Polyphenolic Compounds in Corn Grains (Zea mays L. var. Pioneer) Studied by Laser Confocal Microscopy and High-Resolution Mass Spectrometry. Plants. 2022; 11(5):630. https://doi.org/10.3390/plants11050630
Chicago/Turabian StyleRazgonova, Mayya, Yulia Zinchenko, Konstantin Pikula, Lyudmila Tekutyeva, Oksana Son, Alexander Zakharenko, Tatiana Kalenik, and Kirill Golokhvast. 2022. "Spatial Distribution of Polyphenolic Compounds in Corn Grains (Zea mays L. var. Pioneer) Studied by Laser Confocal Microscopy and High-Resolution Mass Spectrometry" Plants 11, no. 5: 630. https://doi.org/10.3390/plants11050630
APA StyleRazgonova, M., Zinchenko, Y., Pikula, K., Tekutyeva, L., Son, O., Zakharenko, A., Kalenik, T., & Golokhvast, K. (2022). Spatial Distribution of Polyphenolic Compounds in Corn Grains (Zea mays L. var. Pioneer) Studied by Laser Confocal Microscopy and High-Resolution Mass Spectrometry. Plants, 11(5), 630. https://doi.org/10.3390/plants11050630