Article

Evaluation of Genetic Diversity Based on Microsatellites and Phytochemical Markers of Core Collection of Cymbopogon winterianus Jowitt Germplasm

1
CSIR-North East Institute of Science and Technology, Jorhat 785006, Assam, India
2
AcSIR-Academy of Scientific and Innovative Research, Ghaziabad 201002, Uttar Pradesh, India
*
Author to whom correspondence should be addressed.
Plants 2022, 11(4), 528; https://doi.org/10.3390/plants11040528
Submission received: 30 November 2021 / Revised: 24 December 2021 / Accepted: 8 January 2022 / Published: 16 February 2022
(This article belongs to the Special Issue Plant Genetic Resources and Breeding of Clonally Propagated Crops)

Abstract

:
Cymbopogon winterianus Jowitt is an industrially important crop due to its value in the aromatic, perfumery and pharmaceutical industries. In this study, 72 accessions of C. winterianus were selected for molecular diversity analysis using SSR markers. It revealed a total of 65 polymorphic alleles showing an average of 68.10% polymorphism. The best SSR primer with competency in discriminating the germplasm was 3CM0506 with PIC (0.69), MI (0.69) and Rp (3.12). Genetic variation was studied between Assam, Manipur, Meghalaya and Arunachal Pradesh populations. A dendrogram based on the Neighbour-Joining Method showed clustering of germplasm on the collection site. A total of six relevant genetic populations were identified through a structure harvester software analysis. Moreover, a dendrogram based on similarity, complete linkage and Euclidean distance was also elucidated differentiating the genotypes with respect to the major phytochemical constituents of the essential oil. GC-FID and GC-MS analyses of the essential oil of the 72 germplasms revealed citronellal content from 2.58–51.45%, citronellol from 0.00–26.39% and geraniol from 0.00–41.15%. This is the first molecular diversity report with 72 accessions of C. winterianus collected from the NE region using 28 SSR primers as well as their diversity based on phytochemical markers. This diversity computation will help with acquisition of the knowledge and relationship among each individual accession leading to the development of improved and essential oil component-rich cultivars.

1. Introduction

Genetic diversity analysis is a major step for developing plant breeding programmes [1]. A better understanding of the genetic relationship amongst plant species’ germplasms, both cultivated and wild, is necessary to formulate strategies for the breeding, conservation and utilization of the genetic resources [2] of a crop’s wild relatives, especially those with a primary gene pool [3].
One genus containing profound genetic diversity is the Cymbopogon species, belonging to the Poaceae family, which contains approximately 140 species of heterogeneous plants due to its cross-pollinative nature [1,4,5]. These species are generally distributed in tropical and subtropical regions of the world with an availability of 45 species grown in India [1,6,7]. These species are characterised by an aromatic essential oil, bearing many bioactive compounds that have a high pharmaceutical importance and economic value [8].
One of the important species of this genus, Cymbopogon winterianus Jowitt, popularly known as Java citronella, is a perennial grass that propagates by vegetative means [7,9,10]. The crop is cultivated for the extraction of essential oil, which has aromatic and medicinal properties [8]. The leaf essential oil has vast use in the perfumery, cosmetics and flavouring industries [10,11]. Due to the presence of this fragrance, the leaf essential oil is used in the food industry [12]. The Java citronella essential oil is used as an antiseptic, antispasmodic and diuretic drug [13] and possesses analgesic and anticonvulsant activities [14]. Moreover, the anti-microbial activity of C. winterianus has been reported against different pathogenic bacteria and fungi [13,14,15]. It has also been used over the ages in Brazilian and Indian folk medicines [16].
The Cymbopogon winterianus leaf essential oil is marked by the presence of citronellal, citronellol and geraniol as the major compounds [10,15,17]. These constituents can alternatively be used as phytochemical markers for the identification of the species. Phytochemical variation in the essential oil of this species has been observed due to the genetic makeup of the genotype, as well as due to environmental factors [18], which was also reported in other wild species where different chemotypes were observed depending on multiple environmental factors (e.g., vegetation type, topographical parameters, climatic conditions and pedological features) [19]. Various previous studies have reported that the C. winterianus essential oil, rich in these compounds, was responsible for the bioactivity [20]. Citronellol is a monoterpene alcohol that has antimicrobial, anticonvulsant, anticancer, anti-inflammatory and analgesic properties [21]. Moreover, citronellol has been used in the fragrance industry, in perfumery, as an insect repellent and mite attractant [21,22]. Citronellal is an aldehyde, which gives C. winterianus its characteristic lemon-like fragrance. It has an effective mosquito repellent activity, and thus is used as the active constituent of different mosquito repellent products [23]. It has been used in the pharmaceutical industry due to its anti-microbial, antinociceptive, anti-inflammatory and anticancer activities [24]. Another constituent of the C. winterianus essential oil is geraniol, which is an aromatic compound with a rose-like fragrance [25]. Geraniol is effective at preventing certain types of cancer, and possesses antimicrobial, anti-inflammatory, antiseptic and insect repellent activities [26,27]. It is also used mainly in the fragrance industry as well as the cosmetic industry [28]. Both citronellal and geraniol are the starting material for the synthesis of many aromatic compounds [29,30].
Over the course of years, Java citronella has been introduced to different geographical locations and climatic conditions, which has led to further genetic differentiation amongst the germplasms through human selection, as well as domestication [31]. A wide variation in terms of essential oil, as well as morphological characters, has been observed in these species, but these are greatly affected by environmental fluctuations and the growth stage [4,32]. Moreover, genetic diversity in the crops is also reduced due to changing agricultural practices, deforestation, overgrazing, and urbanization. In addition to this, conservation and management of the crops is a slow and costly process because of several developmental stages in the crop and the environmental conditions affecting its growth. Molecular markers have helped with combating this problem by elucidating information related to the diversity, which is useful for planning different conservative measures. A rich source of genetic diversity is a prerequisite for introducing novel traits into the crop [9,33]. Therefore, an analysis of genetic divergence through molecular markers has an edge over the morphological characters because they are not affected by external factors [34]. For an assessment of the genetic variations within the germplasm, DNA-based molecular markers like RAPD, ISSR, and SSR markers are widely used. Many studies were reported on the genetic diversity of Cymbopogon winterianus using RAPD and ISSR molecular markers [4,31,35], but the number of germplasms used in these studies was very limited. Additionally, one of the drawbacks of RAPD marker is its low reproducibility [36]. Currently, SSR markers are considered useful because they are highly sensitive to genomic polymorphism [1], and they are robust and inexpensive [37]. Phylogenetic assessment and genetic diversity were successfully studied in many crops using microsatellites (SSR) [38,39,40]. Microsatellites are co-dominant markers; they are locus specific and have the capacity to detect a high level of polymorphism in the genome [41,42]. Kumar et al. (2009) studied the genetic diversity of the Cymbopogon species using SSR markers because of their ability to differentiate between the species precisely [32]. This will help in the development of future strategies for the improvement and commercial cultivation of this industrially important plant species. The genome mapping of complex traits and the selection of suitable genes for breeding can also be studied with this molecular tool [43,44]. Reports on the genetic divergence of different Cymbopogon taxa were performed [36], but very scanty information is available on the C. winterianus germplasm.
Hence, the present study aimed to estimate the level of divergence existing among and within the population of this species using SSR marker. The study of diversity based on phytochemical and molecular markers together is regarded as an appropriate measure to conserve and screen the elite genotypes for improvement of the crop and increase the gene pool [45,46,47,48]. This would also help in the identification and crossing of parents with desirable traits, subdivided into clusters, for the development of a superior germplasm with more yield-related traits. Segregating populations would also aid an increase in the recombinant combination in the gene pool. To the best of our knowledge, this is the first report on the phytochemical, as well as molecular, diversity of 72 accessions of C. winterianus.

2. Results and Discussions

All 72 accessions were submitted to ICAR-National Bureau of Plant Genetic Resources (NBPGR), New Delhi, to obtain the Indigenous collection number from IC-0626991 to IC-0627065 represented in Table 1.
This helps in the conservation of genetic resources; utilization of the germplasm for screening of elite genotypes; for the development of superior genotypes by crossing or genetic modification of the genes responsible for economic yield; and for the transformation of genotypes with disease resistant, stress and pest tolerance traits. It is the most effective way of conserving all genes present in the germplasm for a long duration and can be regenerated whenever required. This can serve as a resource house for essential and newly identified genes, thereby creating a genetic information library.

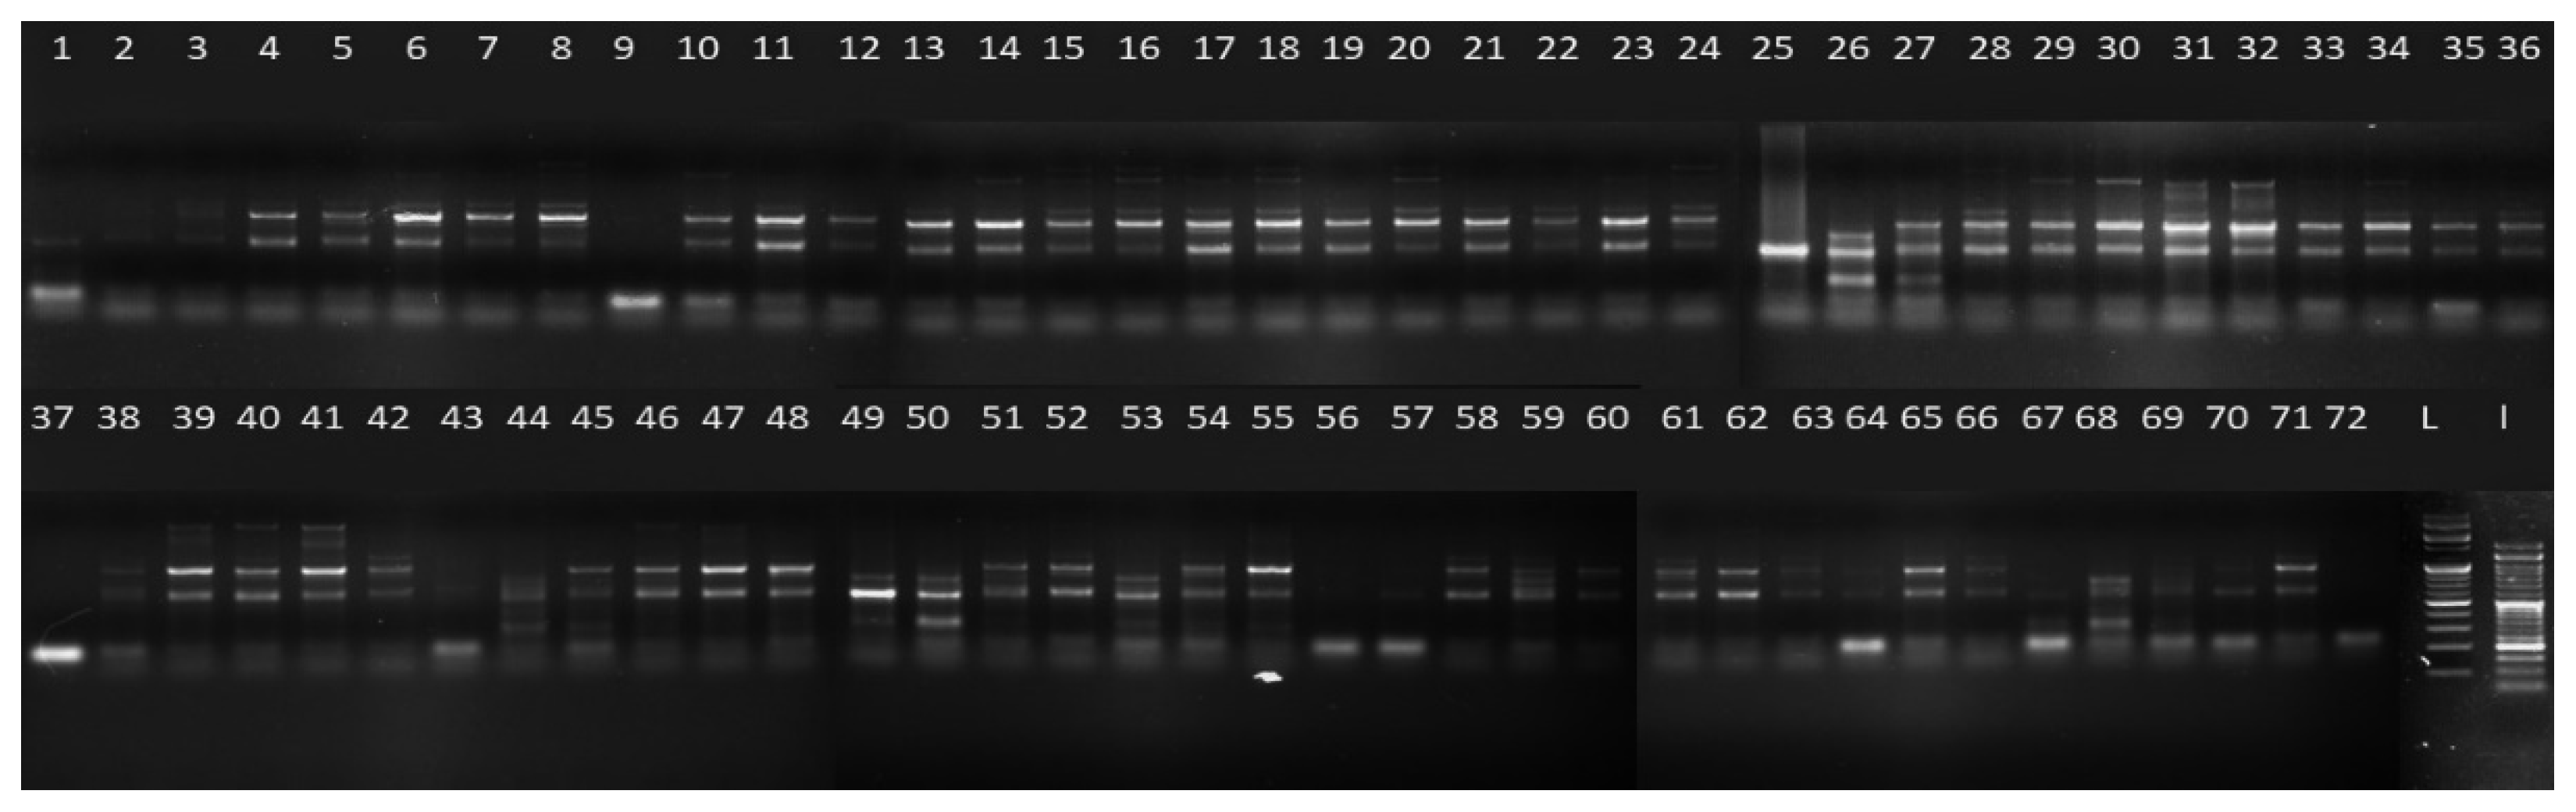
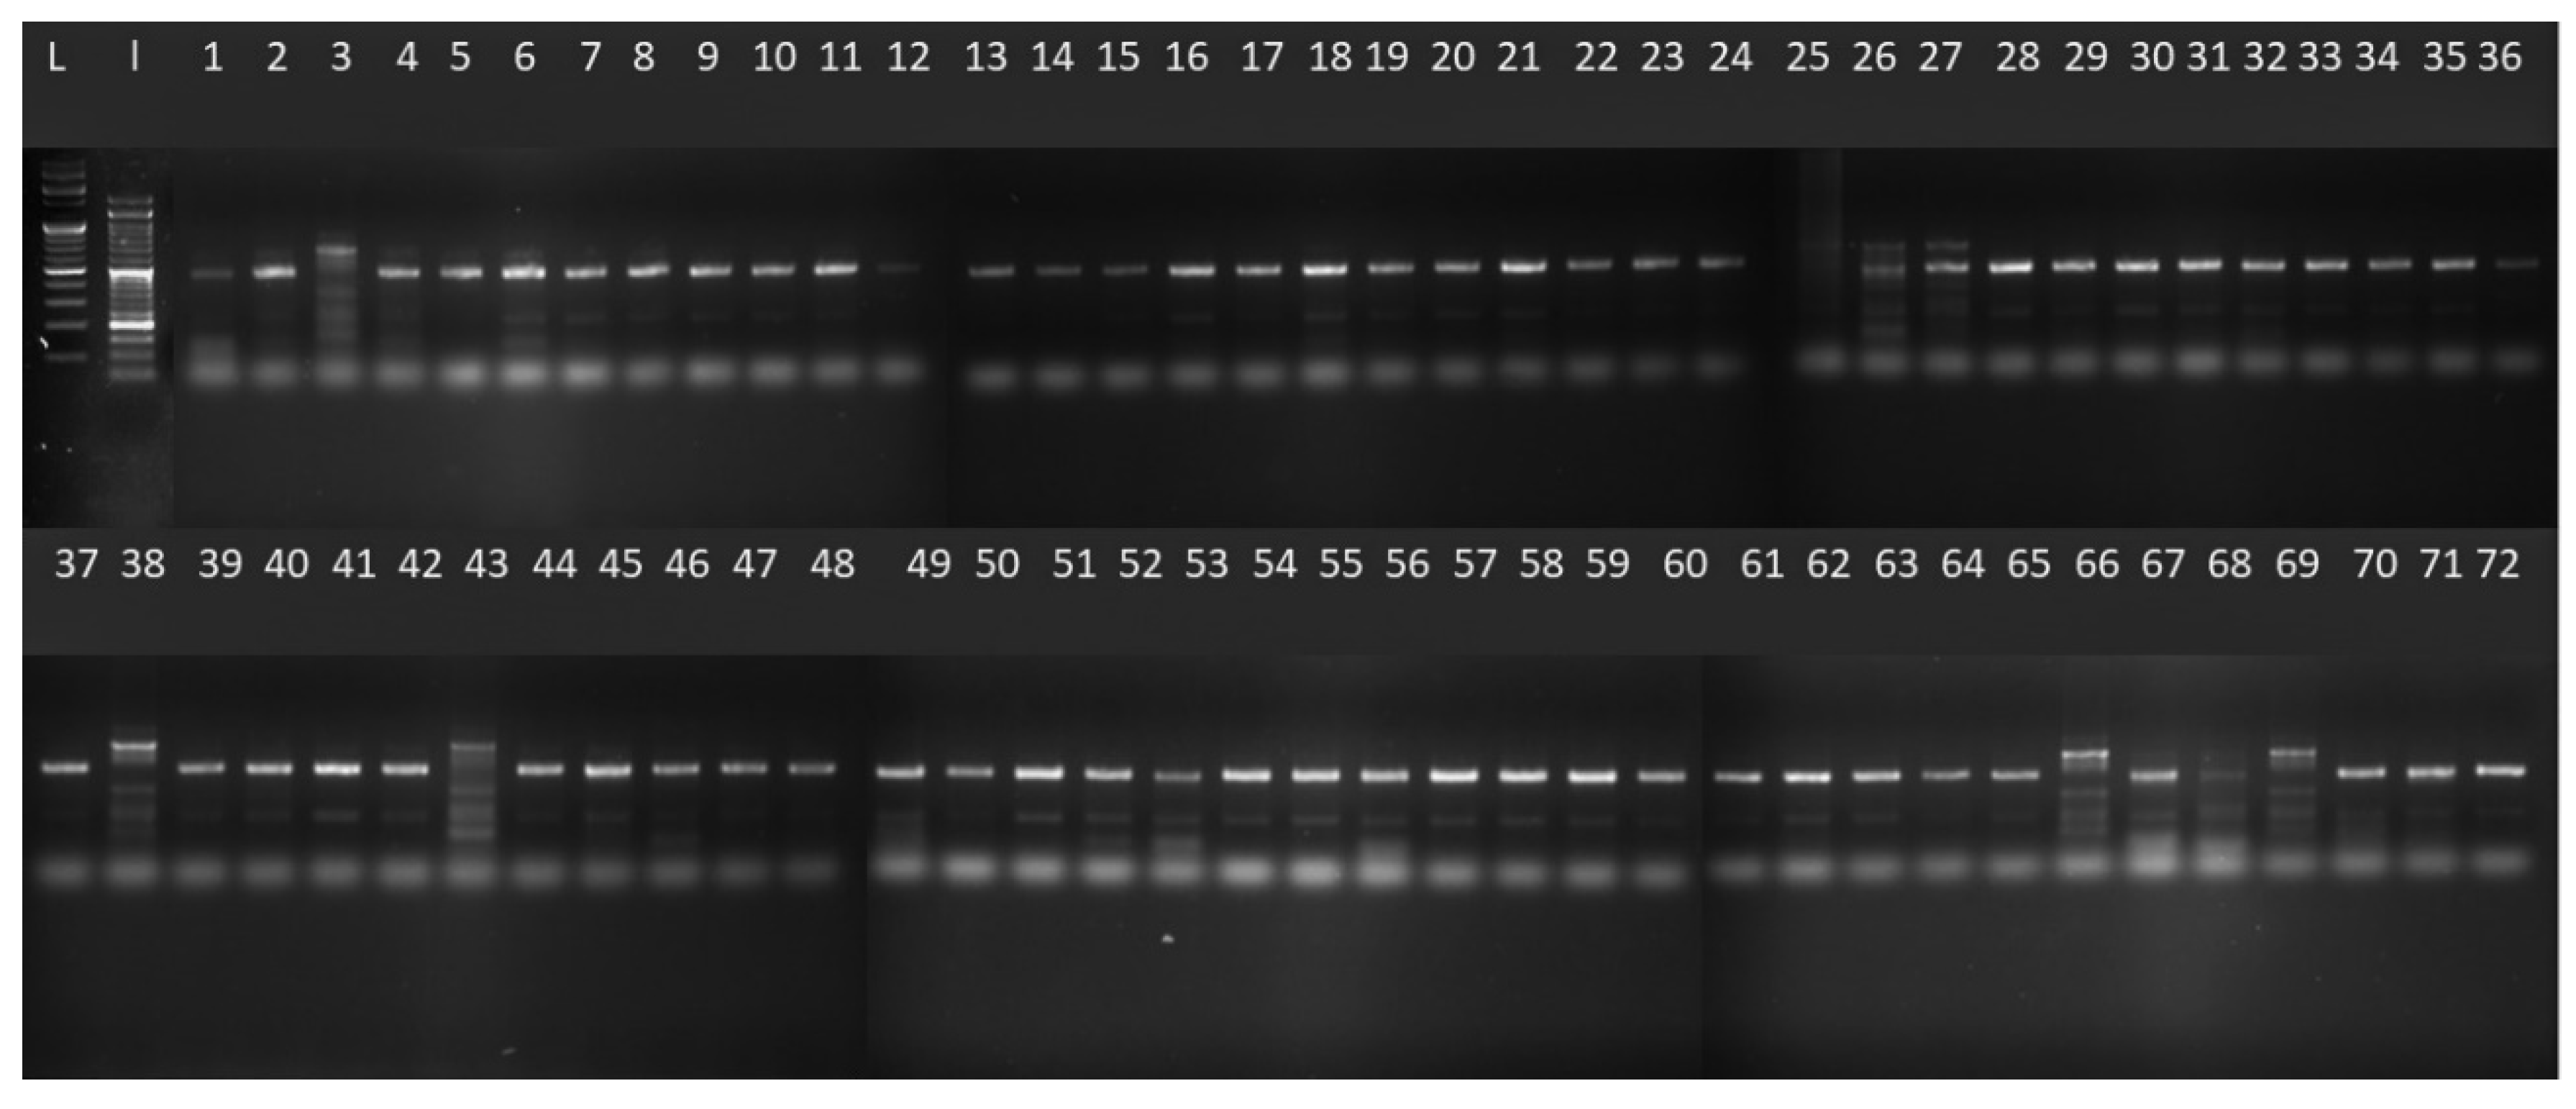
2.1. SSR Primer Competency

Initially, 45 SSR primer pairs were selected based on the literature review of the genus Cymbopogon and procured from Bioserve Biotechnologies (India) Private Limited, Hyderabad. Primer testing was performed using 45 SSR primer pairs, of which 28 primer pairs were found to be efficient for the analysis, showing good amplification and clear reproducible patterns. The screened primer sequences, polymorphism percentages, PIC, MI and Rp are indexed in Table 2.
The amplified bands obtained showed 2–5 alleles/locus. In total, 92 alleles were produced from 28 SSR primers, of which 65 were polymorphic, and the remaining was monomorphic. The polymorphism percentage of the primers ranged from 50% to 100% with an average polymorphic percentage of 68.10% (Table 2). The primers 3CM0506, 14CM3132, 30CM056 and 34CM014 represented 100% polymorphism. Previously, a RAPD and ISSR analysis of C. winterianus accessions collected across West Bengal (India) showed polymorphism of 74.07% and 47.5%, respectively [1], while 75.11% polymorphism was reported in other species of Cymbopogon [49] and 81.33% in RAPD analysis [50]. Similarly, 90.68% and 69% polymorphism were reported in ISSR analysis, while 88.62% and 62.93% polymorphism were reported in RAPD analysis [35,51]. An EST-SSR analysis in Cymbopogon species showed ~81% polymorphism [32]. In the present diversity analysis of C. winterianus using SSR marker, an average of 68.10% polymorphism was observed. The level of polymorphism was low compared to the other studies since the present study was performed on the same Cymbopogon species collected from different geographical locations. Therefore, they are likely to be more related to each other. In addition to this, PIC, MI and Rp values were also evaluated to check the competency of the screened primers. The mean PIC (polymorphism information content) values for all the loci of a particular primer varied from 0.16 (17CM3738) to 0.69 (3CM0506). A high value of PIC is an indication of more variation in the alleles and also describes the efficiency of the primers [52]. Therefore, from the observed data, 13 of the loci (PIC ≥ 0.50) can be considered more informative than the others. The PIC value >0.50 depicts the high efficiency of the primers [53]. Based on this standard value, 13 of the 28 SSR primers can be considered highly efficient for discriminating the C. winterianus accessions. In a study performed on different Cymbopogon species, 19 out of 20 primers were found to be very informative [32] with PIC > 0.50. The primer efficiency was checked by further calculating the marker index (MI) value, where the primer 3CM0506 had the highest MI of 0.69, and the lowest were the primers 5CM1112 and 17CM3738 with a 0.11 marker index. The average MI was found to be 0.34 per primer. Similarly, the resolving power (Rp) of a primer is the ability to discriminate between genotypes. Rp values varied from 0.01 (5CM1112) to 3.12 (3CM0506) with an average of 0.96/primer. Based on the data evaluation, the most efficient primer among the screened primers was the 3CM0506, with PIC (0.69), MI (0.69) and Rp (3.12). The gel image of the primer 3CM0506 differentiating 72 C. winterianus accessions is shown in Figure 1. The primer 5CM1112 could be considered ineffective due to its inability to differentiate variation among the genotypes with low PIC (0.33), MI (0.11) and Rp (0.01).

2.2. Intra- and Inter-Population Genetic Variation

The genetic variability parameters, i.e., number of observed alleles (na); number of effective alleles (ne); Nei’s gene diversity (h); Shannon’s information index (I); genetic diversity in the population (Ht); genetic diversity within the population (Hs); genetic differentiation degree (Gst); and gene flow (Nm), were calculated at the population level (Table 3).
The genotypes were divided into four populations: Pop 1 (Assam), Pop 2 (Manipur), Pop 3 (Meghalaya) and Pop 4 (Arunachal Pradesh). The parameters (na, ne, h and I) were highest for the Assam population (1.71, 1.42, 0.24 and 0.36), followed by the AP population (1.58, 1.34, 0.20 and 0.31), the Manipur population (1.40, 1.23, 0.13 and 0.20) and the Meghalaya (1.18, 1.13, 0.07 and 0.11) population. The Shannon’s diversity index revealed the genetic diversity within and among the population. The highest variation within a population was observed in Pop 1, followed by the variation in Pop 4, Pop 2 and then Pop 3. All populations showed moderate genetic diversity with 70.65% polymorphism (Pop 1), 57.61% (Pop 4), 40.22% (Pop 2), except for Pop 3 with only 18.48% polymorphism. The low polymorphism observed in the genotypes collected from Meghalaya could be due to the smaller number of germplasms used in the study.
The diversity of a species depends on the frequency of heterozygosity (Ht). The total species diversity among the population was found to be 0.22 ± 0.03, and within the population (Hs) was 0.16 ± 0.02. Further, the gene differentiation coefficient (Gst) was 0.25 with a gene flow of 1.48, indicating significant diversity in the population. All of these results confirmed the genetic variation in the populations because the Nm was higher than the threshold value (Nm ≤ 1.0) [54]. Similar results were also reported in the Cymbopogon species, which showed a gene flow of 2.58 (ISSR) and 2.20 (RAPD) [35]. Moderate heterozygosity (Ht) and gene differentiation coefficient (Gst) suggested moderate genetic variation among the population. Our results were in accordance with earlier reports [42,55].

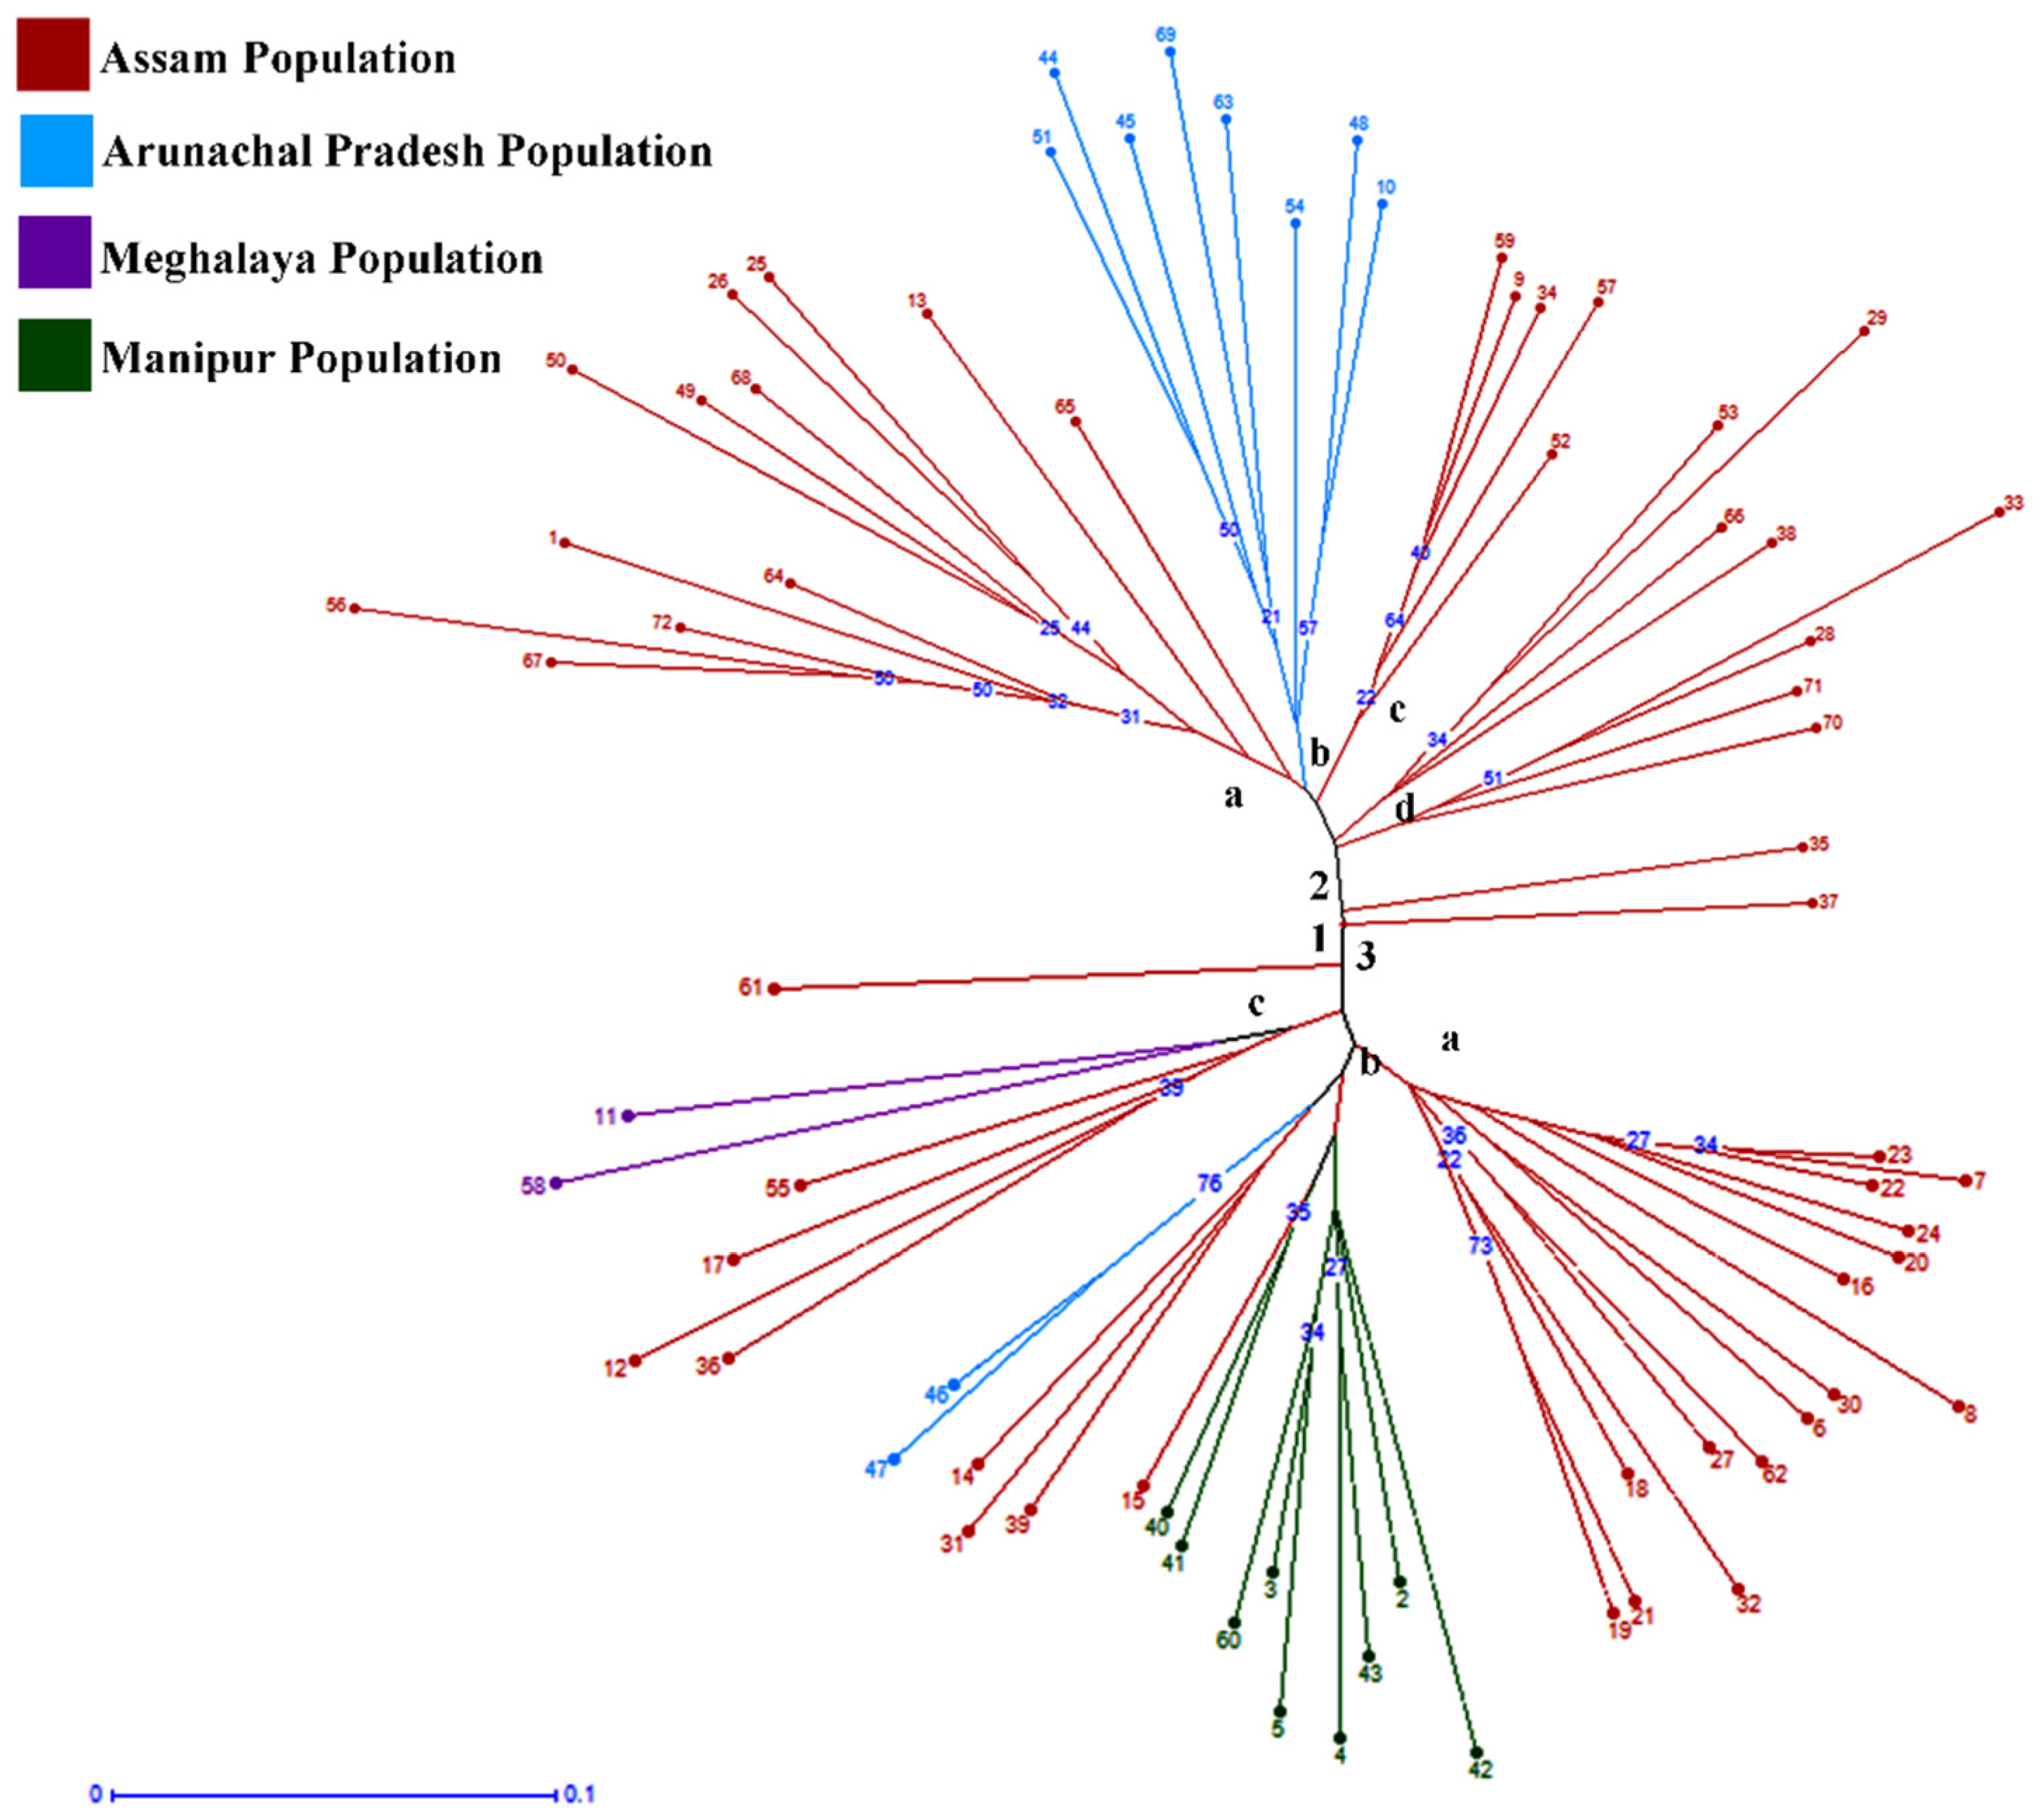
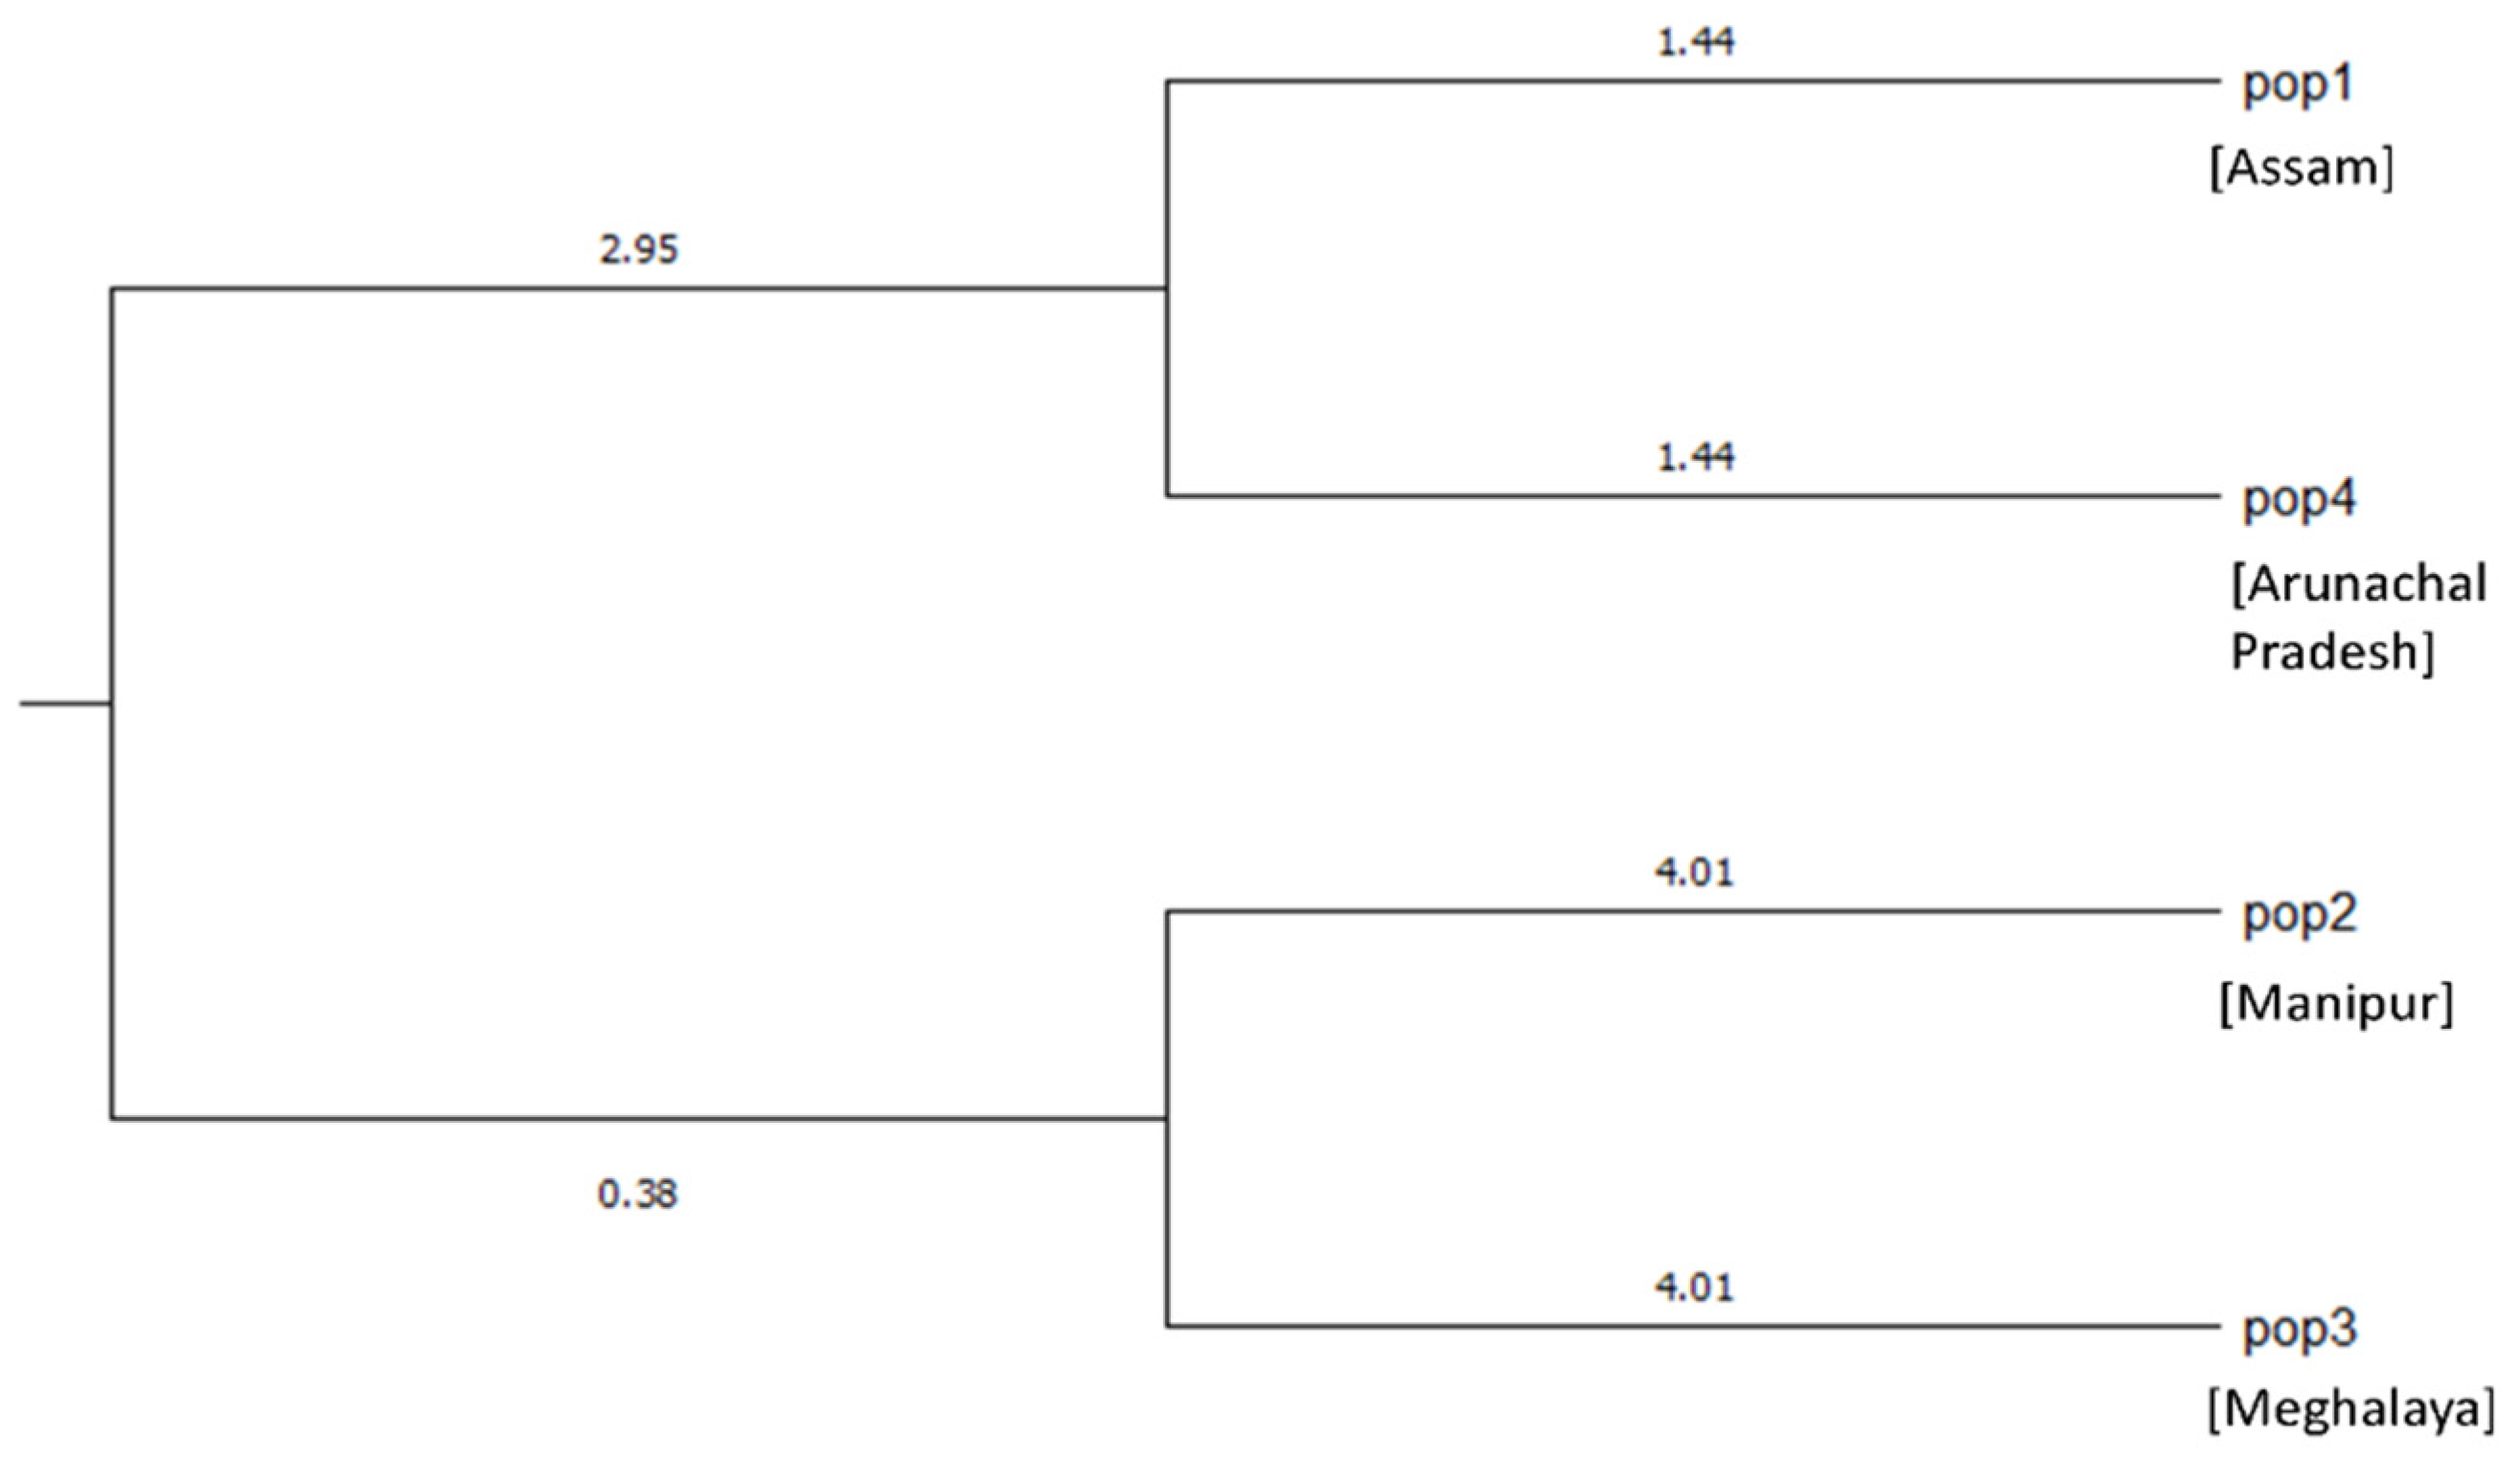
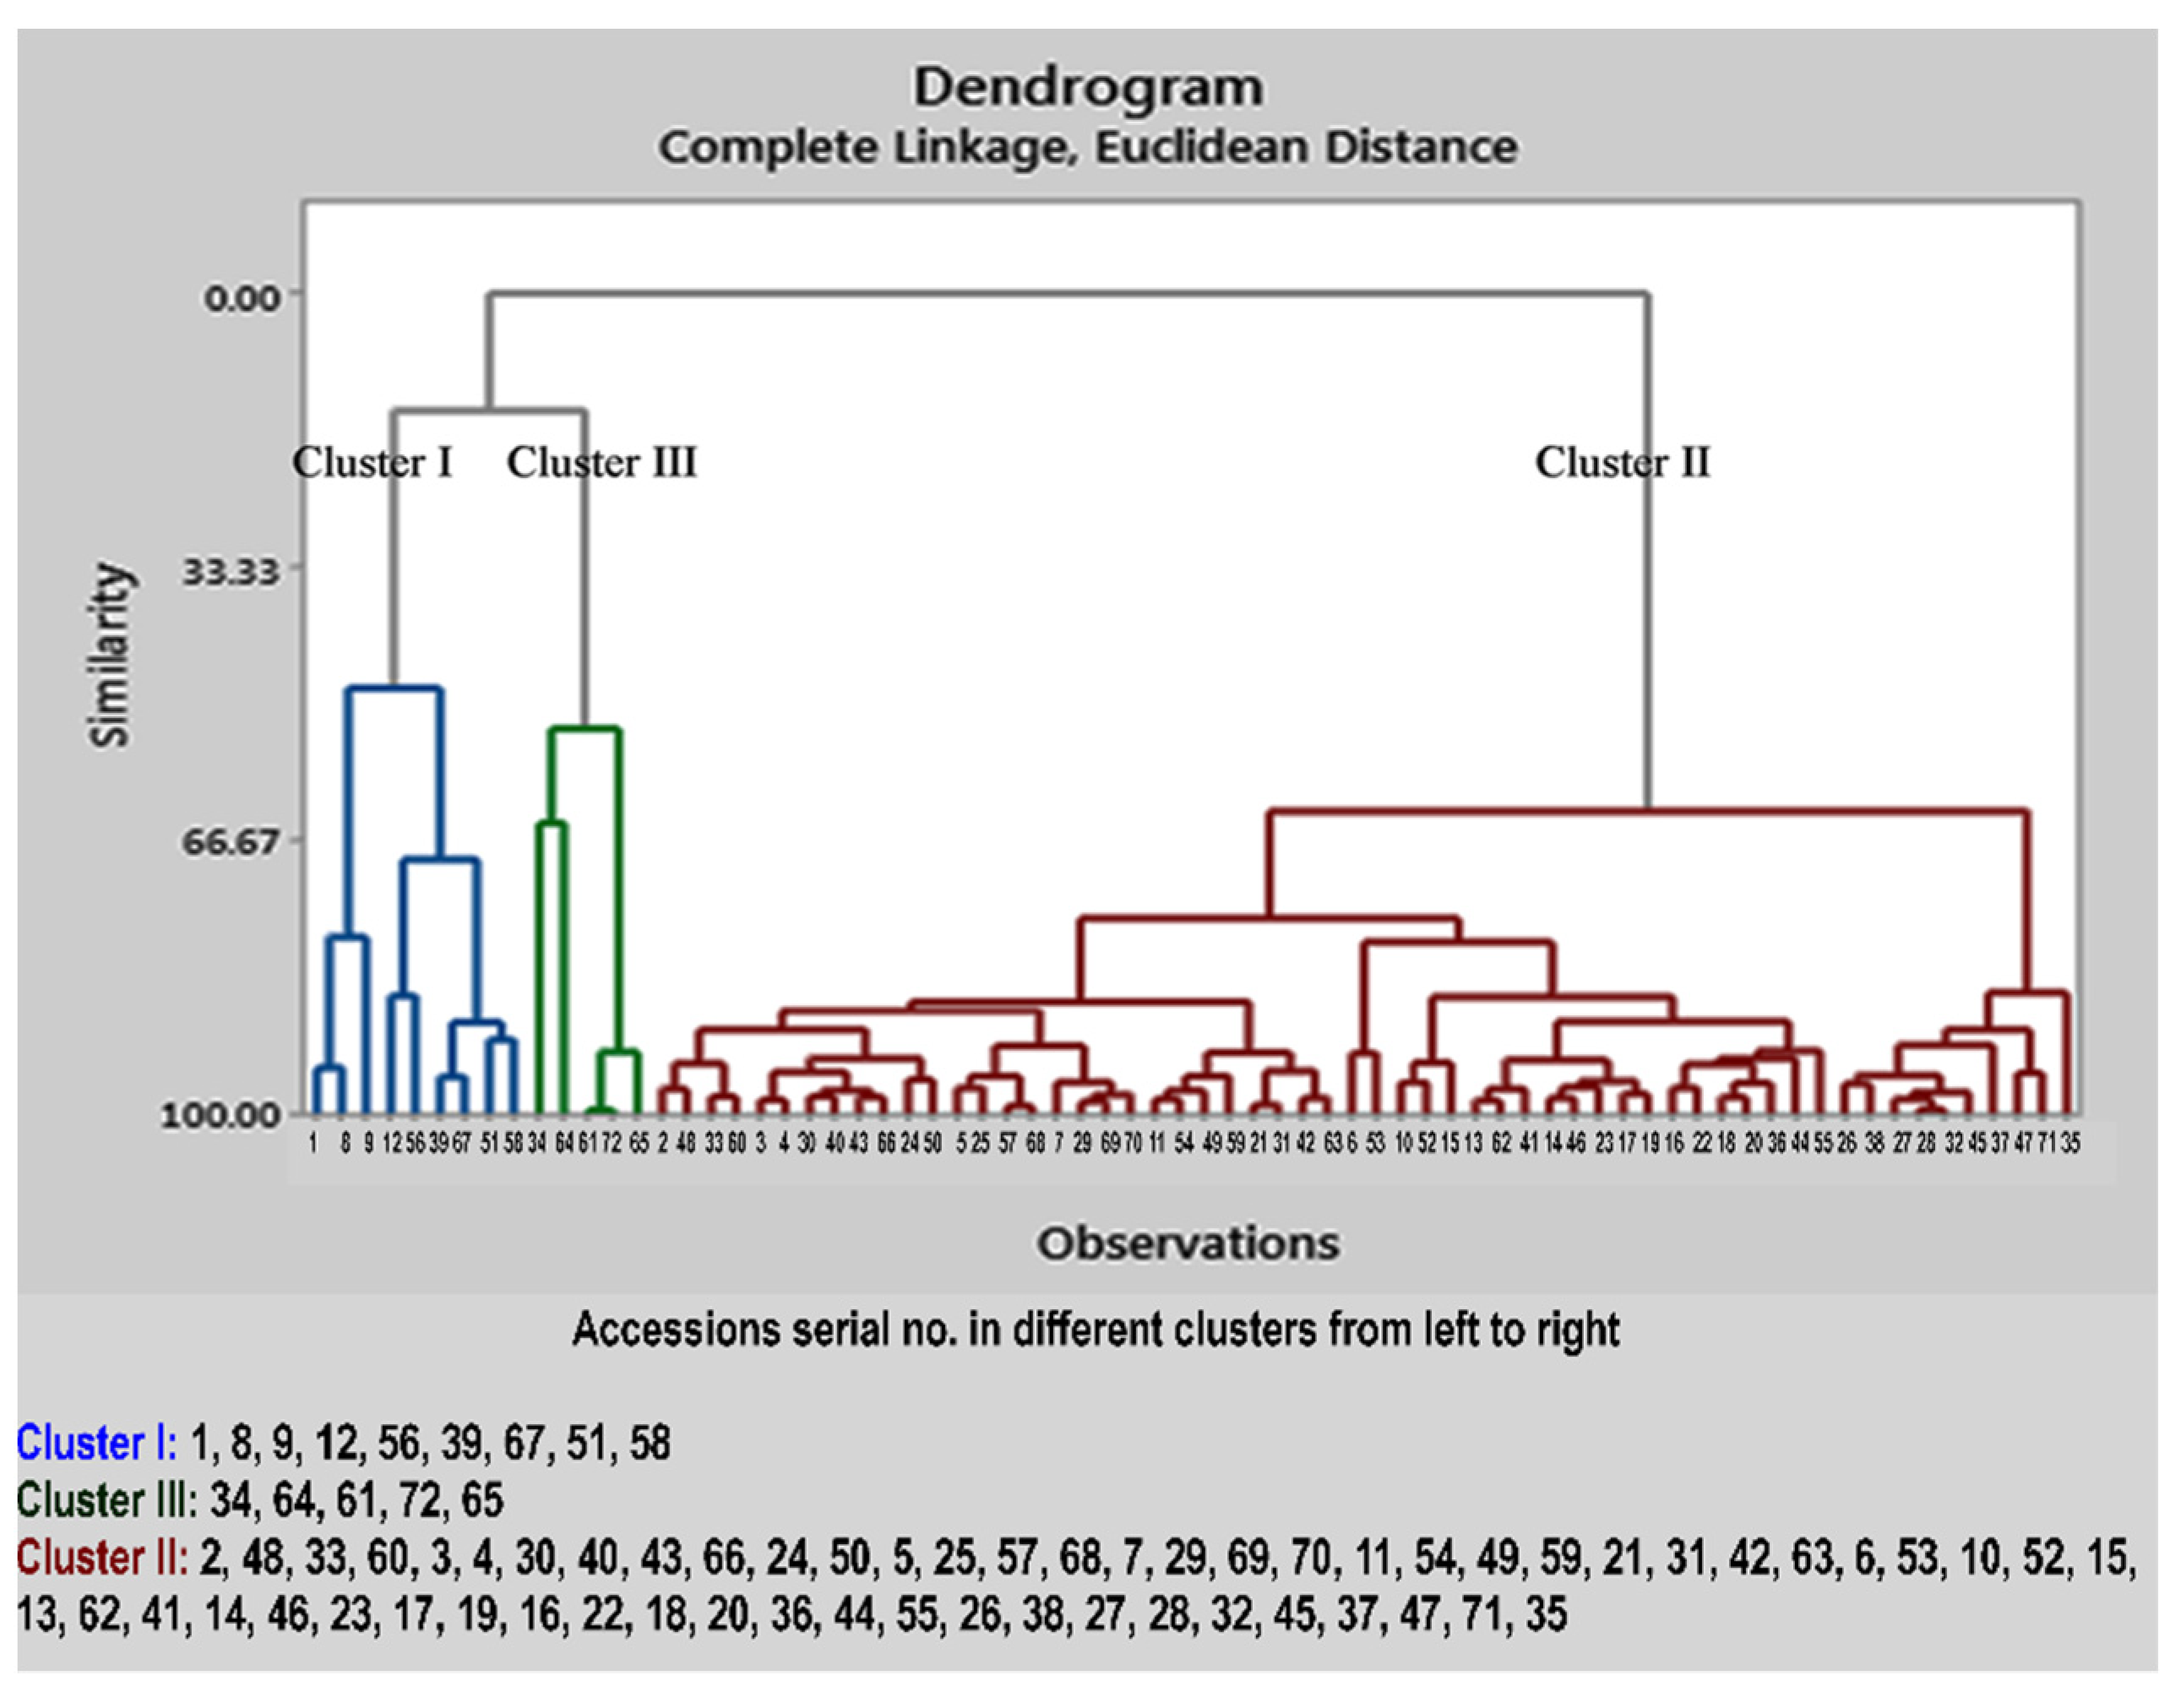
2.3. Cluster Analysis

Clustering of the genotypes was constructed based on the Neighbour-Joining Method (N-J) using a pairwise distance matrix, which generated three major clusters (Figure 2). Cluster I comprises of only one accession, while Cluster 2 and Cluster 3 comprise of 34 and 37 accessions, respectively. Cluster 2 is further subdivided into Cluster 2a, consisting of 12 accessions collected from Assam; Cluster 2b, consisting of accessions collected from Arunachal Pradesh; and Clusters 2c and 2d, both consisting of accessions collected from the Assam region. Similarly, Cluster 3 is also divided into three sub-clusters with one outgroup, i.e., Accession No. 16 (IC-0627058), collected from North Lakhimpur, Assam. Cluster 3a consists of accessions collected from Assam, and Cluster 3b consists of all the accessions collected from Manipur as well as four accessions from Assam and two accessions of Arunachal Pradesh. The dendrogram demonstrates that the clustering of accessions was dependent on their geographical collection site with the exception of two accessions from Arunachal Pradesh that were clustered separately in a different group. The reason for this may be either due to the migration of the same genotype from one location to another or due to the inability of the primers to discriminate them. The grouping of genotypes based on the N-J Method is preferred because it is rapid, reliable and produces an unrooted phylogenetic tree based on the minimum evolution criterion [56].
Jaccard’s pairwise coefficient of similarity depicted a minimum genetic similarity (0.485) between IC-0627064 (Cluster 3c) and IC-0627012 (Cluster 2a), as well as between IC-0627049 (Cluster 3a) and IC-0627048 (Cluster 3a), representing the minimum variation (0.928) among the genotypes. This pairwise similarity matrix depicted less variation among the genotypes. This may be due to the non-cross-pollinative nature of C. winterianus, due to rare flowering unlike the other Cymbopogon species [4]. Further, Nei’s genetic identity and the genetic distance were calculated between the four populations. The dendrogram constructed indicated the highest genetic identity between Pop 1 and Pop 4 and a maximum distance between Pop 4 and Pop 3 (Figure 3).
Nei’s genetic identity and the genetic distance between the four populations showed low variation, indicating the gene exchange or duplication of germplasms between adjacent geographical populations [57]. In Cymbopogon winterianus, due to the presence of very rare flowering, the gene exchange is not carried out by pollens or seed. Therefore, we can interpret that the factors affecting the gene flow are mainly due to human interference, such as genetic swamping, genetic rescue, hybridization and urbanization.
The basis of a multivariate analysis is a principal component analysis which is an approximation of the data table provided by the analysis [58]. A field representation of variability can be provided by utilizing the PCA. The PCA is very useful for determining the similarity of samples as the non-similar samples become further apart in the presentation [36]. Population structure analysis and the PCA are used widely to visualize the structure of the data [59]. Therefore, the PCA was performed for the 72 accessions of C. winterianus to check the variability and relationships among them, which is represented in the biplot (Figure 4).
The Eigen values are higher in the first three groups (1.91, 0.99 and 0.69), which show a greater contribution to the explanation of variances among the accessions. The total cumulative variance observed for the fourteen principal components accounted for 69.33% of the variance, of which 16.09%, 8.36% and 5.77% of the variance was contributed by the first, second and third principal components, respectively (Table 4).
A cluster analysis along with the PCA based on molecular marker data help in the extraction of maximum information if the first three principal components account for more than 25% variance [60]. The present analysis revealed that the first three components contribute to 30.22% variance, which is in accordance with the previous study. The PCA plot resembled the cluster formed in the dendrogram, although some diversions of the accessions were observed on the PCA plot (Figure 4).
C. winterianus is a plant of industrial importance globally; therefore, the improvement of this crop through breeding programme is very essential. Germplasm collection, along with their variability, is required for any genetic improvement of the crop. However, very scanty evidence on the intra- and inter-specific relationships and genetic diversity within the C. winterianus germplasm is available; therefore, the present study will add new information for researchers and breeders.

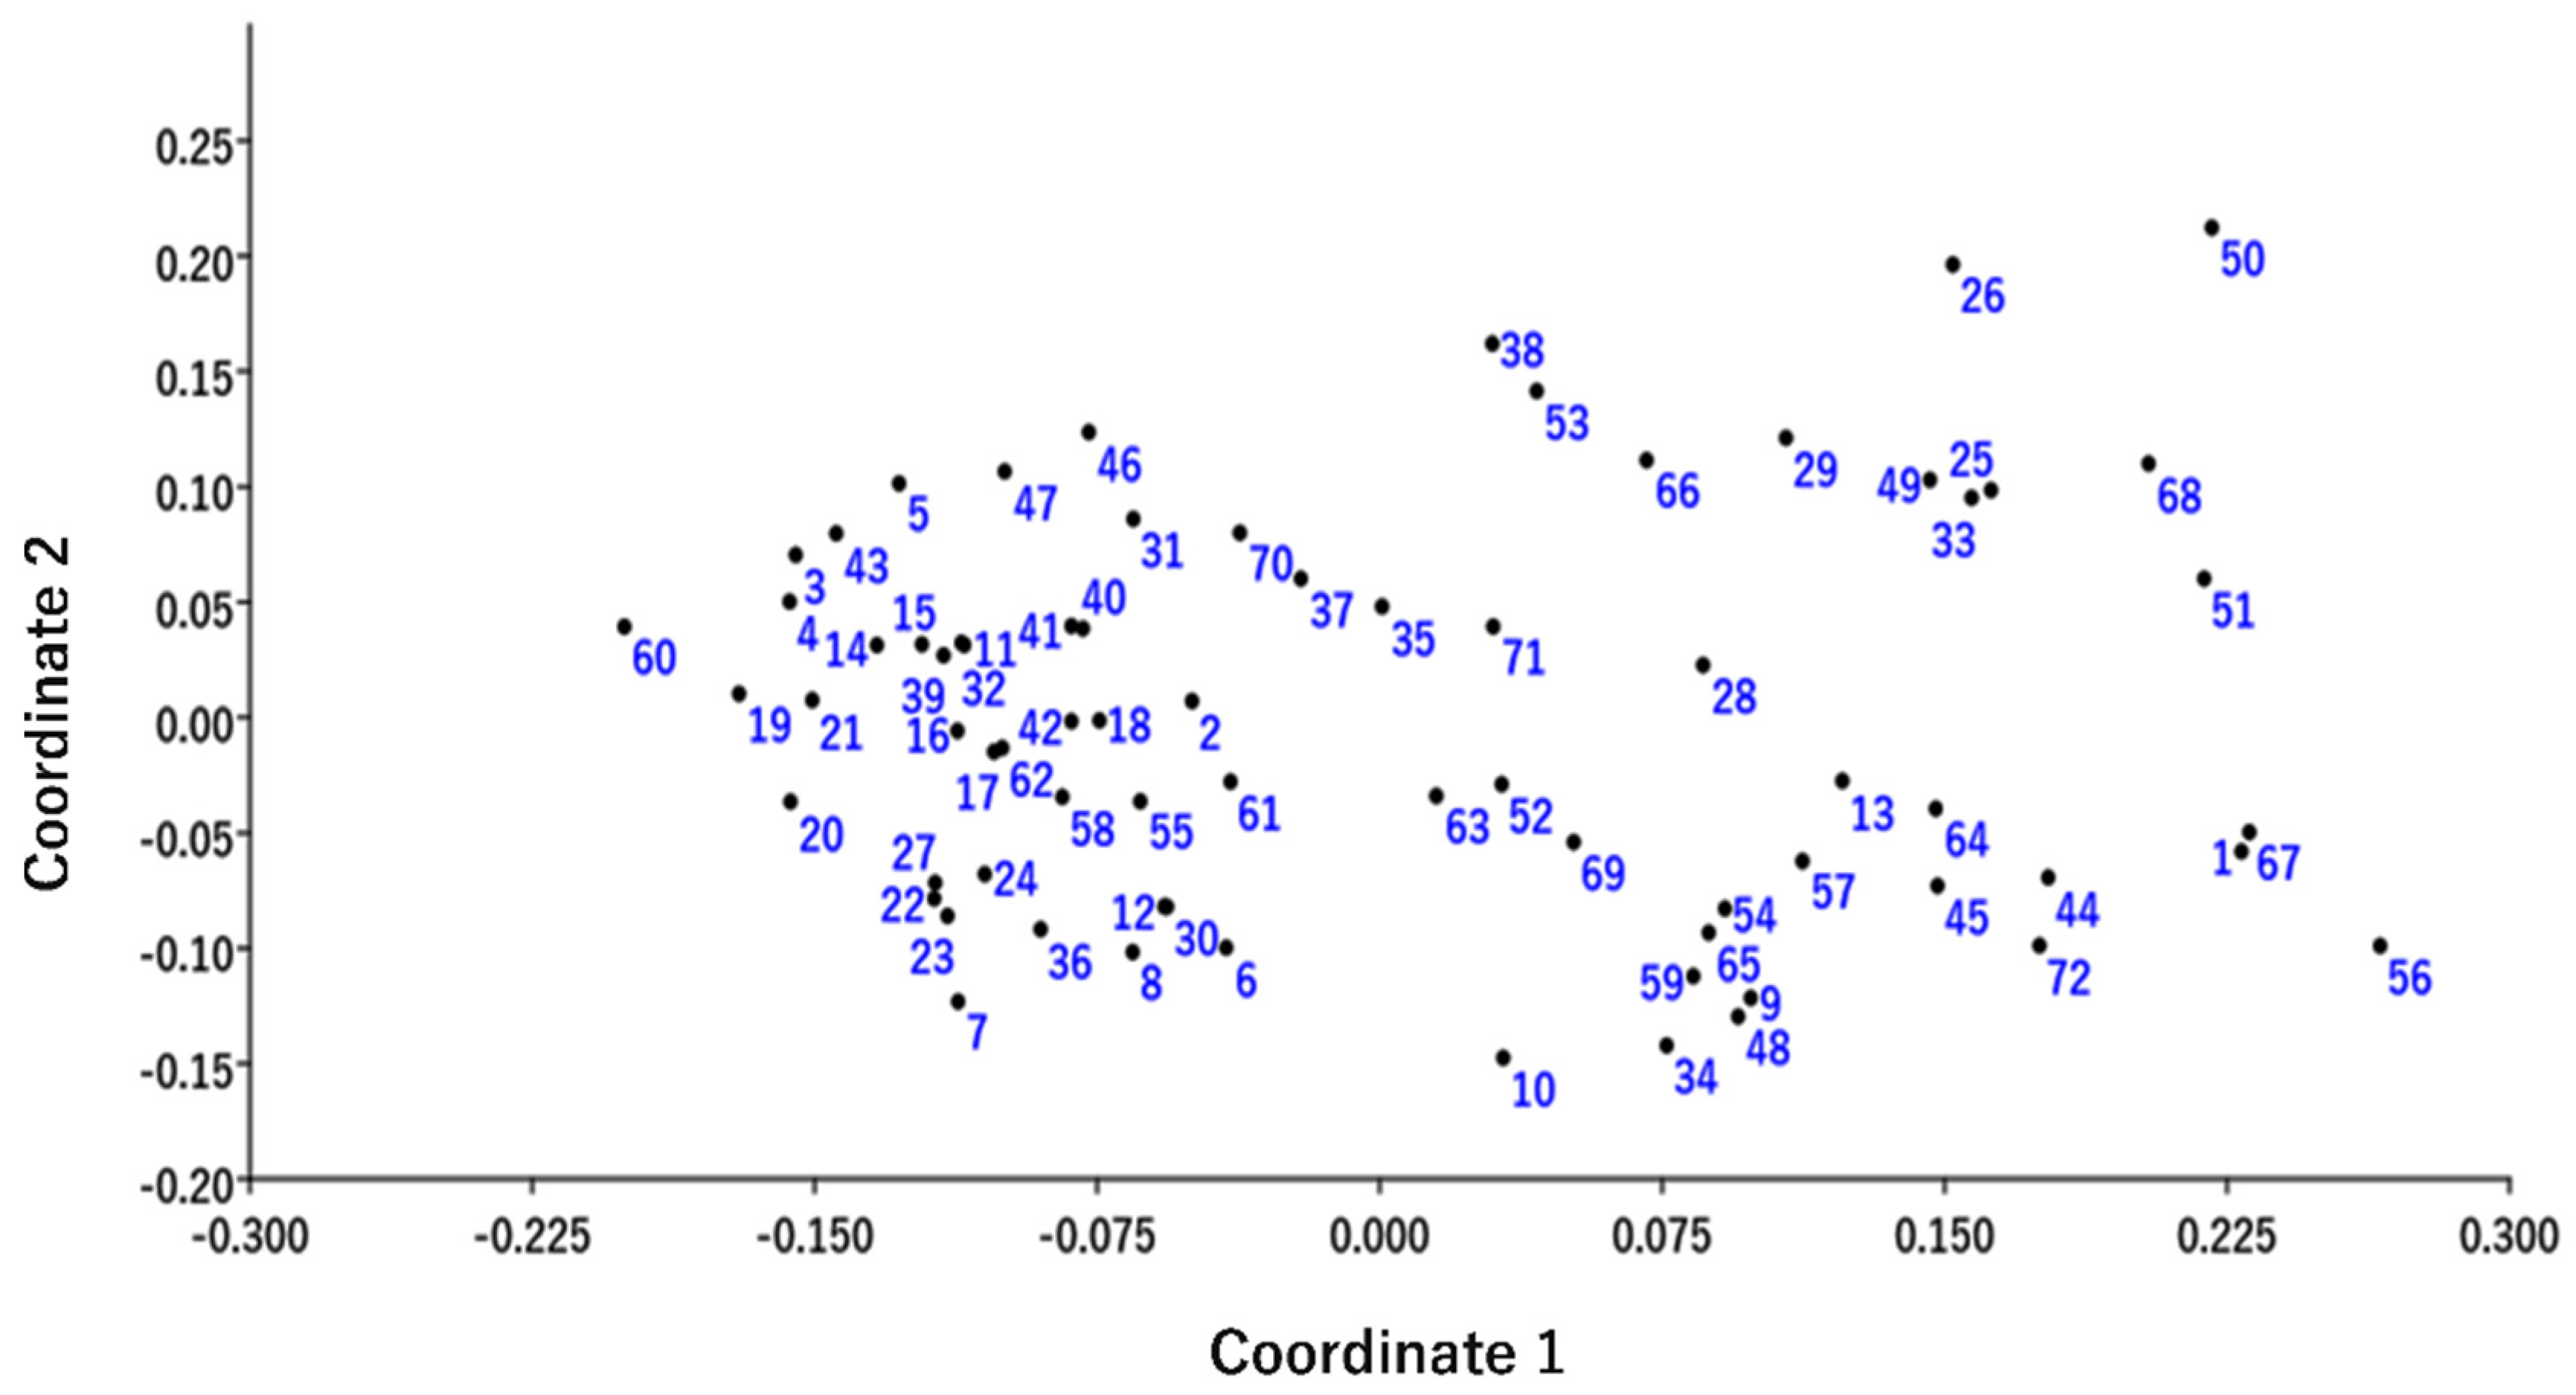
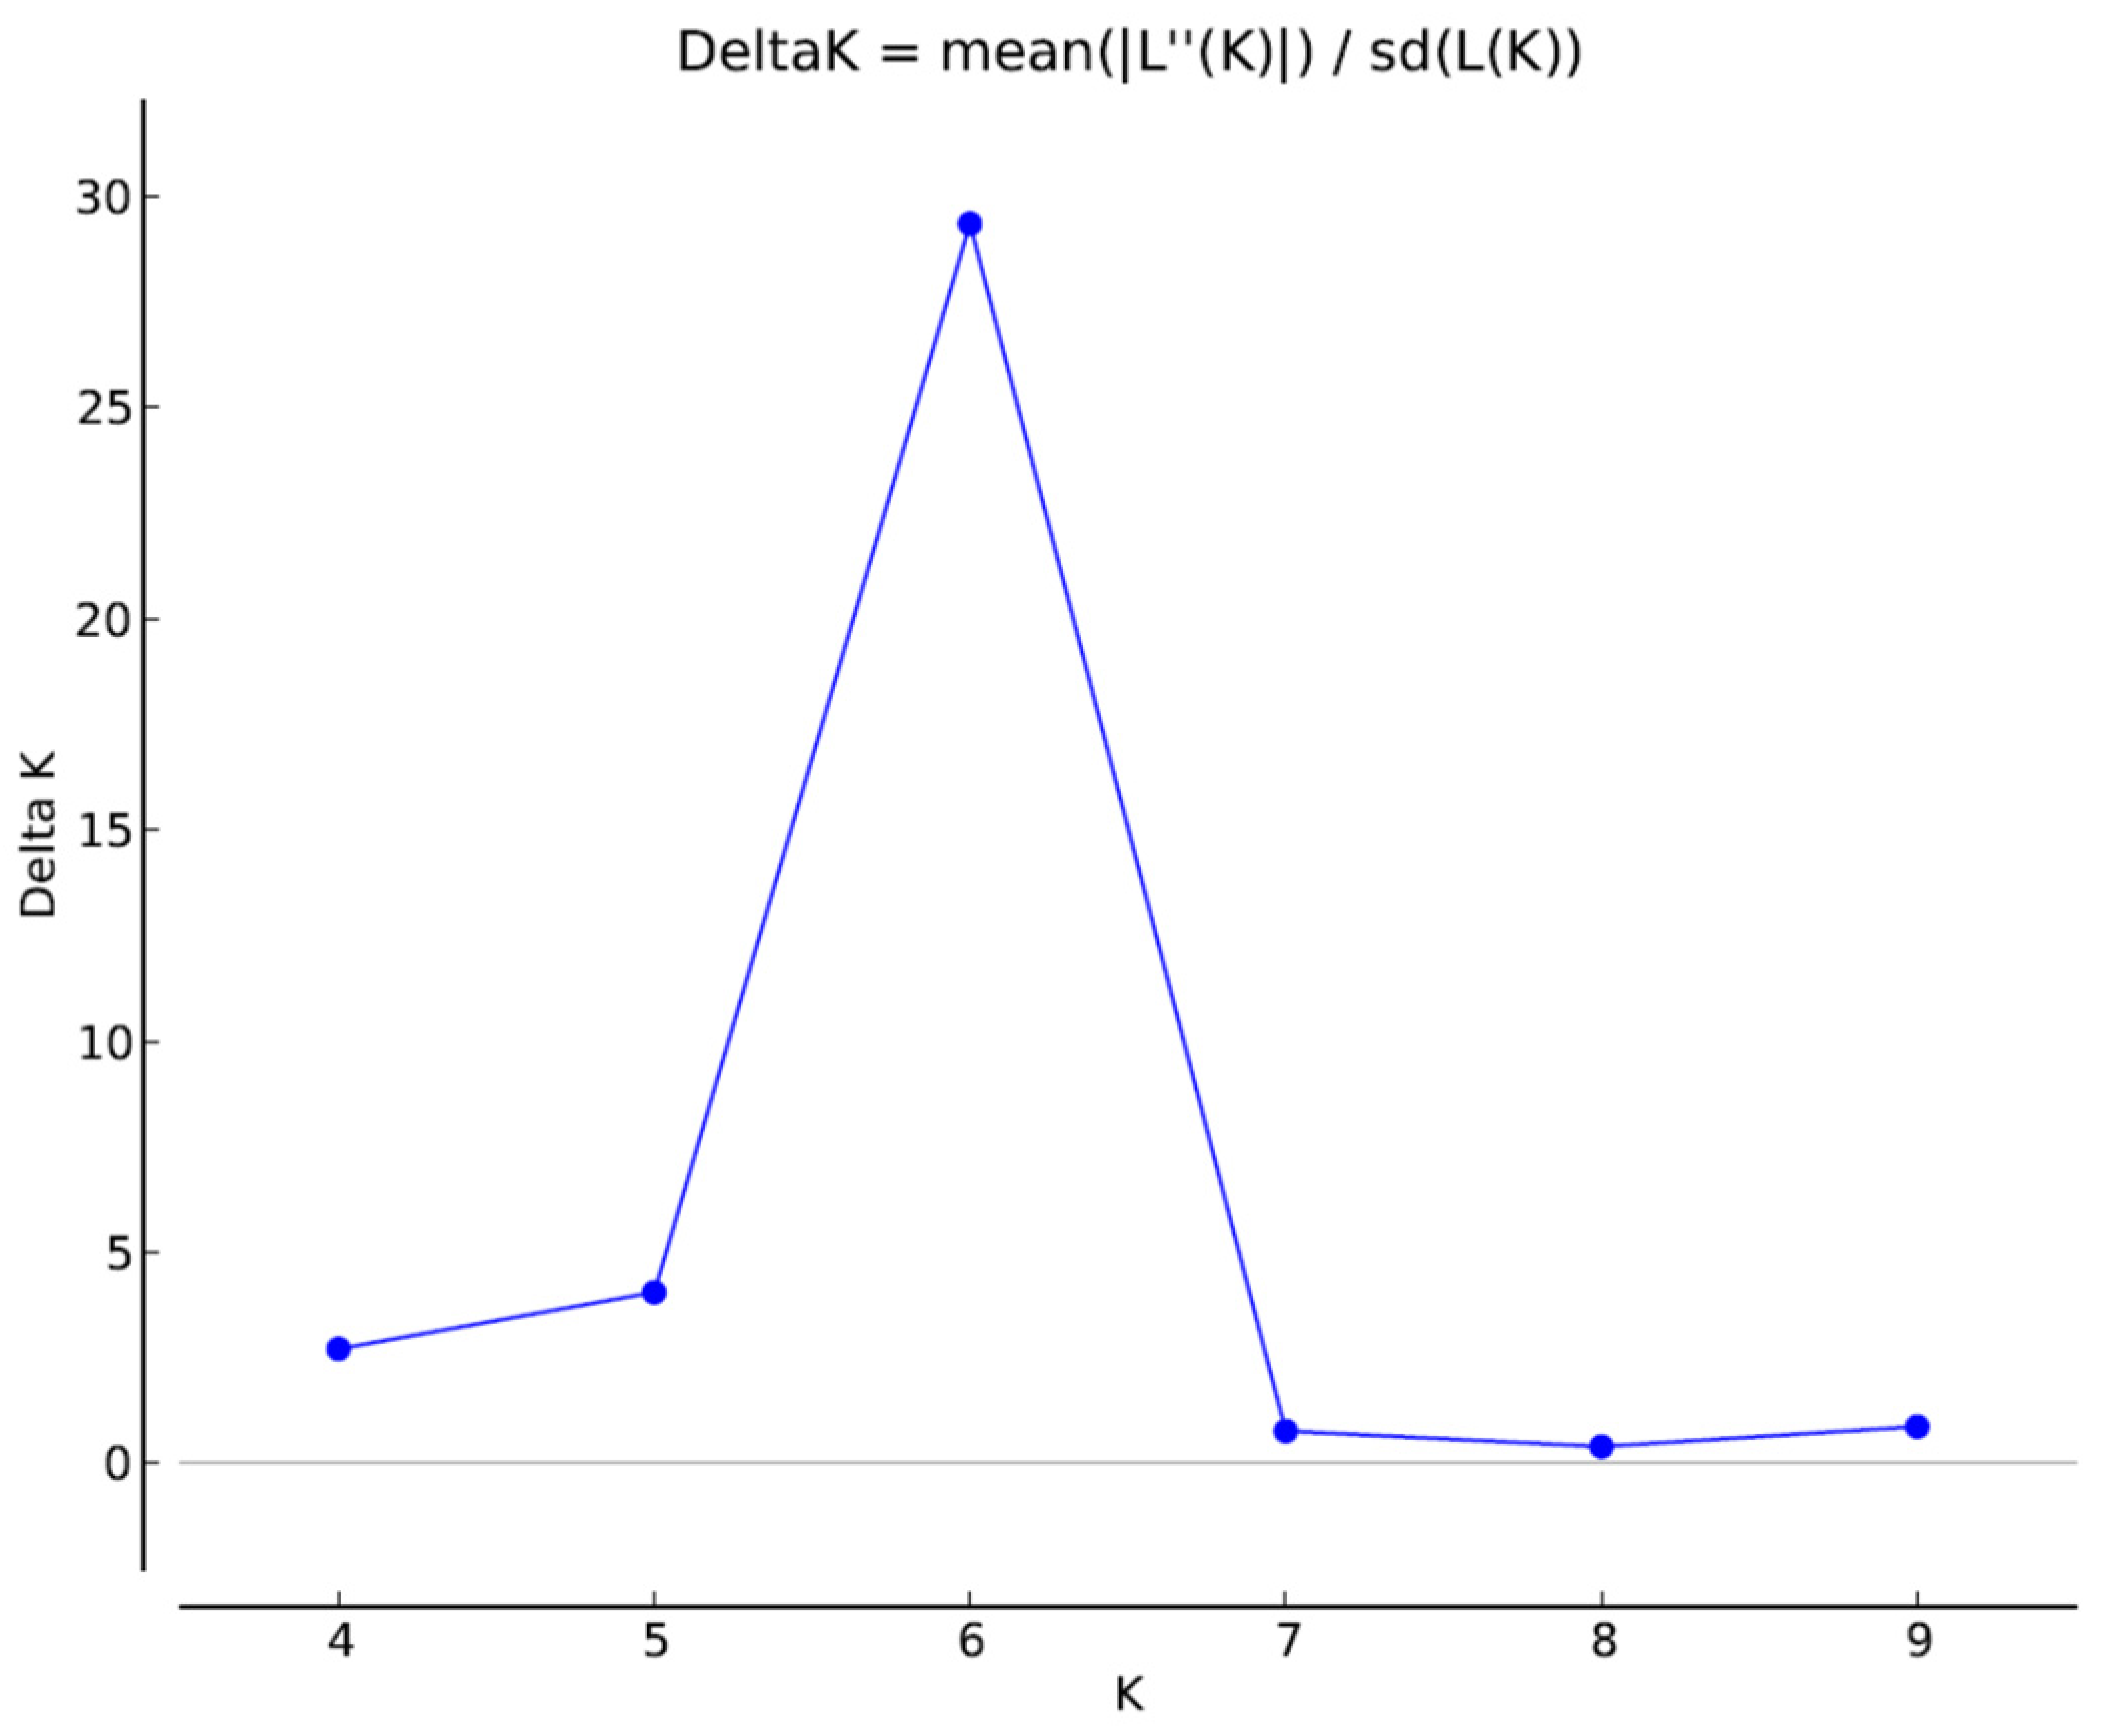
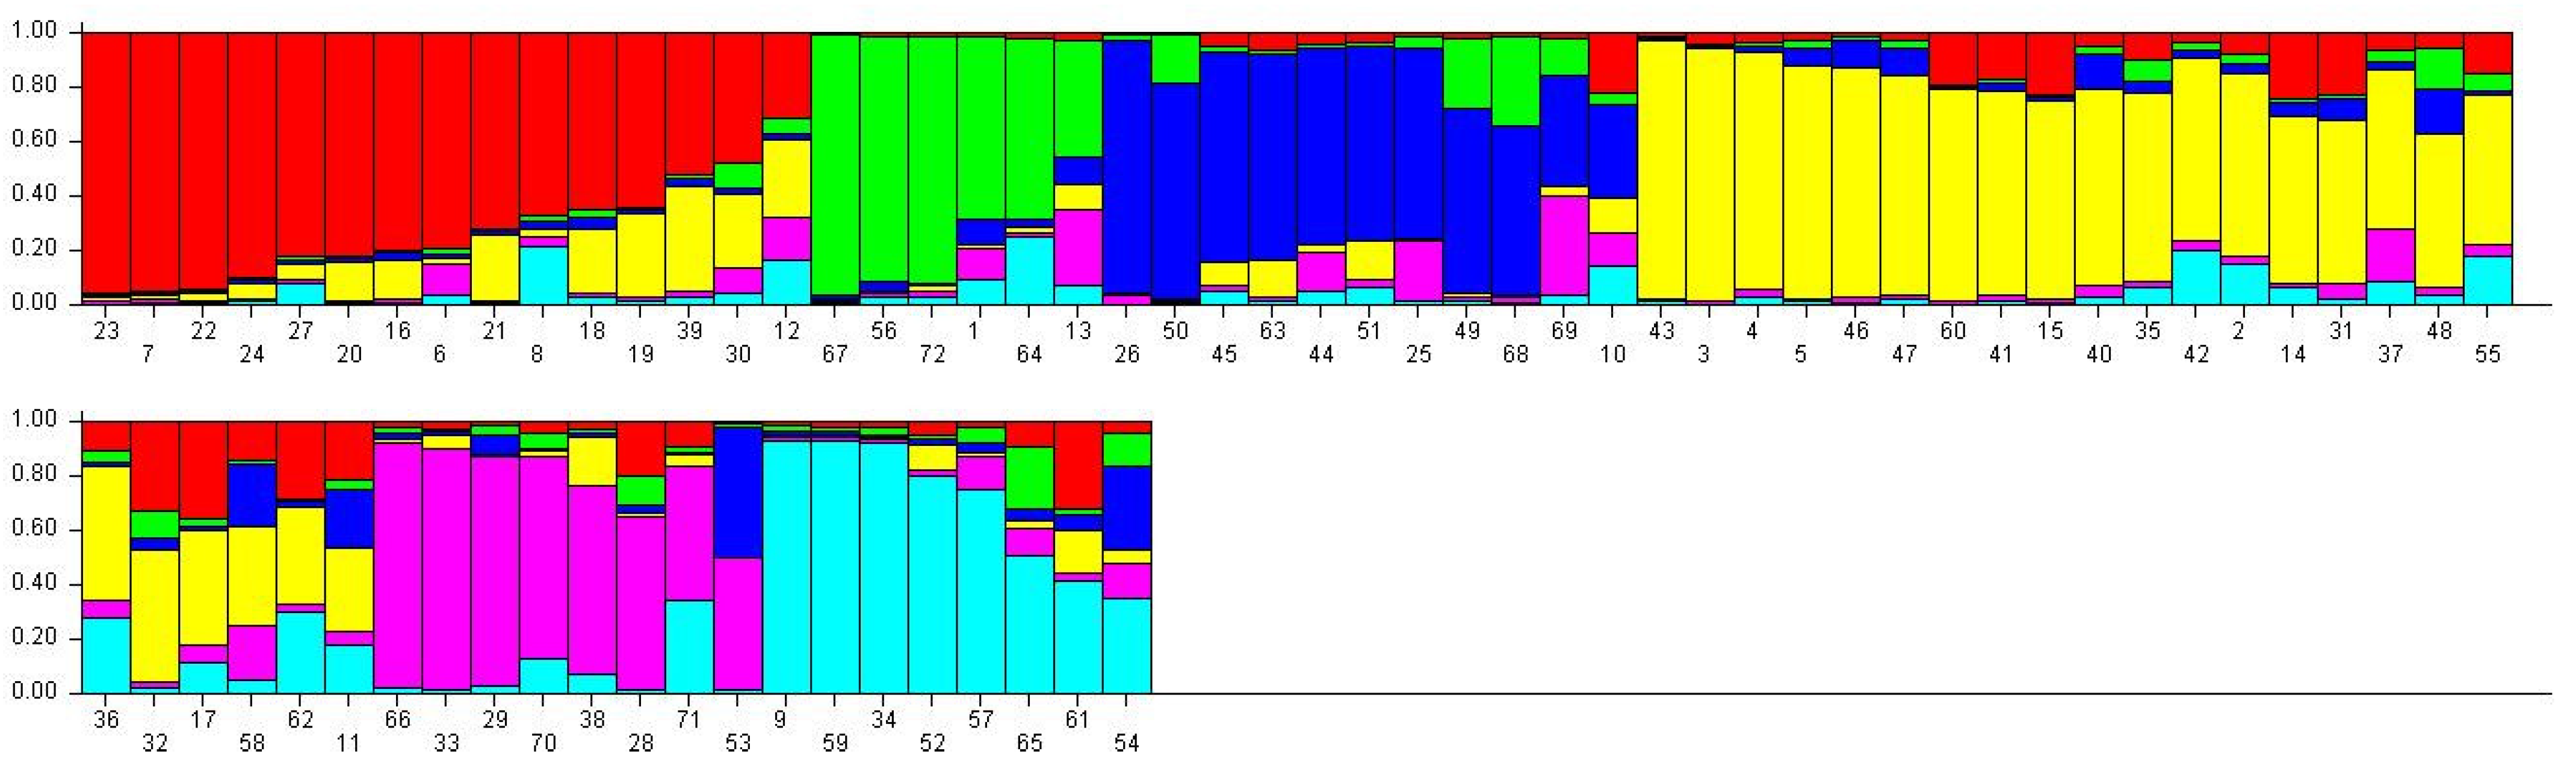
2.4. Population Structure

A total of six appropriate genetic populations was identified through a structure harvester software analysis (Figure 5 and Figure 6). The accessions that showed a probability score of more than 0.80 can be deemed genetically pure accessions, while a score of less than 0.80 can be considered as homogenous accession. The mean Fst values for Populations I, II, III, IV, V, and VI are 0.6023, 0.5092, 0.3296, 0.5244, 0.3483 and 0.4550, respectively. The allele frequency divergence among a population was computed using point estimates of P, which are presented in Table A1. The population structure study indicated the genetic differentiation of the C. winterianus accessions, which suggested that the SSR primers used in the study were suitable for population structure studies.

2.5. Analysis of Molecular Variance (AMOVA) of C. winterianus Accessions

AMOVA was used to interpret the difference in population using molecular markers [61]. Analysis of the C. winterianus accessions showed a high variance within the population (75%) and significantly less variance among the populations (25%), indicating a continuous gene exchange among the populations (Table 5).
AMOVA results showed an 80% variation within the populations in RAPD, and a 79% variance in ISSR analysis as well as significantly less variation were found among the population of the Cymbopogon species with 20% (RAPD) and 21% (ISSR) [35]. It was reported that when an intra-specific variation is compared to an inter-specific variation, the presence of the population structure can be predicted [62]. Many factors, such as the geographical location, genetic drift, gene flow, mating system, long-term evolutionary history and wind-pollinated, long-lived outcrossing in species were responsible for genetic diversity [63]. In addition to this, population size plays an important role for the precision of work and avoiding skewed results and errors [64]. Therefore, the highest intra-specific diversity was observed in Pop 1 (Assam) and lowest in Pop 3 (Meghalaya). According to the genetic theory of population, an increase in diversity helps species’ potential for adapting to a changing environment [65]. Therefore, it is necessary to broaden the knowledge of genetic bases because a loss of heterogeneity might affect the feasibility of a population leading to species extermination [66].

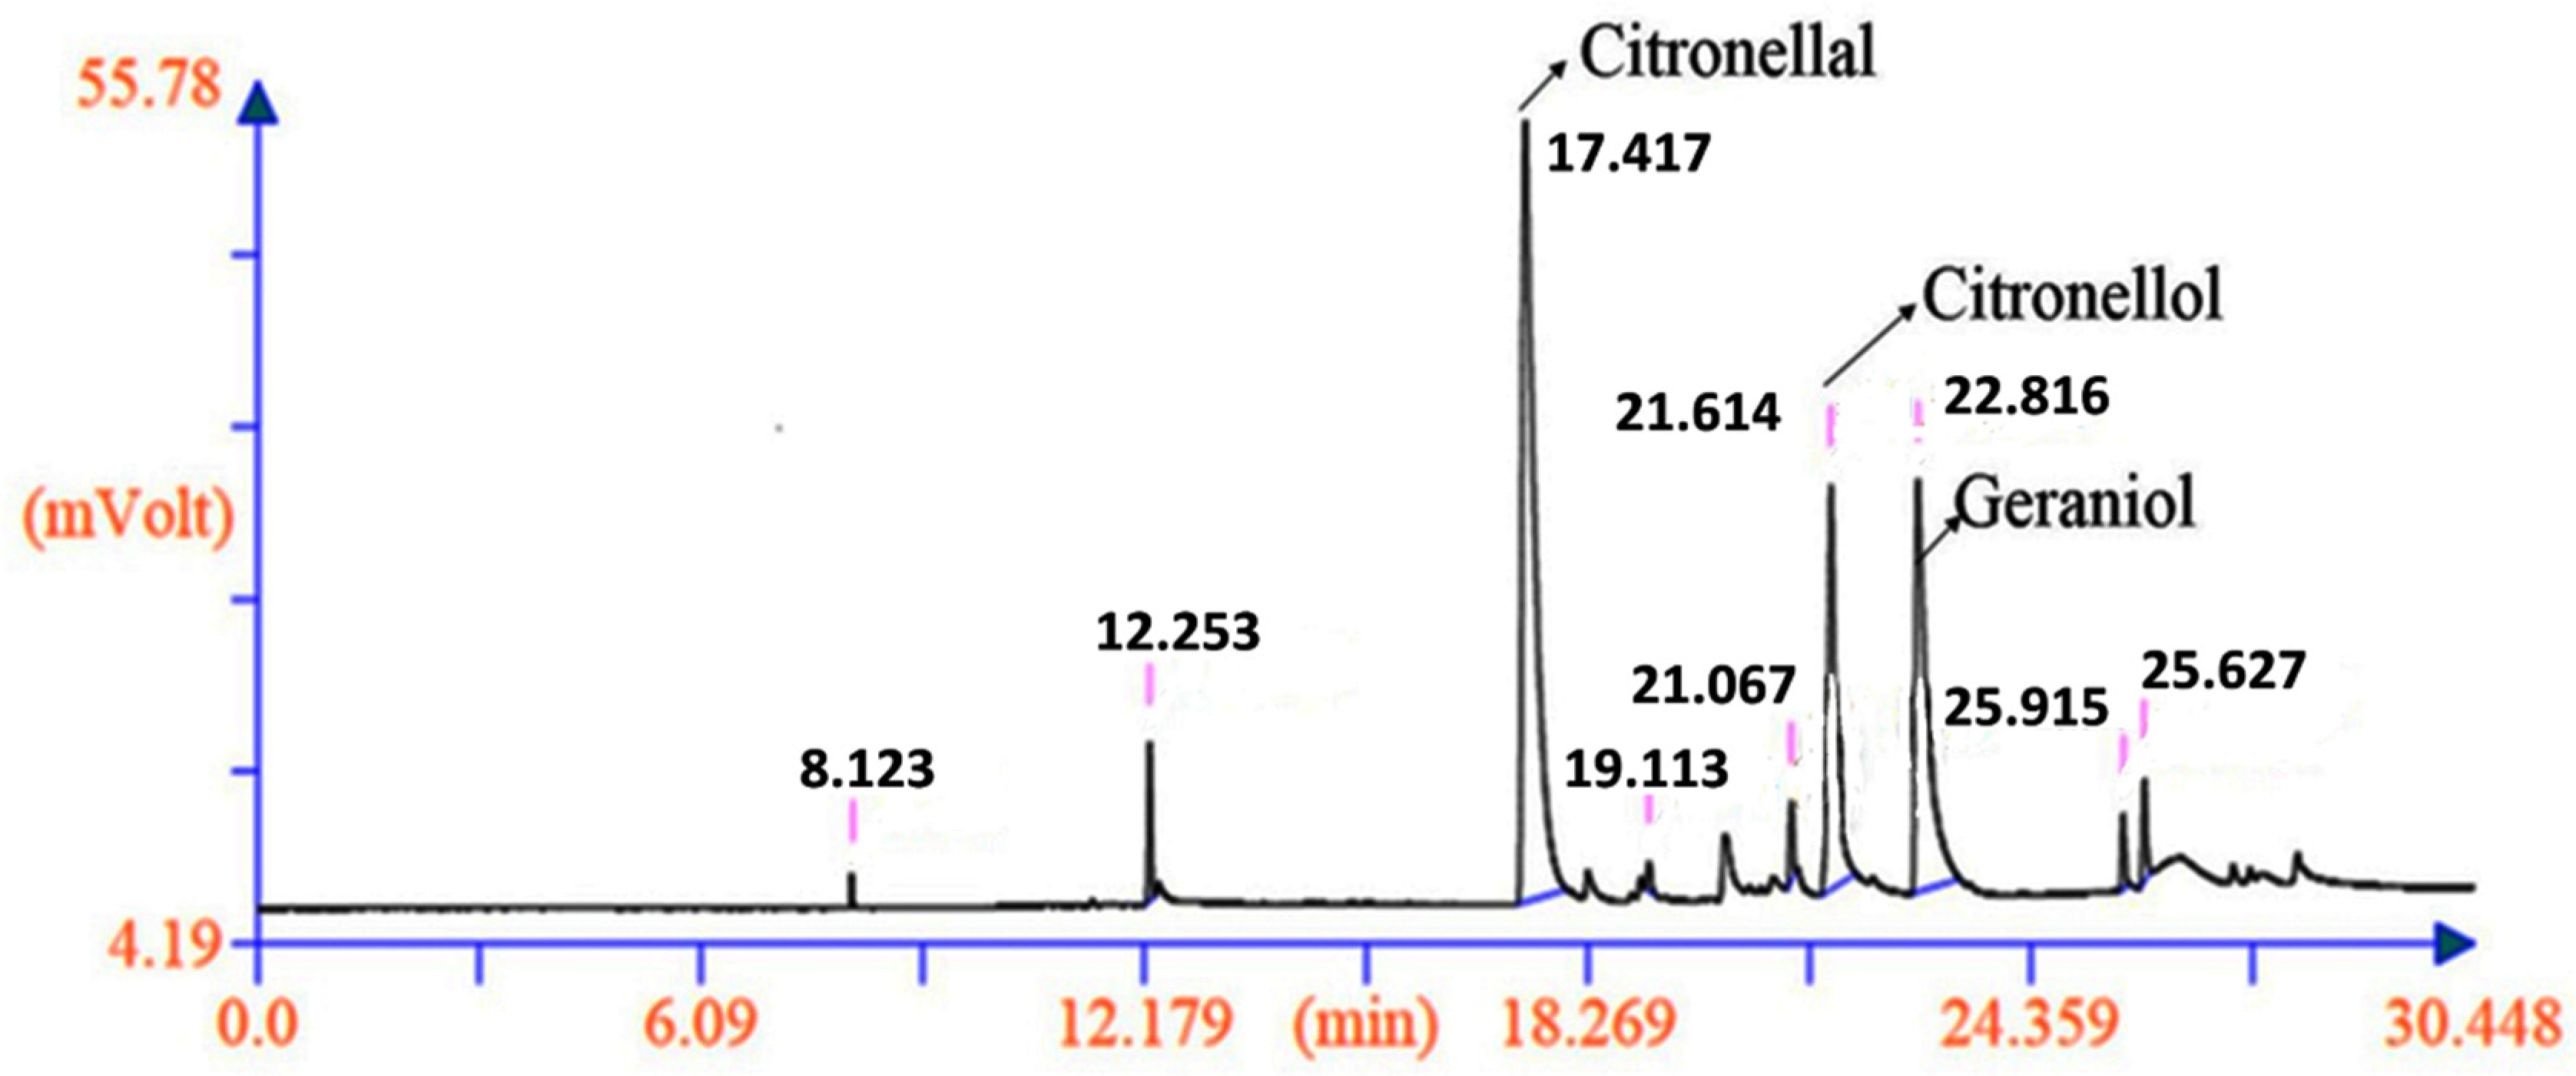
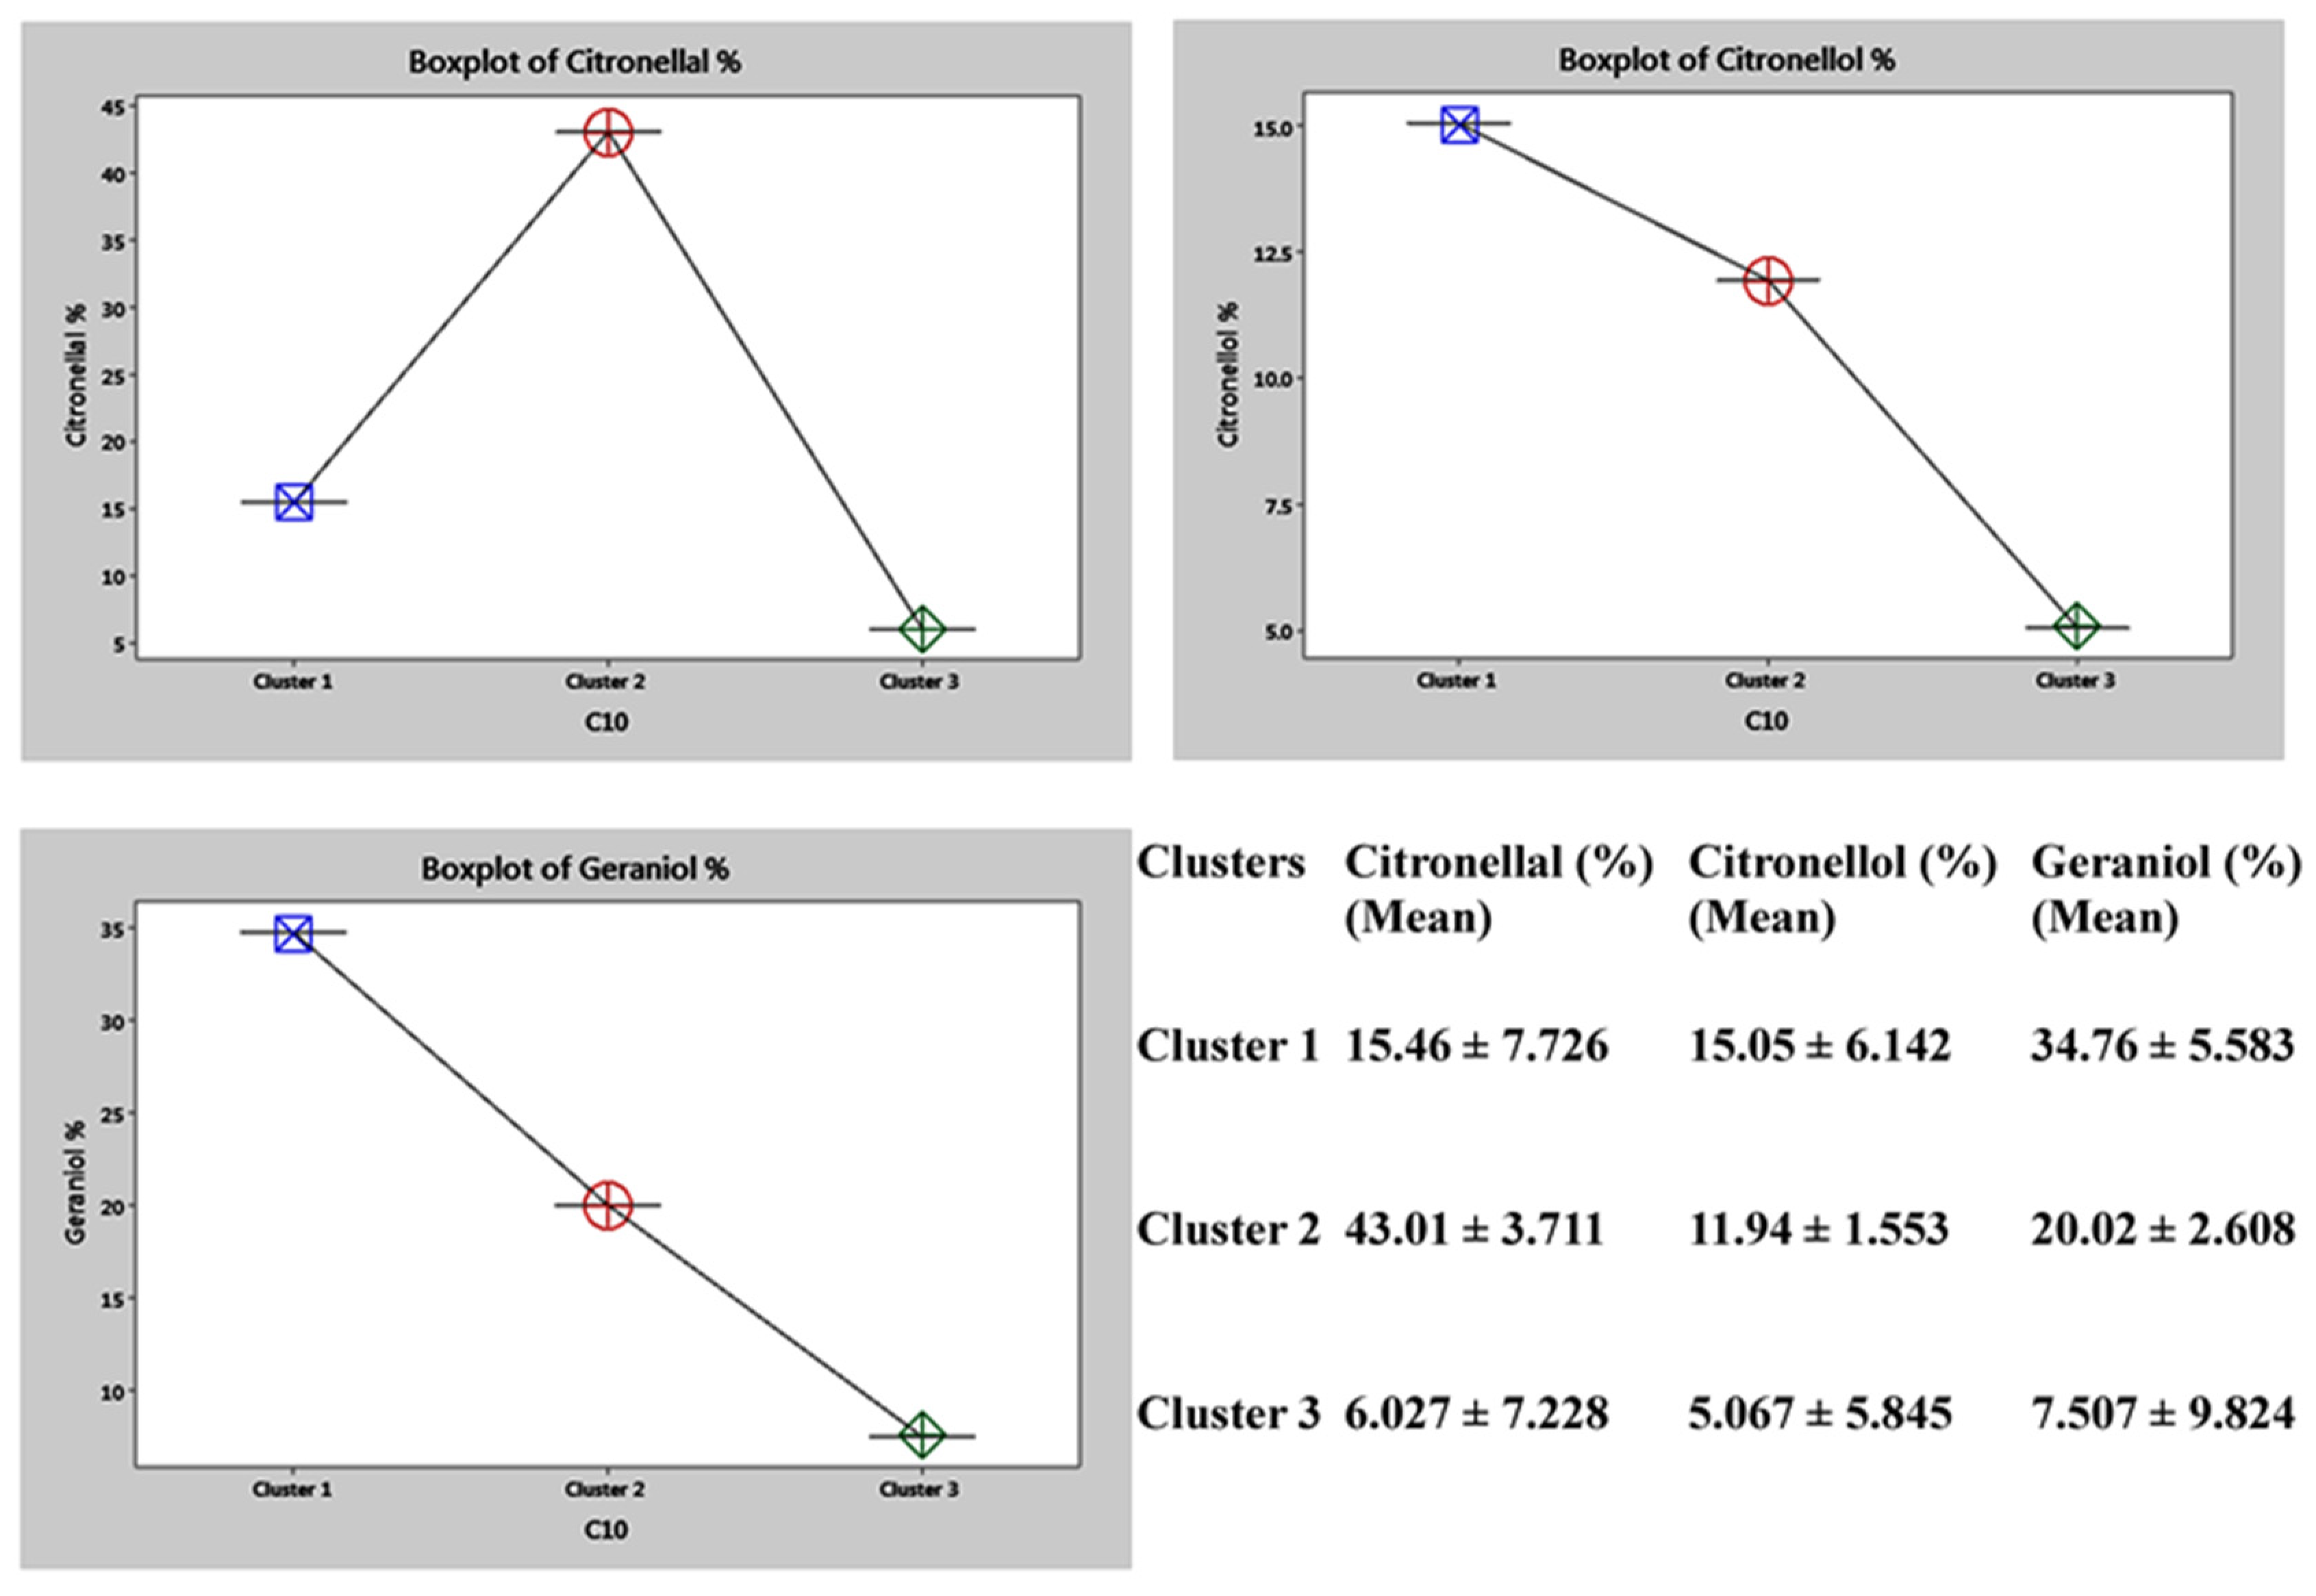
2.6. Genetic Diversity Based on Phytochemical Analysis of the Biomarkers

The qualitative and quantitative analyses were performed using GC-FID and GC-MS, which represented citronellal, citronellol and geraniol as the major compounds. These are the main biomarkers of the C. winterianus essential oil; therefore, only these three compounds were considered for a chemical diversity analysis. The maximum citronellal (51.450%), citronellol (26.389%) and geraniol (41.146%) were present in the genotype IC-0626993, IC-0627002 and IC-0627004 respectively This would serve as a good source for processing high grade pharmaceuticals, cosmetics and value-added products [30,67]. In all 72 accessions, the citronellal content differed from 2.578% to 51.450%, the citronellol content from 0.000% to26.389% and the geraniol content from 0.000% to 41.146% (Table 1), proving diversified germplasm. Previously, a new variant of C. winterianus with 1.2% essential oil and 35% citronellal content was developed through mutation breeding and registered as INGR-16021 [10,11]. The chemical profiling of C. winterianus showed citronellal content of more than 43% in the M 6–10 cultivar developed through mutagenesis, citronellol content of 15.3% in Mandakini, and geraniol content of 60% in Medini, identified through phenotypic selection [31]. Similarly, the present study demonstrated IC-0626993 as the best line for the citronellal content with 51.45%, while the genotypes IC-0627002 and IC-0627004 were rich in citronellol (26.38%) and geraniol (41.15%), respectively. All variants possessing high levels of the three measured constituents were identified through selection that may be further developed for superior lines. From the quantitative and qualitative analyses of the essential oil, IC-0627062 was identified as the ideal genotype with a commendable amount of the phytochemicals (citronellal: 48.48%, citronellol: 9.25% and geraniol: 20.48%). A GC chromatogram of germplasm (IC-0627062) is shown in Figure 7.
Apart from the molecular diversity analysis, a variation based on the essential oil constituents was performed by different researchers on different species of the genus Cymbopogon [36]. However, in the current study, diversity based on the phytochemical analysis of the essential oil was investigated in the same species of C. winterianus. Therefore, using these biomarkers, a dendrogram was constructed based on similarity, complete linkage and the Euclidean distance, which formed three clusters. Cluster I comprises nine accessions; Cluster II comprises fifty-eight, and the remaining five accessions come under Cluster III (Figure 8).
A boxplot graphical representation of these markers depicts that Cluster I involves the accessions with high citronellol and geraniol contents, while the Cluster II accessions were high in citronellal content. Cluster III comprises the accessions with low levels of the compounds measured (Figure 9).
Previously, it was reported that C. winterianus is different from C. nardus in the context of the major constituent of the essential oil because the former contains citronellol as the major component, while the later contains geraniol [68]. However, it was also proved that the production of phytochemicals might be due to genetic makeup and geographical variations [18,47]. The analysis of both phytochemical and molecular markers revealed different clustering, probably due to the incorporation of a locus-specific SSR marker concerning the genes not responsible for phytochemical biosynthesis [32].

3. Materials and Methods

3.1. Plant Materials

A total of 72 accessions of Java citronella were collected from different states (Assam, Arunachal Pradesh, Manipur and Meghalaya) in Northeast India. The GPS locations of the collected accessions were previously reported [69]. The plants were identified by the plant breeder of the Medicinal, Economic and Aromatic Plant (MAEP) Group of the CSIR-North East Institute of Science and Technology (NEIST). The accessions were planted during kharif 2016 and maintained at the NEIST Institutional experimental farm in Jorhat. The latitude and longitude of the experimental farm were recorded using the WGS84 geographical system as 26°44′15.6948′′ N and 94°9′25.4628′′ E, respectively. The pH of the experimental soil was 4.9 with a sandy loam texture. The NPK (nitrogen, phosphorus and potassium) available were 224, 115 and 142 kg/ha, respectively.

3.2. Genetic Diversity Analysis Based on Molecular Marker

3.2.1. Genomic DNA Extraction

The tender leaves of the C. winterianus germplasm were collected separately in different zip lock bags from the experimental farm of CSIR-NEIST, Jorhat. The leaf samples were cleaned, lyophilised for 48 h at −40 °C and tissue lysed in Tissue Lyser (Qiagen, Germany) using liquid nitrogen gas (N2) for 150 s at a frequency of 25 Hz. Genomic DNA extraction was carried using HiPurA™ Plant DNA Isolation Kit by CTAB method (Cetyl trimethylammonium bromide). The purity of the extracted DNA was checked using 0.8% agarose gel, and the bands observed were detected in a gel-documentation system (Eppendorf, Germany). The concentration was quantified using 3 µL of the stock DNA in a Nano Bio Spectrophotometer (Eppendorf, Germany) at λ260/ λ280 ratio. The stock DNA was further diluted to 30 ng/µL for PCR analysis using SSR marker.

3.2.2. SSR Primers–PCR Analysis

A total of 42 pairs of microsatellite (SSR) primers were screened, out of which the best amplifications were observed in 28 primer pairs, for the analysis of genetic diversity in the C. winterianus germplasm (Table 2). The reaction mixture for an SSR–PCR analysis consists of 6μL of working DNA (30 ng/µL), 1.6 μL each of forward and reverse primer (Bio Serve Biotechnologies, Hyderabad, India), 8.5 μL of 1X Hi-Chrome PCR Master Mix (Hi-Media, India) and 2.3 μL of double distilled water, making the total volume 20 μL. A Prima-96 (Hi-Media, India) thermocycler was used for amplification of the product with PCR programming of 94 °C (initial denaturation) for 3 min, then 35 cycles of denaturation for 30 s at 94 °C, annealing for 60 s at primer melting temperature (Tm) ±5 °C, extension for 90 s at 72 °C and final extension for 10 min at 72 °C. The amplified product along with 100 and 50 bp ladder (Hi-Media, India) was observed using 2% agarose gel in a 1× TBE buffer. Additionally, aliquots (15 µL) were also separated using 8% Polyacrylamide Gel Electrophoresis (PAGE). The acrylamide gel was stained with 0.5 mg/mL SYBR solution which is considered a safe stain for 25–30 min. The DNA bands in the gel were then visualised in a gel documentation system. Electrophoresis was run for 1 h at 100 constant voltages in the 1X TBE buffer.

3.2.3. Statistical Analysis of Data

The amplicons formed were observed in the gel documentation system and were scored to obtain the genetic variation. The Neighbour-Joining tree, distance matrix and principal coordinate analysis (PCA) were constructed based on Jaccard’s pairwise distance matrix using Darwin software version 6.0. Based on the polymorphism of the bands, the PIC (Polymorphic information content) percentage was calculated as follows: PIC = 1 − Σpi2, where Pi is the frequency of the ith allele [53]. Marker index (MI) was calculated using the formula MI = EMR × PIC where the effective multiplex ratio (EMR) is the product of a number and a fraction of the polymorphic loci [70,71], whereas resolving power (Rp) is the summation of the band informativeness [Ib = 1 − [2 × |0.5 − p|] and p is the proportion of individuals containing the band [71]. The genetic diversity variables, such as genetic differentiation degree (Gst), genetic diversity in the population (Ht), genetic diversity within the population (Hs), Shannon’s information index (I), number of observed alleles (na), number of effective alleles (ne) and Nei’s gene diversity (h), were calculated using the POPGENE (Version-1.31) software package [72]. The inter-specific and intra-specific genetic diversities were determined using analysis of molecular variance (AMOVA) with the help of GenAlex software Version 6.5 [73]. The genetic relationships among the 72 accessions were established using 28 SSR primers and utilizing a model-based population structure, which was performed using STRUCTURE software Version 2.3.4. The software was run multiple times by setting k (the number of populations) from 3 to 10, and the length of the burn-in period and number of Markov Chain Monte Carlo (MCMC) replications were set at 100,000 for each run for all 72 accessions in order to evaluate the number of populations. An online tool called Structure Harvester was used to calculate the most probable genetic population groups from the study.

3.3. Quantitative and Qualitative Analysis of the Citronellal, Citronellol and Geraniol (Biomarkers) by GC-FID and GC-MS

3.3.1. Extraction of Essential Oil

The extraction of essential oil was carried out by boiling 300 g of fresh leaves of C. winterianus in water using a 3-litre capacity Clevenger apparatus for 3½ h in three replicates. The essential oil produced was measured, collected and treated with anhydrous sodium sulphate (Na2SO4) to remove excess moisture present and was stored in 4 °C for qualitative and quantitative analysis.

3.3.2. Essential Oil Analysis

For the qualitative and quantitative evaluation of the major phytochemical biomarkers, a GC-FID and GC-MS analysis of the essential oil was carried out using the following instrument and GC conditions (Table 6) [69]:
The identification of the major components was done by comparing the retention time of the standard samples (Sigma Aldrich, Germany and Hi-media, India) with the same GC conditions, and the percentages of the compounds were determined by an area normalization method. In GC-MS, the mass spectra of the obtained peaks were identified by comparison with the NIST/WILEY Mass Spectral Library and retention indices within the literature.

3.3.3. Statistical Analysis

MINITAB 16.0 software (Minitab Inc, State College, PA, USA) was used to evaluate the analysis of the variances (ANOVA) for the quantitative data of citronellal, citronellol and geraniol, followed by dendrogram clustering based on complete linkage and Euclidean distance.

4. Conclusions

C. winterianus is a plant of high industrial importance because of its yielding capacity for essential oil and its compounds of high pharmaceutical importance. Therefore, preservation and conservation is highly recommended for proper utilisation of the crop in breeding programmes. Several breeding techniques, such as molecular, mutation and selection breeding, are the most suitable measures for the development of high-yielding varieties. Successful breeding depends upon genetic diversity and information about the accessions collected from different places. Therefore, diversity based on phytochemical and molecular markers was studied to differentiate the accessions into different clusters. Depending on the requirement of the particular constituents, genotypes could be selected for the development of recombinant lines with desirable characteristics. The recombinant lines may contain more essential oil with a highly valuable lead molecule. The knowledge obtained by this study would also enhance the information regarding the phylogeny of different accessions and would enrich the gene bank. The findings would help in adopting proper conservation strategies by minimizing the risk of extinction of the elite lines. Most importantly, the scientific community, academicians, and the commercial sector would benefit highly by utilizing this research work for plant improvement programmes.

Author Contributions

Conceptualization, M.L. and S.M.; methodology, M.L., S.M. and R.J.S.; software, S.M. and N.S.; validation, M.L., S.B. and A.G.; formal analysis, S.M. and N.S.; investigation, M.L. and S.M.; resources, M.L.; data curation, S.M., R.J.S., T.B. and R.T.; writing—original draft preparation, S.M.; writing—review and editing, M.L.; visualization, T.B.; supervision, M.L.; project administration, M.L. All authors have read and agreed to the published version of the manuscript.

Funding

This research was funded by SERB New Delhi Grant Number: YSS/2014/00314.

Institutional Review Board Statement

Not applicable.

Informed Consent Statement

Not applicable.

Data Availability Statement

Data is contained within the article.

Acknowledgments

The authors are thankful to CSIR-NEIST, Jorhat, for providing the necessary facilities and encouraging us throughout the work.

Conflicts of Interest

The authors declare no conflict of interest.

Appendix A

Table A1. The allele frequency divergences among and within (bold) populations were computed using point estimates of P.
Pop IPop IIPop IIIPop IVPop VPop VI
Pop I0.12150.15890.13770.06200.11440.0999
Pop II 0.17740.09800.17930.09770.0804
Pop III 0.23950.11710.08420.0913
Pop IV 0.13860.12400.1124
Pop V 0.22960.0707
Pop VI 0.1666
Figure A1. Gel image of primer 15CM3334 depicting diversity in C. winterianus germplasm.
Plants 11 00528 g0a1

References

  1. Bhattacharya, S.; Bandopadhyay, T.K.; Ghosh, P.D. Efficiency of RAPD and ISSR markers in assessment of molecular diversity in elite germplasms of Cymbopogon winterianus across West Bengal, India. Emir. J. Food Agric. 2010, 1, 13–24. [Google Scholar] [CrossRef] [Green Version]
  2. Paterson, A.H.; Tanksley, S.D.; Sorrells, M.E. DNA markers in plant improvement. Adv. Agron. 1991, 46, 39–90. [Google Scholar]
  3. Perrino, E.V.; Perrino, P. Crop wild relatives: Know how past and present to improve future research, conservation and utilization strategies, especially in Italy: A review. Resour. Crop Evol. 2020, 67, 1067–1105. [Google Scholar] [CrossRef]
  4. Adhikari, S.; Saha, S.; Bandyopadhyay, T.K.; Ghosh, P. Efficiency of ISSR marker for characterization of Cymbopogon germplasms and their suitability in molecular barcoding. Plant Syst. Evol. 2015, 301, 439–450. [Google Scholar] [CrossRef]
  5. Lal, M.; Munda, S.; Dutta, S.; Pandey, S.K. Identification of a novel germplasm (Jor Lab L-9) of lemon grass (Cymbopogon khasianus) rich in methyl eugenol. Crop Breed. Appl. Biotechnol. 2020, 3, e320720315. [Google Scholar] [CrossRef]
  6. Dutta, S.; Munda, S.; Lal, M.; Bhattacharyya, P.R. A short review on Chemical composition, therapeutic use and enzyme inhibition activities of Cymbopogon species. Indian J. Sci. Technol. 2016, 9, 1–9. [Google Scholar] [CrossRef]
  7. Lal, M.; Dutta, S.; Munda, S.; Pandey, S.K. Novel high value elemicin-rich germplasm of Lemon grass (Cymbopogn khasianus (hack) Staf (ex Bor) from North East India. Ind. Crops Prod. 2018, 115, 98–103. [Google Scholar] [CrossRef]
  8. Deka, H.; Deka, S.; Baruah, C.K.; Das, J.; Hoque, S.; Sarma, N.S. Vermicomposting of distillation waste of citronella plant (Cymbopogon winterianus Jowitt.) employing Eudrilus eugeniae. Bioresour. Technol. 2011, 102, 6944–6950. [Google Scholar]
  9. Dey, T.; Saha, S.; Ghosh, P.D. Somaclonal variation among somatic embryo derived plants-Evaluation of agronomically important somaclones and detection of genetic changes by RAPD in Cymbopogon winterianus. S. Afr. J. Bot. 2015, 96, 112–121. [Google Scholar] [CrossRef] [Green Version]
  10. Lal, M.; Dutta, S.; Bhattacharyya, P.R. Development of a new superior variety (Jor Lab C-5) of Java Citronella with characteristics of stable and high oil yield. Ann. Biol. 2016, 32, 22–23. [Google Scholar]
  11. Lal, M. Jor Lab C-5 (IC0619027; INGR16021), a Java citronella (Cymbopogon winterianus Jowitt) germplasm with high herbage yield with high essential oil content. Indian J. Plant Genet. Resour. 2018, 31, 118. [Google Scholar]
  12. Simic, A.; Rancic, A.; Sokovic, M.D.; Ristic, M.; Grujic-Jovanovic, S.; Vukojevic, J.; Marin, P.D. Essential oil composition of Cymbopogon winterianus and Carum carvi and their antimicrobial activities. Pharm. Biol. 2008, 46, 437–441. [Google Scholar] [CrossRef] [Green Version]
  13. Lawless, J. The Encyclopaedia of Essential Oils; Thorsons: London, UK, 2002; pp. 70–83. [Google Scholar]
  14. Quintans-Junior, L.J.; Souza, T.T.; Leite, B.S.; Lessa, N.M.; Bonjardim, L.R.; Santos, M.R.; Alves, P.B.; Blank, A.F.; Antoniolli, A.R. Phytochemical screening and anticonvulsant activity of Cymbopogon winterianus Jowitt (Poaceae) leaf essential oil in rodents. Phytomedicine 2008, 15, 619–624. [Google Scholar] [CrossRef]
  15. Munda, S.; Dutta, S.; Pandey, S.K.; Sarma, N.; Lal, M. Antimicrobial activity of essential oils of medicinal and aromatic plants of the North east India: A biodiversity hot spot. J. Essent. Oil Bear. Pl. 2019, 2, 105–119. [Google Scholar] [CrossRef]
  16. Ganjewala, D. Cymbopogon essential oils: Chemical compositions and bioactivities. Int. J. Essent. Oil Ther. 2009, 3, 56–65. [Google Scholar]
  17. Ganjewala, D.; Gupta, A.K. Lemongrass (Cymbopogon flexuosus Steud.) wats essential oil: Overview and biological activities. Essent. Oils II RPMP 2016, 37, 232–274. [Google Scholar]
  18. Kumar, V.; Roy, B.K. Population authentication of the traditional medicinal plant Cassia tora L. based on ISSR markers and FTIR analysis. Sci. Rep. 2018, 8, 10714. [Google Scholar] [CrossRef] [PubMed]
  19. Perrino, E.V.; Valerio, F.; Jallali, S.; Trani, A.; Mezzapesa, G.N. Ecological and biological properties of Satureja cuneifolia and Thymus spinulosus Ten.: Two wild officinal species of conservation concern in Apulia (Italy). A preliminary survey. Plants 2021, 10, 1952. [Google Scholar] [CrossRef]
  20. Cassel, E.; Vargas, R.M.F. Experiments and modeling of the Cymbopogon winterianus essential oil extraction by steam distillation. J. Mex. Chem. Soc. 2006, 50, 126–129. [Google Scholar]
  21. Sousa, D.P.; Gonclaves, J.C.R.; Quintans, J.L.; Cruz, J.S.; Araujo, D.A.M.; Almeida, R.N. Study of anticonvulsant effect of citronellol, a monoterpene alcohol, in rodents. Neurosci. Lett. 2006, 401, 231–235. [Google Scholar] [CrossRef]
  22. Gogoi, R.; Loying, R.; Sarma, N.; Munda, S.; Pandey, S.; Lal, M. A comparative study on antioxidant, anti-inflammatory, genotoxicity, anti-microbial activities and chemical composition of fruit and leaf essential oils of Litsea cubeba Pers. from North-east India. Ind. Crops Prod. 2018, 125, 131–139. [Google Scholar] [CrossRef]
  23. Sultanbawa, Y. Essential oils in food application: Australian aspects. In Essential Oils in Food Preservation, Flavor and Safety; Preedy, V.R., Ed.; Elsevier: Amsterdam, The Netherlands, 2016; pp. 155–159. [Google Scholar]
  24. Silva, Y.M.S.; Silva, M.T.A.; Sampaio, P.A.; Quintans, J.S.S.; Qunitans-Junior, L.J.; Ribeiro, L.A.A. Relaxant effect of carvacrol, citronellal and p-cymene, monoterpenes present in Thymus and Cymbopogon species, in guinea-pig trachea: A comparative study. J. Med. Plant Res. 2014, 8, 881–888. [Google Scholar]
  25. Burdock, G.A. Fenaroli’s Handbook of Flavor Ingredients, 6th ed.; CRC Press Taylor and Francis Group: London, UK; New York, NY, USA, 2010; pp. 733–734. [Google Scholar]
  26. Chen, W.; Viljoen, A.M. Geraniol-A review of a commercially important fragrance material. S. Afr. J. Bot. 2010, 76, 643–651. [Google Scholar] [CrossRef] [Green Version]
  27. Lal, M.; Borah, A.; Pandey, S.K. Identification of a new high geraniol rich variety “Jor Lab L-15” of Lemongrass [Cymbopogon khasianus (Hack) Stapf (ex Bor)]. J. Essent. Oil Bear. Pl. 2019, 22, 972–978. [Google Scholar] [CrossRef]
  28. Surburg, H.; Panten, J. Common Fragrance and Flavor Materials: Preparation, Properties and Uses, 5th ed.; Wiley: Weinheim, Germany, 2006. [Google Scholar]
  29. Heiba, H.I.; Rizk, A.M. Constituents of Cymbopogon species. Qatar Univ. Sci. Bull. 1986, 6, 53–75. [Google Scholar]
  30. Munda, S.; Lal, M. Cymbopogon winterianus Jowitt ex Bor, a Hub for various industrial and pharmaceutical applications. In Botanical Leads for Drug Discovery; Singh, B., Ed.; Springer: Singapore, 2020; pp. 405–419. [Google Scholar] [CrossRef]
  31. Shasany, A.K.; Lal, R.K.; Patra, N.K.; Darokar, M.P.; Garg, A.; Kumar, S.; Khanuja, S.P.S. Phenotypic and RAPD diversity among Cymbopogon winterianus Jowitt accessions in relation to Cymbopogon nardus Rendle. Genet. Resour. Crop Evol. 2000, 47, 553–559. [Google Scholar] [CrossRef]
  32. Kumar, J.; Verma, V.; Goyal, A.; Shahi, A.K.; Sparoo, R.; Sangwan, R.S.; Qazi1, G.N. Genetic diversity analysis in Cymbopogon species using DNA markers. Plant Omics 2009, 2, 20–29. [Google Scholar]
  33. Munda, S.; Dutta, S.; Lal, M. Variability estimation and genetic divergence in Cymbopogon winterianus for development of superior genotype. Agron. J. 2020, 113, 993–1007. [Google Scholar] [CrossRef]
  34. Gupta, A.K.; Ganjewala, D. A study on developmental changes in essential oil content and composition in Cymbopogon flexuosus cultivar Suvarna. Acta Biol. Szeged. 2015, 59, 119–125. [Google Scholar]
  35. Baruah, J.; Gogoi, B.; Das, K.; Ahmed, N.M.; Sarmah, D.K.; Lal, M.; Bhau, B.S. Genetic diversity study amongst Cymbopogon species from NE-India using RAPD and ISSR markers. Ind. Crops Prod. 2016, 95, 235–243. [Google Scholar] [CrossRef]
  36. Sangwan, N.S.; Yadav, U.; Sangwan, R.S. Molecular analysis of genetic diversity in elite Indian cultivars of essential oil trade types of aromatic grasses (Cymbopogon species). Plant Cell Rep. 2001, 20, 437–444. [Google Scholar] [CrossRef]
  37. Herrera, M.R.; Ghislain, M. Robust and inexpensive SSR markers analyses using LI-COR DNA analyzer. Microsatellites 2013, 1006, 197–205. [Google Scholar]
  38. Naghavi, M.R.; Mardi, M.; Pirseyedi, S.M.; Kazemi, M.; Potki, P.; Ghaffari, M.R. Comparison of genetic variation among accessions of Aegilops tauschii using AFLP and SSR markers. Genet. Resour. Crop. Evol. 2007, 54, 237–240. [Google Scholar] [CrossRef]
  39. Henkrar, F.; El-Haddoury, J.; Ouabbou, H.; Nsarellah, N.; Iraqi, D.; Bendaou, N.; Udupa, S.M. Genetic diversity reduction in improved durum wheat cultivars of Morocco as revealed by microsatellite markers. Sci. Agric. 2016, 73, 134–141. [Google Scholar] [CrossRef] [Green Version]
  40. Abbasov, M.; Akparov, Z.; Gross, T.; Babayeva, S.; Izzatullayeva, V.; Hajiye, E.; Rustamov, K.; Gross, P.; Tekin, M.; Akar, T.; et al. Genetic relationship of diploid wheat (Triticum spp.) species assessed by SSR markers. Genet. Resour. Crop Evol. 2018, 65, 1441–1453. [Google Scholar] [CrossRef]
  41. Song, Q.J.; Shi, J.R.; Singh, S.; Fickus, E.W.; Costa, J.M.; Lewis, J.; Gill, B.S.; Ward, R.; Cregan, P.B. Development and mapping of microsatellite (STMS) markers in wheat. Theor. Appl. Genet. 2005, 110, 550–560. [Google Scholar] [CrossRef] [PubMed]
  42. Baruah, J.; Pandey, S.K.; Sarmah, N.; Lal, M. Assessing molecular diversity among high capsaicin content lines of Capsicum chinense Jacq. using simple sequence repeat marker. Ind. Crops Prod. 2019, 141, 111769. [Google Scholar] [CrossRef]
  43. Hajiyev, E.S.; Akparov, Z.I.; Aliyev, R.T.; Saidova, S.V.; Izzatullayeva, V.I.; Babayeva, S.M.; Abbasov, M.A. Genetic polymorphism of durum wheat (Triticum durum Desf.) accessions of Azerbaijan. Russ. J. Genet. 2015, 51, 863–870. [Google Scholar] [CrossRef]
  44. Abbasov, M.; Brueggeman, R.; Raupp, J.; Akparov, Z.; Aminov, N.; Bedoshvili, D.; Gross, T.; Gross, P.; Babayeva, S.; Izzatullayeva, V.; et al. Genetic diversity of Aegilops L. species from Azerbaijan and Georgia using SSR markers. Genet. Resour. Crop Evol. 2019, 66, 453–463. [Google Scholar] [CrossRef]
  45. Kaur, P.; Pandeya, D.K.; Gupta, R.C.; Dey, A. Assessment of genetic diversity among different population of five Swertia species by using molecular and phytochemical markers. Ind. Crops Prod. 2019, 138, 111569. [Google Scholar] [CrossRef]
  46. Hyun, D.Y.; Gi, G.Y.; Sebastin, R.; Cho, G.T.; Kim, S.H.; Yoo, E.; Lee, S.; Son, D.M.; Lee, K.J. Utilization of phytochemical and molecular diversity to develop a target-oriented core collection in tea germplasm. Agronomy 2020, 10, 1667. [Google Scholar] [CrossRef]
  47. Qaderi, A.; Omidi, M.; Pour-Aboughadareh, A.; Poczai, P.; Shaghaghi, J.; Mehrafarin, A.; Nohooji, M.G.; Etminan, A. Molecular diversity and phytochemical variability in the Iranian poppy (Papaver bracteatum Lindl.): A baseline for conservation and utilization in future breeding programmes. Ind. Crops Prod. 2019, 130, 237–247. [Google Scholar] [CrossRef]
  48. Ray, A.; Jena, S.; Haldar, T.; Sahoo, A.; Kar, B.; Patnaik, J.; Ghosh, B.; Panda, P.C.; Mahapatra, N.; Nayak, S. Population genetic structure and diversity analysis in Hedychium coronarium populations using morphological, phytochemical and molecular markers. Ind. Crops Prod. 2019, 132, 118–133. [Google Scholar] [CrossRef]
  49. Saikia, D.; Dutta, S.; Ghosh, S.; Lal, M.; Bhau, B.S. RAPD and ISSR based intra-specific molecular genetic diversity analysis of Cymbopogon flexuosus L. Stapf with a distinct correlation of morpho-chemical observations. Res. J. Biotechol. 2015, 10, 105–113. [Google Scholar]
  50. Lal, N.; Awasthi, S.K. A comparative assessment of molecular marker assays (AFLP and RAPD) for Cymbopogon germplasm characterization. World J. Pharm. Res. 2015, 4, 1019–1041. [Google Scholar]
  51. Bishoyi, A.K.; Sharma, A.; Kavane, A.; Geetha, K.A. Varietal discrimination and genetic variability analysis of Cymbopogon using RAPD and ISSR markers analysis. Appl. Biochem. Biotechnol. 2016, 179, 659–670. [Google Scholar] [CrossRef] [PubMed]
  52. Paw, M.; Borah, A.; Pandey, S.K.; Baruah, J.; Begum, T.; Lal, M. Simple sequence repeat marker based genetic diversity assessment amongst high essential oil yielding lines of Curcuma caesia Roxb. Genet. Resour. Crop Evol. 2021, 6, 1345–1358. [Google Scholar] [CrossRef]
  53. Botstein, D.; White, R.L.; Skolnick, M.; Davis, R.W. Construction of a genetic linkage map in man using restriction fragment length polymorphisms. Am. J. Hum. Genet. 1980, 32, 314–331. [Google Scholar]
  54. Slatkin, M. Gene flow and geographic structure of natural populations. Science 1987, 236, 787–792. [Google Scholar] [CrossRef]
  55. Zheng, W.H.; Zhuo, Y.; Liang, L.; Ding, W.Y.; Liang, L.Y.; Wang, X.F. Conservation and population genetic diversity of Curcuma wenyujin (Zingiberaceae), a multifunctional medicinal herb. Genet. Mol. Res. 2015, 14, 10422–10432. [Google Scholar] [CrossRef]
  56. Saitou, N.; Nei, M. The neighbour joining method: A new method for reconstructing phylogenetic trees. Mol. Biol. Evol. 1987, 4, 406–425. [Google Scholar]
  57. Harsono, T.; Pasaribu, N.; Fitmawati, F.; Sobir, S.; Prasetya, E. Genetic variability and classification of Gandaria (Bouea) in Indonesia based on inter simple sequence repeat (ISSR) markers. SABRAO J. Bred. Genet. 2018, 50, 129–144. [Google Scholar]
  58. Wold, S.; Esbensen, K.; Geladi, P. Principal component analysis. Chemometr. Intell. Lab. Syst. 1987, 2, 37–52. [Google Scholar] [CrossRef]
  59. Luo, C.; Chen, D.; Cheng, X.; Liu, H.; Li, Y.; Huang, C. SSR analysis of genetic relationship and classification in Chrysanthemum germplasm Collection. Hortic. Pl. J. 2018, 4, 73–82. [Google Scholar] [CrossRef]
  60. Rajwade, A.V.; Arora, R.S.; Kadoo, N.Y.; Harsulkar, A.M.; Ghorpade, P.B.; Gupta, V.S. Relatedness of Indian flax genotypes (Linum usitatissimum L.): An inter-simple sequence repeat (ISSR) primer assay. Mol. Biotechnol. 2010, 45, 161–170. [Google Scholar] [CrossRef]
  61. Excoffier, L.; Smouse, P.E.; Quattro, J.M. Analysis of molecular variance inferred from metric distances among DNA haplotypes: Application to human mitochondrial DNA restriction data. Genetics 1992, 131, 479–491. [Google Scholar] [CrossRef]
  62. Grunwald, N.J.; Everhart, S.E.; Knaus, B.J.; Kamvar, Z.N. Best practices for population genetic analyses. Phytopathology 2017, 107, 1000–1010. [Google Scholar] [CrossRef] [PubMed] [Green Version]
  63. Hogbin, P.M.; Peakall, R. Evaluation of the conservation of genetic research to the management of endangered plant. Zieriaprostrata Conserv. Biol. 1999, 13, 514–522. [Google Scholar]
  64. Khanlou, K.M.; Vandepitte, K.; Asl, L.K.; Bockstaele, E.V. Towards an optimal sampling strategy for assessing genetic variation within and among white clover (Trifolium repens L.) cultivars using AFLP. Genet. Mol. Biol. 2011, 34, 252–258. [Google Scholar] [CrossRef]
  65. Young, A.; Merriam, H.; Warwick, S. The effects of forest fragmentation on genetic variation in Acer saccharum Marsh. (sugar maple) populations. Heredity 1993, 71, 277–289. [Google Scholar] [CrossRef] [Green Version]
  66. Flather, C.H.; Bevers, M. Patchy reaction-diffusion and population abundance: The relative importance of habitat amount and arrangement. Am. Nat. 2002, 159, 40–56. [Google Scholar] [CrossRef] [PubMed]
  67. Verma, R.S.; Singha, S.; Padalia, R.C.; Tandon, S.; Venkatesh, K.T.; Chauhan, A. Essential oil composition of the sub-aerial parts of eight species of Cymbopogon (Poaceae). Ind. Crops Prod. 2019, 142, 111839. [Google Scholar] [CrossRef]
  68. Sangwan, R.S.; Sangwan, N.S. Metabolic analysis of oil-chemotypic diversity in Cymbopogons. In Cymbopogons: The Aromatic Grass Monograph; Kumar, S., Dwivedi, S., Kukreja, A.K., Sharma, J.R., Bagchi, G.D., Eds.; CIMAP: Lucknow, India, 2000; pp. 223–247. [Google Scholar]
  69. Munda, S.; Sarma, N.; Lal, M. G × E interaction of 72 accessions with three year evaluation of Cymbopogon winterianus Jowitt. using regression coefficient and Additive Main effects and Multiplicative Interaction model (AMMI). Ind. Crops Prod. 2020, 146, 112169. [Google Scholar] [CrossRef]
  70. Milbourne, D.; Meyer, R.; Bradshaw, J.E.; Baird, E.; Bonar, N.; Provan, J.; Powell, W.; Robbie, W. Comparison of PCR-based marker systems for the analysis of genetic relationships in cultivated potato. Mol. Breed. 1997, 3, 127–136. [Google Scholar] [CrossRef]
  71. Prevost, A.; Wilkinson, M.J. A new system of comparing PCR primers applied to ISSR fingerprinting of potato cultivars. Theor. Appl. Genet. 1999, 98, 107–112. [Google Scholar] [CrossRef]
  72. Yeh, F.C.; Yang, R.C.; Boyle, T. POPGENE 1.32: A Free Program for the Analysis of Genetic Variation among and within Populations Using Co-Dominant and Dominant Markers. 2000. Available online: https://agris.fao.org/agris-search/search.do?recordID=GB2012106241 (accessed on 7 January 2022).
  73. Peakall, R.; Smouse, P.E. GenAlEx 6: Genetic analysis in Excel. Population genetic software for teaching and research. Mol. Ecol. Notes 2006, 6, 288–295. [Google Scholar] [CrossRef]
Figure 1. Gel image of bands formed for 72 accessions of C. winterianus using primer 3CM0506.
Plants 11 00528 g001
Figure 2. Dendrogram based on N-J Method representing three clusters in C. winterianus germplasm. Numbers indicated in the dendrogram represent serial number of C. winterianus accessions.
Plants 11 00528 g002
Figure 3. Dendrogram based on Nei’s genetic distance between populations of C. winterianus.
Plants 11 00528 g003
Figure 4. Principal component analysis of all accessions of C. winterianus collected from different regions of NE India.
Plants 11 00528 g004
Figure 5. Estimation of relevant number of genetic populations in 72 accessions of C. winterianus.
Plants 11 00528 g005
Figure 6. Model-based population structure analysis of 72 accessions of C. winterianus.
Plants 11 00528 g006
Figure 7. Chromatogram representing GC analysis of the best line (IC-0627062) with high phytochemical contents (citronellal, citronellol and geraniol).
Plants 11 00528 g007
Figure 8. Dendrogram constructed based on the phytochemical diversity of C. winterianus accessions, representing three major clusters. The numbers indicated in the dendrogram represent the serial number of the C. winterianus accessions.
Plants 11 00528 g008
Figure 9. Boxplot of the major phytochemical markers along with their cluster mean values.
Plants 11 00528 g009
Table 1. Indigenous collection number (IC) and GPS locations of different collected accessions of C. winterianus along with their major phytochemical constituents in percentage.
S. NoIC. No.Collection SiteCitronellal %Citronellol %Geraniol %
1IC-0627004Tinsukia/Tinsukia/Assam3.745 ± 0.09820.433 ± 0.02141.146 ± 0.058
2IC-0627019Senapati/Senapati/Manipur43.404 ± 0.06714.935 ± 0.05520.188 ± 0.041
3IC-0627018Senapati/Senapati/Manipur42.934 ± 0.01511.264 ± 0.07122.437 ± 0.034
4IC-0627017Churachandpur/Churachandpur/Manipur42.641 ± 0.05311.374 ± 0.01723.270 ± 0.062
5IC-0627016Chandel/Chandel/Manipur41.843 ± 0.0679.862 ± 0.04822.323 ± 0.056
6IC-0627006Tinsukia/Tinsukia/Assam43.333 ± 0.01915.018 ± 0.00313.339 ± 0.005
7IC-0627005Dibrugarh/Dibrugarh/Assam42.196 ± 0.05511.234 ± 0.02218.851 ± 0.037
8IC-0627003Titabar/Jorhat/Assam4.485 ± 0.08323.000 ± 0.04139.842 ± 0.075
9IC-0627002Titabar/Jorhat/Assam5.723 ± 0.08026.389 ± 0.05231.448 ± 0.005
10IC-0626993Tippi/West Kameng/AP51.450 ± 0.04810.064 ± 0.08719.320 ± 0.075
11IC-0626991Nongpoh/Ri Bhoi/Meghalaya42.501 ± 0.06314.311 ± 0.01417.301 ± 0.042
12IC-0627064Birjhora T.E/Bongaigaon/Assam19.975 ± 0.05111.143 ± 0.01829.912 ± 0.037
13IC-0627065Moijonga/Goalpara/Assam46.511 ± 0.06313.747 ± 0.02719.304 ± 0.079
14IC-0627063Birjhora T.E/Bongaigaon/Assam46.022 ± 0.01811.919 ± 0.04618.807 ± 0.031
15IC-0627062Dejoo T.E/North Lakhimpur/Assam48.477 ± 0.0579.245 ± 0.06120.480 ± 0.028
16IC-0627058Siajuli T.E/North Lakhimpur/Assam47.383 ± 0.06311.282 ± 0.07414.979 ± 0.052
17IC-0627057Dejoo T.E/North Lakhimpur/Assam46.658 ± 0.03810.329 ± 0.14020.040 ± 0.097
18IC-0627056Siajuli T.E/North Lakhimpur/Assam46.606 ± 0.07111.425 ± 0.04417.554 ± 0.086
19IC-0627052Tingkhong T.E/Dibrugarh/Assam46.287 ± 0.08310.728 ± 0.05218.898 ± 0.029
20IC-0627051Sarojini T.E/Dibrugarh/Assam46.411 ± 0.04611.971 ± 0.06116.671 ± 0.018
21IC-0627050Birjhora/Bongaigaon/Assam42.738 ± 0.02212.880 ± 0.07120.242 ± 0.034
22IC-0627049Manjha/Karbianglong/Assam48.744 ± 0.01112.182 ± 0.05815.282 ± 0.029
23IC-0627048Manjha/Karbianglong/Assam45.785 ± 0.04211.419 ± 0.03020.443 ± 0.057
24IC-0627047Manjha/Karbianglong/Assam40.192 ± 0.05712.722 ± 0.09224.037 ± 0.023
25IC-0627046Manjha/Karbianglong/Assam41.200 ± 0.0148.999 ± 0.05221.093 ± 0.075
26IC-0627045Manjha/Karbianglong/Assam38.411 ± 0.05211.272 ± 0.03724.342 ± 0.049
27IC-0627044Manjha/Karbianglong/Assam37.405 ± 0.04311.925 ± 0.06222.823 ± 0.057
28IC-0627042Manjha/Karbianglong/Assam38.166 ± 0.05111.753 ± 0.00923.059 ± 0.036
29IC-0627041Manjha/Karbianglong/Assam40.901 ± 0.03411.049 ± 0.05718.885 ± 0.044
30IC-0627040Manjha/Karbianglong/Assam40.860 ± 0.05211.993 ± 0.04321.321 ± 0.071
31IC-0627039Manjha/Karbianglong/Assam42.306 ± 0.04912.591 ± 0.02720.396 ± 0.052
32IC-0627038Powai/Tinsukia/Assam38.345 ± 0.06111.878 ± 0.03322.924 ± 0.038
33IC-0627037Raidang/Tinsukia/Assam43.995 ± 0.05713.729 ± 0.06122.272 ± 0.041
34IC-0627036Sokriting T.E./Tinsukia/Assam18.938 ± 0.04312.122 ± 0.02511.734 ± 0.076
35IC-0627033Moranhat/Dibrugarh/Assam31.997 ± 0.06212.288 ± 0.05922.196 ± 0.071
36IC-0627035Panitola/Tinsukia/Assam47.569 ± 0.05511.116 ± 0.04918.029 ± 0.038
37IC-0627034Bogapani/Tinsukia/Assam35.657 ± 0.03710.261 ± 0.08224.533 ± 0.051
38IC-0627032Sepon T.E/Dibrugarh/Assam39.754 ± 0.02111.103 ± 0.07622.976 ± 0.039
39IC-0627031Gangabari T.E./Tinsukia/Assam19.057 ± 0.0699.474 ± 0.04838.826 ± 0.082
40IC-0627028Angkailongdi/Senapati/Manipur40.541 ± 0.07511.978 ± 0.02422.376 ± 0.061
41IC-0627030Tuithapi/Churachandpur/Manipur46.781 ± 0.04313.714 ± 0.03720.406 ± 0.050
42IC-0627026Japhou/Chandel/Manipur44.400 ± 0.01912.677 ± 0.09519.164 ± 0.039
43IC-0627027Kalika/Imphal East/Manipur41.479 ± 0.03811.134 ± 0.04221.566 ± 0.017
44IC-0627024Gumte/East Kameng/AP49.090 ± 0.01313.578 ± 0.07417.144 ± 0.042
45IC-0627025Silluk/East Siang/AP38.012 ± 0.03210.726 ± 0.05622.645 ± 0.013
46IC-0627023Jangda/Tawang/AP45.200 ± 0.06811.486 ± 0.05719.139 ± 0.065
47IC-0627022Boleng/East Siang/AP36.825 ± 0.0249.661 ± 0.04920.483 ± 0.039
48IC-0627021Picha/Kurungkumey/AP42.863 ± 0.05515.486 ± 00821.574 ± 0.027
49IC-0627054Sarojini T.E/Dibrugarh/Assam43.105 ± 0.03714.106 ± 0.02918.136 ± 0.034
50IC-0627043Manjha/Karbianglong/Assam41.864 ± 0.02213.929 ± 0.04523.171 ± 0.017
51IC-0626995Itanagar/Itanagar/AP20.119 ± 0.03914.112 ± 0.01735.834 ± 0.045
52IC-0627060Ananda T.E/North Lakhimpur/Assam49.543 ± 0.04610.153 ± 0.01318.670 ± 0.082
53IC-0627055Birjhora T.E/Bongaigaon/Assam44.487 ± 0.06111.503 ± 0.07212.079 ± 0.042
54IC-0626994Jang/Tawang/AP42.225 ± 0.04613.442 ± 0.09517.160 ± 0.052
55IC-0627059Dolohat T.E/North Lakhimpur/ Assam45.059 ± 0.07413.200 ± 0.02416.611 ± 0.059
56IC-0627012Karbianglong/Karbianglong/Assam22.730 ± 0.04311.733 ± 0.02722.741 ± 0.038
57IC-0626998Golaghat/Golaghat/Assam43.068 ± 0.0529.637 ± 0.07821.123 ± 0.014
58IC-0627013Umiam/ Ri Bhoi/Meghalaya21.914 ± 0.0249.986 ± 0.13234.194 ± 0.154
59IC-0627001Mariani/Jorhat/Assam42.346 ± 0.09215.290 ± 0.01418.762 ± 0.043
60IC-0627029Saikot/Churachandpur/Manipur44.850 ± 0.08913.011 ± 0.04622.343 ± 0.057
61IC-0627009Nagaon/Nagaon/Assam2.356 ± 0.0480.0000.000
62IC-0627014Barpeta/Barpeta/Assam45.857 ± 0.07413.245 ± 0.01619.208 ± 0.061
63IC-0626996Rupa/West Kameng/AP45.015 ± 0.06212.879 ± 0.04719.924 ± 0.035
64IC-0626999Golaghat/Golaghat/Assam3.559 ± 0.07110.532 ± 0.06322.834 ± 0.054
65IC-0626997Golaghat/Golaghat/Assam2.703 ± 0.0832.682 ± 0.0752.967 ± 0.073
66IC-0627000Mariani/Jorhat/Assam40.551 ± 0.06910.816 ± 0.02121.960 ± 0.056
67IC-0627011Karbianglong/Karbianglong/Assam21.393 ± 0.0079.147 ± 0.08438.883 ± 0.037
68IC-0627061Harmoti T.E/North Lakhimpur/Assam43.561 ± 0.0459.567 ± 0.06321.127 ± 0.050
69IC-0626992Tippi/West Kameng/AP40.386 ± 0.03711.145 ± 0.02919.420 ± 0.010
70IC-0627053Tingkhong T.E/Dibrugarh/Assam40.309 ± 0.02310.628 ± 0.03118.320 ± 0.081
71IC-0627007Moran/Dibrugarh/Assam38.334 ± 0.04511.773 ± 0.01820.003 ± 0.063
72IC-0627008Dibrugarh/Dibrugarh/Assam2.578 ± 0.0120.0000.000
GPS: global positioning system, IC.: Indigenous collection.
Table 2. SSR marker used in the study along with polymorphic and monomorphic alleles, polymorphism percentage, polymorphism information content, marker index and resolving power.
S. No.Primer CodePrimer Sequence (5ʹ–3ʹ and 3ʹ–5ʹ)Total AllelesPolymorphic
Alleles
% PolymorphismPIC MIRp
11CM0102TGCACGGGGAAGAGGAGAGA
AACCGAAGCGCAAGAACCCA
43750.470.352.14
22CM0304ACCCCAGCGCGATCCGAGGT
AGCGGCGTCTCCAGCCCGAA
32670.550.370.70
33CM0506CGCCGAAGTGGTAGAGGCAA
TGCAGGAGGCAGGAGGAGAA
551000.690.693.12
44CM0910CGCCGCCGTACTGCTCCATC
GCGGAGGAGACCTGCGGGT
54800.580.472.16
55CM1112GAATCCGATCCATCCATTGG
CACGAACACGCGACGCACGA
31330.330.110.01
66CM1314ACTTTGCGTGCGAGGCGAGG
CGAGGTCGAGTAGAAGGCGT
32670.420.280.63
77CM1516ACTTTGCGTGCGAGGCGAGG
CGAGGTCGAGTAGAAGGCGT
21500.500.250.02
88CM1718CTCGCCGTCGAATCCGCCAT
CACTCTCCTCTCCTGGCCCG
21500.490.250.03
910CM2122CTCCCCCTCCTCCTCCTCCC
CGACCGGCCGGAATGGATGC
32670.660.440.05
1012CM2728ATCTCTTCGCAGATCCACCT
GCTGAGACGCGCGGGTCGGA
32670.580.390.51
1113CM2930TTTATCCGCGTCCCTAGCTT
GCCGCCGGGGTCACAGGTCA
53600.570.340.31
1214CM3132GAGAGGATTCCGATACCCTT
TCGGCCTCTCGCCCCCCGA
331000.500.502.84
1315CM3334CGTGCTCGTGGATCCCCATC
CACCGTCGAATCGAATCCAA
54800.650.521.47
1417CM3738ATATATCCAGCCAGCCGCAT
GGGCCGTGCCGTGCCTCACC
32670.160.110.95
1518CM3940CTCCTCGATCTTCCTCTACT
TCGACCCCATCACAAATCCA
43750.650.480.84
1620CM4344GGGATGATCATCTCCGATGC
CCCTTCTCCCACTCTTCTCC
43750.670.500.63
1721CM038GGGAATGGGAAGGCAGTTG
AGCGCAGCACCACGAGAA
53600.390.231.31
1822CM075TGGCTAAGGAAGAATGCTC
CAGCGACGTCAATGCCACC
32670.540.360.74
1925CM003TGATGCAGTCGCCAAAAAGGATGA
ACGCGGCCTTTTTACGGTTCCTG
21500.290.140.85
2030CM056GGACACCATTGCTTTTTAGTAGAG
CGGAGAAGGACGACAGAGACG
331000.520.521.26
2131CM154TGAATAATCGCGGAATGAAGTGGA
GCTCAGCACCCTTCACATCTTTAG
43750.410.312.36
2233CM163ACGCGGAGCCGACAGAGGATCT
GGCAGGGATGGGGGCGTCTGG
21500.490.250.04
2334CM014GTTGCATATGCCGGCGACTGTG
GCCGGGCGCCATCATTAGTTC
331000.340.341.62
2435CM007CCGGGGACATTTGGGACTCG
GGCGCCGTCCACAAAGAATC
43750.400.301.32
2536CM126ACGAAGCACAGCGGGAAGGTTC
CCTGCCGTTGTTCTCCATCCAC
32670.410.270.67
2638CM168AACATGTTCAGAAAAGCGCAG
CGCCGCTTGCGCTTATGCTCG
21500.490.250.03
2739CM125CGATGCAGCGCGAGAGTAGAGA
AACCTTCCCGCTGCTTCGTGCA
21500.490.240.05
2842CM128CGTTTGCGCGAAGAGCCCTACCC
CCGCACGCCATCCCCAACCA
21500.470.240.11
Total 9265190713.719.526.77
Average 3.292.3268.100.490.340.96
Standard deviation 1.051.0917.490.120.140.90
PIC: polymorphism information content, MI: marker index, Rp: resolving power.
Table 3. Genetic diversity parameters of C. winterianus populations based on SSR primers.
S. No.C. winterianusMeanPolymorphic %HtHsGstNm
nanehI
1.Pop 1 (Assam)1.71 ± 0.461.42 ± 0.390.24 ± 0.200.36 ± 0.2870.650.22 ± 0.030.16 ± 0.020.251.48
2.Pop 2 (Manipur)1.40 ± 0.491.23 ± 0.340.13 ± 0.190.20 ± 0.2740.22
3.Pop 3 (Meghalaya)1.18 ± 0.391.13 ± 0.280.07 ± 0.160.11 ± 0.2418.48
4.Pop 4 (Arunachal Pradesh)1.58 ± 0.501.34 ± 0.360.20 ± 0.200.31 ± 0.2857.61
Mean1.711.410.240.3670.65
Standard deviation0.460.380.200.27
na: observed number of alleles, ne: effective number of alleles [Kimura and Crow (1964)], h: Nei’s (1973) gene diversity, I: Shannon’s information index [Lewontin (1972)], Ht: total species diversity, Hs: diversity within population, Gst: gene differentiation coefficient, Nm: estimate of gene flow from Gst.
Table 4. Eigen value, % variance and cumulative variance of principal component analysis based on SSR marker.
PCEigen Value% VarianceCumulative Variance
11.9116.0916.09
20.998.3624.45
30.695.7730.22
40.675.6135.83
50.544.5640.31
60.534.4244.81
70.484.0748.88
80.463.8652.74
90.403.3856.12
100.352.9659.08
110.342.8861.96
120.302.5464.50
130.302.4966.99
140.282.3469.33
Table 5. AMOVA (analysis of molecular variance) of C. winterianus germplasm based on SSR primers.
Source of VariationDegrees of Freedom (df)Sum of Squares (SS)Mean Squares
(MS)
Variance ComponentPercentage of Total Variancep Value
Among Pops310.2233.4080.24325%0.255
Within Pops6848.3740.7110.71175%0.045
Total7158.597 0.954100%
Level of significance based on 999 permutations; Pop: population; p value: level of marginal significance.
Table 6. The optimum conditions for GC-MS and GC-FID analysis in C. winterianus essential oil.
GC-MSGC-FID
InstrumentTRACE Ultra Gas Chromatograph coupled with an ISQ Mass SpectrometerThermo Scientific TRACE 1110
ColumnTG WAX/MS (60 m × 0.25mm i.d)TG WAX/MSA (60 m × 0.25mm i.d)
Film thickness0.25 μm0.25 μm
Running conditions40 °C for 2 min
250 °C at 5 °C/min
300 °C at 30 °C/min for 10 min
Initial temperature: 50 °C
Oven temperature: 300 °C
Injector temperature: 280 °C
FID temperature: 310 °C
Sample injection 1 μL1 μL
Carrier gasHelium (1mL min−1)Nitrogen (0.30 mL min−1)
Publisher’s Note: MDPI stays neutral with regard to jurisdictional claims in published maps and institutional affiliations.

