Abstract
Pomegranates were one of the first domesticated fruit crops, and their long history resulted in the development of local cultivars all over the world. Spain is one of the main producers and exporters of this crop in the Mediterranean Basin, but in order to maintain the competitiveness of this crop, new varieties should be developed. For this purpose, the pomegranate germplasm collection hold at the Agricultural Experiment Station of Elche, a public institution dependent on the Valencian regional government, is an interesting tool. However, the detailed characterization of any germplasm collection is a fundamental requirement to be able to make the most of these resources, allowing to identify putative promising accessions and to optimize the design of the future crosses. In this work, the genetic diversity of 94 accessions of this collection was analyzed using 19 microsatellite markers. As a result, 85 different genotypes were identified. These genetic profiles could be useful for varietal identification. Despite this genetic diversity, no clear substructure was observed, except for the ornamental accessions, that could be related to the vegetative propagation of the species. Additionally, the morphological characterization of this collection has made it possible to identify some materials that may be of interest as a source of traits for breeding. Results presented here pave the way for further genetic analyses, allowing the selection of parents to obtain segregating populations, as well as their descendants by the use of molecular assisted selection.
1. Introduction
Punica granatum L., commonly known as pomegranate, belongs to the Punica genus, included in the order Myrtales, recently placed under the family Lythraceae [1]. Pomegranate, cultivated for more than 5000 years, was one of the first domesticated fruit crops [2]. Although it is currently grown in subtropical and tropical areas all over the world, pomegranates are native to Iran and surrounding regions, as suggested by de Candolle [3]. From there, it was introduced into North Africa and Europe through the Mediterranean basin, and also to the rest of Asia. Later, Spanish sailors and Jesuit missionaries introduced pomegranates into Mexico and California in the 1500s and it arrived to Florida 200 years later [4]. Pomegranates have been used for multiple purposes since ancient times, such as food for humans and animals, medicinal remedies, religious purposes or just as ornamental trees. Despite this, pomegranate is still kept as a minor horticultural tree crop.
The long history of pomegranate domestication resulted in development of local cultivars in the different areas where it spread [4]. Due to its propagation method, mainly by cuttings, main P. granatum cultivars found today reflect local priorities [4]. More than 500 cultivars have been named, probably including synonyms, but just 50 are widely cultivated [5]. Pomegranates have a high diversity in phenological and pomological traits, as observed in germplasm collections from Turkey, India, Pakistan and Europe [6,7,8,9,10]. A high diversity in their chemical profile, including relevant content in anthocyanin, sugars and organic acids, was also observed [11,12].
Several international efforts have been made in order to preserve pomegranate diversity (as revised by [13]). Remarkably, the Garrygala Research Station in Turkmenistan, the largest ex situ pomegranate germplasm collection in the world, holds 1117 accessions and the Vavilov Research Institute of Plant Industry in Russia also maintains 800 accessions. A more modest germplasm collection of ~225 accessions is kept at the Agricultural Experiment Station of Elche (EEA-Elx, Alicante, Spain), a public institution dependent on the Regional Government of Valencia. This collection includes wild relatives, landraces, cultivars, advanced breeder selections and hybrids. As Spain is one of the main producers and exporters of pomegranates in the Mediterranean Basin [14], this collection represents a very interesting resource especially for the development of new varieties adapted to this region. Among the different ecotypes or cultivated varieties, it is worth highlighting the importance of the sweet and soft-seeded ‘Mollar de Elche’ and ‘Valenciana’, the main cultivars-populations grown in Spain that differ mainly in the ripening period. In order to fulfil the market needs developing new varieties, a pomegranate breeding program started in 2008 at the EEA-Elx and the Valencian Institute of Agrarian Research (IVIA, Valencia, Spain).
As breeding objectives, pomegranates have been traditionally selected on the basis of fruit size, rind and aril colors, taste and juiciness, and yield level, although some desirable characteristics differed by region [4]. For instance, the traditional Indian and Spanish cultivars are characterized by soft seeds and low-acid taste, while in Israel some sweet-sour cultivars, such as Wonderful, are successful [3]. Modern breeding objectives are more ambitious. According to Holland and Bar-Ya’akov [4], new cultivars will combine traits related with productivity, fruit quality, physiological disorders, ripening time, pest management, postharvest, and health promoting ingredients. However, despite the efforts made so far, development of new genomic and biotechnological tools is still needed to achieve these goals. The identification of regions of the genome involved in the control of these traits is essential to increase the efficiency of breeding programs through the use of molecular markers for selection.
The detailed characterization of any germplasm collection is a fundamental requirement to be able to make the most of these resources, allowing to identify putative promising accessions and to optimize the design of the future crosses. Different kinds of molecular markers have been used for pomegranate genetic diversity studies. However, simple-sequence repeats (SSRs) and single nucleotide polymorphisms (SNPs) displaced other types of markers and are preferentially used nowadays. In our group we developed a collection of 117 microsatellite markers from the cultivar Mollar because they were scarce a decade ago [15]. Recent examples of genetic diversity analyses using SSRs are the ones conducted using germplasm from India [16,17], Pakistan [18], or the Slovenian and Croatian areas of Istria [19]. Regarding the use of SNPs, due to cost reduction of massive sequencing, the first attempt to study diversity at the genomic scale was carried out by Ophir et al. [20]. These authors selected 480 SNPs from an RNAseq experiment to screen the germplasm collection at Agricultural Research Organization (ARO) located at the Newe Ya’ar Research Center in northern Israel.
In this work, we analyze the genetic diversity present in 94 pomegranate accessions from the EEA-Elx/IVIA collection using 19 microsatellite markers. Moreover, some morphological traits have been analyzed in these accessions. This work is a new step to improve the characterization of our pomegranate germplasm collection, allowing to generate new tools to optimize its use, as well as to open a new line of work aimed at identifying genes of interest and to apply assisted selection in the breeding program.
2. Results
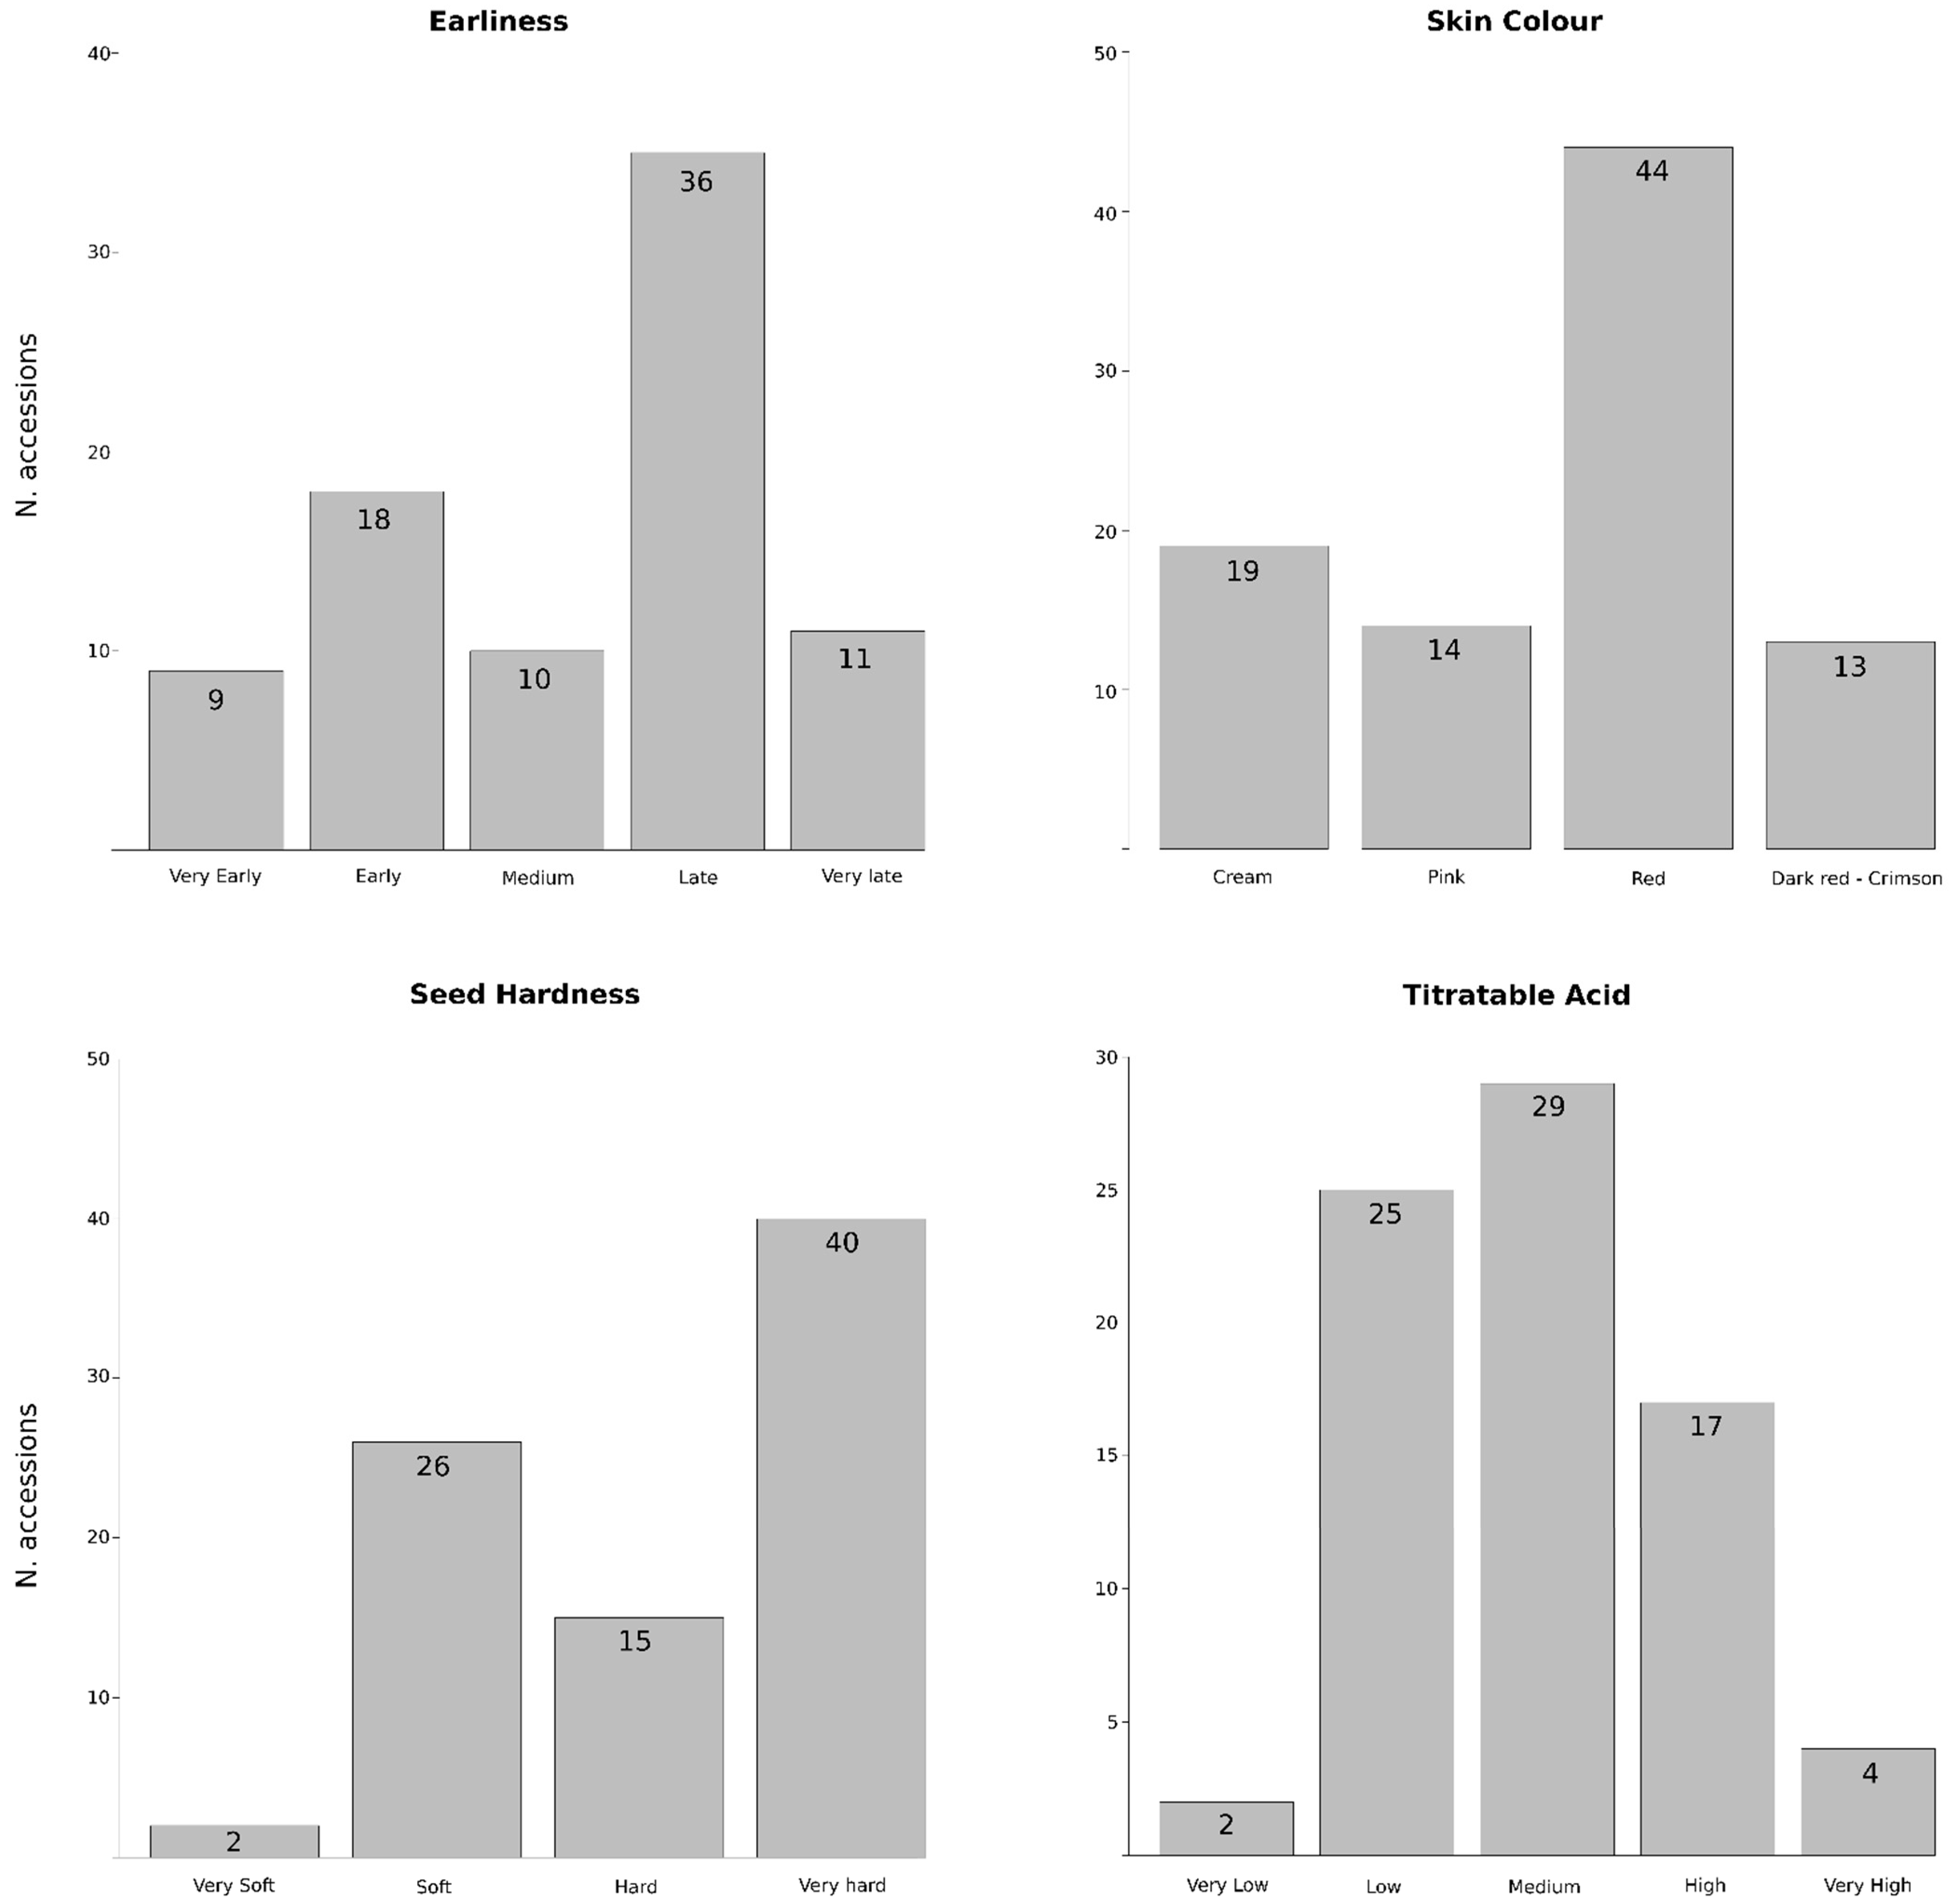
2.1. Germplasm Collection
Ninety-four accessions from the pomegranate germplasm collection maintained at the EEA-Elx (Alicante, Spain) were analyzed in this work (Table 1), as an effort to better understand the collection and to improve the efficiency of the ongoing breeding program. From them, 80 were imported from the National Clonal Germplasm Repository for Tree Fruit, Nut Crops, and Grapes in Davis (CA, USA), 1 from the Newe Ya’ar Research Center (Ramat Yishay, Israel) and 13 come from collection expeditions and crosses carried out by researchers from the EEA-Elx. Regarding the different geographical origins, accessions were grouped as 35 from Central Asia, 15 from North America, 13 from Southern Europe, 8 from Eastern Europe, 7 from the Middle East, 5 from Transcaucasia, 5 from East Asia, 1 from South Asia, and other 5 with unknown origin. In this work, two different accessions named as ‘Wonderful-1’ (No. 92) and ‘Wonderful-2’ (No. 93) have been included. Although both come from the Davis germplasm bank, ‘Wonderful-2’ was annotated as North American but ‘Wonderful-1’ has an unknown origin. Moreover, they showed differences for some pomological traits in our conditions.
Table 1.
Accessions analyzed in this work.
Description of the morphological and pomological data of the analyzed accessions is summarized in Table S1. Some traits showed low variability, such as the ornamental use (with 9 of the 94 accessions classified as ornamental trees), the tree size (just 2 are dwarf and 1 semi-dwarf) or the fruit shape (the length/width ratio showed 2 accessions with moderately elongated fruits, 10 with elongated ones, and the rest with spherical to moderately compressed fruits). Regarding the sensitivity to the incidence of Alternaria alternata, a major pomegranate disease that impacts production worldwide, 15 accessions showed more sensitivity to fungal infection in stored fruits, due to the black heart detection within their fruits. On the other hand, higher variability was observed for other fruit traits (Figure 1). Regarding the harvest period or earliness, 9 and 18 accessions were classified as very early or early, respectively, becoming a good alternative to be used as donors in breeding programs. ‘Acco’ (No. 2) and ‘Wonderful-2’ (No. 93) have been considered as references for this trait, being classified in our conditions as early (end of August) and late (end of October), respectively. Fruits showed a wide array of rind colors ranging from cream or light yellow to dark red, although the red color is the most frequent (44 accessions). Soft-seeds, another desirable economic trait, are present in 28 accessions, including almost all the Spanish accessions. In fact, two of them, classified as very soft, are Spanish Mollar clones (‘Mollar-6’ (No. 60) and ‘Mollar-7’ (No. 61)). Finally, titratable acid (TA) content also displayed high variability, with 25, 29 and 17 accessions showing low, medium or high content, respectively. The two Spanish Mollar clones mentioned above showed very low TA content, while three accessions from Turkmenistan (No. 1, 54 and 59) and one from the former Soviet Union (No. 47) showed very high content.
Figure 1.
Phenotypic variation of the 94 pomegranate accessions for harvest period and three fruit quality traits (skin colour, seed hardness and titratable acid content). Number of accessions of each type is indicated.
2.2. Genetic Diversity, PIC and Cultivar Identification
The 19 SSRs, selected from [15], were polymorphic in the collection analyzed (Table S2). The number of different alleles detected varied from 3 to 13, with a mean number of 5.5. PIC values ranged from 0.178 (PGCT022) to 0.671 (PGCT087) (Table 2). Seventeen rare alleles, considered as polymorphic alleles having <1% frequency, have been identified (4 with PGCT110A, 3 with PGCT015, 2 with PGCT093B and PGCT111, and 1 in the case of PGCT038, PGCT083, PGCT088A, PGCT089, PGCT091 and PGCT093A). Interestingly, the accession from the former Sovier Union ‘Kaj Acik Anor’ (No. 46) and the Japanese ‘Nochi shibori’ (No. 65) showed three different rare alleles each one, while just one was detected in one accession from India (No. 27), Japan (No. 39) and Spain (No. 15), five from Turkmenistan (No. 57, 77, 79, 83 and 85) and three from USA (No. 55, 69 and 93). Observed heterozygosity ranged between 0.172 (PGCT022) to 0.554 (PGCT093A), while nonbiased expected heterozygosity [21] ranged between 0.179 (PGCT022) to 0.674 (PGCT087).
Table 2.
SSR markers used in this study. Locus code, melting temperature, fragment length range, number of alleles, PIC, observed (Ho) and nonbiased expected (He [21]) heterozygosity values are shown. Primer sequences can be checked at [15].
The 19 selected SSR markers allowed the identification of 85 different genotypes among the 94 studied accessions. A total of six groups of potential redundant accessions were identified from the 94 accessions as having identical SSR marker profiles within each group (Table 3). However, in some cases morphological or pomological differences were observed between them (Table S1). For instance, within group 2, ‘Kara bala miursal’ (No. 47), described as a bud sport of ‘Bala Miursal’ (No. 12), appeared with this one and also with ‘Crab’ (No. 20) and ‘Sakerdze’ (No. 74), and they showed some differences in earliness, skin color and also titratable acid content. However, the darkening of the skin was the only difference that we observed between ‘Cranberry’ (No. 21) and ‘Koinekasyrskii Kislosladkii Krasnyi’ (No. 51) accessions from group 3. A more detailed description of these accessions should be obtained in order to declare them as duplicates or synonymously mislabeled. In order to minimize bias, just one accession from each group was maintained for the subsequent analyses.
Table 3.
Putative redundant pomegranate accessions according to the genetic profile of the 19 SSRs used in this study.
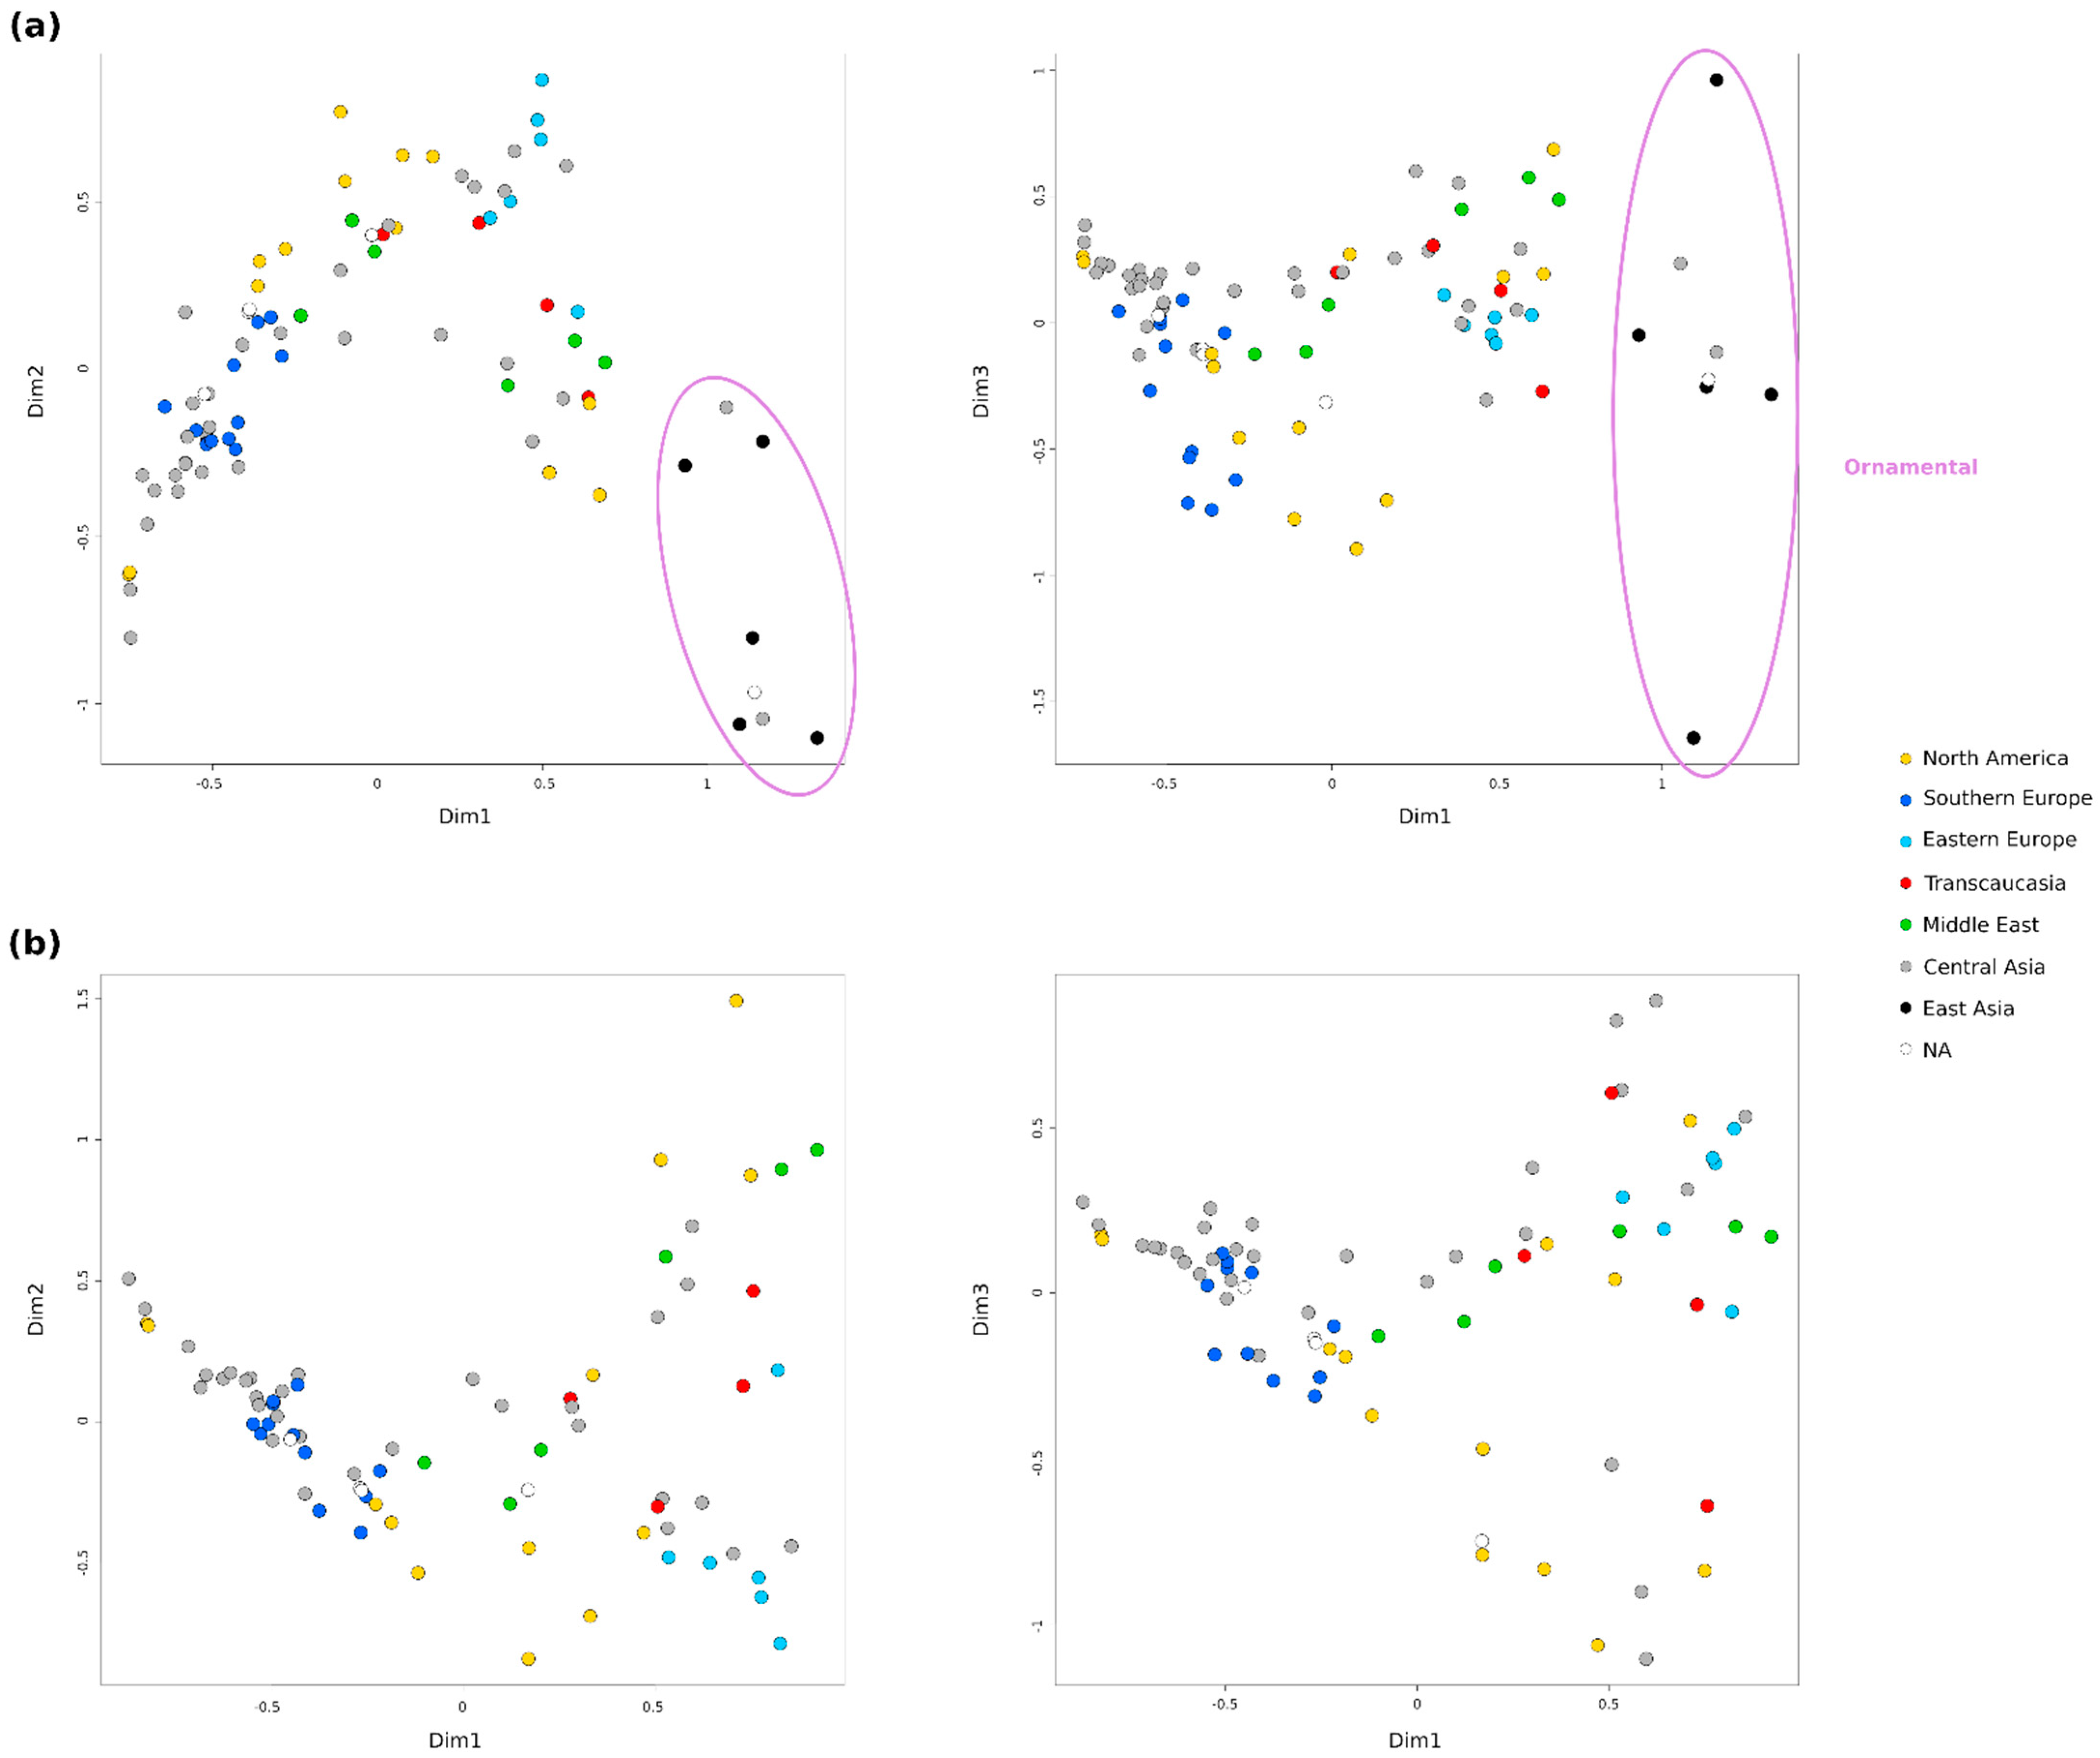
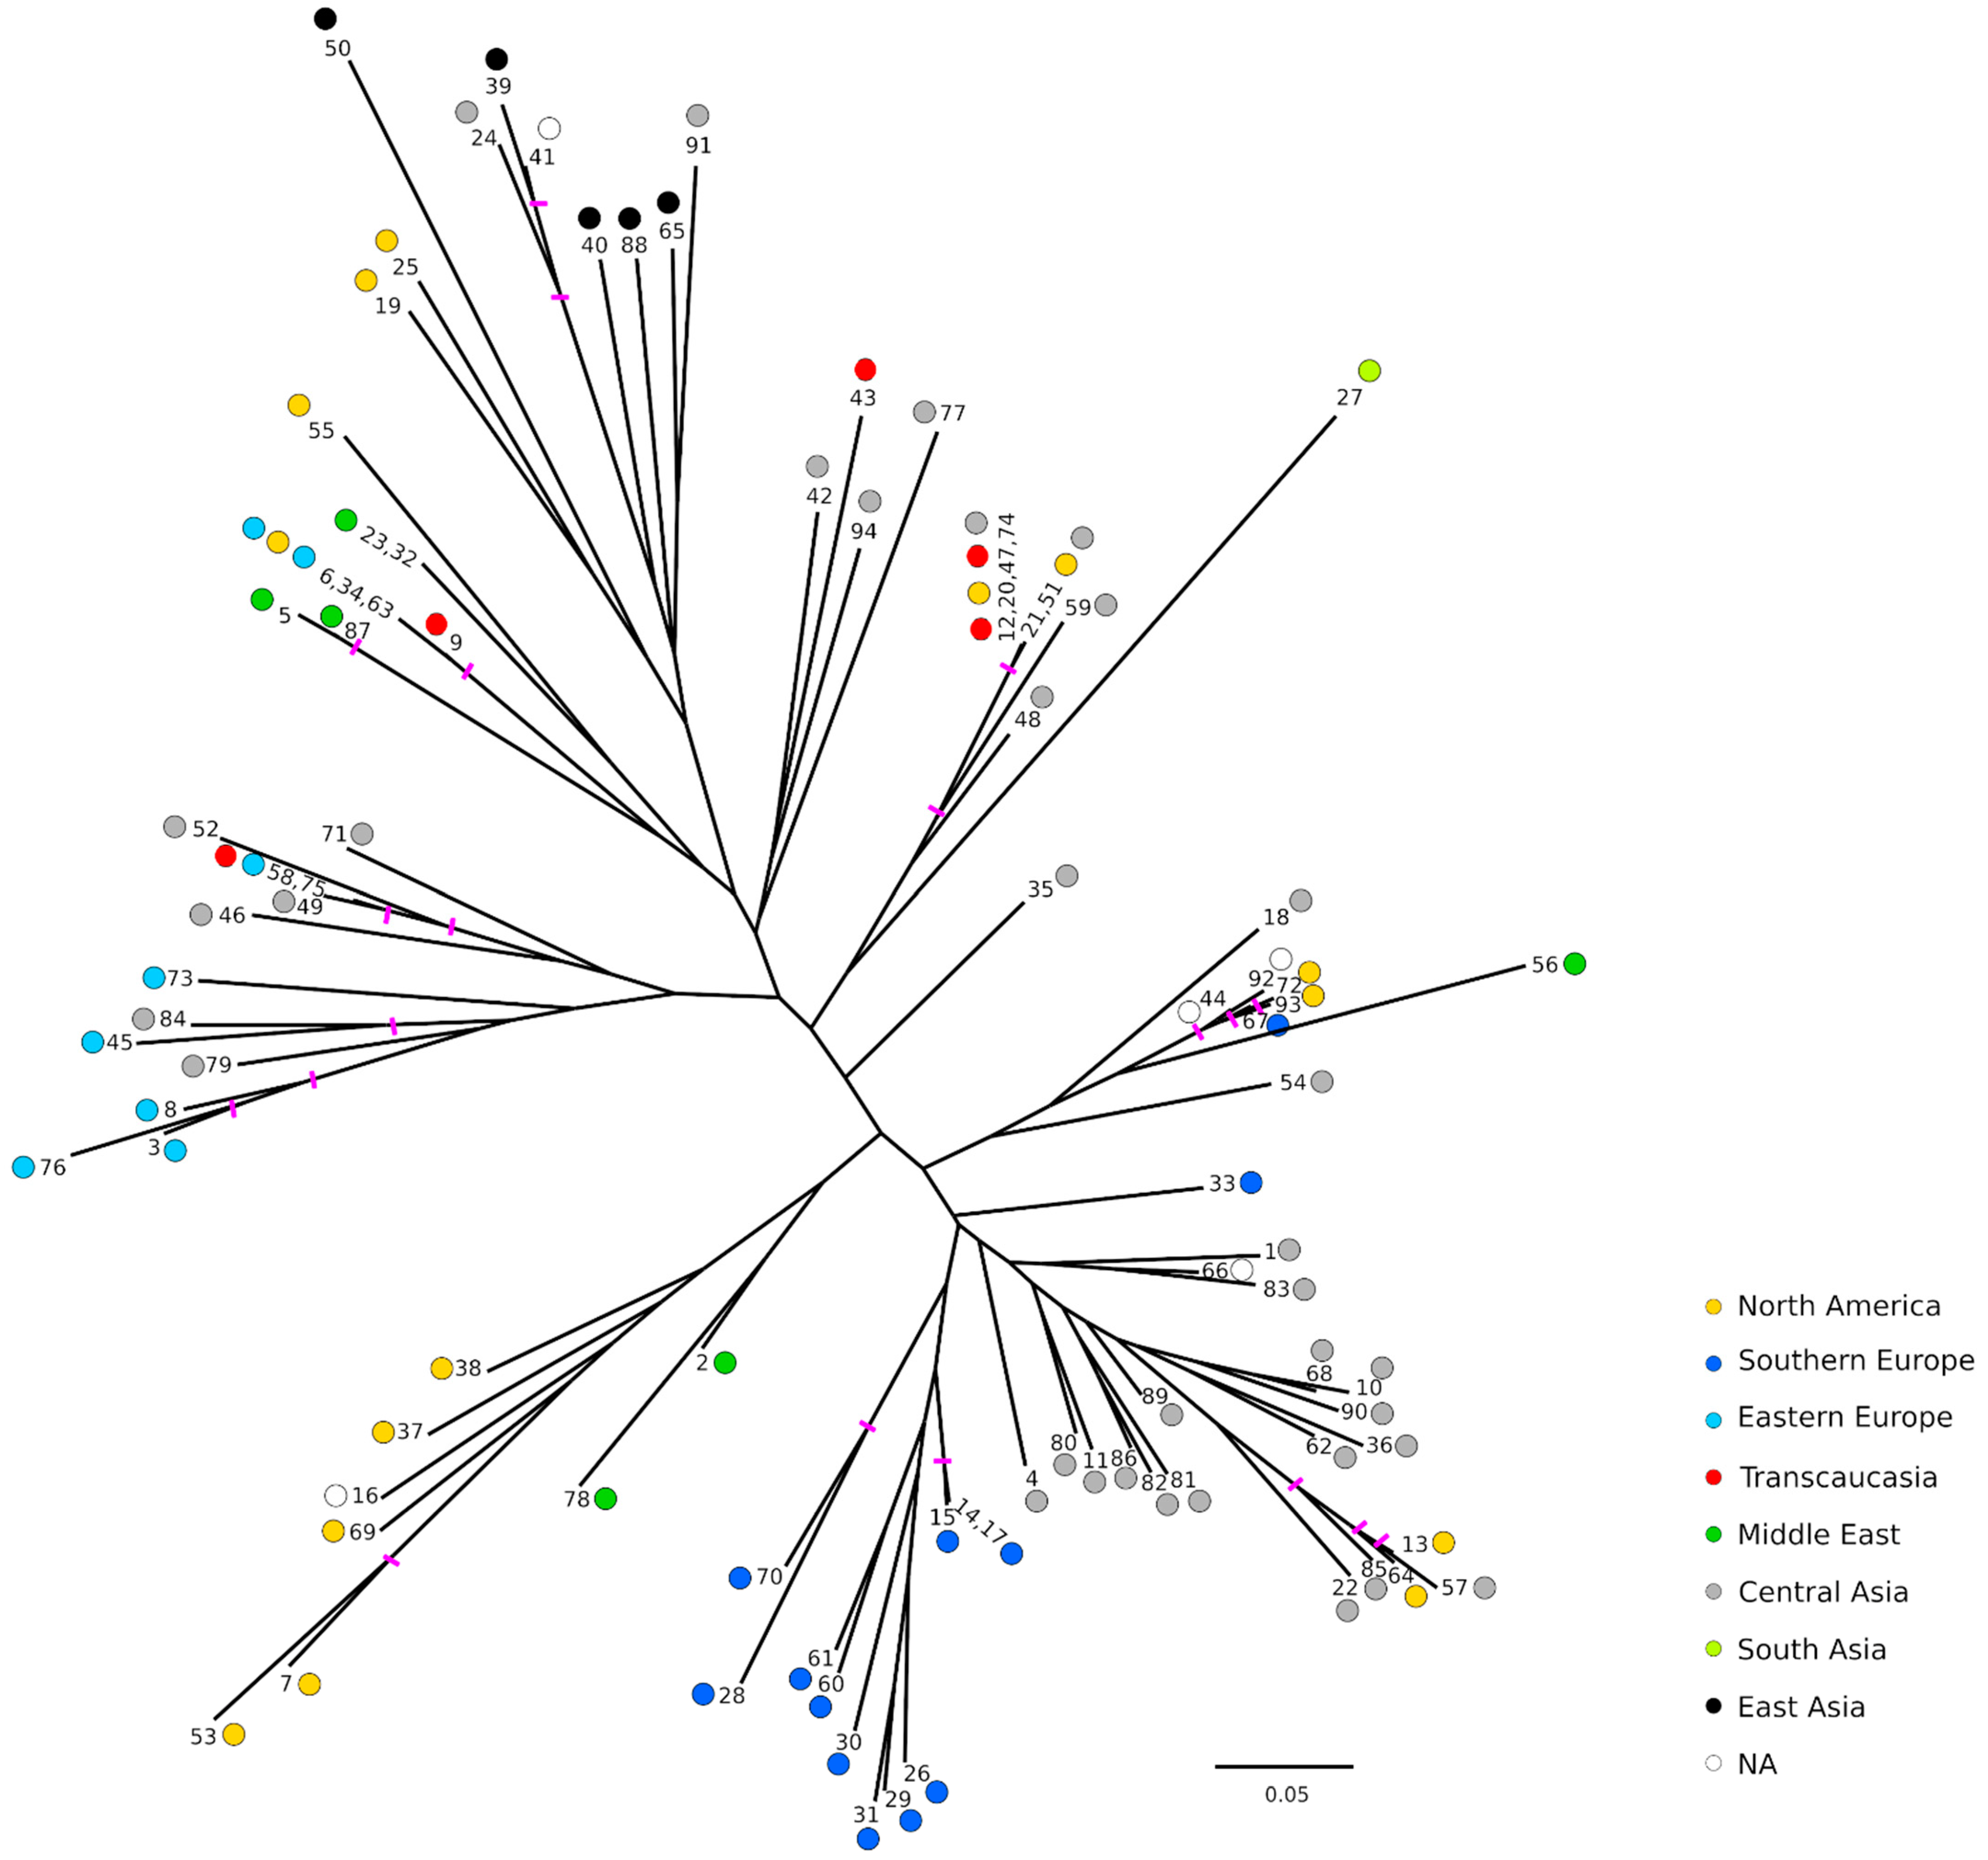
2.3. Population Structure and Genetic Relationships
Relationships between accessions and population structure were explored using different approaches. First, several Factorial Correspondence Analysis (FCAs) were conducted to explore the patterns of variation in the collection (Figure 2 and Figure S1). For clarity purposes, the coordinates of each accession in each FCA can be checked in Table S3. In general, some grouping according to the broad geographical regions was observed. The accessions from Central Asia, the main number, appeared distributed throughout the graphs. However, two groups were observed within the accessions from North America and also from the Middle East. A clear separation was also observed between samples from Southern and Eastern Europe. The FCA including all 85 accessions, after removing the nine potential redundancies, explained 26.7% of the variability by the first 3 dimensions and showed the ‘Elx-13’ accession (No. 27) clearly separated from the rest by the third dimension (Figure S1). This accession is a seedling from India, the only one in this analysis coming from South Asia. Accordingly, a new FCA was performed without this accession (Figure 2a). In this case, the accessions appear more distributed and the first 3 dimensions explained the 26.81% of the variability. Ornamental accessions appeared grouped and separated from the rest by the first dimension. This group of 8 accessions included the 5 from East Asia (all Japanese), 2 from Central Asia (No. 24 and 91) and 1 of unknown origin (No. 41). Close to them, in the central part of the first graph, appeared one group from North America (No. 19, 25 and 55) and another from the Middle East (No. 5, 23 and 87), jointly with some accessions from Central Asia (No. 42, 71, 77 and 94), Transcaucasia (No. 9 and 43) and Eastern Europe (No. 6). Finally, third dimension clearly separated the Japanese ornamentals ‘Ki-Zakuro’ (No. 50) and ‘Nochi shibori’ (No. 65), but also in a more subtle way other 5 accessions from North America (No. 7, 37, 38, 53, 69) and 5 from Southern Europe (No. 26, 29, 30, 31, 60).
Figure 2.
Factorial Correspondence Analysis (FCAs) of the accessions analyzed using 19 SSRs. Colors represent the putative region of origin of the genotype. (a) FCA without the Indian ‘Elx-13’ accession (No. 27); (b) FCA without ‘Elx-13’ and the 8 ornamental accessions.
Finally, a third FCA was performed without the 8 ornamental accessions in order to observe in more detail the relationships between the rest of the accessions (Figure 2b). In this case, the first 3 dimensions explained 27.49% of the variability. A greater dispersion of the accessions on the right half of the first graph was observed. In this case, the grouping described in the central position in the previous FCA was more clearly seen, but this time in the upper right part of the graph. Moreover, the other 5 accessions from Eastern Europe (No. 3, 8, 45, 73 and 76) appeared grouped with other 5 from Central Asia (No. 46, 49, 52, 79 and 84), one from North America (No. 53) and another one from Transcaucasia (No. 58). Contrary, almost half of the accessions from Central Asia appeared grouped with the ones from Southern Europe and a few from North America or the Middle East. A central position was occupied by a group of accessions from the Middle East (No. 2, 56 and 78), Central Asia (No. 35, 48, 59 and 71) and North America (No. 7, 21, 37, 38 and 69). Third dimension also separated 10 accessions, 5 from North America (No. 7, 37, 53, 55 and 69), 3 from Central Asia (No. 42, 77 and 94), 1 from Transcaucasia (No. 43) and 1 with an unknown origin (No. 16).
As a second approach to explore the relationships between the accessions, a Neighbor-Joining tree was built using Bruvo’s distance [22] (Figure 3). Bootstrap supports were quite low overall, with values greater than 50 only on some outer nodes. In general, similar geographical grouping to those of the FCAs was observed. Ornamental accessions appeared also grouped, while Southern and Eastern European accessions appeared separated in two groups as observed before in the FCAs. It should be noted that among the Southern European accessions, all the Spanish ones appeared clearly grouped and close to a group of accessions from Central Asia. Similarly, the accessions from Eastern Europe appeared close to each other but in this case also intermingled with some materials from Central Asia. Regarding the accessions of unknown origin, in some cases it seems that their origins could be inferred. For instance, ‘Cana’ (No. 16) appeared clearly grouped with some accessions from North America, although according to the name it could be from the Middle East. Also, ‘Orange’ (No. 66) grouped with some from Central Asia, and ‘How Sweet It Is’ (No. 41) appeared grouped with the ornamental ones. Contrary, ‘Ink’ (No. 44) and ‘Wonderful-1’ (No. 92) appeared grouped with some accessions from different regions such as Central Asia (‘Chandyr’ (No. 18)), North America (‘Purple Heart’ (No. 72) and ‘Wonderful-2’ (No. 93)), Southern Europe (‘Palermo’ (No. 67)) and Middle East (‘Mahali Dezful’ (No. 56)).
Figure 3.
Neighbor-Joining tree using Bruvo’s distance [22]. Colors represent the geographical origin of the genotype. Pink bars indicate nodes with bootstrap support > 50. As just one accession belonging to the same redundant group has been used for the analysis, the rest of names have been included separated by commas.
Finally, a Bayesian-based population assignment allowing admixture was carried out using the Structure software [23] (Figure S2). Different methods have been suggested to select the value of the number of clusters (K) that best fits the data [23,24]. In this case, the best grouping number was 2 based on delta K method, but also the maximum likelihood of K was observed for K = 10 (Figure S2C,D). For this reason, the assignment of each accession to the different groups assuming K = 2 (Figure S2A) and 10 (Figure S2B) was inspected. However, a clear relationship was not observed either with the geographic distribution of the accessions nor with any of the morphological characters analyzed, not even if we focused only on accessions showing a membership coefficient Q > 0.90.
2.4. Genetic Differentiation of Geographical Groups
Taking into account that the classification in geographical regions used in this work reflects the putative origin of the samples, several diversity indexes were calculated in order to characterize these geographic groups (Table 4). Overall, Central Asia group was the most variable, but this could be biased due to the uneven sample sizes between groups. In order to minimize this bias, the normalized multilocus genotypes (eMLGs) can be used to compare the genotypic diversity among the populations. In this case, Central Asia and North American groups were the most diverse, followed by Southern Europe. Exclusive alleles were found in accessions from 5 groups. It is worth noting the high number of unique alleles identified in accessions from East and South Asia (6 and 5, respectively) despite the lower number of individuals analyzed from those regions, 5 and 1 respectively. The Simpson index, calculated as one minus the sum of squared genotype frequencies, showed the existence of great diversity in the collection, as values close to 1 imply that two randomly selected genotypes are different.
Table 4.
Genetic diversity found in the accessions grouped by their geographic region of origin.
3. Discussion
Pomegranate was among the first fruit crops to be domesticated and has been cultivated for more than 5000 years [2]. This long history resulted in the development of pomegranate cultivars in the world that reflect the different tastes and priorities in each country [3]. Pomegranate production in Spain is mainly located in the Valencian Community (78.6%), basically in the Alicante province. This crop is very well adapted to this region as it is resistant to the hot dry climate and poor soils, tolerating calcareous soils with a degree of salinity [14,25]. Two pomegranate germplasm collections are maintained in the Alicante province. The first one is hold since 1992 by the Miguel Hernández University and maintains 59 accessions collected from different Spanish regions [9]. The second one is hold by the Agricultural Experiment Station of Elche/Instituto Valenciano de Investigaciones Agrarias (EEA-Elx/IVIA), belonging to the Valencian Regional Government, and currently maintains 225 accessions (including segregating populations) from 25 different countries.
In recent years, this crop has gained attention primarily due to its potential medicinal properties and its nutritional benefit in the human diet [26]. However, maintaining the competitiveness of this crop requires the development of new varieties that can meet the demands of consumers as well as the conditions imposed by climate change. The EEA-Elx/IVIA’s pomegranate germplasm collection is a valuable tool as a source of traits of interest for this purpose, but knowing its variability is what can make it useful. It is very important to characterize the collection, to know its strengths and weaknesses, identifying the genotypes that may be of interest for carrying out the crosses, as well as the need to incorporate other varieties that may have certain traits of interest that are not yet represented. This information has a direct interest for the pomegranate breeding program carried out at the EEA-Elx/IVIA but could also be useful for other breeding programs worldwide, by potentially identifying certain materials that may be of interest to them.
Main breeding goals to develop a new pomegranate cultivar are related with its destination for fresh consumption, industrialization or export. In general, an early ripening, attractive dark rind and arils color, presence of soft seeds and high antioxidant content are highly appreciated traits [14]. In this context, some promising materials have been identified in the collection, such as the 9 very early ripening accessions, the 13 with dark red rind color or the 2 accessions showing very soft seeds. These accessions could be good potential candidates as parents for crossing in the breeding program, but also for the generation of segregating populations that would allow us to undertake genetic studies. Moreover, phenotyping is important to identify possible environmental effects, despite being very costly in time and space. For instance, other authors suggested that rind and aril color can vary when grown in different regions [27]. In fact, some Spanish cultivars grown in Israel showed poorer and unattractive colors there than in Spain [3]. For this reason, it is essential to study the behavior of the materials in the regions where they are going to be grown.
Genotyping could also be useful to manage the germplasm collection as it could detect putative synonymies (identical accessions named differently) and homonymies (different accessions with the same name). This is a quite common problem in this species since the interchange of planting material must have been intense. Moreover, passport data in genebanks may not be as complete as desired, especially on the origin of the sample. For instance, in this work six small groups (with 2 to 6 accessions) with identical SSR profiles were identified. However, some morphological and pomological differences were observed within each group, so a more detailed description should be performed to confirm them as duplicates. These efforts will allow us to eliminate or at least reduce the redundancy within the collection.
Regarding the diversity observed, the microsatellites used in this work showed a great genotypic richness in terms of multilocus genotypes, so they are very informative in these collections. In this sense, 85 of the 94 accessions analyzed in this work showed a different genetic profile. The normalized multilocus genotypes eMLGs, that eliminates the influence of population size, showed similar values for Central Asia, North America and Southern Europe groups. Moreover, the accession from South Asia has shown a greater differentiation with respect to the rest of the materials under study. This is the seedling from India named ‘Elx-13’ (No. 27), that appeared separated from the rest of the analyzed accessions and showed 5 exclusive alleles, and has red rind color, soft seeds and low acidity in our conditions. Interestingly, all these traits are similar to those shown by ‘Mridula’ or ‘Bhagwa’ [3], Indian varieties extensively used for export to Europe. However, more work would be necessary to know if they are related or not.
Despite the genetic diversity observed in the EEA-Elx/IVIA collection, the materials do not show clear and differentiated groupings, except perhaps the varieties of ornamental use. This could be related to the vegetative propagation of the species, which in practice means avoiding frequent recombinations to obtain new generations through sexual reproduction. Similar results showing lack of significant genetic divergence by geographical origin were already observed by other authors. Genetic diversity of pomegranate germplasm from different origins has been previously analyzed using different morphological or pomological traits [9,12,28,29] and also different types of molecular markers as mentioned above. However, the comparison with the results from these works is complicated by the lack of concordance in the materials used in each case. In general, although some clusters are shown, the support for these classifications is often low. This may be indicating a relationship between the different materials that are not sufficiently separated.
In summary, results presented here pave the way for further genetic analyses, allowing the selection of parents to obtain segregating populations, as well as their descendants by the use of molecular assisted selection. Additionally, the phenotyping of new traits is in progress in order to increase the potential utility of the EEA-Elx/IVIA collection.
4. Materials and Methods
4.1. Plant Materials
Ninety-four pomegranate accessions from different origins were PCR screened in this work (Table 1). This collection is maintained at the Agricultural Experiment Station of Elche/Instituto Valenciano de Investigaciones Agrarias (EEA-Elx/IVIA), belonging to the Valencian regional government, and located in Elche, a city of the Alicante province, in southeastern Spain. Two leaf discs were collected from each accession, frozen in liquid N2 and stored at −80 °C before DNA isolation.
4.2. Morphological and Pomological Characterization
Eight interesting traits for pomegranate breeding were evaluated in this germplasm collection (Table 1). The traditional use of some varieties as ornamentals has been indicated. Tree vigour and some external fruit traits, such as the shape and rind color, were visually inspected. Regarding internal quality traits, seed hardness, titratable acid content (TA) and sensitivity to Alternaria in stored fruits were also screened. TA of fruit juice was determined by titrating 1 mL of juice sample with 0.1 mol/L sodium hydroxide to an end point of pH 8.1 and expressed as percentage of citric acid. TA values were classified as very low (<0.35 g/100 g), low (0.35–1.00 g/100 g), medium (1–1.50 g/100 g), high (1.50–2.0 g/100 g) and very high (>2.0 g/100 g). In order to detect the incidence of Alternaria alternata in stored fruits of these accessions, presence of symptoms consisting of internal black rot of arils and membranes was screened opening 100 fruits of each one [30]. Finally, the accessions were classified according to their fruit maturation period as very early (<20 August), early (20 August–20 September), medium (20 September–10 October), late (10–30 October) and very late (>30 October).
4.3. DNA Isolation and Microsatellite Analysis
DNA was extracted following the method described by Doyle and Doyle [31]. DNA quantification was performed by NanoDrop ND-1000 spectrophotometer (Thermo Fisher Scientific, Wilmington, DE, USA) and integrity was checked on 1% agarose gel.
Nineteen microsatellite (SSR) markers (Table 2) were selected according to their informative content from Soriano et al. [15]. SSR amplifications were performed in a final volumen of 20 µL containing 1× DreamTaq buffer, 0.2 mM of each dNTP, 20 ng of genomic DNA and 1 U of DreamTaq DNA polymerase (Thermo Fisher Scientific, Waltham, MA, USA) using a UNO96 thermal cycler (VWR, Radnor, PA, USA). Each reaction was performed in 20 µL with three primers: the specific forward primer of each microsatellite with an M13(−21) tail at its 5′ end (0.05 µM), the sequence-specific reverse primer (0.25 µM) and the universal fluorescent-labeled M13(−21) primer (0.2 µM) [32]. The PCR temperature cycling conditions were as follows: 94 °C for 2 min, then 35 cycles of 94 °C for 30 s, the optimized annealing temperature (Table 2) for 60 s and 72 °C for 90 s, finishing with 72 °C for 10 min. Allele lengths were determined using an ABI Prism 3130 Genetic Analyzer with the aid of GeneMapper software, version 4.0 (Applied Biosystems, Waltham, MA, USA).
4.4. Data Analysis
Histograms, obtained using R programming language, were used to visualize the distribution of the morphological and pomological traits in the collection.
For each microsatellite the number of alleles, their size range and polymorphism information content (PIC) were calculated. PIC was calculated based on allele frequencies of all cultivars analyzed as: PICi = 1 − Σpij2, where pij is the frequency of the jth allele for the ith marker locus and summation extends over n alleles. Observed (Ho) and expected (He [21]) heterozygosity were calculated using the Genetix program [33].
In order to determine the relationship of the accessions used, several factorial correspondence analyses (FCA) were carried out using the Genetix program [33]. Genetic distances between pairs of accessions were calculated using the Bruvo’s distance [22] and used to construct an unrooted neighbor-joining (NJ) phylogenetic tree The stability of the nodes was checked with 1000 bootstrap replicates. These analyses were conducted through the R package Poppr [34]. HyperTree software [35] was used to visualize the obtained trees. The number of multilocus genotypes found in each population (MLG), the expected number of MLG at the lowest common sample size (eMLG), the mean number alleles per locus (A), athe observed heterozygosity (Hobs) and the unbiased estimated heterozygosity (Nei’s gene diversity) (Hexp) were also calculated using the with R package Poppr [34].
The accessions were classified into genetic clusters using the Bayesian model-based clustering proposed by Pritchard and collaborators [23] implemented in STRUCTURE 2.3.4 (https://web.stanford.edu/group/pritchardlab/structure.html (accessed on 13 April 2022)). We used the basic admixture model with unlinked loci, correlated allele frequencies among groups and no prior population information. Twenty runs were performed for each number of populations (K) set from 1 to 13, with a burning period of 100,000, and a post-burning simulation length of 1,500,000 for each run. The most probable K-value was determined by Structure Harvester [36], using the log probability of the data [LnP(D)] and delta K (1 K) based on the rate of change in [LnP(D)] between successive K-values. For the optimal K-value, membership coefficient matrices of 20 replicates from STRUCTURE were used in CLUMPP [37] to generate an individual Q matrix. STRUCTURE PLOT webpage (http://omicsspeaks.com/strplot2/ (accessed on 13 April 2022)) was used to draw the STRUCTURE bar plots [38].
5. Conclusions
The present study provides a perspective of the genetic variation of the Spanish pomegranate germplasm collection maintained at the Agricultural Experiment Station of Elche/Instituto Valenciano de Investigaciones Agrarias (EEA-Elx/IVIA). Some promising materials with interesting morphological and pomological characteristics for breeding have been identified in the collection. Moreover, the SSR genotyping data provided valuable information for an effective management of the collection and the identification of the materials, as an interesting tool to increase the protection of breeder’s intellectual rights. Results presented pave the way for further genetic analyses that could increase the efficiency of the pomegranate breeding programs.
Supplementary Materials
The following are available online at https://www.mdpi.com/article/10.3390/plants11091257/s1, Figure S1: First Factorial Correspondence Analysis (FCAs) of the 85 accessions analyzed using 19 SSRs. Colors represent the putative region of origin of the genotype; Figure S2: Bayesian-based population assignment allowing admixture carried out using the Structure software. (A) K = 2 based on delta K method, (B) K = 10 based on the maximum likelihood of K, (C) Delta K (ΔK) graph obtained by Structure Harvester, (D) mean likelihood L(K) and variance per K value obtained by Structure Harvester; Table S1: Description of the morphological and pomological data of the analyzed accessions; Table S2: Genotypic profile of the 94 accessions analyzed with 19 SSRs; Table S3: Coordinates of each accession in the first 3 dimensions of each of the FCAs conducted.
Author Contributions
Conceptualization, M.L.B., J.B. and E.Z.; methodology, E.Z.; formal analysis, J.P. and E.Z.; resources J.B.; writing-original draft preparation, E.Z.; writing-review and editing, M.L.B., J.B. and E.Z.; funding acquisition, M.L.B. and E.Z. All authors have read and agreed to the published version of the manuscript.
Funding
This research was funded by Generalitat Valenciana, grant number AICO/2020/036, and the Ministerio de Ciencia e Innovación/Agencia Estatal de Investigación de España, grant number PID2020-113276RR-I00/AEI/10.13039/501100011033.
Institutional Review Board Statement
Not applicable.
Informed Consent Statement
Not applicable.
Data Availability Statement
Not applicable.
Conflicts of Interest
The authors declare no conflict of interest. The funders had no role in the design of the study; in the collection, analyses, or interpretation of data; in the writing of the manuscript, or in the decision to publish the results.
References
- Rana, T.S.; Narzary, D.; Ranade, S.A. Systematics and taxonomic disposition of the genus Punica L. Fruit Veg. Cereal Sci. Biotechnol. 2010, 4, 51–55. [Google Scholar]
- Janick, J. The origins of fruits, fruit growing, and fruit breeding. Plant Breed. Rev. 2005, 25, 255–320. [Google Scholar] [CrossRef]
- Holland, D.; Hatib, K.; Bar-Ya’akov, I. Pomegranate: Botany, horticulture, breeding. Hortic. Rev. 2009, 35, 127–191. [Google Scholar] [CrossRef]
- Holland, D.; Bar-Ya’akov, I. Pomegranate (Punica granatum L.) breeding. In Advances in Plant Breeding Strategies: Fruits; Al-Khayri, J.M., Jain, S.M., Johnson, D.V., Eds.; Springer: Berlin/Heidelberg, Germany, 2018; pp. 601–647. [Google Scholar] [CrossRef]
- IPGRI. Regional Report CWANA 1999–2000. International Plant; Genetic Resources Institute: Rome, Italy, 2001; ISBN 92-9043-494-5. [Google Scholar]
- Caliskan, O.; Bayazıt, S. Morpho-pomological and chemical diversity of pomegranate accessions grown in eastern mediterranean region of turkey. J. Agric. Sci. Technol. 2013, 15, 1449–1460. [Google Scholar]
- Durgaç, C.; Özgen, M.; Simsek, Ö.; Kaçar, Y.A.; Kıyga, Y.; Çelebi, S.; Gündüz, K.; Serçe, S. Molecular and pomological diversity among pomegranate (Punica granatum L.) cultivars in Eastern Mediterranean region of Turkey. Afr. J. Biotechnol. 2008, 7, 1294–1301. [Google Scholar]
- Ferrara, G.; Cavoski, I.; Pacifico, A.; Tedone, L.; Mondelli, D. Morpho-pomological and chemical characterization of pomegranate (Punica granatum L.) genotypes in Apulia region, Southeastern Italy. Sci. Hortic. 2011, 130, 599–606. [Google Scholar] [CrossRef]
- Martinez-Nicolas, J.J.; Melgarejo, P.; Legua, P.; Garcia-Sanchez, F.; Hernández, F. Genetic diversity of pomegranate germplasm collection from Spain determined by fruit, seed, leaf and flower characteristics. PeerJ 2016, 4, e2214. [Google Scholar] [CrossRef] [Green Version]
- Varasteh, F.; Arzani, K.; Zamani, Z.; Mohseni, A. Evaluation of the most important fruit characteristics of some commercial pomegranate (Punica granatum L.) cultivars grown in Iran. Acta Hortic. 2009, 818, 103–108. [Google Scholar] [CrossRef]
- Drogoudi, P.D.; Tsipouridis, C.; Michailidis, Z. Physical and Chemical Characteristics of Pomegranates. Hortic. Sci. 2005, 40, 1200–1203. [Google Scholar] [CrossRef] [Green Version]
- Hasnaoui, N.; Jbir, R.; Mars, M.; Trifi, M.; Kamal-Eldin, A.; Melgarejo, P.; Hernandez, F. Organic acids, sugars, and anthocyanins contents in juices of tunisian pomegranate fruits. Int. J. Food Prop. 2011, 14, 741–757. [Google Scholar] [CrossRef] [Green Version]
- Still, D.W. Pomegranates: A botanical perspective. In Pomegranates: Ancient Roots to Modern Medicine; Seeram, N.P., Schulman, R.N., Heber, D., Eds.; Taylor & Francis: Boca Raton, FL, USA, 2006; pp. 199–209. [Google Scholar]
- Bartual, J.; Fernandez-Zamudio, M.A.; De-Miguel, M.D. Situation of the production, research and economics of the pomegranate industry in Spain. Acta Hortic. 2015, 1089, 345–349. [Google Scholar] [CrossRef]
- Soriano, J.M.; Zuriaga, E.; Rubio, P.; Llácer, G.; Infante, R.; Badenes, M.L. Development and characterization of microsatellite markers in pomegranate (Punica granatum L.). Mol. Breed. 2011, 27, 119–128. [Google Scholar] [CrossRef]
- Shahsavari, S.; Noormohammadi, Z.; Sheidai, M.; Farahani, F.; Vazifeshenas, M.R. Genetic structure, clonality and diversity in commercial pomegranate (Punica granatum L.) cultivars. Genet. Resour. Crop Evol. 2021, 68, 2943–2957. [Google Scholar] [CrossRef]
- Patil, P.G.; Singh, N.V.; Parashuram, S.; Bohra, A.; Mundewadikar, D.M.; Sangnure, V.R.; Babu, K.D.; Sharma, J. Genome wide identification, characterization and validation of novel miRNA-based SSR markers in pomegranate (Punica granatum L.). Physiol. Mol. Biol. Plants 2020, 26, 683–696. [Google Scholar] [CrossRef]
- Aziz, S.; Firdous, S.; Rahman, H.; Awan, S.I.; Michael, V.; Meru, G. Genetic diversity among wild pomegranate (Punica granatum) in Azad Jammu and Kashmir region of Pakistan. Electron. J. Biotechnol. 2020, 46, 50–54. [Google Scholar] [CrossRef]
- Višnjevec, A.M.; Ota, A.; Skrt, M.; Butinar, B.; Možina, S.S.; Cimerman, N.G.; Nečemer, M.; Arbeiter, A.B.; Hladnik, M.; Krapac, M.; et al. Genetic, biochemical, nutritional and antimicrobial characteristics of pomegranate (Punica granatum L.) grown in Istria. Food Technol. Biotechnol. 2017, 55, 151–163. [Google Scholar] [CrossRef]
- Ophir, R.; Sherman, A.; Rubinstein, M.; Eshed, R.; Sharabi Schwager, M.; Harel-Beja, R.; Bar-Ya’akov, I.; Holland, D. Single-nucleotide polymorphism markers from de-novo assembly of the pomegranate transcriptome reveal germplasm genetic diversity. PLoS ONE 2014, 9, e88998. [Google Scholar] [CrossRef] [Green Version]
- Nei, M. Estimation of average heterozygosity and genetic distance from a small number of individuals. Genetics 1978, 89, 583–590. [Google Scholar] [CrossRef]
- Bruvo, R.; Michiels, N.K.; D’souza, T.G.; Schulenburg, H. A simple method for the calculation of microsatellite genotype distances irrespective of ploidy level. Mol. Ecol. 2004, 13, 2101–2106. [Google Scholar] [CrossRef]
- Pritchard, J.K.; Stephens, M.; Donnelly, P. Inference of population structure using multilocus genotype data. Genetics 2000, 155, 945–959. [Google Scholar] [CrossRef]
- Evanno, G.; Regnaut, S.; Goudet, J. Detecting the number of clusters of individuals using the software STRUCTURE: A simulation study. Mol. Ecol. 2005, 14, 2611–2620. [Google Scholar] [CrossRef] [PubMed] [Green Version]
- Melgarejo, P.; Martínez-Valero, R. El Granado; Ediciones Mundi-Prensa: Madrid, Spain, 1992; p. 163. [Google Scholar]
- Giménez-Bastida, J.A.; Ávila-Gálvez, M.A.; Espín, J.C.; González-Sarrías, A. Evidence for health properties of pomegranate juices and extracts beyond nutrition: A critical systematic review of human studies. Trends Food Sci. Technol. 2021, 114, 410–423. [Google Scholar] [CrossRef]
- Stover, E.; Mercure, E.W. The Pomegranate: A New Look at the Fruit of Paradise. HortScience 2007, 42, 1088–1092. [Google Scholar] [CrossRef] [Green Version]
- Dandachi, F.; Hamadeh, B.; Youssef, H.; Chahine, H.; Chalak, L. Diversity assessment of the Lebanese germplasm of pomegranate (Punica granatum L.) by morphological and chemical traits. Ann. Agric. Sci. 2017, 62, 89–98. [Google Scholar] [CrossRef]
- Khadivi, A.; Arab, M. Identification of the superior genotypes of pomegranate (Punica granatum L.) using morphological and fruit characters. Food Sci. Nutr. 2021, 9, 4578–4588. [Google Scholar] [CrossRef]
- Vicent, A.; Mira, J.L.; Bartual, J.; Beltrán, V.; Taberner, V.; Palou, L. First Report of Black Heart of Pomegranate Caused by Alternaria alternata in Spain. Plant Dis. 2016, 100, 1952. [Google Scholar] [CrossRef]
- Doyle, J.J.; Doyle, J.L. A Rapid DNA Isolation Procedure for Small Quantities of Fresh Leaf Tissue. Phytochem. Bull. 1987, 19, 11–15. [Google Scholar]
- Schuelke, M. An economic method for the fluorescent labeling of PCR fragments. Nat. Biotechnol. 2000, 18, 233–234. [Google Scholar] [CrossRef]
- Belkhir, K.; Borsa, P.; Chikhi, L.; Raufaste, N.; Bonhomme, F. 1996–2004. GENETIX 4.05, Logiciel Sous Windows TM Pour la Génétique des Populations. Laboratoire Génome, Populations, Interactions, CNRS UMR 5171, Université de Montpellier II, Montpellier (France). Available online: https://kimura.univ-montp2.fr/genetix/ (accessed on 20 January 2021).
- Kamvar, Z.N.; Tabima, J.F.; Grünwald, N.J. Poppr: An R package for genetic analysis of populations with clonal, partially clonal, and/or sexual reproduction. PeerJ 2014, 2, e281. [Google Scholar] [CrossRef] [Green Version]
- Bingham, J.; Sudarsanam, S. Visualizing large hierarchical clusters in hyperbolic space. Bioinformatics 2000, 16, 660–661. [Google Scholar] [CrossRef] [Green Version]
- Earl, D.A.; vonHoldt, B.M. STRUCTURE HARVESTER: A website and program for visualizing STRUCTURE output and implementing the Evanno method. Conserv. Genet. Resour. 2012, 4, 359–361. [Google Scholar] [CrossRef]
- Jakobsson, M.; Rosenberg, N.A. CLUMPP: A cluster matching and permutation program for dealing with label switching and multimodality in analysis of population structure. Bioinformatics 2007, 23, 1801–1806. [Google Scholar] [CrossRef] [PubMed] [Green Version]
- Ramasamy, R.K.; Ramasamy, S.; Bindroo, B.B.; Naik, V.G. STRUCTURE PLOT: A program for drawing elegant STRUCTURE bar plots in user friendly interface. SpringerPlus 2014, 3, 431. [Google Scholar] [CrossRef] [PubMed] [Green Version]
Publisher’s Note: MDPI stays neutral with regard to jurisdictional claims in published maps and institutional affiliations. |
© 2022 by the authors. Licensee MDPI, Basel, Switzerland. This article is an open access article distributed under the terms and conditions of the Creative Commons Attribution (CC BY) license (https://creativecommons.org/licenses/by/4.0/).