
Sugar, Invertase Enzyme Activities and Invertase Gene Expression in Different Developmental Stages of Strawberry Fruits

 ,
,  and
and 
Abstract
:1. Introduction
2. Material and Methods
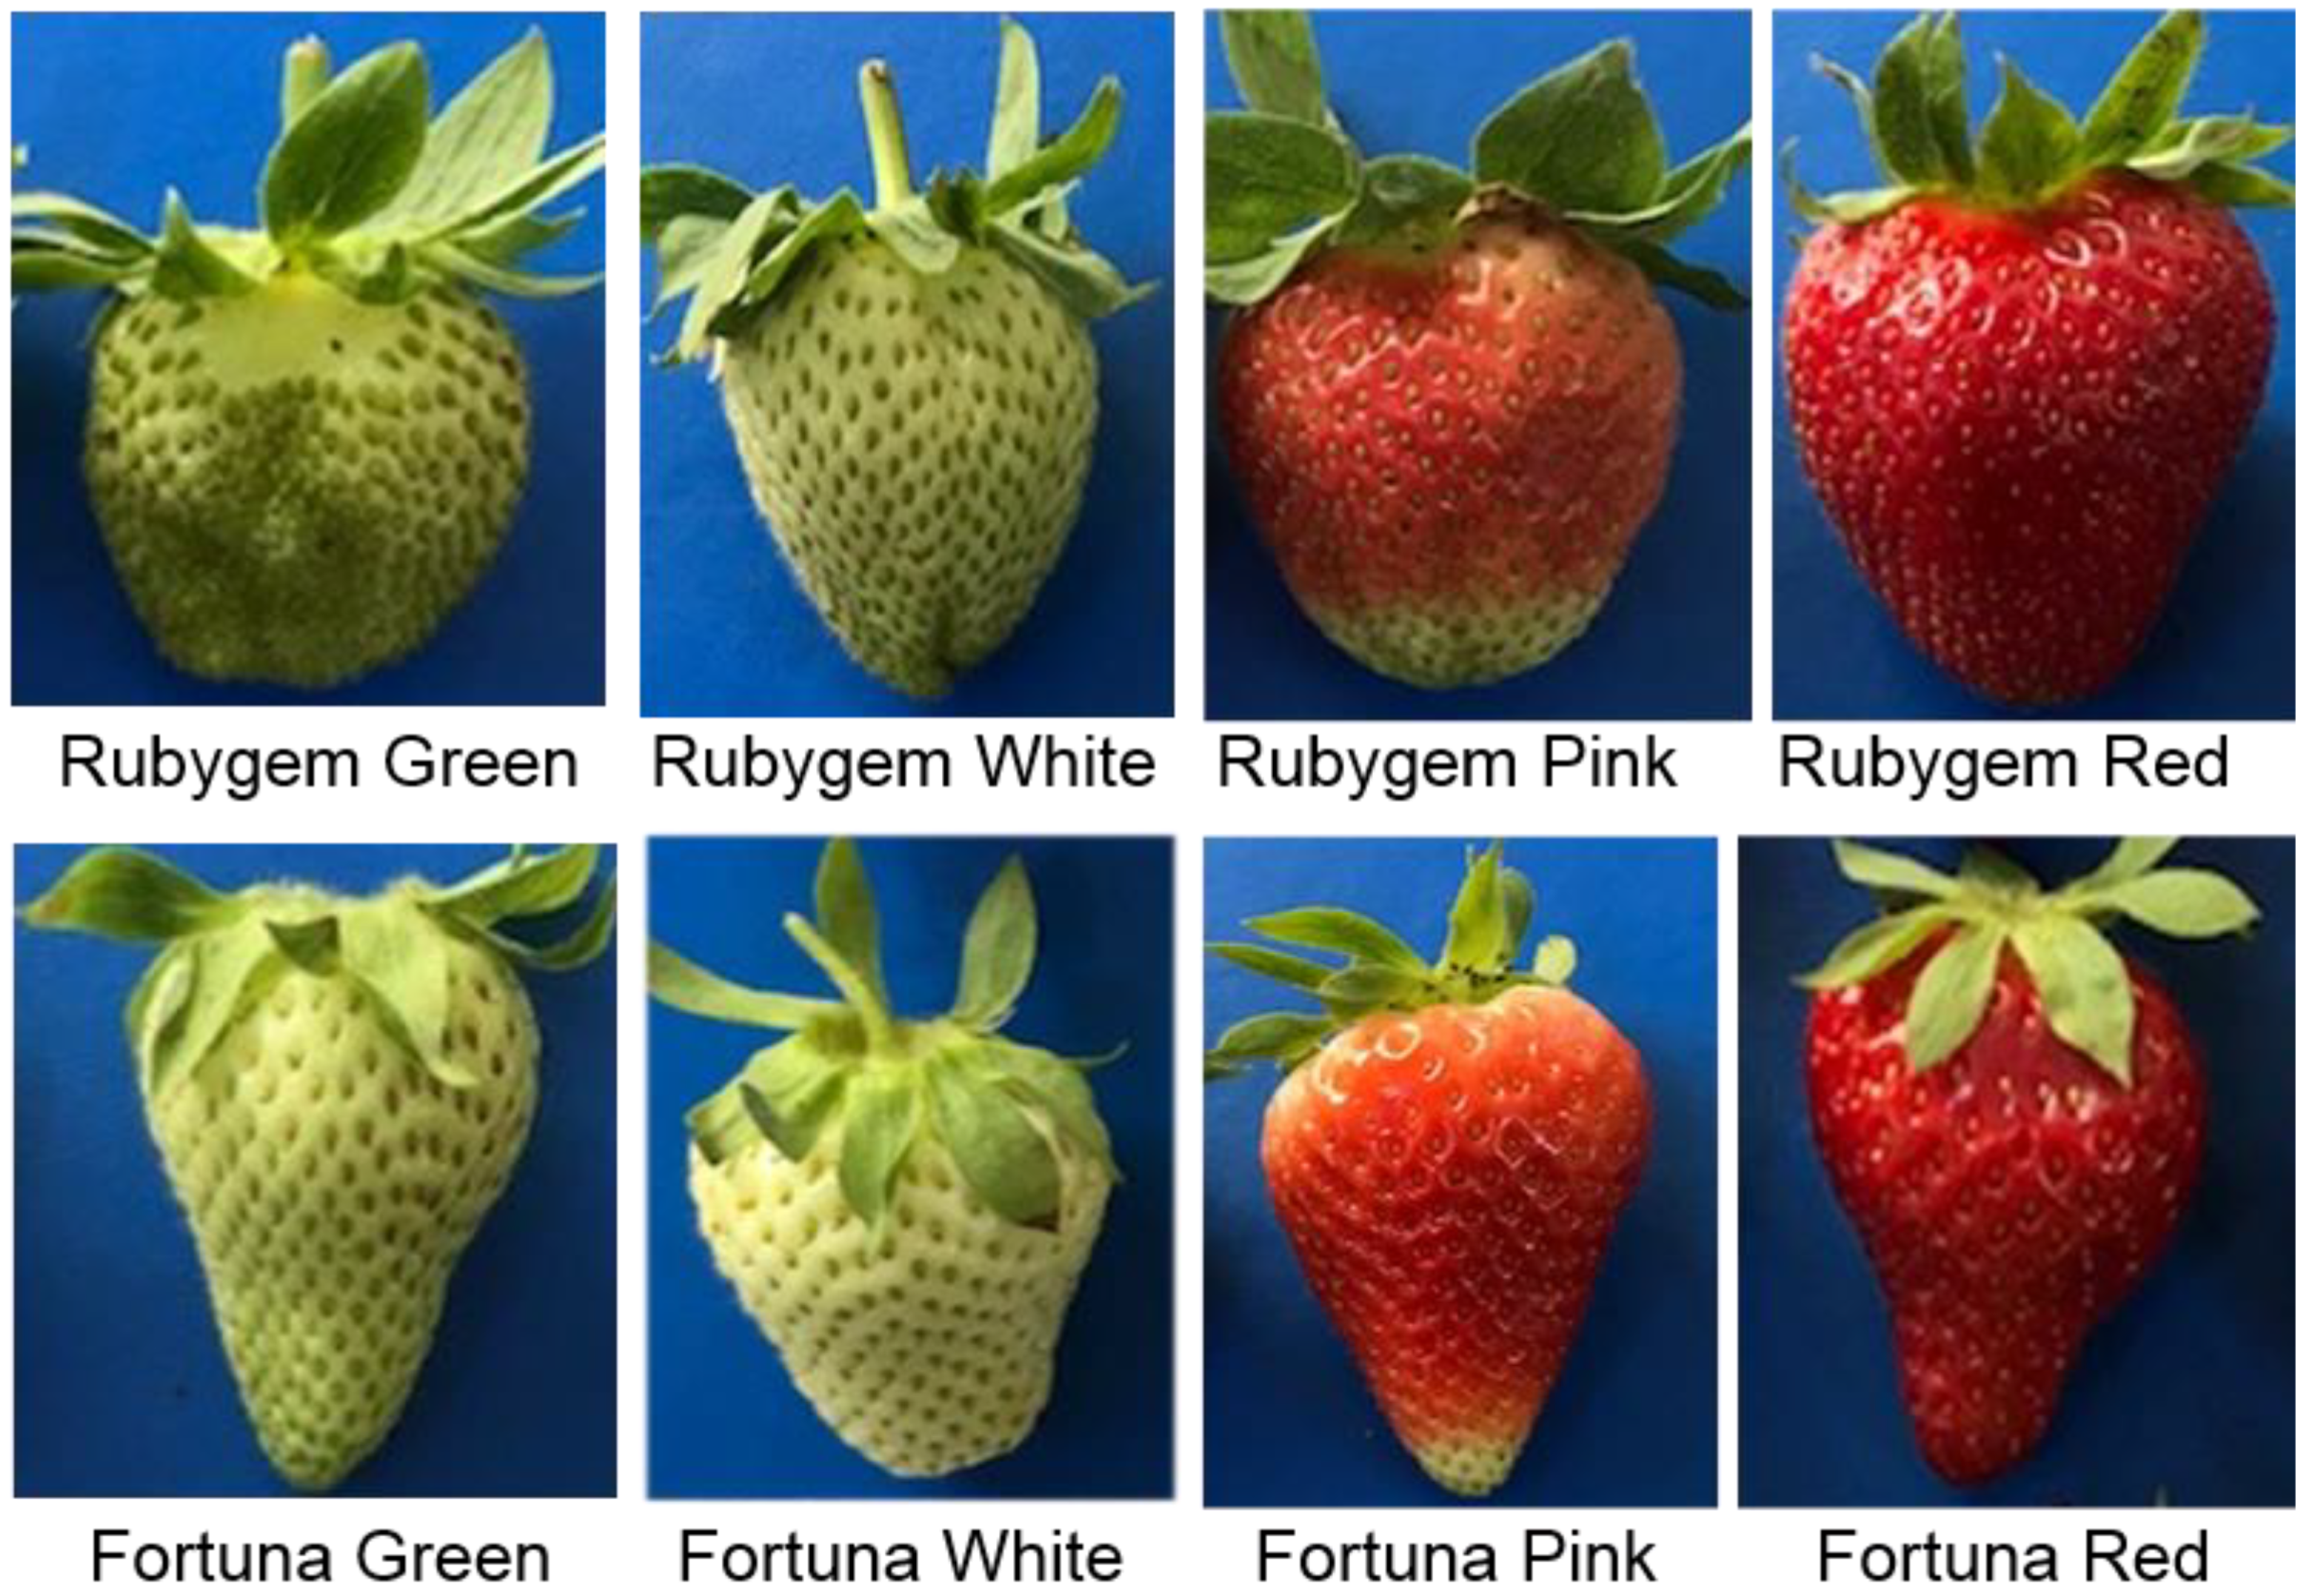
2.1. Plant Materials
2.2. Biochemical Analysis
2.2.1. Characterization of Sugars by HPLC-RID-UV
2.2.2. Invertase Extraction and Activity Assay
2.2.3. RNA Isolation and cDNA Synthesis
2.2.4. Real-Time Quantitative (qRT-PCR)
2.3. Statistical Analysis
3. Results
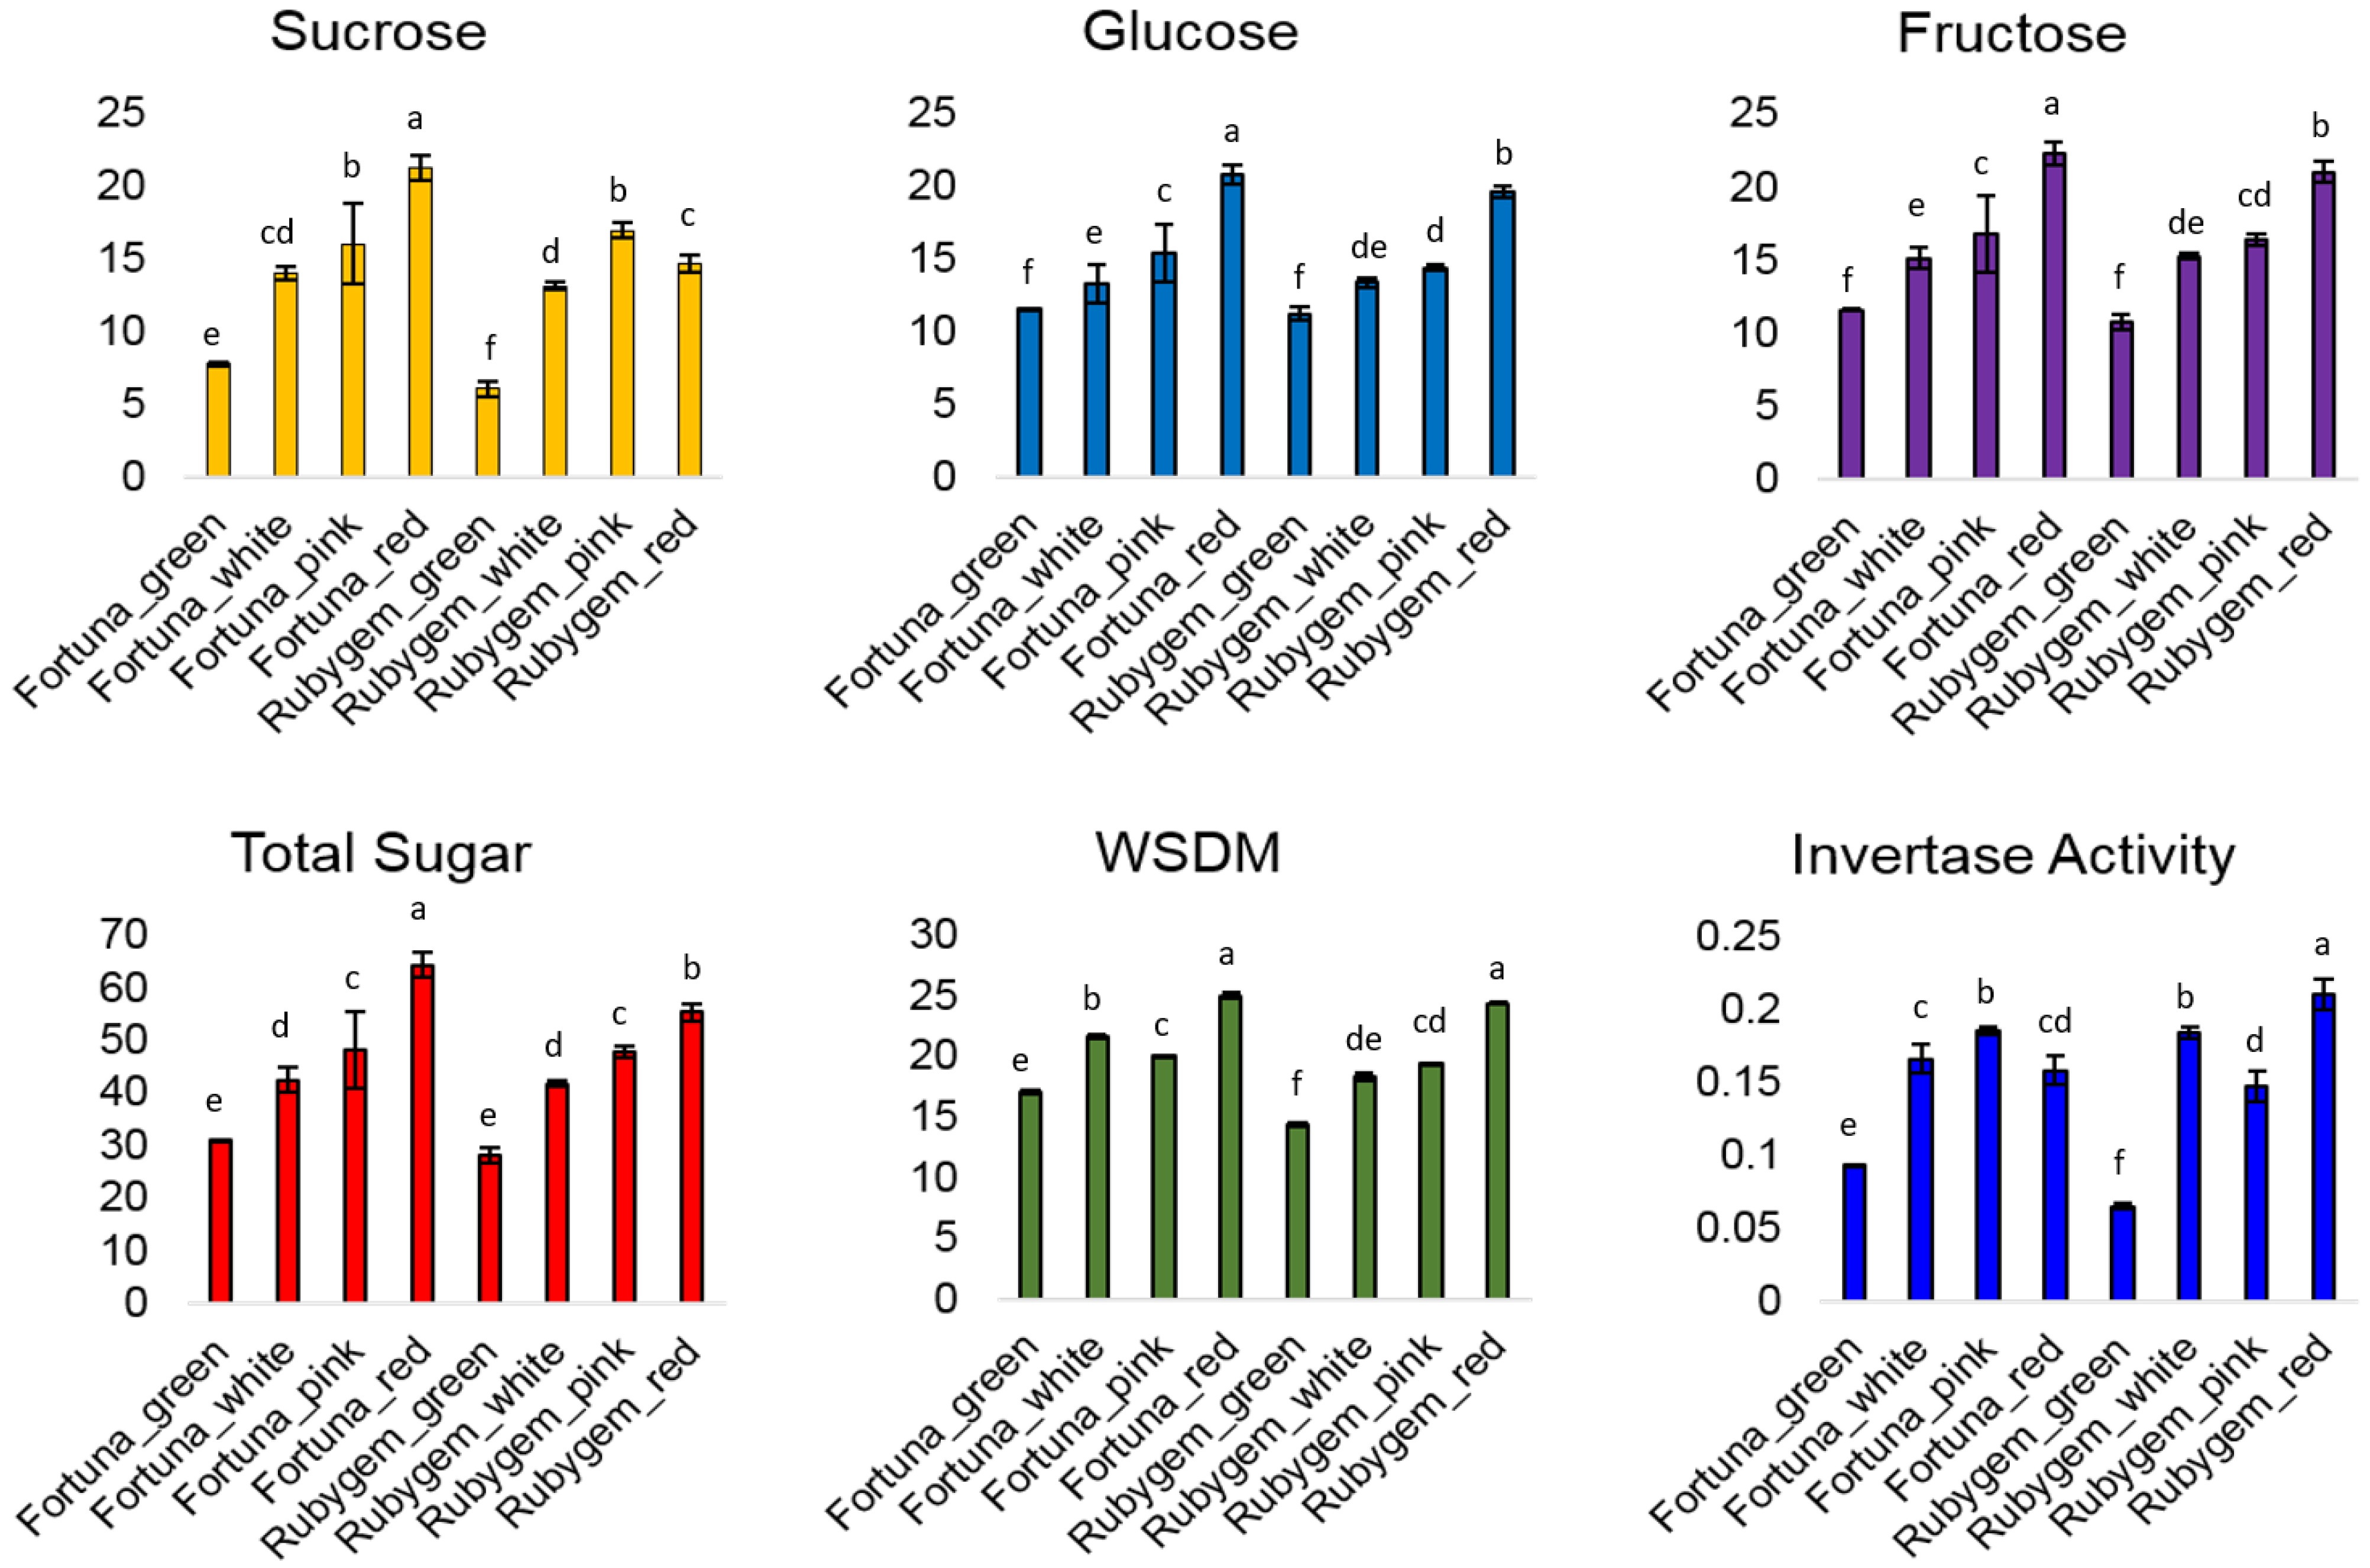
3.1. Sugar Content
3.2. Invertase Activity
3.3. Gene Expression
4. Discussion
4.1. Sugar Content and Invertase Activity
4.2. Gene Expression
5. Conclusions
Author Contributions
Funding
Institutional Review Board Statement
Informed Consent Statement
Data Availability Statement
Acknowledgments
Conflicts of Interest
References
- Juric, S.; Vlahovicek-Kahlina, K.; Duralija, B.; Maslov Bandic, L.; Nekic, P.; Vincekovic, M. Stimulation of plant secondary metabolites synthesis in soilless cultivated strawberries (Fragaria × ananassa Duchesne) using zinc-alginate microparticles. Turk. J. Agric. For. 2021, 45, 324–334. [Google Scholar] [CrossRef]
- Kilic, N.; Burgut, A.; Gündesli, M.A.; Nogay, G.; Ercisli, S.; Kafkas, N.E.; Ekiert, H.; Elansary, H.O.; Szopa, A. The Effect of organic, inorganic fertilizers and their combinations on fruit quality parameters in strawberry. Horticulturae 2021, 7, 354. [Google Scholar] [CrossRef]
- Tas, A.; Berk, S.K.; Orman, E.; Gundogdu, M.; Ercisli, S.; Karatas, N.; Jurikova, T.; Adamkova, A.; Nedomova, S.; Mlcek, J. Influence of pre-harvest gibberellic acid and post-harvest 1-methyl cyclopropane treatments on phenolic compounds, vitamin c and organic acid contents during the shelf life of strawberry fruits. Plants 2021, 10, 121. [Google Scholar] [CrossRef] [PubMed]
- Urün, I.; Attar, S.H.; Sönmez, D.A.; Gündeşli, M.A.; Ercişli, S.; Kafkas, N.E.; Bandić, L.M.; Duralija, B. Comparison of polyphenol, sugar, organic acid, volatile compounds, and antioxidant capacity of commercially grown strawberry cultivars in Turkey. Plants 2021, 10, 1654. [Google Scholar] [CrossRef]
- Lema-Rumińska, J.; Kulus, D.; Tymoszuk, A.; Miler, N.; Woźny, A.; Wenda-Piesik, A. Physiological, biochemical, and biometrical response of cultivated strawberry and wild strawberry in greenhouse gutter cultivation in the autumn-winter season in Poland-preliminary study. Agronomy 2021, 11, 1633. [Google Scholar] [CrossRef]
- Edger, P.P.; Poorten, T.J.; VanBuren, R.; Hardigan, M.A.; Colle, M.; McKain, M.R.; Smith, R.D.; Teresi, S.J.; Nelson, A.D.L.; Wai, C.M.; et al. Origin and evolution of the octoploid strawberry genome. Nat. Genet. 2019, 51, 541–547. [Google Scholar] [CrossRef] [Green Version]
- Burger, A.L. Proving More Versatile Than Just ‘Strawberries and Cream?’ The Use of Strawberries in the Genetic Manipulation of Grapevine Fruit Metabolism. Wynboer. 2000. Available online: http://www.wynboer.co.za/recentarticles/200505strawberries.php3 (accessed on 12 October 2021).
- Basson, C.E.; Groenewald, J.H.; Kossmann, J.; Cronje, C.; Bauer, R. Sugar and acid-related quality attributes and enzyme activities in strawberry fruits: Invertase is the main sucrose hydrolysing enzyme. Food Chem. 2010, 121, 1156–1162. [Google Scholar] [CrossRef]
- Darbellay, C.; Carlen, C.; Azodanlou, R.; Villettaz, J.C. Measurement of the organoleptic quality of strawberries. Acta Hortic. 2002, 567, 819–822. [Google Scholar] [CrossRef]
- Batista-Silva, W.; Nascimento, V.L.; Medeiros, D.B.; Nunes-Nesi, A.; Ribeiro, D.M.; Zsögön, A.; Araújo, W.L. Modifications in organic acid profiles during fruit development and ripening: Correlation or causation? Front. Plant Sci. 2018, 9, 1689. [Google Scholar] [CrossRef]
- Ménager, I.; Jost, M.; Aubert, C. Changes in physicochemical characteristics and volatile constituents of strawberry (cv. cigaline) during maturation. J. Agric. Food Chem. 2004, 52, 1248–1254. [Google Scholar] [CrossRef]
- Forney, C.F.; Breen, P.J. Collection and characterization of phloem exudates from strawberry pedicels. Hortic. Sci. 1985, 20, 413–414. [Google Scholar]
- Doehlert, D.C. Sink strength: Dynamic with source strength. Plant Cell Environ. 1993, 16, 1027–1028. [Google Scholar] [CrossRef]
- Kruger, N.J. Carbohydrate synthesis and degradation. In Plant Metabolism, 2nd ed.; Dennis, D.T., Turpin, D.H., Lefebvre, D.D., Layzell, D.B., Eds.; Addison Wesley Longman: Singapore, 1998; pp. 83–104. [Google Scholar]
- Taiz, L.; Zeiger, E. Plant Physiology; Sinauer Associates, Inc.: Sunderland, UK, 2002. [Google Scholar]
- Lee, J.; Kim, H.B.; Noh, Y.H.; Min, S.R.; Lee, H.S.; Jung, J.; Park, K.H.; Kim, D.S.; Nam, M.H.; Kim, T.I.; et al. Sugar content and expression of sugar metabolism-related gene in strawberry fruits from various cultivars. J. Plant Biotechnol. 2018, 45, 90–101. [Google Scholar] [CrossRef]
- Giaquinta, R.T. Sucrose translocation and storage in sugar beet. Plant Physiol. 1979, 63, 828–832. [Google Scholar] [CrossRef] [PubMed] [Green Version]
- Hubbard, N.; Pharr, D.M.; Huber, S.C. sucrose phosphate synthase and other sucrose metabolizing enzymes in fruits of various species. Physiol. Plant 1991, 82, 191–196. [Google Scholar] [CrossRef]
- Wongmetha, O.; Ke, L.S.; Liang, Y.S. Sucrose metabolism and physiological changes during mango cv. irwin growth and development. Hortic. Environ. Biotechnol. 2012, 5, 373–377. [Google Scholar] [CrossRef]
- Hong, H.R.; Oh, E.U.; Han, S.G.; Yun, S.H.; Kim, H.B.; Song, K.J. Characterization of soluble sugar content, related enzyme activity and gene expression in the fruits of ‘Minihyang’ mandarin on different rootstocks. Horticulturae 2022, 8, 47. [Google Scholar] [CrossRef]
- Wu, B.-P.; Zhang, C.; Gao, Y.-B.; Zheng, W.-W.; Xu, K. Changes in sugar accumulation and related enzyme activities of red bayberry (myrica rubra) in greenhouse cultivation. Horticulturae 2021, 7, 429. [Google Scholar] [CrossRef]
- Park, J.I.; Lee, Y.K.; Chung, W.I.; Lee, I.H.; Choi, J.H.; Lee, W.M.; Ezura, H.; Lee, S.P.; Kim, I.J. Modification of sugar composition in strawberry fruit by antisense suppression of an adp-glucose pyrophosphorylase. Mol. Breed. 2006, 17, 269–279. [Google Scholar] [CrossRef]
- Windram, O.; Madhou, P.; Mchattie, S.; Hill, C.; Hickman, R.; Cooke, E.; Jenkins, D.J.; Penfold, C.A.; Baxter, L.; Breeze, E.; et al. Arabidopsis defense against Botrytis cinerea: Chronology and regulation deciphered by high-resolution temporal transcriptomic analysis. Plant Cell 2012, 24, 3530–3557. [Google Scholar] [CrossRef] [Green Version]
- Pandey, V.; Niranjan, A.; Atri, N.; Chandrashekhar, K.; Mishra, M.K.; Trivedi, P.K.; Misra, P. WsSGTL1 gene from Withania somnifera, modulates glycosylation profile, antioxidant system and confers biotic and salt stress tolerance in transgenic tobacco. Planta 2014, 239, 1217–1231. [Google Scholar] [CrossRef] [PubMed]
- Kafkas, E.; Kosar, M.; Paydas, S.; Kafkas, S.; Baser, K.H.C. Quality characteristics of strawberry genotypes at different maturation stages. Food Chem. 2007, 100, 1229–1236. [Google Scholar] [CrossRef]
- Food and Agricultural Organization. Statistical Data Base. In Crops; FAO: Rome, Italy, 2021; Available online: www.fao.org (accessed on 10 November 2021).
- Türemiş, N.; Ağaoğlu, Y.S. Strawberries. In Berries; Ağaoğlu, Y.S., Gerçekcioğlu, R., Eds.; Tomurcukbağ Ltd.: Ankara, Turkey, 2013; Publication No: 1; pp. 55–100. [Google Scholar]
- Herrington, M.E.; Chandler, C.K.; Moisander, J.A.; Reid, C.E. ‘Rubygem’ strawberry. HortScience 2007, 2, 1482–1483. [Google Scholar] [CrossRef] [Green Version]
- Chandler, C.K.; Santos, B.M.; Peres, N.A.; Joquand, C.; Plotto, A.; Sims, C.A. ‘Florida Radiance’ Strawberry. HortScience 2009, 44, 1769–1770. [Google Scholar] [CrossRef] [Green Version]
- Montero, T.M.; Mollá, E.M.; Esteban, R.M.; López-Andréu, F.J. Quality attributes of strawberry during ripening. Sci. Hortic. 1996, 65, 239–250. [Google Scholar] [CrossRef]
- Akšić, M.F.; Tosti, T.; Sredojević, M.; Milivojević, J.; Meland, M.; Natić, M. Comparison of sugar profile between leaves and fruits of blueberry and strawberry cultivars grown in organic and integrated production system. Plants 2019, 8, 205. [Google Scholar] [CrossRef] [Green Version]
- Morkunas, I.; Stobiecki, M.; Marczak, Ł.; Stachowiak, J.; Narożna, D.; Remlein-Starosta, D. Changes in carbohydrate and isoflavonoid metabolism in yellow lupine in response to infection by Fusarium oxysporum during the stages of seed germination and early seedling growth. Physiol. Mol. Plant Pathol. 2010, 75, 46–55. [Google Scholar] [CrossRef]
- King, S.P.; Lunn, J.E.; Furbank, R.T. Carbohydrate Content and Enzyme Metabolism in Developing Canoa Siliques. Plant Physiol. 1997, 114, 153–160. [Google Scholar] [CrossRef] [Green Version]
- Krishnan, H.B.; Pueppke, S.G. Cherry fruit invertase: Partia1 purification, characterization and activity during fruit development. J. Plant Physiol. 1990, 135, 662–666. [Google Scholar] [CrossRef]
- Ayvaz Sönmez, D.; Ürün, I.; Alagöz, D.; Attar, Ş.H.; Doğu, Z.; Yeşil, B.; Woźniak, A.; Labudda, M.; Zydlik, Z.; Zydlik, P.; et al. Phenylalanine ammonialyase and invertase activities in strawberry fruit during ripening progress. Acta Hortic. 2021, 15, 947–956. [Google Scholar] [CrossRef]
- AOAC-Association of Official Analytical Chemists. Official Methods of Analysis of the Association of the Analytical Chemists; AOAC: Rockville, VA, USA, 2016. [Google Scholar]
- Blandino, A.; Macías, M.; Cantero, D. Modelling and simulation of a bienzymatic reaction system co-immobilised within hydrogel-membrane liquid-core capsules. Enzyme Microb. Technol. 2002, 31, 556–565. [Google Scholar] [CrossRef]
- Carvalho, A.; Grac, A.C.; Carocha, V.; Pera, S.; Luis Lousada, J.; Lima-Brito, J.; Paiva, J.A.P. An improved total RNA isolation from secondary tissues of woody species for coding and non-coding gene expression analyses. Wood Sci. Technol. 2015, 49, 647–658. [Google Scholar] [CrossRef]
- Shulaev, V.; Sargent, D.J.; Crowhurst, R.N.; Mockler, T.C.; Folkerts, O.; Delcher, A.L.; Jaiswal, P.; Mockaitis, K.; Liston, A.; Mane, S.P.; et al. The genome of woodland strawberry (Fragaria vesca). Nat. Genet. 2011, 43, 109–116. [Google Scholar] [CrossRef] [PubMed]
- Shanmugam, A.; Hossain, M.R.; Natarajan, S.; Jung, H.J.; Song, J.Y.; Kim, H.T.; Nou, I.S. Sugar content analysis and expression profiling of sugar related genes in contrasting strawberry (Fragaria × ananassa) cultivars. J. Plant Biotechnol. 2017, 44, 178–190. [Google Scholar] [CrossRef] [Green Version]
- Sturm, K.; Koron, D.; Stampar, F. The composition of fruit of different strawberry varieties depending on maturity stage. Food Chem. 2003, 83, 417–422. [Google Scholar] [CrossRef]
- Tian, L.; Jia, H.F.; Li, C.L.; Fan, P.G.; Xing, Y.; Shen, Y.Y. Sucrose accumulation during grape berry and strawberry fruit ripening is controlled predominantly by sucrose synthase activity. J. Hortic. Sci. 2015, 87, 661–667. [Google Scholar] [CrossRef]
- Ranwala, A.P.; Suematsu, C.; Masuda, H. Soluble and wall-bound invertases in strawberry fruit. Plant Sci. 1992, 84, 59–64. [Google Scholar] [CrossRef]
- Lia, D.; Zhanga, X.; Xua, Y.; Lia, L.; Aghdamb, M.S.; Luoa, Z. Effect of exogenous sucrose on anthocyanin synthesis in postharvest strawberry fruit. Food Chem. 2019, 289, 112–120. [Google Scholar] [CrossRef]
- Del Olmo, I.; Blanch, M.; Romero, I.; Vazquez-Hernandez, M.; Sanchez-Ballesta, M.T.; Escribano, M.I.; Merodio, C. Involvement of oligosaccharides and sucrose-related genes on sucrose retention in strawberries from ripening to shelf-life. Postharvest Biol. Technol. 2020, 169, 111301. [Google Scholar] [CrossRef]


| Enzyme | Assay Components | Substrate | Reference |
|---|---|---|---|
| Invertase | 120 mL of extract, 480 mL of 100 mM acetate buffer pH 5 or pH 7.5 and 100 mM sucrose | Sucrose | [31,32] |
| Gene ID | Gene | Primers | Forward Primer 5′ to 3′ Reverse Primer 5′ to 3′ | Annealing Temperature (°C) |
|---|---|---|---|---|
| LOC105353049 | neutral alkaline invertase 3, chloroplastic-like [Fragaria vesca (wild strawberry)] | St-1 | CAAGAAGGAAATCGAAGCACAGGCCCAGGAHCATGATTA | 55 |
| LOC101304591 | alkaline neutral invertase A, mitochondrial [Fragaria vesca (wild strawberry)] | St-2 | AGGGAGTTTTCGGACATTGAAATACGTCACCACCGACTCC | 55 |
| LOC101314895 | probable alkaline neutral invertase F [Fragaria vesca (wild strawberry)] | St-3 | CTAAGCGCATCGCAGCTCGCTGCTTAAAATCAAGCCAGTAG | 55 |
| LOC101296189 | alkaline neutral invertase A, mitochondrial [Fragaria vesca (wild strawberry)] | St-4 | GAATTGGCAGAAAAGGCAGTTCAGGCCAATGATCTATAGAAAGC | 55 |
| LOC101296831 | probable alkaline neutral invertase D [Fragaria vesca (wild strawberry)] | St-5 | GGTTTTTGTGCGTGACTTTGTCAGGCTCACCATTCATCAG | 55 |
| LOC101301732 | probable alkaline neutral invertase B [Fragaria vesca (wild strawberry)] | St-6 | AGTTGCTCCGGTTGATTCTGGATTTTGTGTATGCGCGAAG | 55 |
| LOC101292085 | alkaline neutral invertase E, chloroplastic [Fragaria vesca (wild strawberry)] | St-7 | TTGGAGCACGTGAAATGCTTTAAGCGCTTGCATGAGG | 55 |
| Traits | Sucrose | Glucose | Fructose | Total Sugar | WSDM | Invertase Activity |
|---|---|---|---|---|---|---|
| Sucrose | 1 | 0.8 * | 0.88 ** | 0.94 *** | 0.83 * | 0.69 * |
| Glucose | 0.8 * | 1 | 0.98 *** | 0.95 *** | 0.91 ** | 0.64 * |
| Fructose | 0.88 ** | 0.98 *** | 1 | 0.99 *** | 0.94 *** | 0.75 * |
| Total Sugar | 0.94 *** | 0.95 *** | 0.99 *** | 1 | 0.92 *** | 0.73 * |
| WSDM | 0.83 * | 0.91 ** | 0.94 *** | 0.92 *** | 1 | 0.75 * |
| Invertase Activity | 0.69 * | 0.64 * | 0.75 * | 0.73 * | 0.75 * | 1 |
Publisher’s Note: MDPI stays neutral with regard to jurisdictional claims in published maps and institutional affiliations. |
© 2022 by the authors. Licensee MDPI, Basel, Switzerland. This article is an open access article distributed under the terms and conditions of the Creative Commons Attribution (CC BY) license (https://creativecommons.org/licenses/by/4.0/).
Share and Cite
Topcu, H.; Degirmenci, I.; Sonmez, D.A.; Paizila, A.; Karci, H.; Kafkas, S.; Kafkas, E.; Ercisli, S.; Alatawi, A. Sugar, Invertase Enzyme Activities and Invertase Gene Expression in Different Developmental Stages of Strawberry Fruits. Plants 2022, 11, 509. https://doi.org/10.3390/plants11040509
Topcu H, Degirmenci I, Sonmez DA, Paizila A, Karci H, Kafkas S, Kafkas E, Ercisli S, Alatawi A. Sugar, Invertase Enzyme Activities and Invertase Gene Expression in Different Developmental Stages of Strawberry Fruits. Plants. 2022; 11(4):509. https://doi.org/10.3390/plants11040509
Chicago/Turabian StyleTopcu, Hayat, Ipek Degirmenci, Duygu Ayvaz Sonmez, Aibibula Paizila, Harun Karci, Salih Kafkas, Ebru Kafkas, Sezai Ercisli, and Aishah Alatawi. 2022. "Sugar, Invertase Enzyme Activities and Invertase Gene Expression in Different Developmental Stages of Strawberry Fruits" Plants 11, no. 4: 509. https://doi.org/10.3390/plants11040509
APA StyleTopcu, H., Degirmenci, I., Sonmez, D. A., Paizila, A., Karci, H., Kafkas, S., Kafkas, E., Ercisli, S., & Alatawi, A. (2022). Sugar, Invertase Enzyme Activities and Invertase Gene Expression in Different Developmental Stages of Strawberry Fruits. Plants, 11(4), 509. https://doi.org/10.3390/plants11040509