Article

Comparative Assessment of Grassland Dynamic and Its Response to Drought Based on Multi-Index in the Mongolian Plateau

1
College of Life Sciences, Yulin University, Yulin 719000, China
2
Department of Ecology, School of Life Science, Nanjing University, Nanjing 210023, China
3
State Key Laboratory of Plateau Ecology and Agriculture, Qinghai University, Xining 810016, China
4
School of Environment and Planning, Liaocheng University, Liaocheng 252059, China
5
Nanjing Institutes of Environmental Sciences, Ministry of Environmental Protection of the People’s Republic of China, Nanjing 210042, China
*
Authors to whom correspondence should be addressed.
Plants 2022, 11(3), 310; https://doi.org/10.3390/plants11030310
Submission received: 20 October 2021 / Revised: 15 December 2021 / Accepted: 21 December 2021 / Published: 25 January 2022
(This article belongs to the Special Issue Ecophysiology and Ecology of Grassland)

Abstract

:
This study applied grassland related multi-index and assessed the effects of climate change by investigating grassland responses to drought. This process was performed to study grassland vegetation dynamic accurately and evaluate the effect of drought in the Mongolian Plateau (MP). The spatial–temporal characteristics of grassland dynamic in terms of coverage (Fv), surface bareness (Fb), and net primary production (NPP) from 2000 to 2013 were explored. We implemented the maximum Pearson correlation to analyze the grassland vegetation in response to drought by using self-calibrating Palmer Drought Severity Index (scPDSI). Results show that Fv and NPP present an increasing trend (0.18 vs. 0.43). Fb showed a decreasing trend with a value of −0.16. The grassland Fv and NPP positively correlated with scPDSI, with a value of 0.12 and 0.85, respectively, and Fb was −0.08. The positive correlation between Fv and NPP accounted for 84.08%, and the positive correlation between Fv and scPDSI accounted for 93.88%. On the contrary, the area with a negative correlation between Fb and scPDSI was 57.43%. The grassland in the MP showed a recovery tendency. The increase in grassland caused by positive reaction was mainly distributed in the middle of Mongolia (MG), whereas that caused by counter response was mainly distributed in the east and west MG and northeast Inner Mongolia autonomous region of China (IM). The relevant results may provide useful information for policymakers about mitigation strategies against the inverse effects of drought on grassland and help to ease the losses caused by drought.

1. Introduction

As the earth’s largest terrestrial ecosystem, grassland plays an important role in ecosystem cycles [1,2,3]. Evaluating the dynamic change in grassland ecosystem quantitatively is urgent because grassland provides many economic products and ecological services [4,5]. Previous research investigated the impact of climate change on the grassland vegetation dynamic by using different indicators. The indicators to evaluate grassland vegetation dynamic by remote sensing technology mainly include the normalized difference vegetation index (NDVI), enhanced vegetation index (EVI), vegetation coverage (Fv), and net primary productivity (NPP) [6,7,8]. Some recent studies have proposed ground bareness (Fb) as another important parameter of global land cover change [9,10]. As an opposite concept of Fv, Fb contains the attribute of surface reflectivity and temperature information of grassland vegetation rather than a complementary set of coverage. In recent years, research has focused on drought events by using the combination of identified NPP and NDVI [11]. Compared with single index analysis, the vegetation dynamic inversion based on multi-index can help to improve the reliability of results due to the diversities of analysis.
Drought is a natural phenomenon where the availability of water is significantly lower than normal for a long period and the supply cannot meet the existing demand [12]. With global warming, drought is quickly becoming a devastating environment incident [13]. The International Disaster Database estimated that droughts attributed approximately 5% of the natural disasters over the globe, and the losses caused by drought disasters accounted for more than 30% of those of the natural hazards [14]. Drought has been a crucial scientific issue in the domain of climate research due to its negative effects on water resources, livestock husbandry development, and local economy [15,16,17]. The influence of drought on terrestrial ecosystems is becoming increasingly acute [18]. The grassland dynamics and its response to driving factors are always investigated by researchers because grassland is more susceptible to droughts than other ecosystems [19]. Previous studies explored the impact of drought on grassland vegetation dynamic at multiple regions. Some researchers evaluated the NPP distribution and response to drought in Europe [20]. Their results suggest that rainfall deficit and extreme summer heat reduce the vegetation productivity in Eastern and Western Europe, respectively. Another study strengthened the conclusion of drought-induced reduction in NPP over the past decade in central Asia [21]. Therefore, a better understanding in grassland vegetation dynamic and its feedback on climate change will improve the local economic development, especially for the typical farming and pastoral areas.
The Mongolian Plateau (MP) is a typical arid and semiarid area, with natural grassland as the dominant vegetation type. It often suffered from different conditions of drought due to the decreasing water resource supply and climate change [22,23]. Droughts over the last century induced a heap of negative effects, such as water resource shortages, threat of food shortages, and vegetation degradation [24,25,26,27]. Therefore, quantitative assessment of grassland vegetation dynamic and the effect of droughts is urgent. In accordance with the recent analysis, the summer drought has contributed to the increasing extreme droughts since the 1990s [28]. Some researchers have proven that the self-calibrating Palmer Drought Severity Index (scPDSI) is suitable than other drought indexes when considering the impact of precipitation and temperature on the soil moisture in Inner Asia [29]. Another research from Wang revealed that the global grassland scPDSI value has a slightly increasing trend with a rate of 0.0119 per year [30]. However, there is still a lack of research on grassland vegetation dynamic and its response to droughts of the MP.
There are many related previous studies focused on single or two vegetation indexes to evaluate the grassland dynamic and its response to climate factors [31,32,33]. To enrich vegetation related research indicators, we selected Fv, Fb, and NPP to reflect the grassland vegetation dynamic for improving the reliability of conclusions. We evaluated the grassland response to droughts during the study period. A combined analysis of the three indexes in different drought severity areas was quantitatively assessed to enhance the credibility of the results. The results may provide a scientific basis for guiding ecological environment improvement and drought prevention for typical farming and pastoral areas in the world.

2. Results

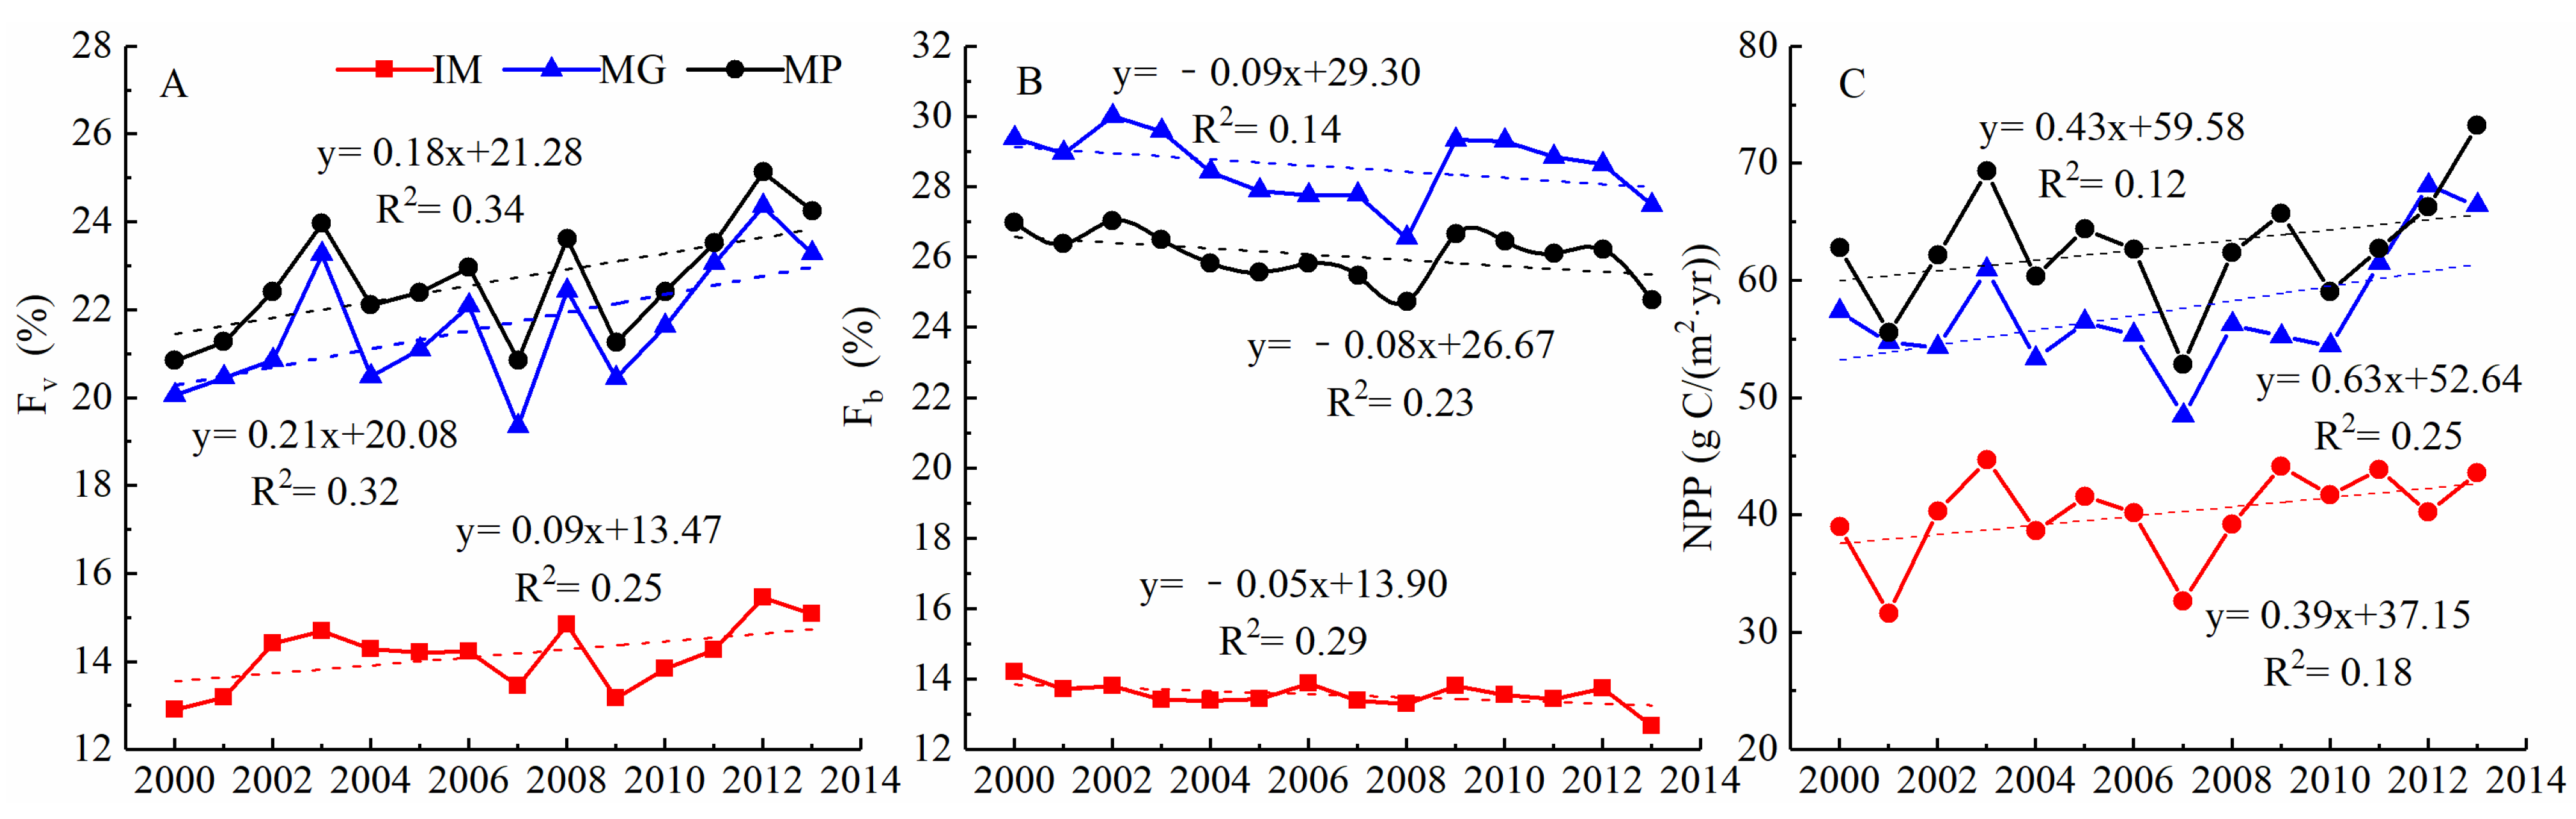
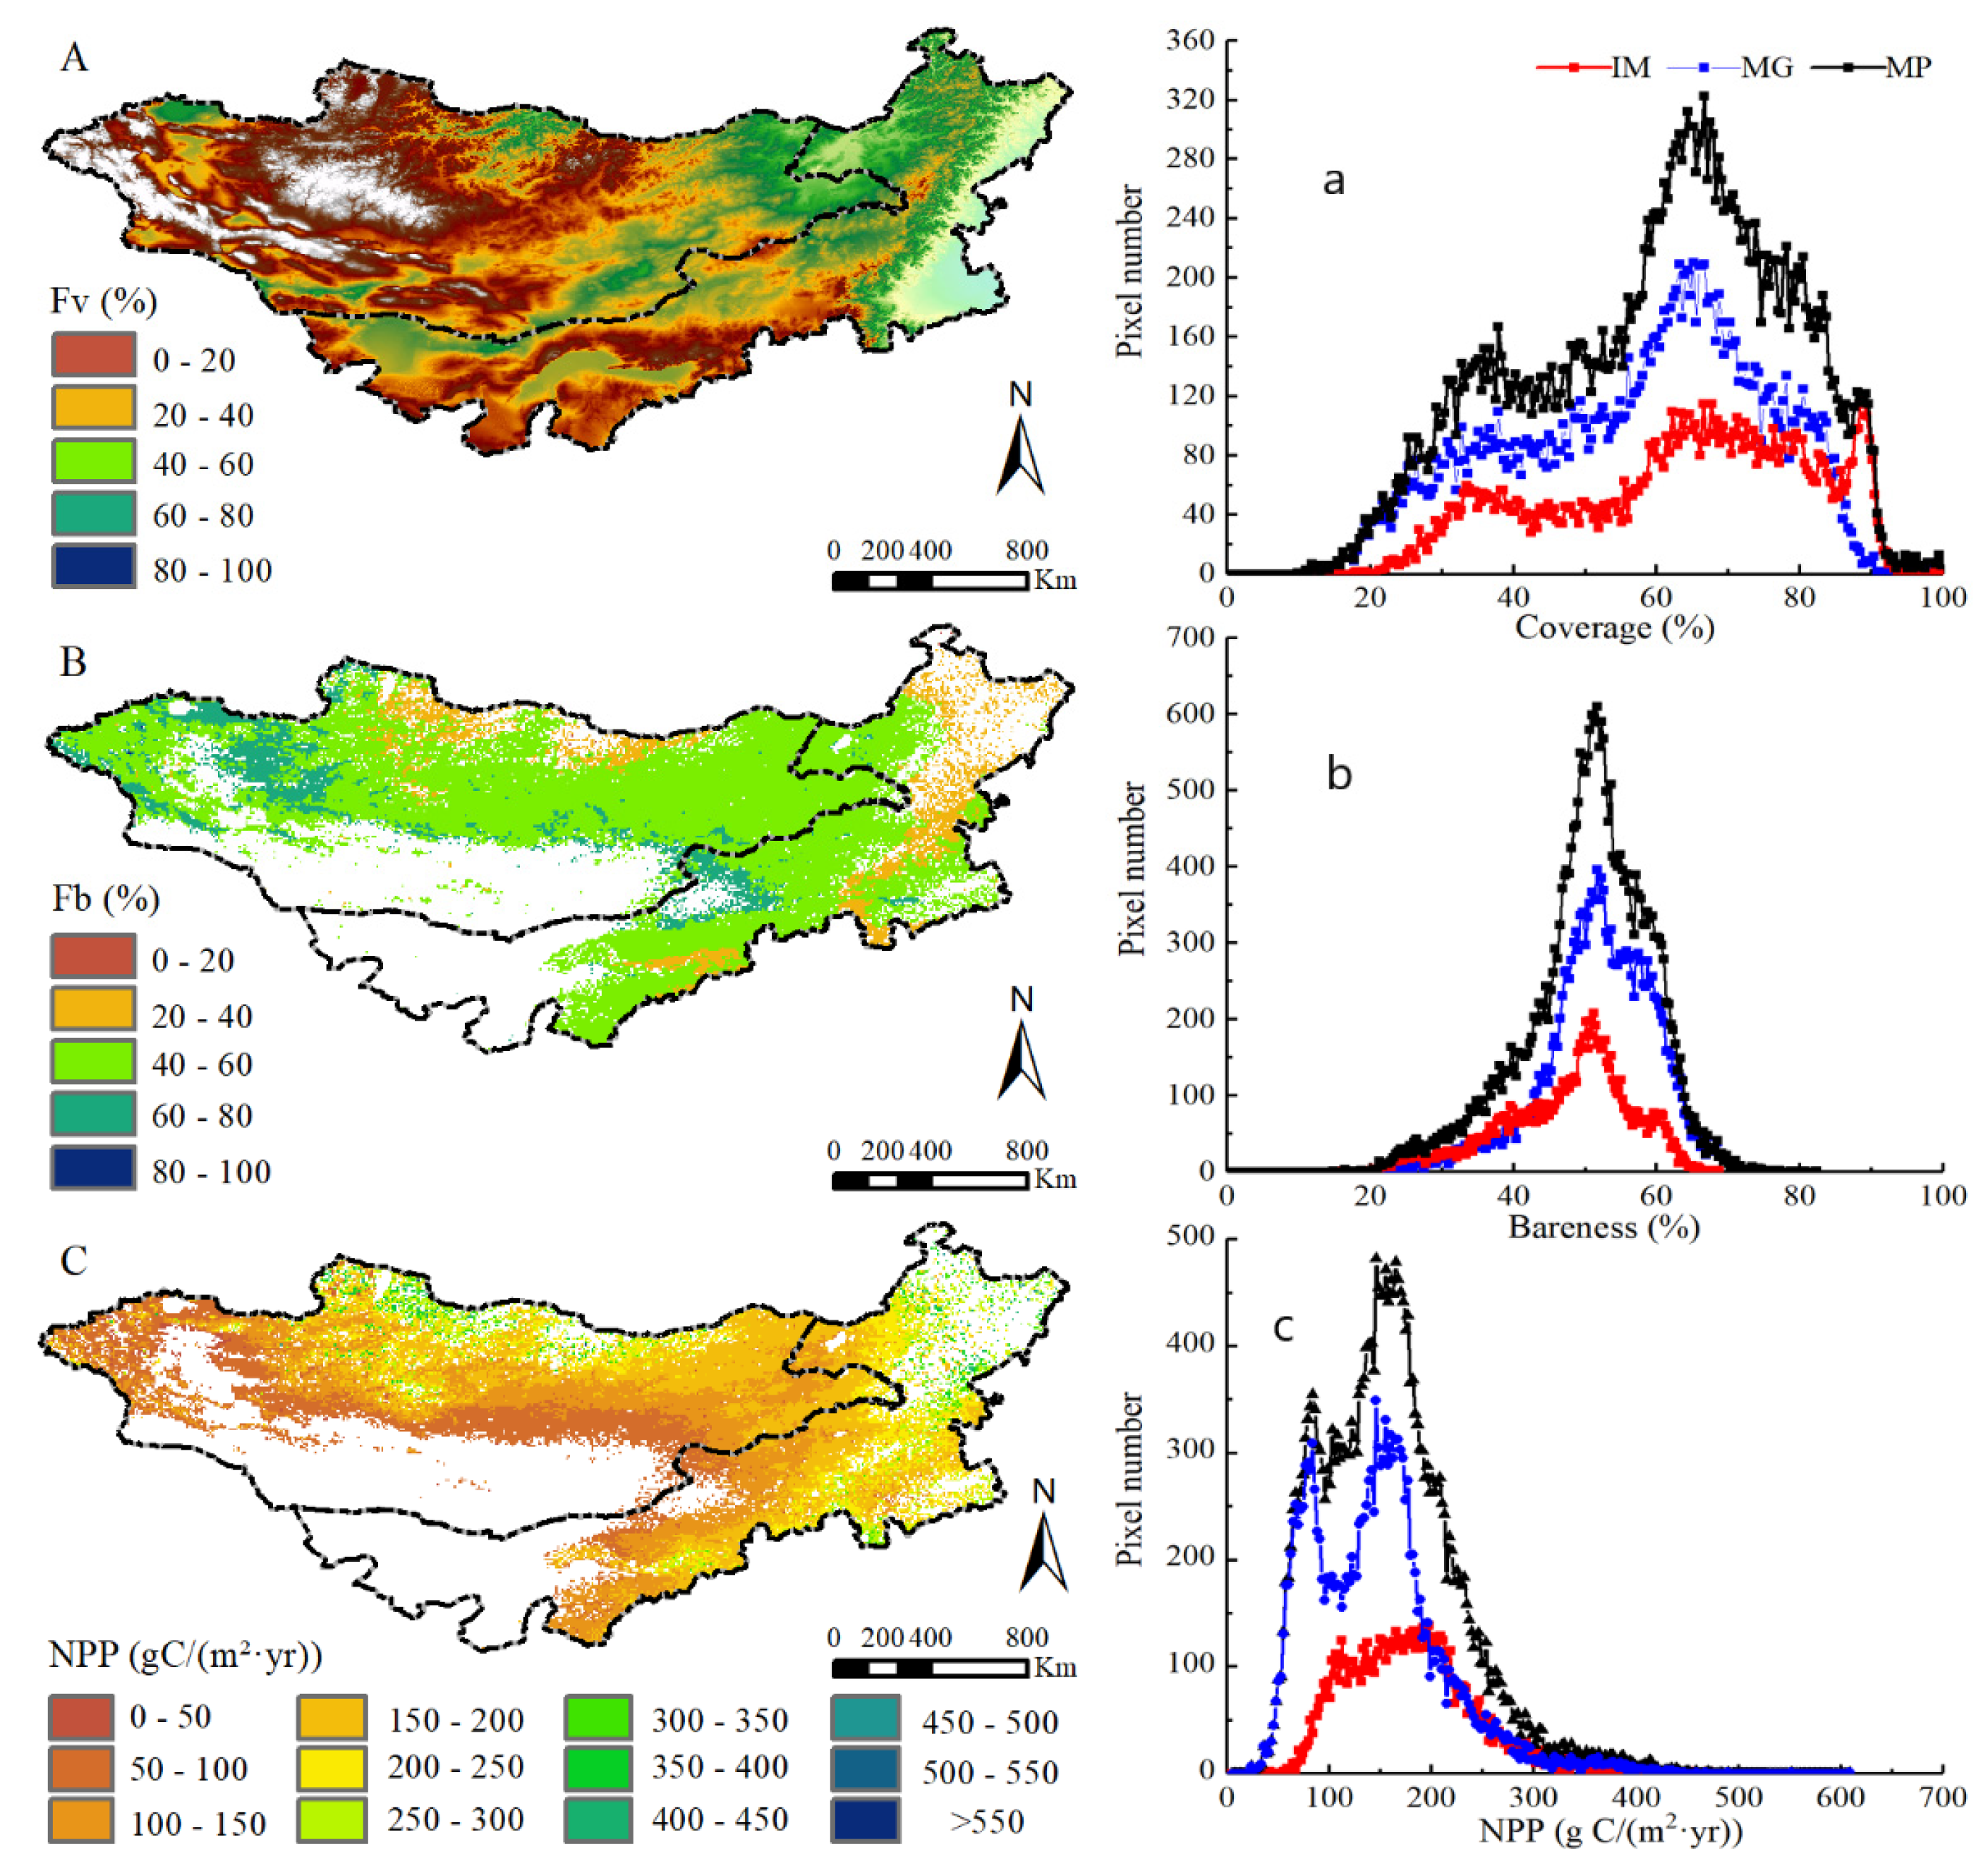
2.1. Spatial and Temporal Distribution of Fv, Fb, and NPP

The spatial distribution of long-term mean grass Fv, Fb, and NPP in the Mongolia Plateau is shown in Figure 1. The grass Fv value is relatively higher in northern and northeastern MP, while lower in southwestern and western MP (Figure 1A). On the contrary, Fb greater than 60% distributed over the southwestern and western MP, while Fb less than 40% mainly distributed over the northeastern and northern MP (Figure 1B). The mean actual NPP showed obvious spatial heterogeneity, too (Figure 1C). Areas with mean actual NPP larger than 200 g C/(m2·yr) were scattered in the northern and northeastern MP with good vegetation growth conditions. Areas with mean actual NPP lower than 100 g C/(m2·yr) were mainly scattered in the regions with relatively scarce water resources and vegetation in the transition area of grassland and desert such as southwestern and western MP. We counted the different pixel values of grassland Fv (Figure 1a), Fb (Figure 1b), and NPP (Figure 1c) in the MP. The average Fv, Fb, and NPP values were 18.42%, 15.53%, and 61.41 g C/(m2·yr), respectively, whereas the corresponding distribution rates of their peak value were 60–80%, 40–60%, and 150–200 g C/(m2·yr). The Fv, Fb, and NPP of IM were 9.17%, 6.84%, and 24.82 g C/(m2·yr), respectively. MG had higher values of the three indexes than IM. The corresponding distribution rates of IM and MG peak values were similar to the MP.
In this study, grassland Fv in the MP exhibited an increasing trend from 2000 to 2013, with a 14-year cumulative increment of 0.18 (Figure 2). MG had a higher Fv value than IM (0.21 vs. 0.09). On the contrary, grassland Fb showed an overall decreasing trend in the MP, with the decreased rate of −0.08. The decrease rates of MG and IM were −0.09 and −0.05, respectively. NPP had the largest change rate compared with the two other indexes, with a 14-year cumulative increment of 0.43. MG had a higher increase value than IM (0.63 vs. 0.39).

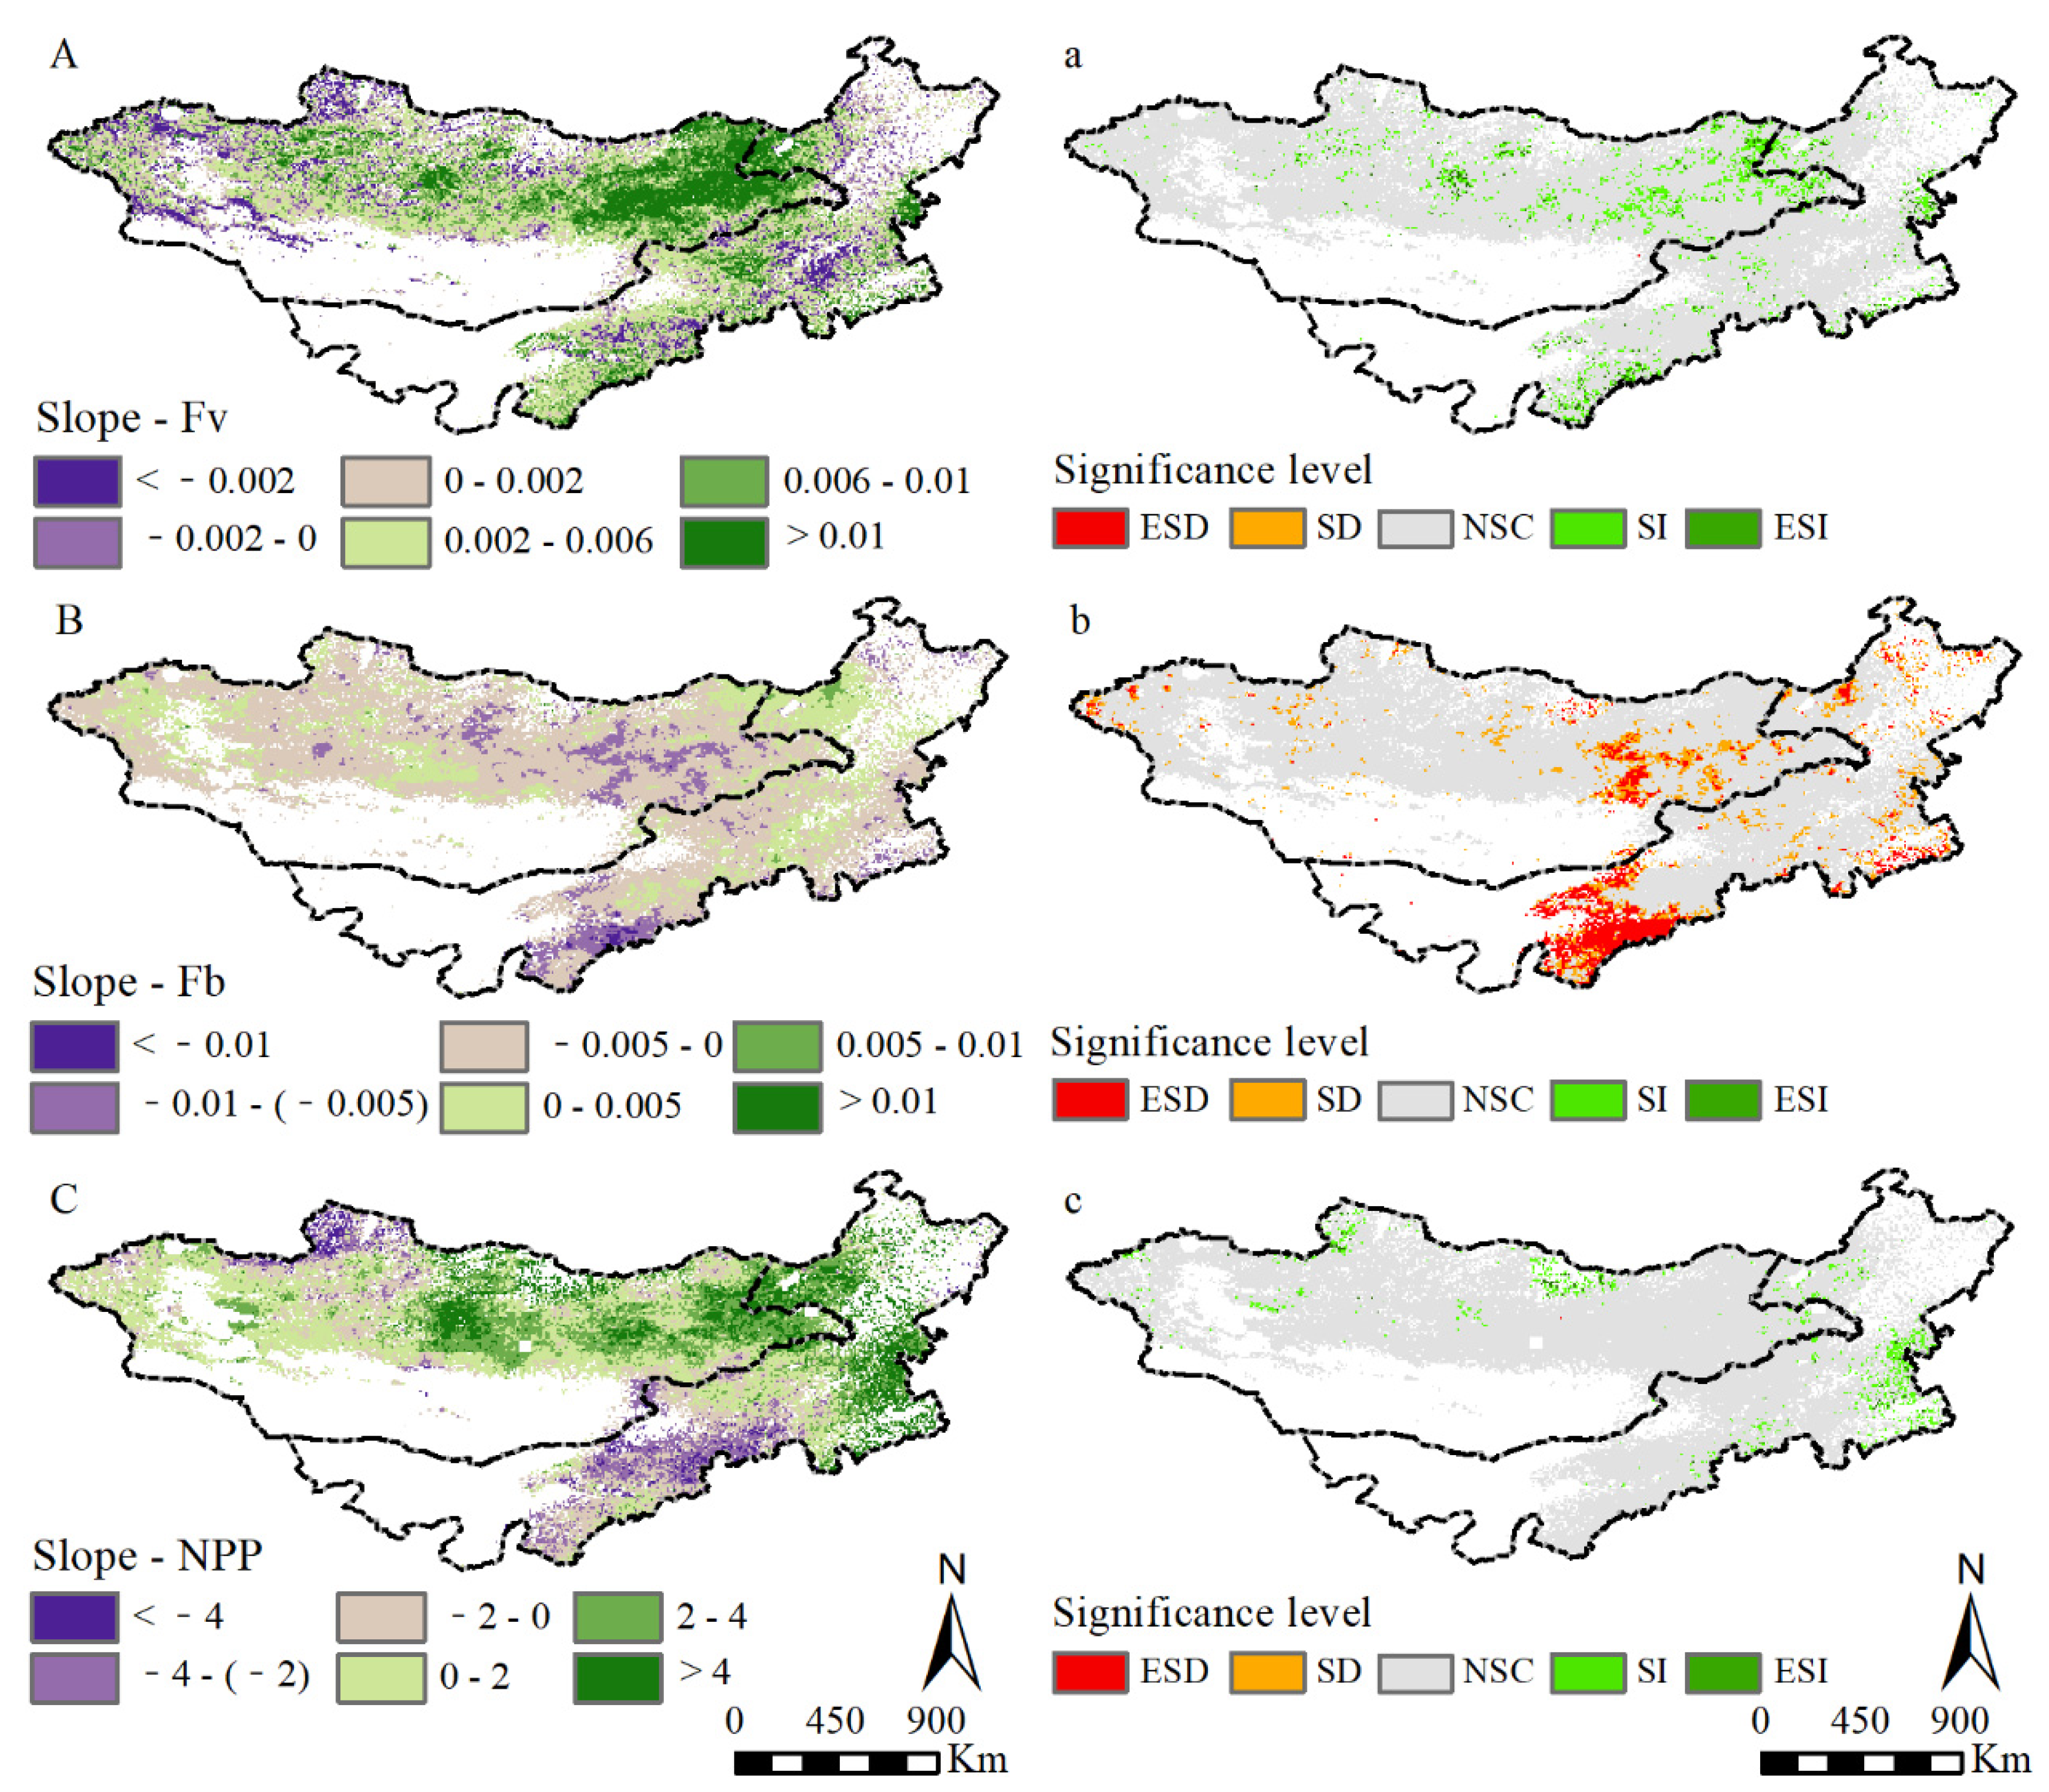
2.2. Dynamic Analysis of Grassland

The changing trend and significance levels of grassland Fv, Fb, and NPP in the MP from 2000 to 2013 are shown in Figure 3. The growth rate of Fv occupied 60.51% of the MP grassland, mainly found in the east and central MG, east Xing’an, south Ordos, and central IM (Figure 3A). On the contrary, the regions of Fb exhibiting decreasing trends were extremely larger than that with increasing trends (92.64% vs. 7.36%), with the decreased rate of −0.0005/14a. The decreased regions were mainly found in the entire MP, typically occurring in the southwest and middle MP (Figure 3B). The NPP increasing areas occupied 79.54% of the MP grassland, mainly found in Kent Mountains and Hanggai Mountains in MG and east Xing’an League in IM (Figure 3C). Fv with clear increases was distributed in the east Dornod, Hangai Mountains, and Kent Mountains in MG, and east Xing’an and south Ordos in IM (Figure 3a). Fb exhibited a significant decrease (SD) and an extremely significant decrease (ESD), accounting for 14.77% and 11.61% of the MP grassland, respectively (Figure 3b). The regions of NPP with a significant increase (SI) accounted for 4.27% of the MP grassland. The regions with significant increase were mainly distributed in the east Selenge in MG and east Xing’an in IM (Figure 3c).

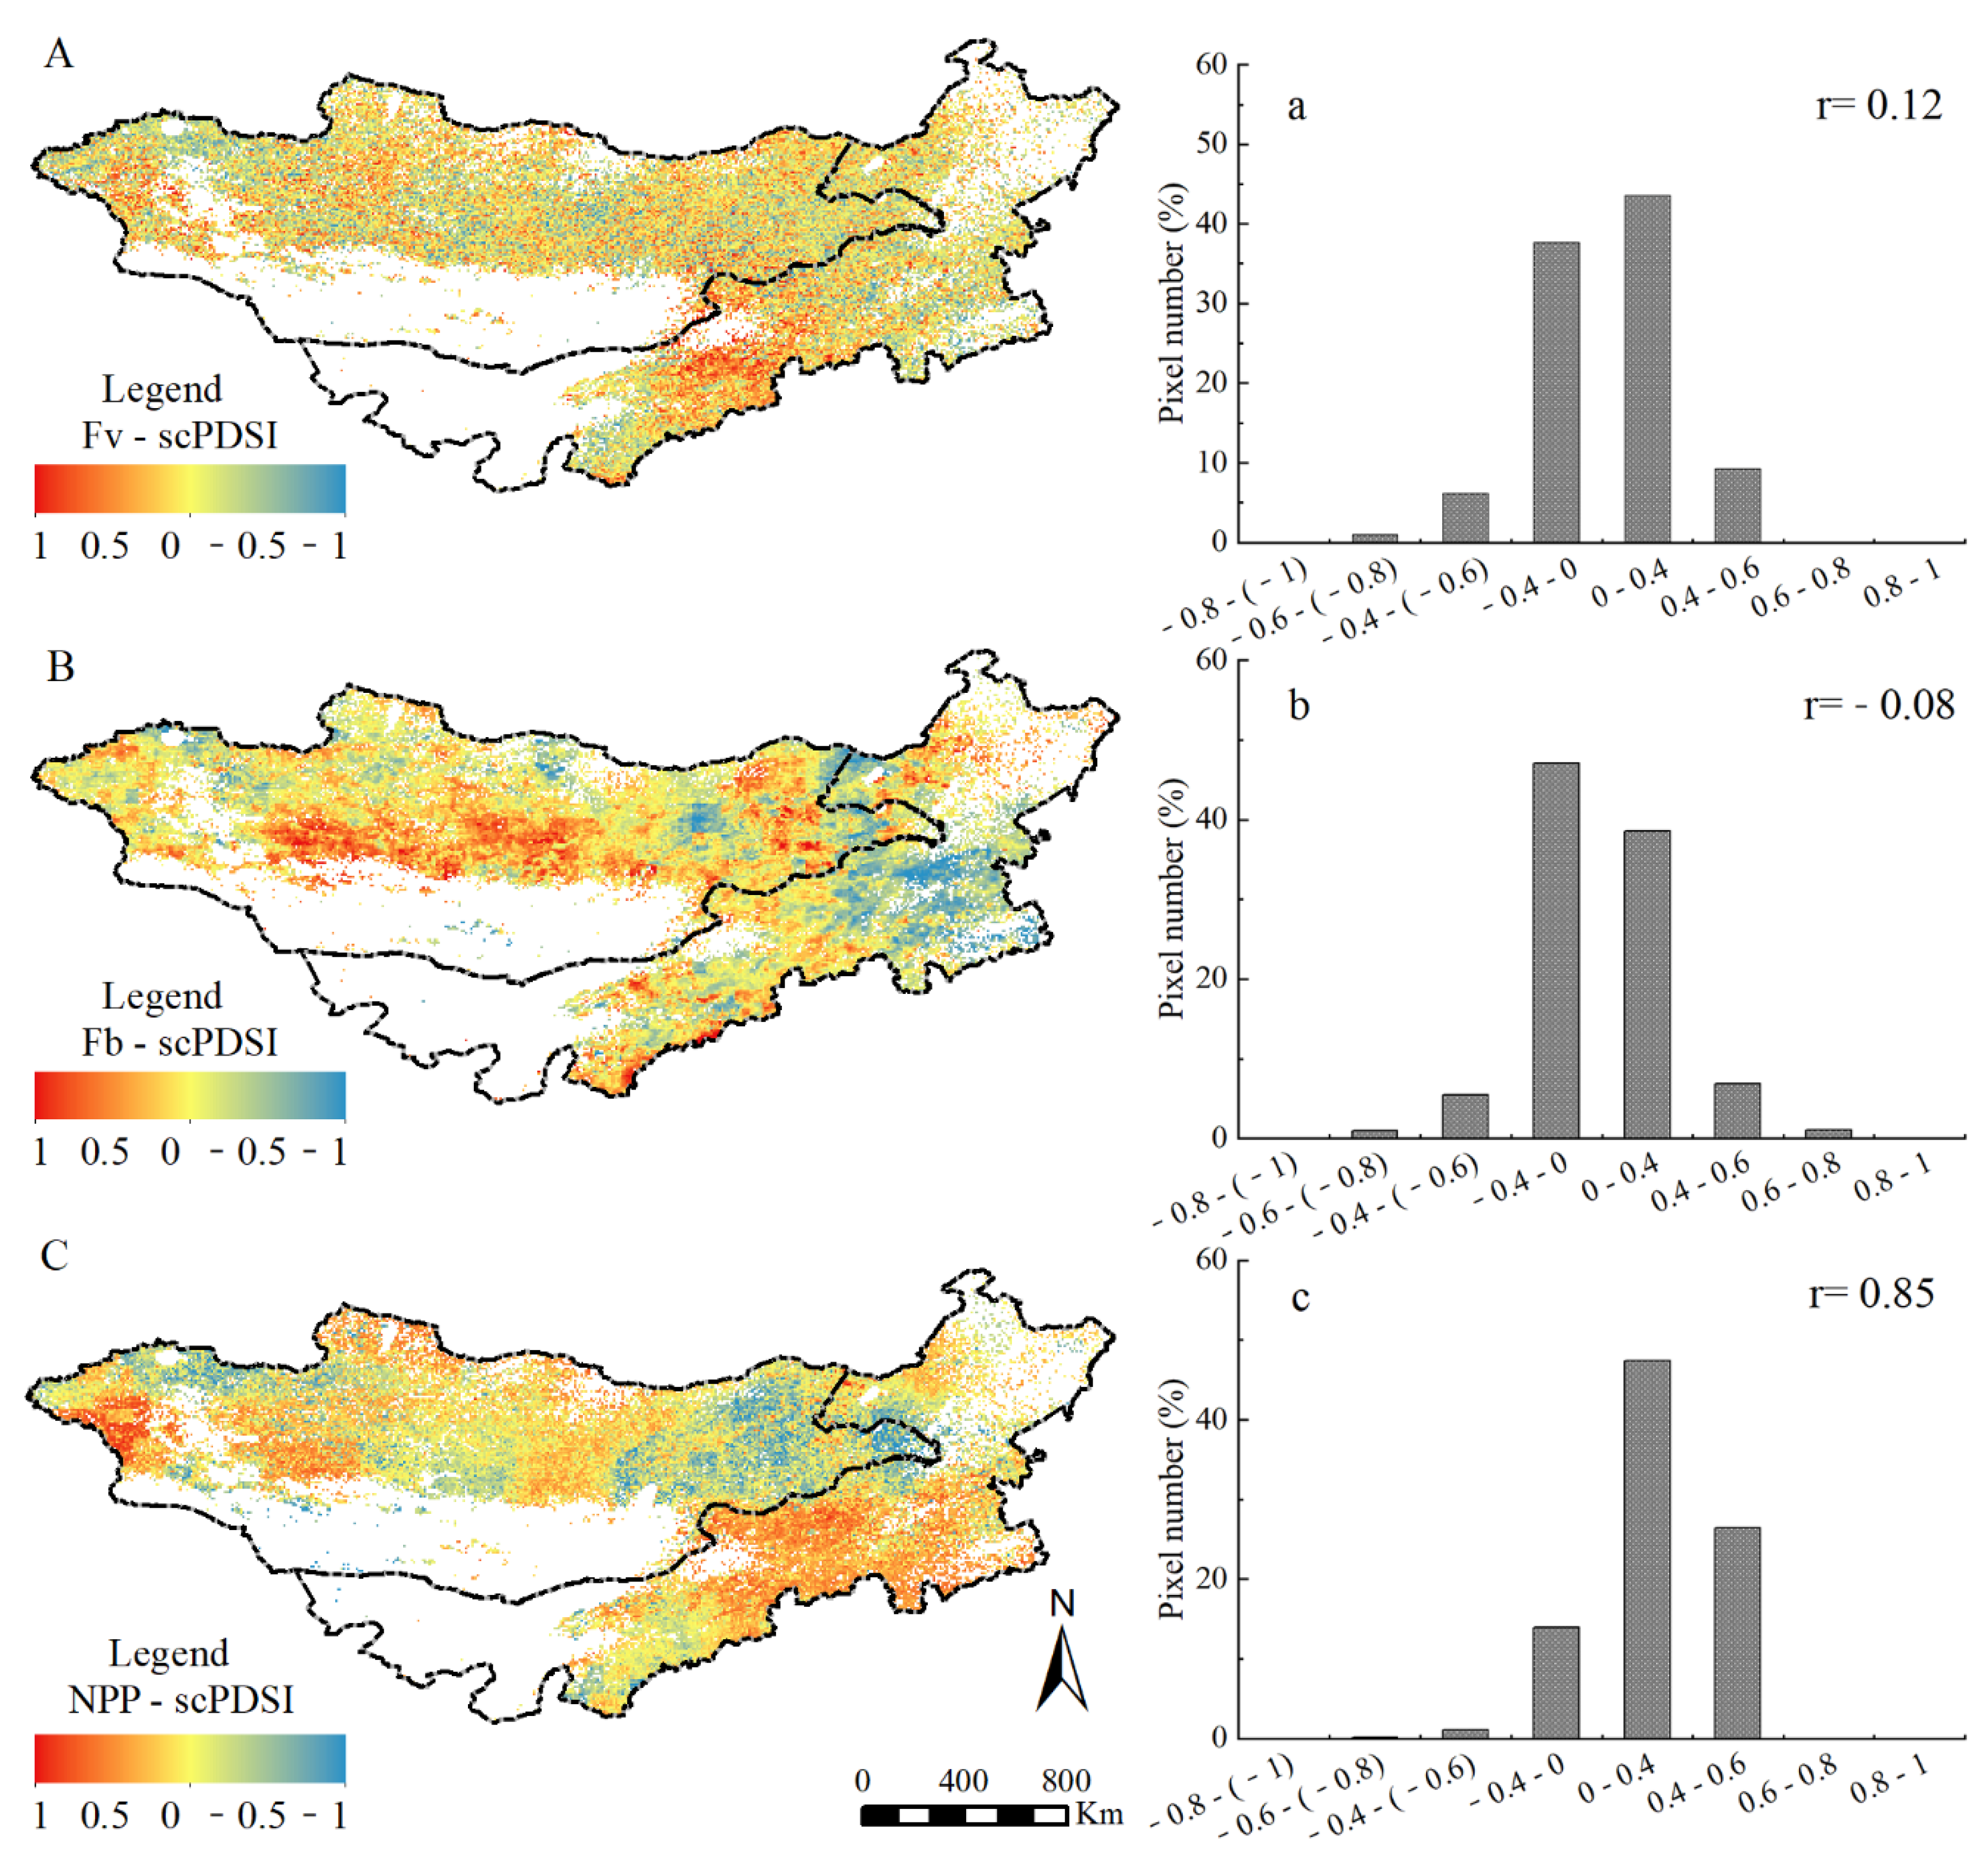
2.3. Correlation Analysis of Grassland Indexes to scPDSI

The correlation coefficient of grassland indexes and scPDSI was analyzed because grassland dynamic is driven by global climate change (Figure 4). Fv and NPP were positively correlated with scPDSI, with a value of 0.12 and 0.85, respectively, whereas Fb accounted for −0.08. The areas with a positive correlation between Fv, NPP, and scPDSI were approximately 84.08 and 93.88%. On the contrary, a negative correlation between Fb and scPDSI accounted for 57.43%. The grassland regions (2.02%) showed a significant positive correlation (p < 0.05) between Fv and PSDI, mainly distributed in Baotou, Hohhot, and south Ulaan Chab in IM. The grassland areas (8.28%) showed significant negative correlation (p < 0.05), mainly distributed in the Kent mountain area of MG and Tong Liao, Chi Feng, and Xilin Gol of IM. In the regions with a positive correlation between NPP and PSDI, 19.57% of them showed a significant positive correlation (p < 0.05), mainly distributed over the west, north, and central MG, and central IM.

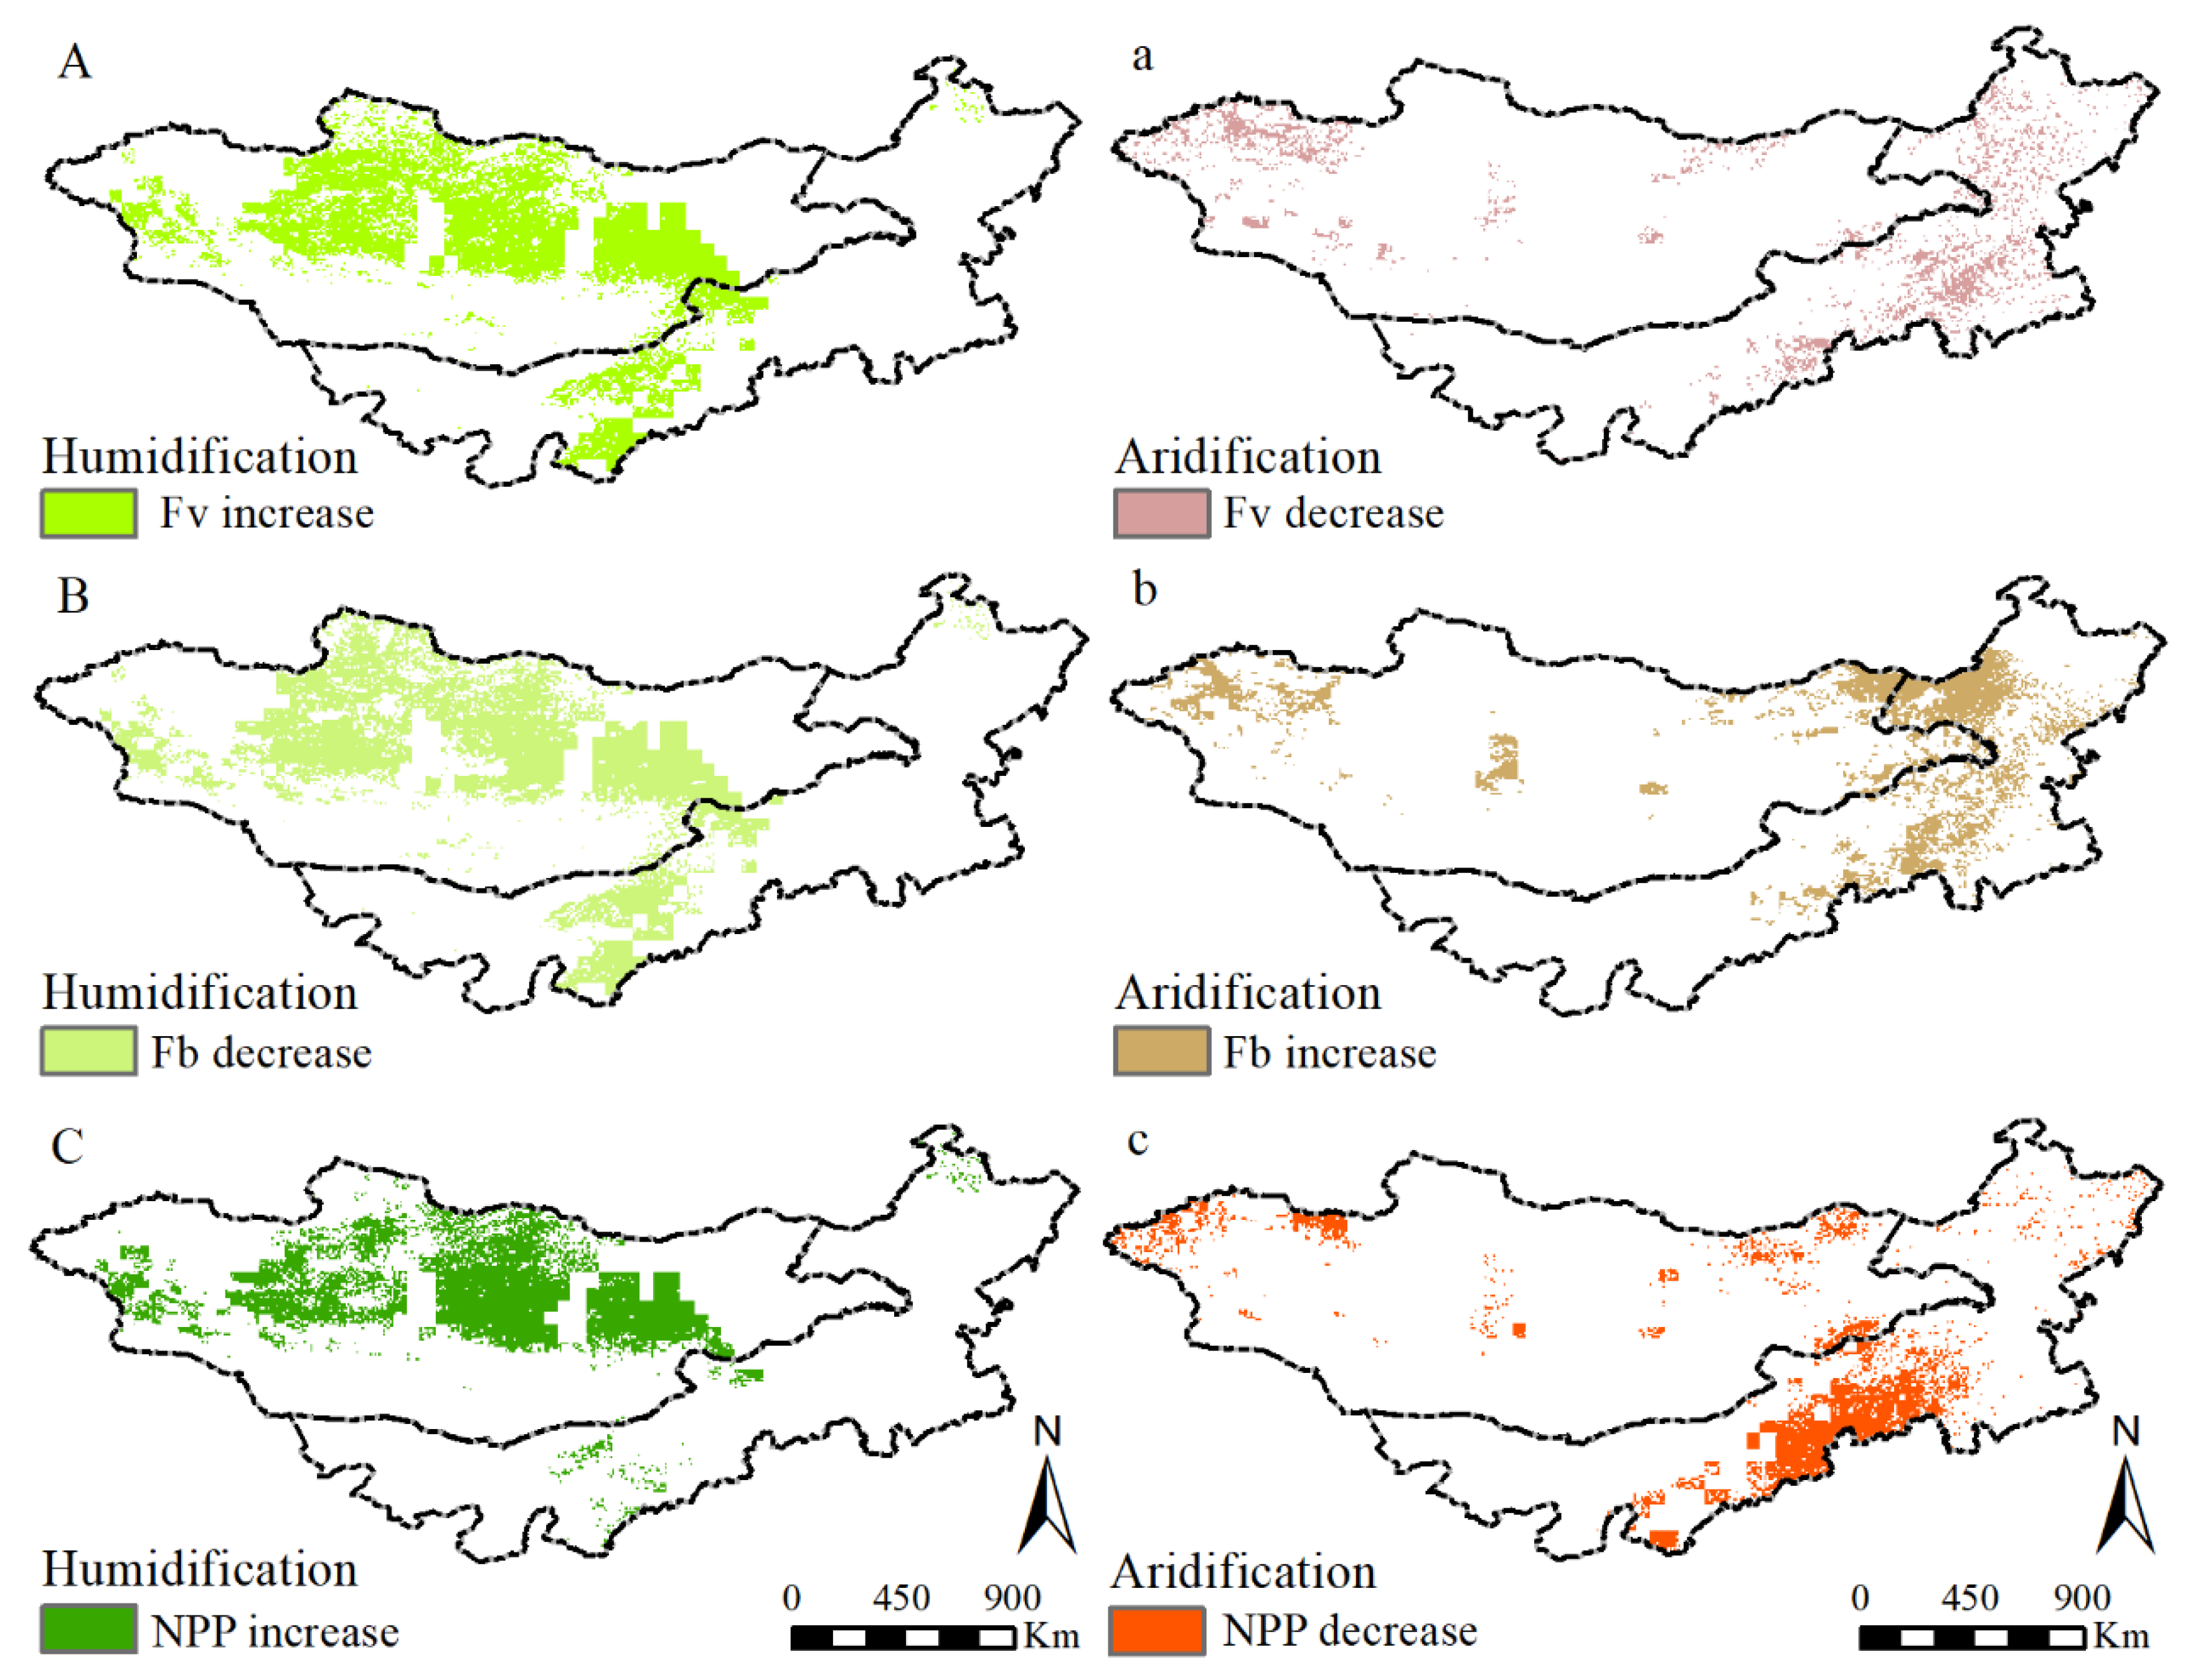
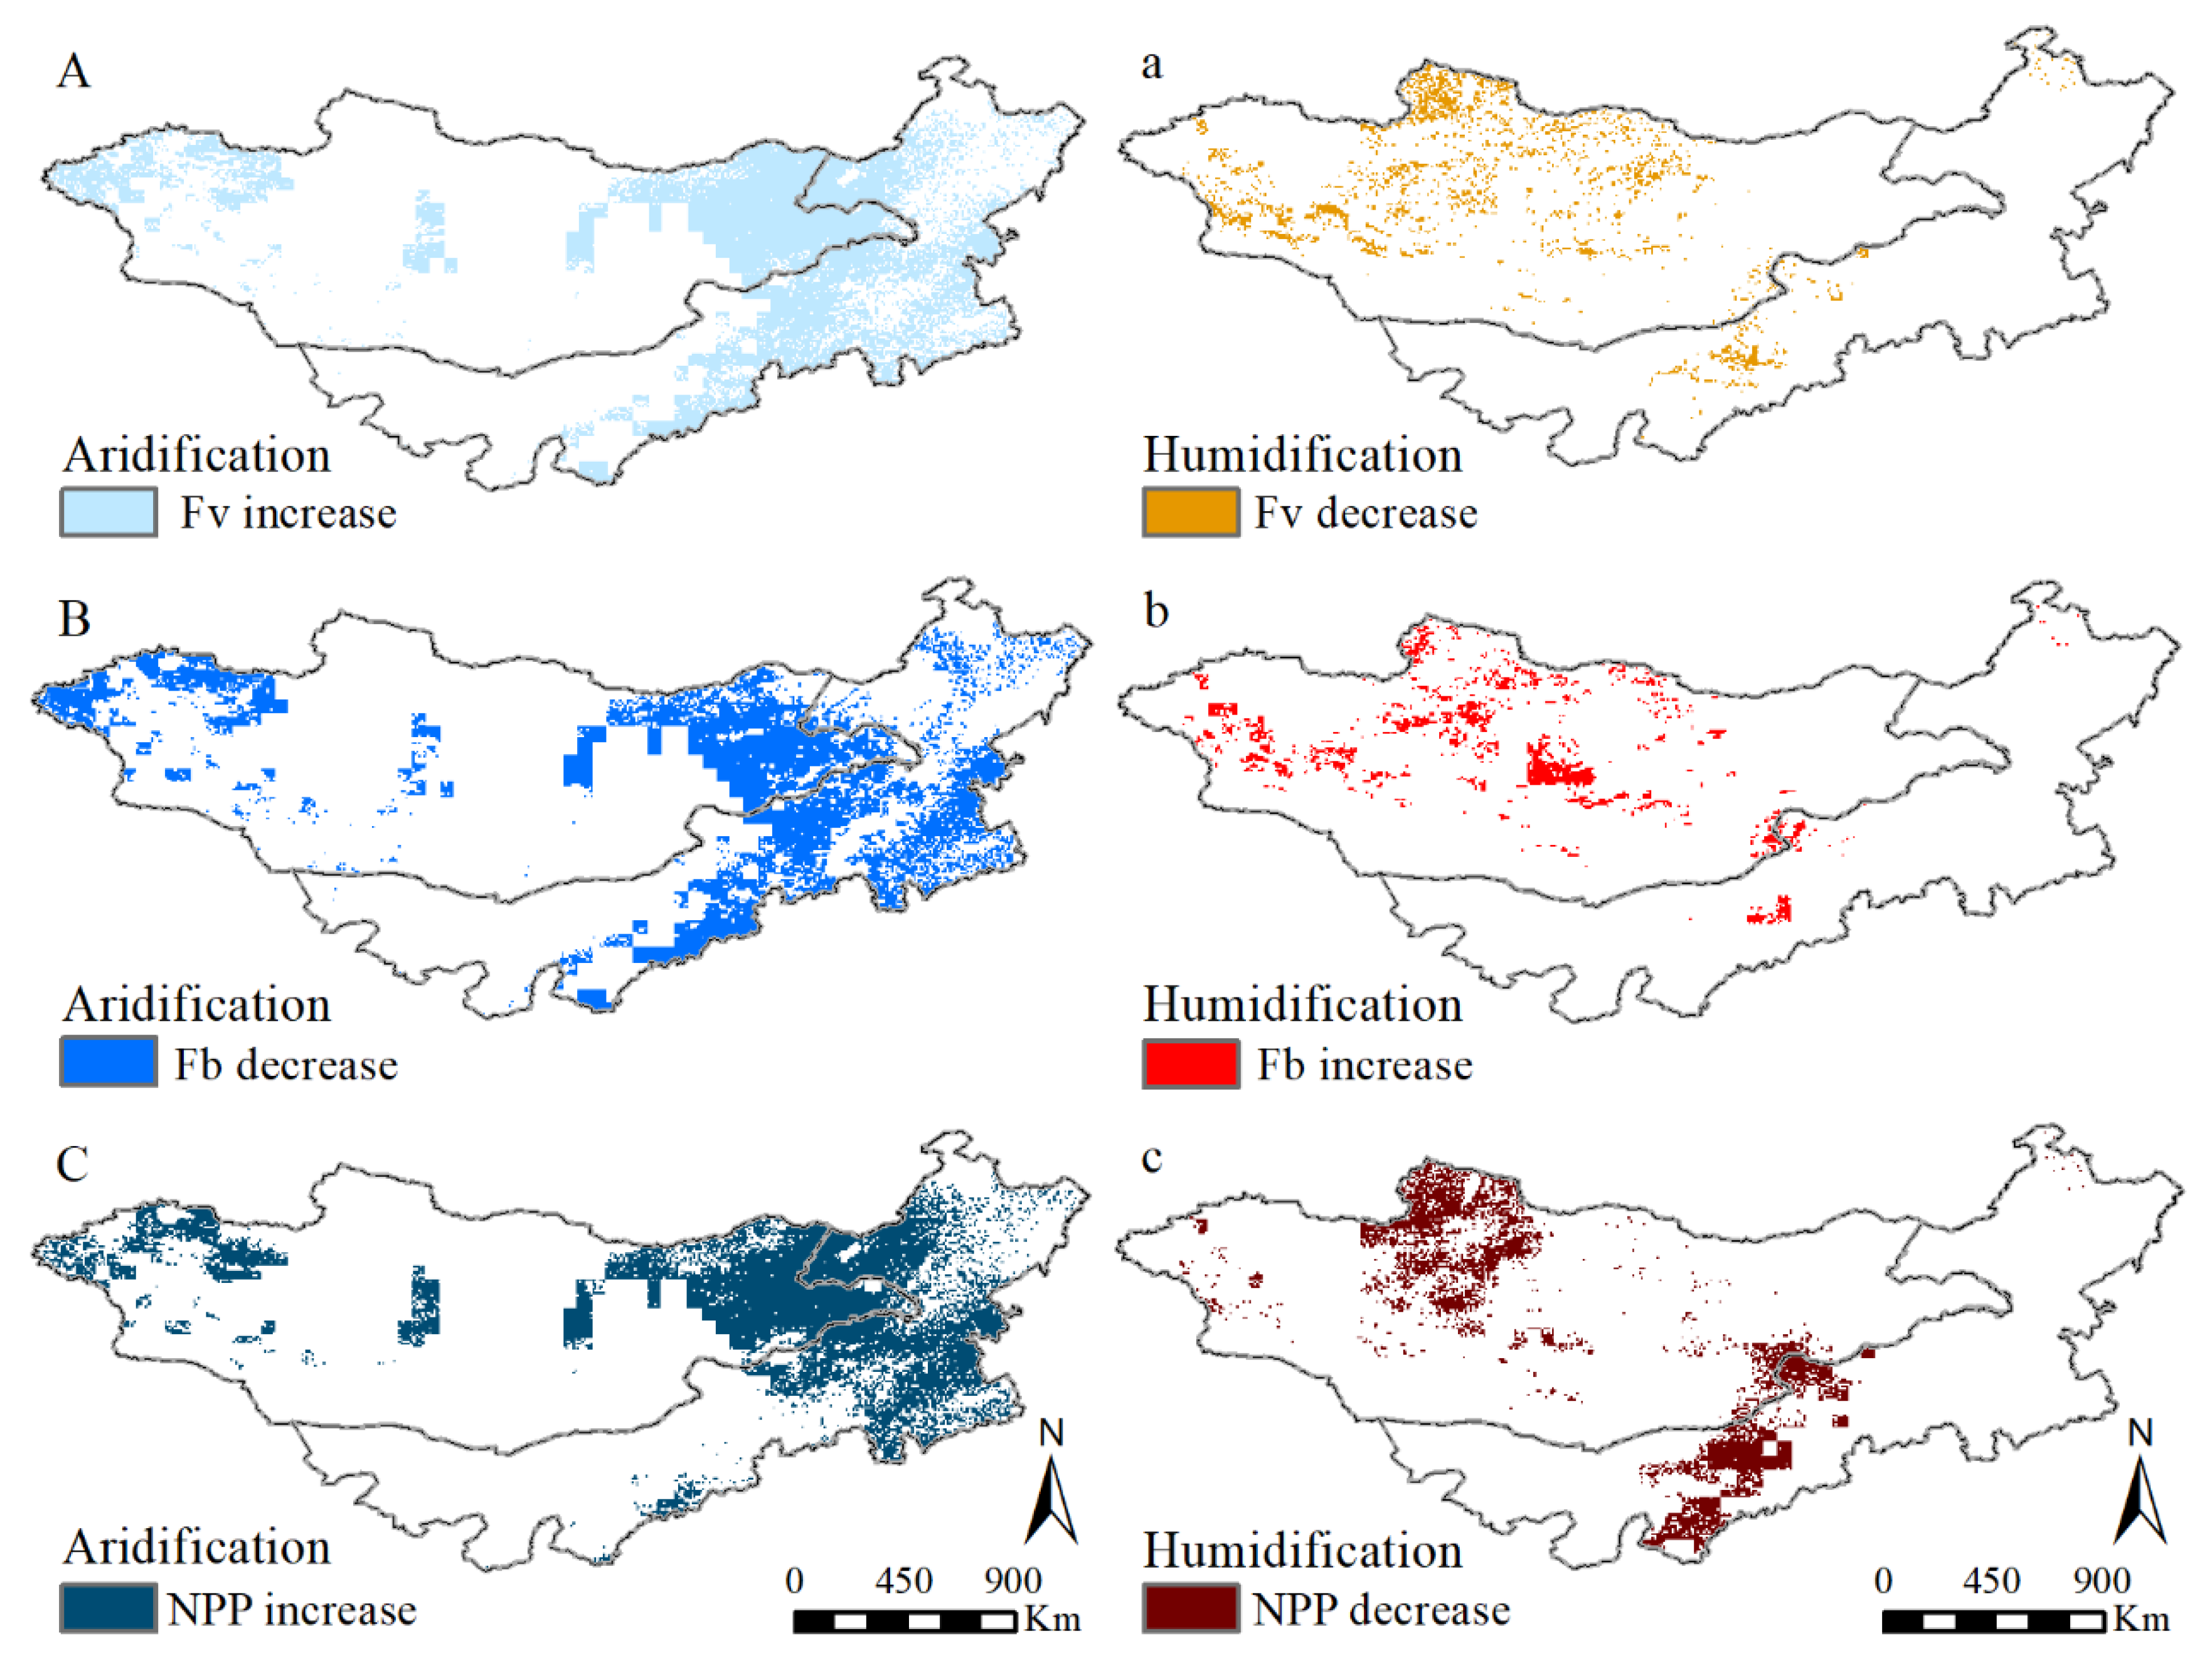
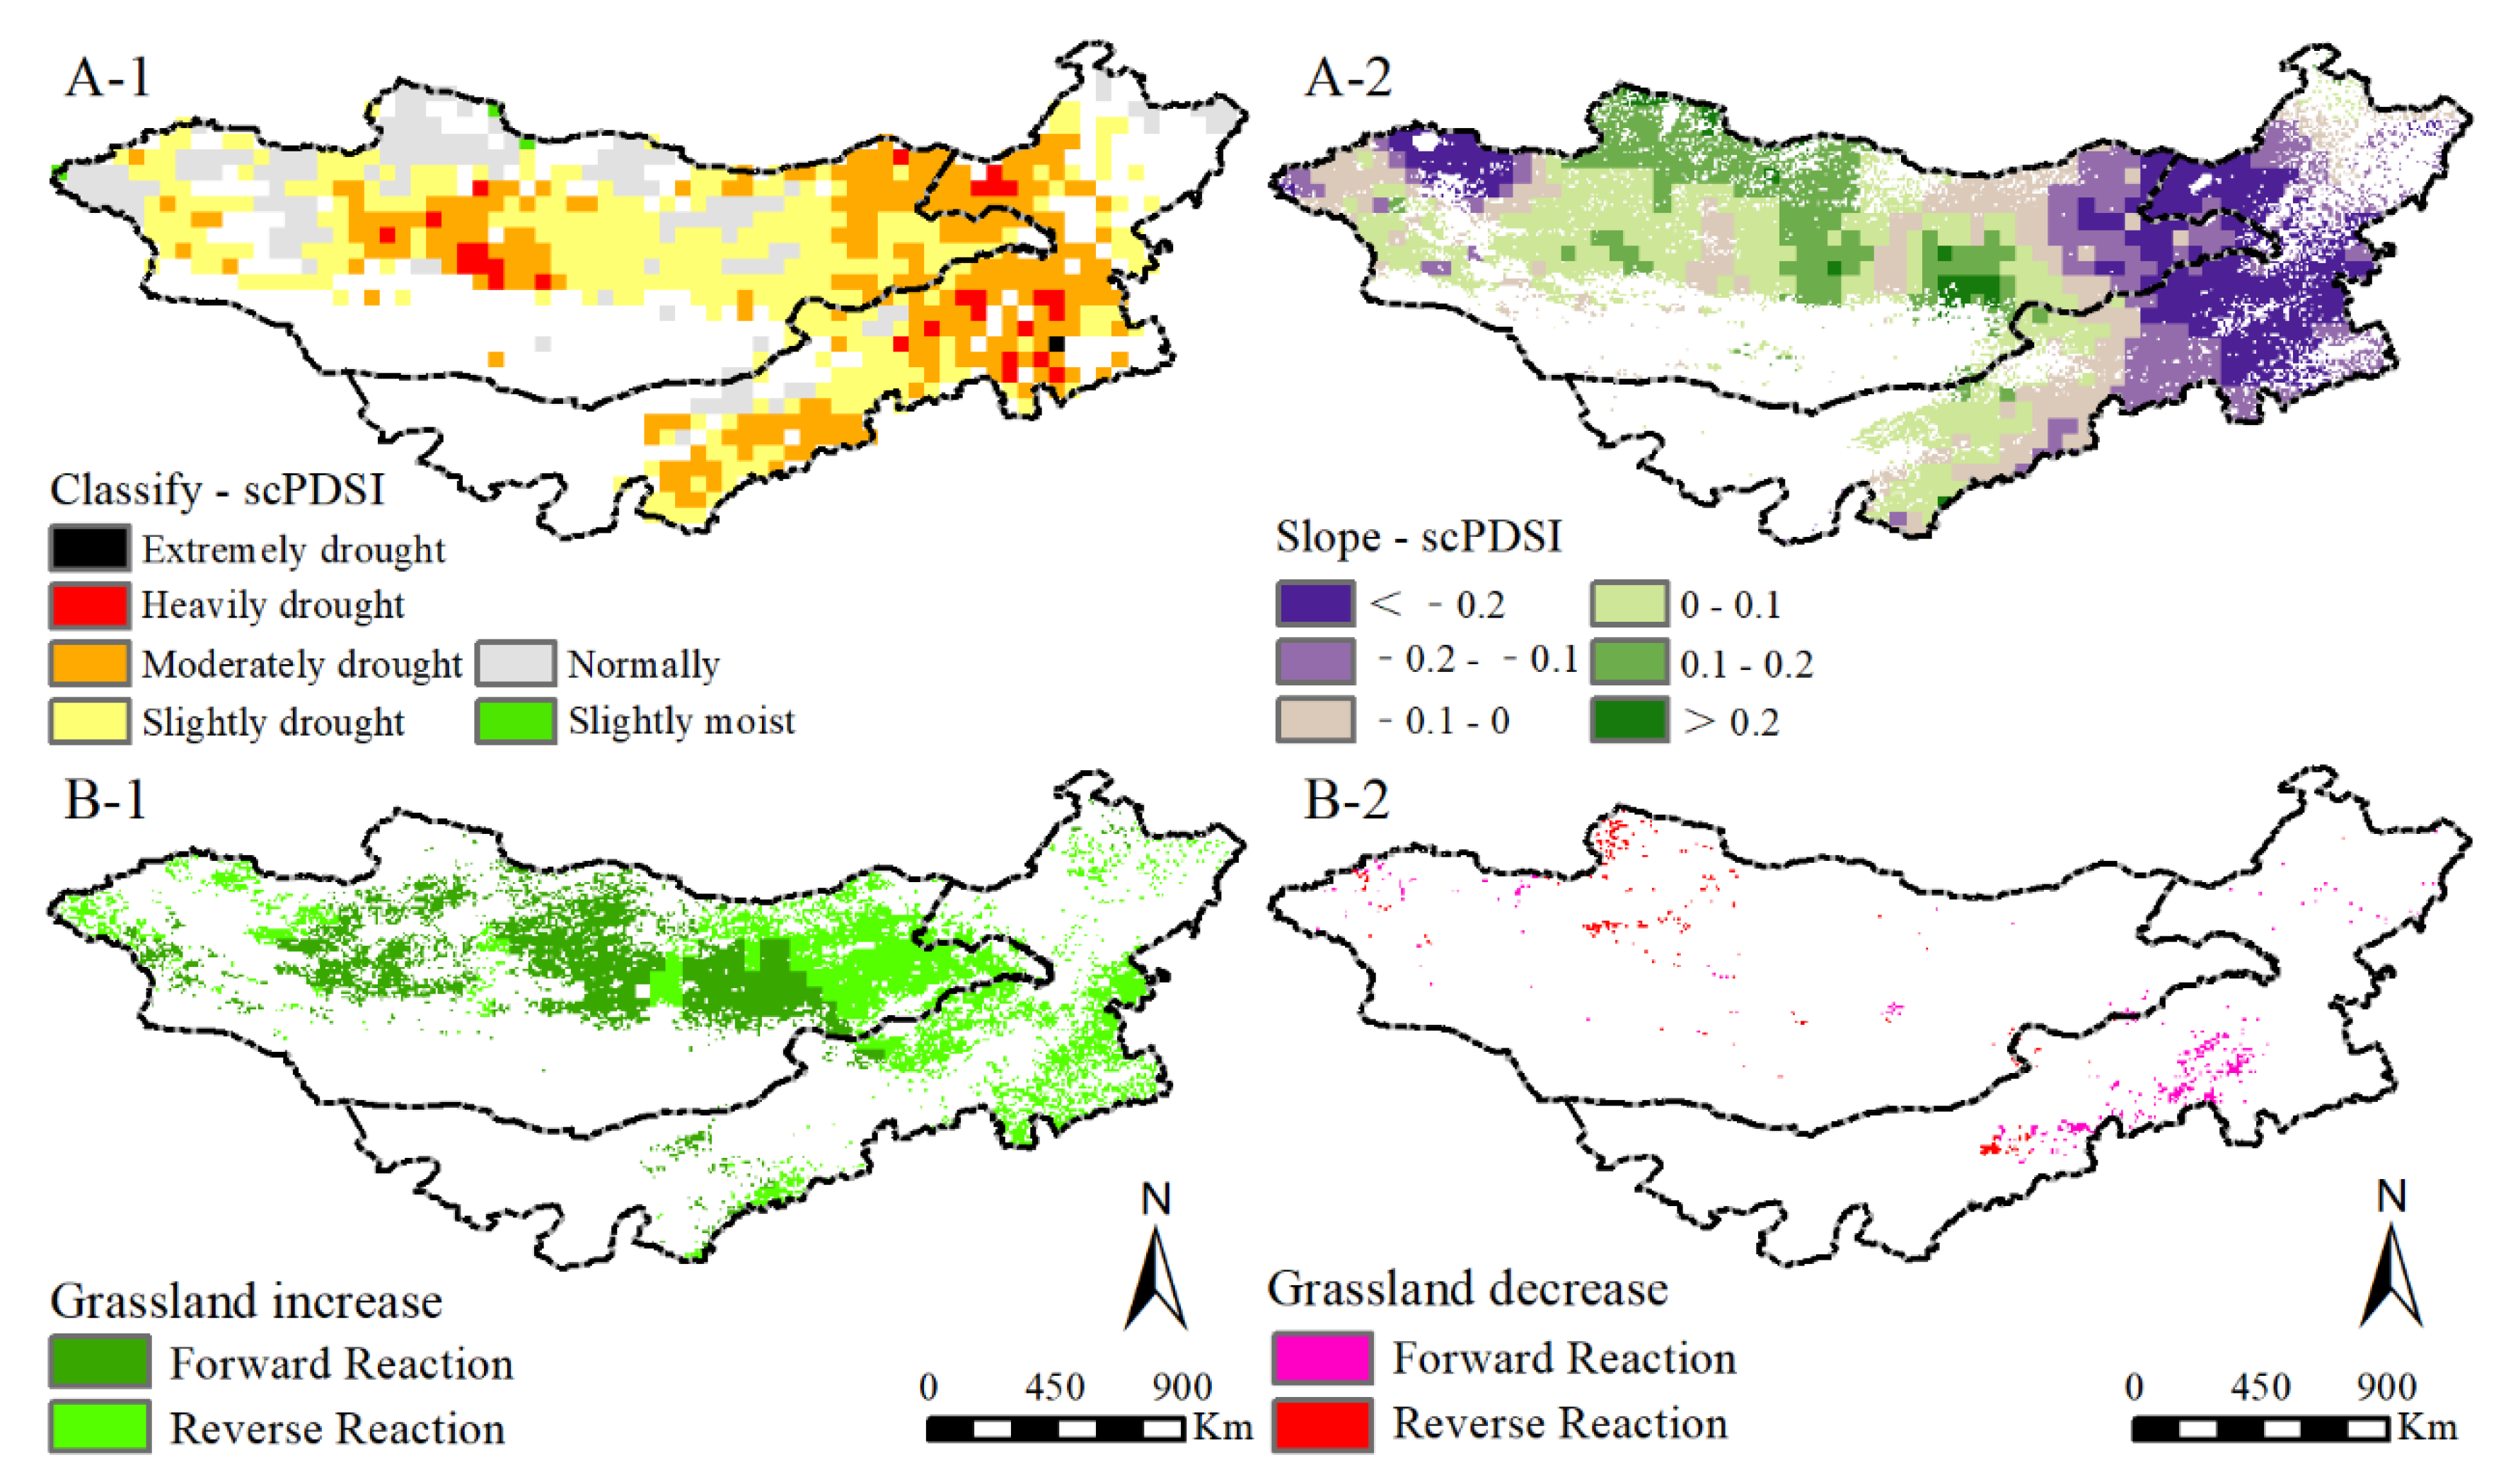
2.4. Changes and Trends in Grassland Response to Drought

The area of grassland Fv, Fb, and NPP responding to scPDSI in the control response for grassland increase accounts for 36.55, 37.99, and 28.23% of the total area, respectively (Figure 5A–C). The control response to grassland increase from Fv, Fb, and NPP to scPDSI appear in similar areas, mainly concentrating on central, north, and west MG, and west IM. On the contrary, the control response to grassland decrease accounts for 10.09, 17.10, and 14.98% (Figure 5a–c). It is mainly concentrated on the south Sayan Mountains, south Hangai Mountains, and Dornod in MG, and northeast and south IM. The area of grassland Fv, Fb, and NPP responding to scPDSI in the counter response for grassland increase accounts for 44.73, 37.76, and 40.34% of the total area, respectively (Figure 6A–C). The counter response to grassland increase from Fv, Fb, and NPP to scPDSI appear in similar areas, mainly concentrating on the northeast and west MG and northeast and south IM. On the contrary, the counter response to grassland decreases accounts for 8.63, 7.15, and 16.45% (Figure 6a–c). It is mainly concentrated on central MG and west IM.

3. Discussion

3.1. Methodology

The current study used the slope-combined analysis based on multi-index to simulate grassland vegetation dynamic and monitor grassland response to droughts. The hypothesis is that grassland Fv and NPP dynamic are a positive feedback, whereas Fb is on the contrary. Previous studies applied single index, such as NDVI, Fv, and NPP, to simulate the grassland dynamic. However, many uncertainties remain due to the inversion model or the uncertainty of dataset itself [34]. The advantage of the current method is the reference of Fb index. Our findings show that 12.93% of the grassland in the MP experiences an increasing trend compared with 0.73% of the grassland that experienced a decreasing trend during the study period. Several studies about grassland NPP showed that grassland has an increasing trend in the similar area during the study period [35,36]. Similarly, studies on vegetation indexes, such as NDVI, Fv, and EVI, show an increasing trend of grassland vegetation [37,38,39]. Thus, the present studies confirmed that the grassland shows a recovery trend in the MP, which agrees with our findings.

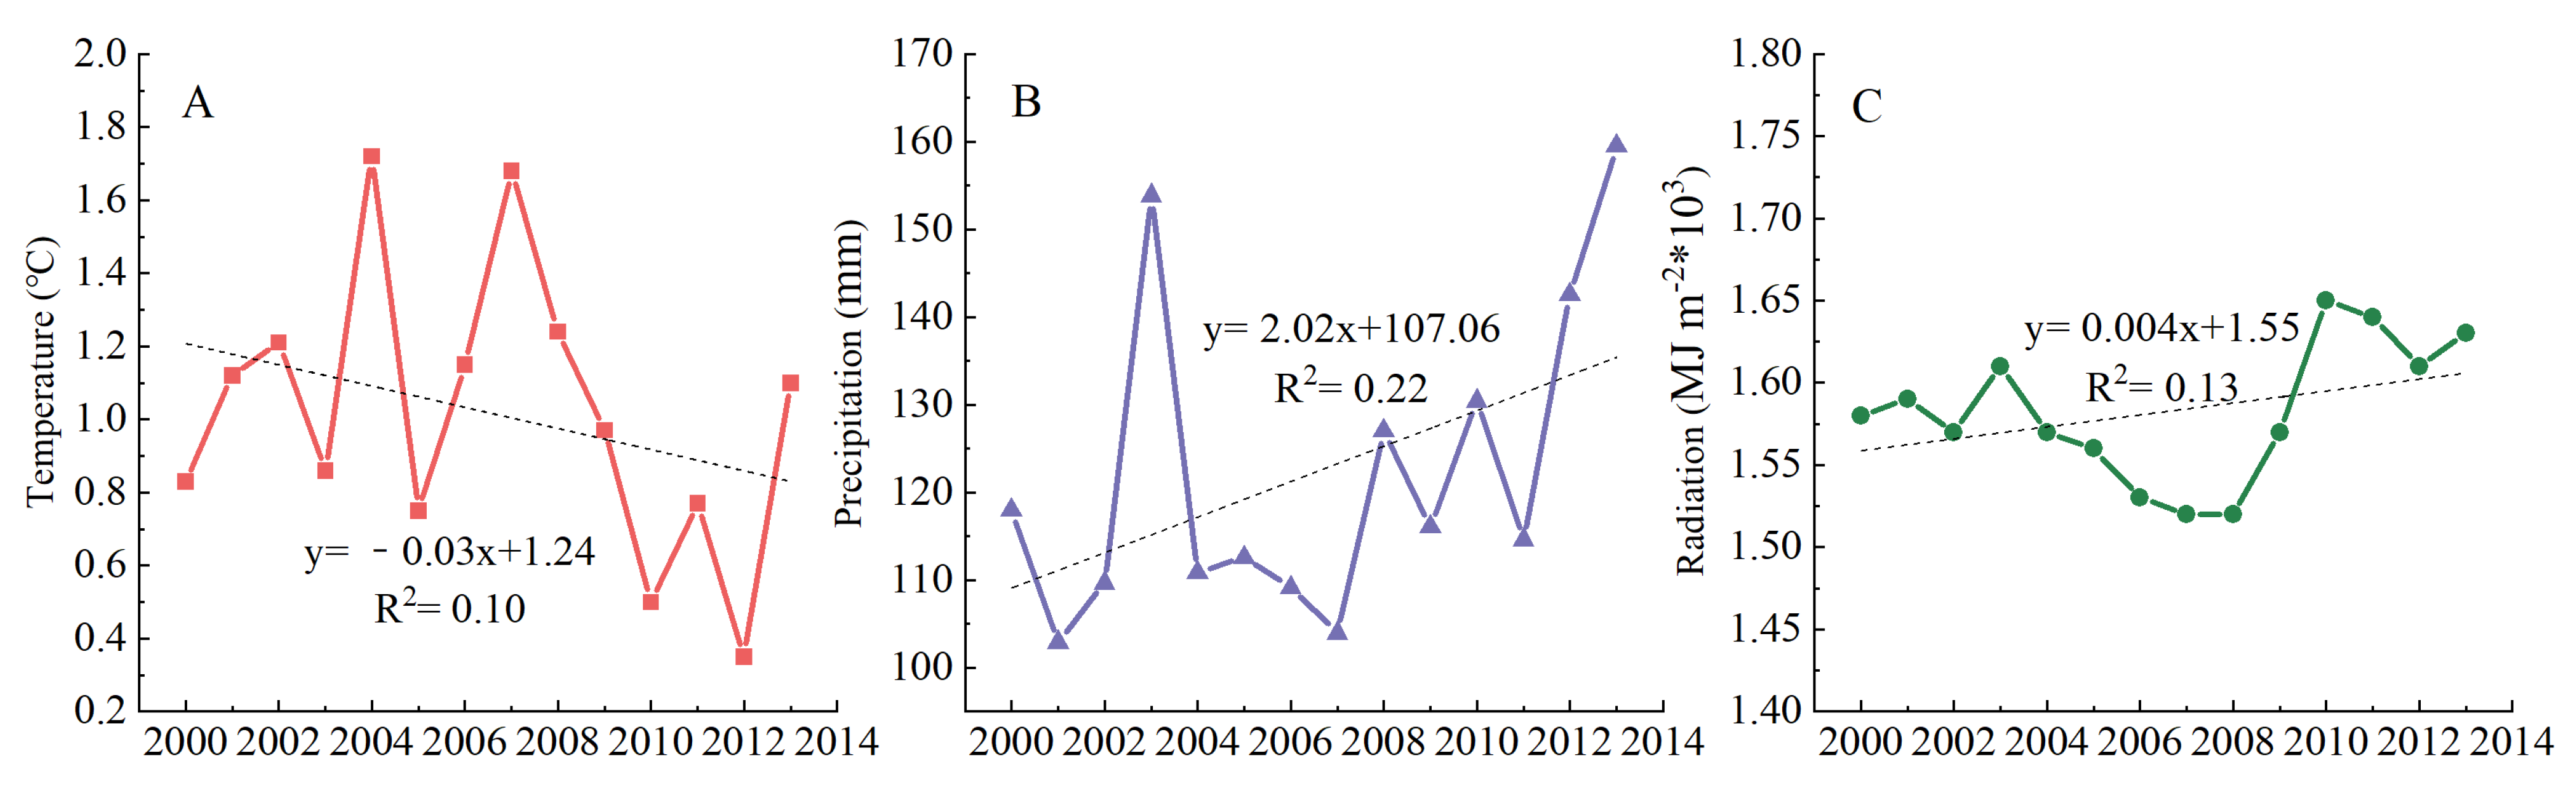
3.2. Climate Factors on Grassland Vegetation Dynamic

In this study, we assessed the grassland dynamic on the basis of Fv, Fb, and NPP and their impact on droughts during 2001 to 2013. The results provided a new understanding of drought-driven grassland change in the MP. Climate variations, such as temperature and precipitation, influenced terrestrial vegetation directly. These climate factors regulated soil respiration, photosynthesis, growth status, and distribution [40]. Here, we calculated the temporal trends of temperature, precipitation, and radiation during the study period (Figure 7). The temperature in this study showed a downward trend (−0.03 °C), whereas precipitation and radiation showed an increasing trend (2.02 mm and 3.39 MJ/m2) due to the short study period. Evidence shows that global warming is definitely occurring, and the climate in our study area tended to be wet and warm [41]. Typically, the combination of warmer temperature and higher precipitation concentration during the early growing season possibly increased NPP, partly by lengthening the growing season [11]. The related research shows that the carbon sequestration capacity of grassland ecosystem is enhanced by increased precipitation, which supports our findings [42,43]. Another study revealed that global warming helps to increase the productivity and carbon storage of grasslands in China [34].

3.3. The Role of Ecological Policies in Grassland Restoration

As a limited resource, water is necessary for plant growth and development, especially in arid and semi-arid ecosystems [44]. Evidence showed that grasslands experience different degrees of drought in the MP (Figure 8A-1). Although drought associates with decreased precipitation, increased precipitation does not necessarily weaken the drought [45,46]. A slight reduction of drought is observed in the MP (−0.02), mainly concentrating in the western and eastern MG (Figure 8A-2). This finding is consistent with other studies that used SPI and SPEI to show drought [47,48,49]. We fitted the response from grassland Fv, Fb, and NPP to scPDSI, and the results showed a recovery trend (Figure 8B-1,B-2). Grassland increased regions are obviously larger than the decrease regions (12.93% vs. 0.73%), strongly confirming the recovery of grassland in the MP. The grassland increase regions with control response to drought mainly distributed in the central MP. Few human activities were found in these areas, and the vegetation growth was mainly affected by natural climatic factors [50]. The grassland increase regions with counter response to drought were in the eastern and western MG and northeast IM. This finding shows that other factors, such as human activities affecting local grassland restoration, are greater than the climate factors [51]. The distribution of grassland decrease regions with control response and counter response is minimal (0.44% vs. 0.29%). The grassland decrease regions with control response mainly distributed in south central IM and north MG. This finding reveals the grassland degradation in these areas are under complex influence factors, such as increase pressures from people and livestock populations [52].

4. Materials and Methods
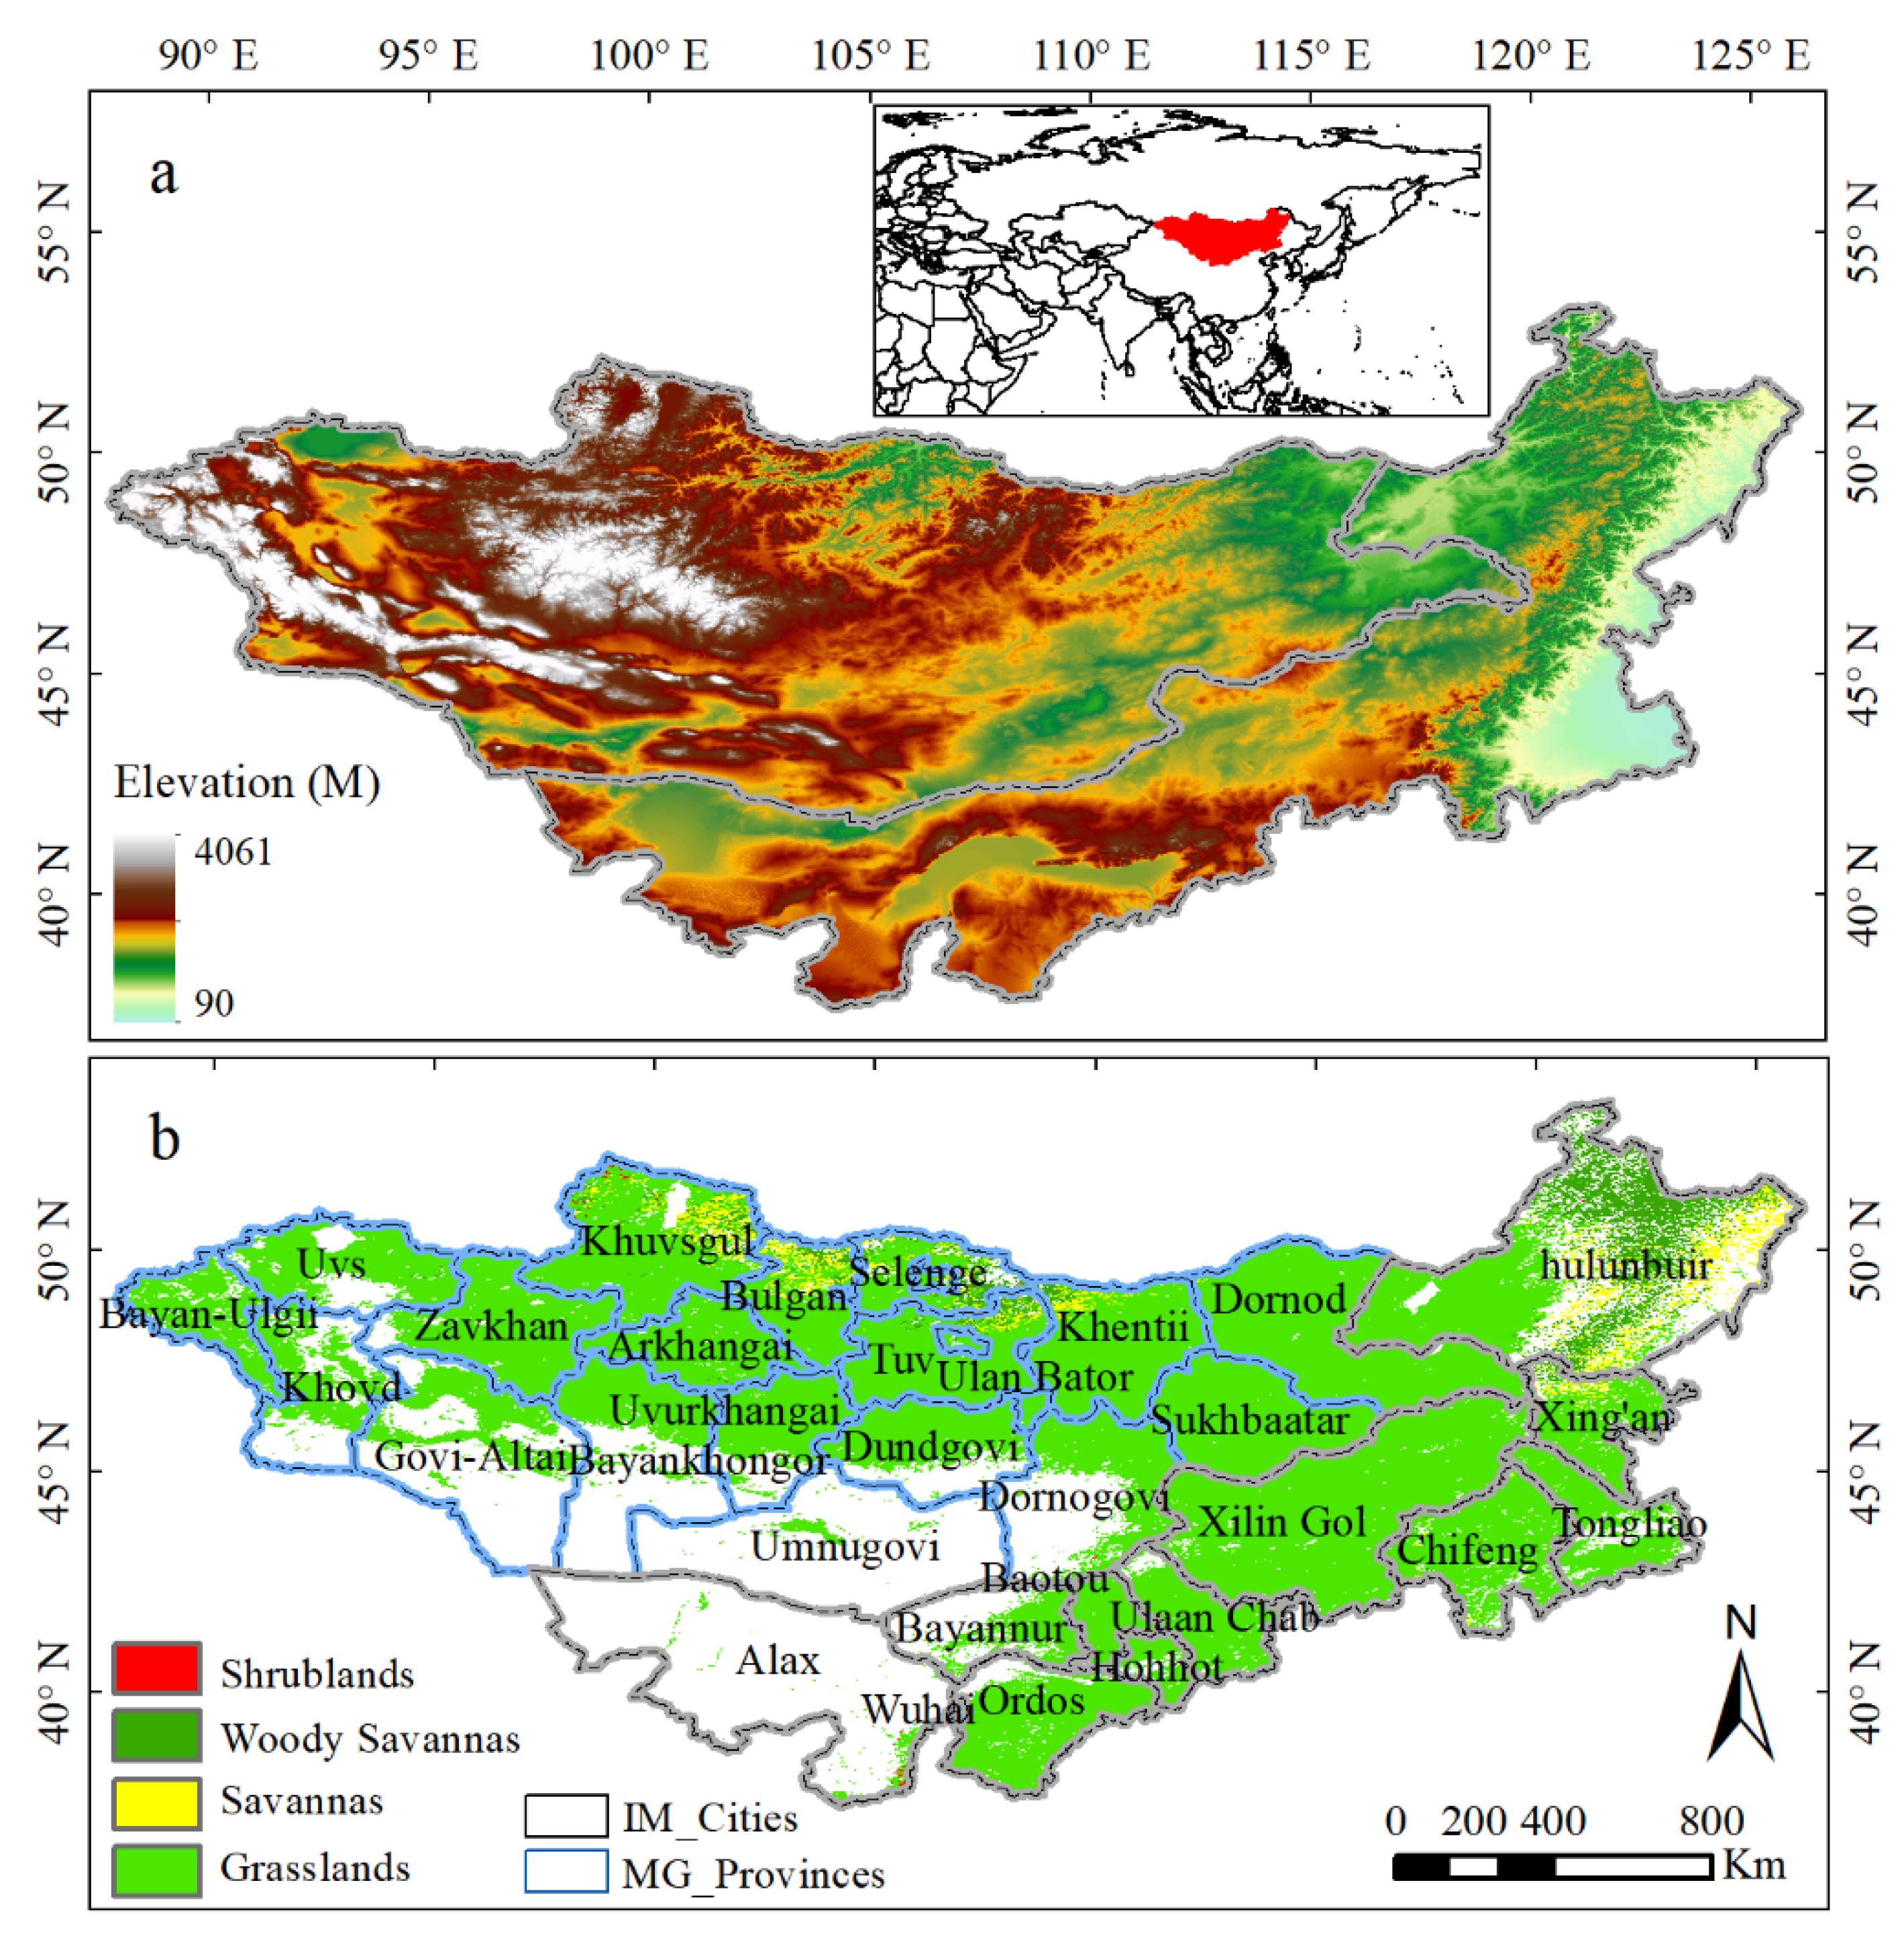
4.1. Study Area

The MP is located in Siberia in the north to the northern Yinshan in the south, from the Outer Xing’an Mountains in the east, to the Altai Mountains in the west (37°22′–53°20′ N and 87°43′–126°04′ E, Figure 9). The Altai Mountains in the southwest, the Kent Mountains in the north, and the outreach area of the Xing’an Mountains in the east are found in the study area, with the mean elevation of 1580 m (Figure 9a). The MP mainly includes Mongolia and Inner Mongolia autonomous region of China, with a total area of approximately 1.56 × 10⁶ and 1.18 × 10⁶ km2, respectively. The MP climate is dry and lacks precipitation due to its long distance from the ocean. The annual average temperature and mean annual rainfall is 4.12 °C and 269 mm, respectively. The MP has a wide variety of regional climates, and most of them are from arid to humid from west to east. All regions are sensitive and vulnerable to drought. The grassland types mainly include grasslands, woody savannas, savannas, and shrub lands in descending order (Figure 9b).

4.2. Data Source and Processing

We obtained the global land cover maps of 2013 from the MODIS data products (MCD12Q1, http://modis-land.gsfc.nasa.gov/landcover.html/, accessed on 24 February 2020) with the International Geosphere-biosphere Programme (IGBP) classification system. The IGBP classification system defines 17 classes of primary land cover types. In this study, classes 1 to 5 were reclassified as forest, classes 6 to 9 were reclassified as shrubland, classes 12 and 13 were reclassified as farmland, classes 15–16 were reclassified as water, and class 17 was reclassified as city (Table 1).
The 0.05 degree monthly NDVI (normalized difference vegetation index) was offered from the Moderate Resolution Imaging Spectroradiometer (MODIS) data products MOD13C2 (http://ladsweb.nascom.nasa.gov/data/search.html, accessed on 4 March 2020). The 0.05 degree monthly NDII (normalized difference impervious index) was calculated by using a red band 1 from MOD13C2 and thermal infrared band 32 from MOD11C3. Both MOD13C2 and MOD11C3 image datasets were converted to Albers equal area conical projection and WGS-84 datum using the ArcGIS V9.3 software (ESRI, San Diego, CA, USA). To reduce the image noise from the atmospheric clouds, particles, shadows, etc., three-point smoothing was used to improve data quality.
We obtained the monthly meteorological data from the gridded datasets of Climatic Research Unit (CRU) TS 3.22 (http://crudata.uea.ac.uk/cru/data, accessed on 6 January 2019). These gridded datasets cover the global land surface (excluding Antarctica) at a 0.5° resolution and provide the best estimates for month-by-month variations in climate variables [53]. No measurement value is missing in the datasets. The scPDSI datasets were provided by the CRU. The scPDSI uses −0.99–0.99 as normal, and negative values indicate drought. Classification relevant to this research mainly includes extreme moist, heavy moist, moderate moist, slightly moist, slightly normal drought, moderate drought, heavy drought, and extreme drought (Table 2). In order to facilitate spatial statistics, meteorological data are resampled by ArcGIS 10.2 software with a resolution of 0.05 degree.

4.3. Methods

4.3.1. Estimation of Fv

Fv is an index directly used to determine grassland health condition. We estimated the grassland coverage by using the NDVI data due to the significant linear correlation relationship between grassland coverage and NDVI. The calculated model is pixel dichotomy model. The specific calculation formula is as follows:
F v = N D V I N D V I min N D V I max N D V I min × 100 %
where Fv is the grassland coverage (%), NDVI is the NDVI value of a single pixel, NDVImin is the NDVI value of bare soil or areas without vegetation coverage, and NDVImax is the NDVI value of pixels completely covered by vegetation. Theoretically, the NDVImin value should be close to 0, and the NDVImax value represents the maximum value of NDVI per unit pixel of total vegetation coverage. However, considering the influence of vegetation type, noise, terrain, image quality, and other factors, the NDVImin and NDVImax values will deviate from the actual values, which are generally represented by the maximum and minimum values within a certain confidence range. In this paper, NDVI values near 2% and 98% of the cumulative percentage of NDVI values in remote sensing images in the study area are selected as NDVImin and NDVImax values.

4.3.2. Estimation of Fb

Fb is a concept corresponding to Fv. It includes the reflectance and temperature characteristics of the object surface and is not a supplement to Fv. Fb enriches the research index of grassland ecosystem on the basis of remote sensing technology. In this study, we chose Wang’s estimation formula for Fb [54], which is expressed as follows:
F b = N D I I N D I I min N D I I max N D I I min × 100 %
N D I I = λ R λ T λ R + λ T
where Fb delineates the surface bareness fractions, NDII is the normalized difference impervious index, NDIImin refers to the minimum value of NDII (high grassland coverage and low-temperature pixel), and NDIImax represents the maximum value of NDII (high temperature and reflectivity). λR is red band 1 from MOD13C2, and λT refers to thermal infrared band 32 from MOD11C3.

4.3.3. Estimation of NPP

NPP was extracted from the dataset at a spatial resolution of 1 km and calculated on the basis of the BIOME-BGC model [55]. The specific formula is as follows:
N P P = t 365 P S N e t ( R m + R g )
P S N e t = G P P R l r
where NPP represents the actual NPP (g cm−2 year−1), and PSNet refers to the net photosynthesis. Rm is the annual maintenance respiration of live cells in woody tissue, and Rg delineates the annual growth respiration. GPP is the gross primary productivity from MOD17A2 datasets, and Rlr is the daily leaf and fine root maintenance respiration.

4.3.4. Grassland Dynamic Analysis

The grassland vegetation dynamic analysis is a significant ecological process of grassland health condition. We can assess grassland degradation or restoration by using Fv, Fb, and NPP as fundamental indicators. The slope was determined by using ordinary least squares regression, which is expressed as follows:
S l o p e A = n × i = 1 n i × ( A ) i ( i = 1 n i ) ( i = 1 n ( A ) i ) n × i = 1 n i 2 ( i = 1 n i ) 2
where A refers to grassland Fv, Fb, and NPP; i is the sequence number of the year (in this study, 1 is for the year 2000, 2 is for the year 2001, and so on); n represents the number of years, which is 14 in this study. A negative slope value shows a degradation trend, whereas a positive slope value shows a restoration trend. In this study, combined analysis of slopes (Table 3) was conducted to quantitatively evaluate the grassland response to drought.
The significance of the variation tendency was determined in terms of F-test to represent the confidence level of variation. The calculation for statistics is expressed as follows:
F = U × n 2 Q
U = i = 1 n ( y ^ i y ¯ ) 2
Q = i = 1 n ( y i y ^ i ) 2
y ^ i = S l o p e × i + b
b = y ¯ S l o p e × i ¯
where U represents the residual sum of the squares; Q is the regression sum; y ^ i refers to the regression value; yi delineates the average data of year i; y ¯ is the mean value of Fv, Fb or NPP over n years; b refers to the intercept of the regression formula.
We classified the variation tendency into the following six levels on the basis of the F-test results: extremely significant decrease (ESD, slope < 0, p < 0.01); significant decrease (SD, slope < 0, 0.01 < p < 0.05); no significant change (NSC, slope = 0, p > 0.05); Significant Increase (SI, Slope > 0, 0.01 < p < 0.05); extremely significant increase (ESI, slope > 0, p < 0.01).

4.3.5. Correlation Analysis

The Pearson correlation coefficient was used to reflect the long-term dynamic of two variables in a given time n. The specific calculation formula is as follows:
r = n × i = 1 n ( x i × y i ) ( i = 1 n x i ) ( i = 1 n y i ) n × ( i = 1 n x i 2 ) ( i = 1 n x i ) 2 n × ( i = 1 n y i 2 ) ( i = 1 n y i ) 2
where r is the correlation coefficient, n refers to the sequential year, which is 14 in this study; xi and yi represent Fv, Fb or NPP and climatic factors, respectively. r refers to a description of linear correlation degrees between the two variables. The value of r ranges from −1 to 1. −1 and 1 are completely related, whereas 0 indicates irrelevant. The greater the absolute value of r, the stronger the correlation, but no causal relationship is found.

5. Conclusions

This study investigated the grassland vegetation dynamic on the basis of multi-index and its response to droughts in the MP during 2000–2013 in terms of the relations between Fv, Fb, NPP, and scPDSI. The spatial distribution of grassland Fv and NPP decreases from northeast to southwest, showing an increasing trend of 0.18 and 0.43, respectively. On the contrary, Fb increases from northeast to southwest, presenting a decreasing trend, with the value of −0.16. The grassland degradation condition of the MP shows a restoration trend during the study period. Fv and NPP shows a positive relationship with scPDSI, whereas Fb is exactly on the country. The areas with a positive correlation between Fv, NPP, and scPDSI are 84.08% and 93.88%. The grassland increase regions with control and counter response to drought account for 6.06% and 6.87%. However, the distribution of grassland decrease regions with control and counter response (0.44% vs. 0.29%) is minimal. The regions of grassland increase from control response mainly distribute in central MG, whereas the grassland increase regions with counter response are in the eastern and western MG and northeast IM. Such detailed analysis of grassland-related indexes and its responses to drought are useful to clarify the grassland condition, potential effect of drought, and is beneficial to help policymakers for develop proper measures for grassland protection.

Author Contributions

Conceptualization, Y.Z. and J.L.; Methodology, Z.W.; Software, Q.W.; Validation, Y.Z., Y.Y. and Z.W.; Formal Analysis, J.L. and Y.B.; Data Curation, Y.Z. and W.X.; Writing—Original Draft Preparation, Y.Z.; Visualization, Y.Z.; Supervision, J.L. and W.X.; Project Administration, J.L. and W.X. All authors have read and agreed to the published version of the manuscript.

Funding

This research was funded by the National Natural Science Foundation of China (42067069), the Technology Innovation Leading Program of Shaanxi Province (2021KJXX-53), the National Key Research and Development project (2018YFD0800201), the Natural Science Foundation of China (32060279) and the National Research Project of the State Ethnic Affairs Commission of China (2019-GMD-034). We are grateful to the editor and anonymous reviewers. We also appreciate the Oak Ridge National Laboratory Distributed Active Archive Center (ORNL DAAC) for sharing a series of original remote sensing dataset and Climatic Research Unit in University of East Anglia for sharing climate dataset.

Institutional Review Board Statement

Not applicable.

Informed Consent Statement

Not applicable.

Data Availability Statement

Not applicable.

Conflicts of Interest

The authors declare no conflict of interest.

References

  1. Jiang, L.P.; Qin, Z.H.; Xie, W. Estimation of Grassland Ecosystem Services Value of China Using Remote Sensing Data. J. Nat. Resour. 2007, 22, 161–170. [Google Scholar]
  2. Wei, Z.; Han, Y.; Liang, Z.; Yizhao, C.; Lu, H.; Weimin, J. Dynamics of grassland carbon sequestration and its coupling relation with hydrothermal factor of Inner Mongolia. Ecol. Indic. 2018, 95, 1–11. [Google Scholar]
  3. Yanagawa, A.; Sasaki, T.; Jamsran, U.; Okuro, T.; Takeuchi, K. Factors limiting vegetation recovery processes after cessation of cropping in a semiarid grassland in Mongolia. J. Arid. Environ. 2016, 131, 1–5. [Google Scholar] [CrossRef]
  4. Gang, C.; Wang, Z.; Zhou, W.; Chen, Y.; Groisman, P.Y. Assessing the Spatiotemporal Dynamic of Global Grassland Water Use Efficiency in Response to Climate Change from 2000 to 2013. J. Agron. Crop Sci. 2016, 202, 343–354. [Google Scholar] [CrossRef]
  5. Soussana, J.F.; Loiseau, P.; Vuichard, N.; Ceschia, E.; Balesdent, J.; Chevallier, T.; Arrouays, D. Carbon cycling and sequestration opportunities in temperate grasslands. Soil Use Manag. 2010, 20, 219–230. [Google Scholar] [CrossRef]
  6. Luo, Z.; Wu, W.; Yu, X.; Song, Q.; Yang, J.; Wu, J.; Zhang, H. Variation of Net Primary Production and Its Correlation with Climate Change and Anthropogenic Activities over the Tibetan Plateau. Remote Sens. 2018, 10, 1352. [Google Scholar] [CrossRef]
  7. Yang, H.; Mu, S.; Li, J. Effects of ecological restoration projects on land use and land cover change and its influences on territorial NPP in Xinjiang, China. Catena 2014, 115, 85–95. [Google Scholar] [CrossRef]
  8. Zhang, R.; Liang, T.; Guo, J.; Xie, H.; Feng, Q.; Aimaiti, Y. Grassland dynamics in response to climate change and human activities in Xinjiang from 2000 to 2014. Sci. Rep. 2018, 8, 1–11. [Google Scholar] [CrossRef]
  9. Ying, Q.; Hansen, M.C.; Potapov, P.V.; Tyukavina, A.; Wang, L.; Stehman, S.V.; Moore, R.; Hancher, M. Global bare ground gain from 2000 to 2012 using Landsat imagery. Remote Sens. Environ. 2017, 194, 161–176. [Google Scholar] [CrossRef] [Green Version]
  10. Zhang, Y.; Zhang, C.B.; Wang, Z.Q.; An, R.; Li, J.L. Comprehensive Research on Remote Sensing Monitoring of Grassland Degradation: A Case Study in the Three-River Source Region, China. Sustainability 2019, 11, 1845. [Google Scholar] [CrossRef] [Green Version]
  11. Nanzad, L.; Zhang, J.; Tuvdendorj, B.; Yang, S.; Rinzin, S.; Prodhan, F.A.; Sharma, T.P.P. Assessment of Drought Impact on Net Primary Productivity in the Terrestrial Ecosystems of Mongolia from 2003 to 2018. Remote Sens. 2021, 13, 2522. [Google Scholar] [CrossRef]
  12. Vicente-Serrano, S.M.; Gouveia, C.; Camarero, J.J.; Begueria, S.; Trigo, R.; L6Pez-Moreno, J.I.; Azorin-Molina, C.; Pasho, E.; Lorenzo-Lacruz, J.; Revuelto, J. Response of vegetation to drought time-scales across global land biomes. Proc. Natl. Acad. Sci. USA 2013, 110, 52–57. [Google Scholar] [CrossRef] [Green Version]
  13. Dai, A. Drought under Global Warming: A Review. Wiley Interdiscip. Rev. Clim. Chang. 2011, 2, 45–65. [Google Scholar] [CrossRef] [Green Version]
  14. Li, C.; Filho, W.L.; Yin, J.; Hu, R.; Wang, J.; Yang, C.; Yin, S.; Bao, Y.; Ayal, D.Y. Assessing vegetation response to multi-time-scale drought across inner Mongolia plateau. J. Clean. Prod. 2018, 179, 210–216. [Google Scholar] [CrossRef]
  15. Di, L.; Scanlon, B.R.; Longuevergne, L.; Sun, A.Y.; Fernando, D.N.; Save, H. GRACE satellite monitoring of large depletion in water storage in response to the 2011 drought in Texas. Geophys. Res. Lett. 2013, 40, 3395–3401. [Google Scholar]
  16. Kazemzadeh, M.; Malekian, A. Spatial characteristics and temporal trends of meteorological and hydrological droughts in northwestern Iran. Nat. Hazards 2016, 80, 1–20. [Google Scholar] [CrossRef]
  17. Vicente-Serrano, S.M.; López-Moreno, J.I.; Beguería, S.; Lorenzo-Lacruz, J.; Azorin-Molina, C.; Morán-Tejeda, E. Accurate Computation of a Streamflow Drought Index. J. Hydrol. Eng. 2012, 17, 318–332. [Google Scholar] [CrossRef] [Green Version]
  18. Zhang, Q.; Kong, D.; Singh, V.P.; Shi, P. Response of vegetation to different time-scales drought across China: Spatiotemporal patterns, causes and implications. Glob. Planet. Chang. 2017, 152, 1–11. [Google Scholar] [CrossRef] [Green Version]
  19. Li, L.Y.; Tian, M.R.; Liang, H.; Chen, Y.M.; Qian, J.P. Spatial and Temporal Changes of Vegetation Coverage and Influencing Factors in Hulun Buir Grassland During 2000–2016. J. Ecol. Rural. Environ. 2018, 34, 584–591. [Google Scholar]
  20. Ciais, P.; Reichstein, M.; Viovy, N.; Granier, A.; Ogee, J.; Allard, V.; Aubinet, M.; Buchmann, N.; Bernhofer, C.; Carrara, A.; et al. Europe-wide reduction in primary productivity caused by the heat and drought in 2003. Nature 2005, 437, 529–533. [Google Scholar] [CrossRef] [PubMed]
  21. Zhao, M.; Running, S.W. Drought-Induced Reduction in Global Terrestrial Net Primary Production from 2000 through 2009. Science 2010, 329, 940–943. [Google Scholar] [CrossRef] [Green Version]
  22. Bao, G.; Liu, Y.; Liu, N.; Linderholm, H.W. Drought variability in eastern Mongolian Plateau and its linkages to the large-scale climate forcing. Clim. Dyn. 2015, 44, 717–733. [Google Scholar] [CrossRef]
  23. Yin, G.; Zengyun, H.U.; Chen, X.; Tashpolat, T. Vegetation dynamics and its response to climate change in Central Asia. J. Arid. Land 2016, 8, 375–388. [Google Scholar] [CrossRef] [Green Version]
  24. Azimi, S.; Moghaddam, M.A. Modeling Short Term Rainfall Forecast Using Neural Networks, and Gaussian Process Classification Based on the SPI Drought Index. Water Resour. Manag. 2020, 34, 1369–1405. [Google Scholar] [CrossRef]
  25. Karina, W.; Ursula, G.; Volker, H. Identifying Droughts Affecting Agriculture in Africa Based on Remote Sensing Time Series between 2000–2016: Rainfall Anomalies and Vegetation Condition in the Context of ENSO. Remote Sens. 2017, 9, 831. [Google Scholar]
  26. Nobre, C.A.; Marengo, J.A.; Seluchi, M.E.; Cuartas, L.A.; Alves, L.M. Some Characteristics and Impacts of the Drought and Water Crisis in Southeastern Brazil during 2014 and 2015. J. Water Resour. Prot. 2016, 8, 252–262. [Google Scholar] [CrossRef] [Green Version]
  27. Zhang, L.; Wu, P.; Zhou, T. Aerosol forcing of extreme summer drought over North China. Environ. Res. Lett. 2017, 12, 1–7. [Google Scholar] [CrossRef]
  28. Mohammat, A.; Wang, X.; Xu, X.; Peng, L.; Yang, Y.; Zhang, X.; Myneni, R.B.; Piao, S. Drought and spring cooling induced recent decrease in vegetation growth in Inner Asia. Agric. For. Meteorol. 2013, 178–179, 21–30. [Google Scholar] [CrossRef]
  29. Yi, L.; Ren, L.; Ma, M.; Yang, X.; Fei, Y.; Jiang, S. An insight into the Palmer drought mechanism based indices: Comprehensive comparison of their strengths and limitations. Stoch. Environ. Res. Risk Assess. 2016, 30, 119–136. [Google Scholar]
  30. Wang, Q.; Yang, Y.; Liu, Y.Y.; Tong, L.J.; Zhang, Q.P.; Li, J.L. Assessing the Impacts of Drought on Grassland Net Primary Production at the Global Scale. Sci. Rep. 2019, 9, 1–8. [Google Scholar] [CrossRef] [Green Version]
  31. Huang, L.; He, B.; Chen, A.; Wang, H.; Liu, J.; Lű, A.; Chen, Z. Drought dominates the interannual variability in global terrestrial net primary production by controlling semi-arid ecosystems. Sci. Rep. 2016, 6, 1–6. [Google Scholar]
  32. Miao, B.; Li, Z.; Liang, C.; Wang, L.; Jia, C.; Bao, F.; Chao, J. Temporal and spatial heterogeneity of drought impact on vegetation growth on the Inner Mongolian Plateau. Rangel. J. 2018, 40, 113–128. [Google Scholar]
  33. Xie, B.; Qin, Z.; Yang, W.; Chang, Q. Spatial and temporal variation in terrestrial net primary productivity on Chinese Loess Plateau and its influential factors. Trans. Chin. Soc. Agric. Eng. 2014, 30, 244–253. [Google Scholar]
  34. Wang, Z.Q.; Chang, J.F.; Peng, S.S.; Piao, S.L.; Ciais, P.; Betts, R. Changes in productivity and carbon storage of grasslands in China under future global warming scenarios of 1.5 degrees C and 2 degrees C. J. Plant Ecol. 2019, 12, 804–814. [Google Scholar] [CrossRef]
  35. Dukes, J.S.; Chiariello, N.R.; Cleland, E.E.; Moore, L.A.; Shaw, M.R.; Thayer, S.; Tobeck, T.; Mooney, H.A.; Field, C.B. Responses of grassland production to single and multiple global environmental changes. PLoS Biol. 2005, 3, e319. [Google Scholar] [CrossRef] [Green Version]
  36. Wang, J.; Brown, D.G.; Chen, J. Drivers of the dynamics in net primary productivity across ecological zones on the Mongolian Plateau. Landsc. Ecol. 2013, 28, 725–739. [Google Scholar] [CrossRef]
  37. John, R.; Chen, J.; Ou-Yang, Z.-T.; Xiao, J.; Becker, R.; Samanta, A.; Ganguly, S.; Yuan, W.; Batkhishig, O. Vegetation response to extreme climate events on the Mongolian Plateau from 2000 to 2010. Environ. Res. Lett. 2013, 8, 1–14. [Google Scholar] [CrossRef]
  38. Wang, W.; Wang, W.J.; Jun-Sheng, L.I.; Hao, W.U.; Chao, X.U.; Liu, X.F. Remote Sensing Analysis of Impacts of Extreme Drought Weather on Ecosystems in Southwest Region of China Based on Normalized Difference Vegetation Index. Res. Environ. Sci. 2010, 23, 1447–1455. [Google Scholar]
  39. Xu, L.; Samanta, A.; Costa, M.H.; Ganguly, S.; Nemani, R.R.; Myneni, R.B. Widespread decline in greenness of Amazonian vegetation due to the 2010 drought. Geophys. Res. Lett. 2011, 38. [Google Scholar] [CrossRef] [Green Version]
  40. Matthews, H.D.; Weaver, A.J.; Meissner, K.J.; Gillett, N.P.; Eby, M. Natural and anthropogenic climate change: Incorporating historical land cover change, vegetation dynamics and the global carbon cycle. Clim. Dyn. 2004, 22, 461–479. [Google Scholar] [CrossRef]
  41. Shi, Y. A preliminary study of signal, impact and foreground of climatic shift from warm-dry to warm-humid in Northwest China. J. Glaciol. Geocryol. 2002, 24, 219–226. [Google Scholar]
  42. Mu, S.; Zhang, C.; Zhou, W.; Li, J.; Sun, Z.; Gang, C. Spatial-temporal dynamics of grassland coverage and its response to climate change in China during 1982–2010. Acta Geogr. Sin. 2014, 69, 15–30. [Google Scholar]
  43. Vandandorj, S.; Gantsetseg, B.; Boldgiv, B. Spatial and temporal variability in vegetation cover of Mongolia and its implications. J. Arid. Land 2015, 7, 450–461. [Google Scholar] [CrossRef]
  44. Zhang, B.; Zhu, J.J.; Liu, H.M.; Pan, Q.M. Effects of extreme rainfall and drought events on grassland ecosystems. Chin. J. Plant Ecol. 2014, 38, 1008–1018. [Google Scholar]
  45. Hua, L.; Ma, Z.; Zhong, L. A comparative analysis of primary and extreme characteristics of dry or wet status between Asia and North America. Adv. Atmos. Sci. 2011, 28, 352–362. [Google Scholar] [CrossRef]
  46. Yin, Y.; Liu, H.; Liu, G.; Hao, Q.; Wang, H. Vegetation responses to mid-Holocene extreme drought events and subsequent long-term drought on the southeastern Inner Mongolian Plateau, China. Agric. For. Meteorol. 2013, 178–179, 3–9. [Google Scholar] [CrossRef]
  47. Zhou, Y.; Ning, L.I.; Zhong-Hui, J.I.; Xiao-Tian, G.U.; Fan, B.H. Temporal and Spatial Patterns of Droughts Based on Standard Precipitation Index (SPI) in Inner Mongolia during 1981–2010. J. Nat. Resour. 2013, 28, 1694–1706. [Google Scholar]
  48. Jiang, Y.; Wang, R.; Peng, Q.; Wu, X.; Cheng, L. The relationship between drought activity and vegetation cover in Northwest China from 1982 to 2013. Nat. Hazards 2018, 92, 1–19. [Google Scholar] [CrossRef]
  49. Zhang, X.; Pan, X.; Xu, L.; Wei, P.; Yin, Z.; Shao, C. Analysis of spatio-temporal distribution of drought characteristics based on SPEI in Inner Mongolia during 1960–2015. Trans. Chin. Soc. Agric. Eng. 2017, 33, 190–199. [Google Scholar]
  50. Mu, S.; Yang, H.; Li, J.; Chen, Y.; Gang, C.; Zhou, W.; Ju, W. Spatio-temporal dynamics of vegetation coverage and its relationship with climate factors in Inner Mongolia, China. J. Geogr. Sci. 2013, 23, 231–246. [Google Scholar] [CrossRef]
  51. Zhang, Y.; Wang, Q.; Wang, Z.; Yang, Y.; Li, J. Impact of human activities and climate change on the grassland dynamics under different regime policies in the Mongolian Plateau. Sci. Total Environ. 2020, 698, 1–10. [Google Scholar] [CrossRef]
  52. Kemp, D.R.; Guodong, H.; Xiangyang, H.; Michalk, D.L.; Fujiang, H.; Jianping, W.; Yingjun, Z. Innovative grassland management systems for environmental and livelihood benefits. Proc. Natl. Acad. Sci. USA 2013, 110, 8369–8374. [Google Scholar] [CrossRef] [Green Version]
  53. Harris, I.; Jones, P.D.; Osborn, T.J.; Lister, D.H. Updated high-resolution grids of monthly climatic observations—The CRU TS3.10 Dataset. Int. J. Climatol. 2014, 34, 623–642. [Google Scholar] [CrossRef] [Green Version]
  54. Wang, Z.; Zhang, Y.; Yang, Y.; Zhou, W.; Gang, C.; Zhang, Y.; Li, J.; An, R.; Wang, K.; Odeh, I. Quantitative assess the driving forces on the grassland degradation in the Qinghai—Tibet Plateau, in China. Ecol. Inform. 2016, 33, 32–44. [Google Scholar] [CrossRef]
  55. White, M.A.; Thornton, P.E.; Running, S.W.; Nemani, R.R. Parameterization and Sensitivity Analysis of the BIOME–BGC Terrestrial Ecosystem Model: Net Primary Production Controls. Earth Interact. 2000, 4, 1–84. [Google Scholar] [CrossRef]
Figure 1. Spatial distribution of grassland Fv, Fb and NPP and statistics of the corresponding pixel number during 2000–2013. ((AC) are the spatial distribution of Fv, Fb and NPP, respectively; (ac) is the statistics of the corresponding pixel number).
Plants 11 00310 g001
Figure 2. The statistics of the temporal distribution of grassland Fv, Fb, and NPP. ((AC) are the statistics of Fv, Fb, and NPP during 2000–2013, respectively).
Plants 11 00310 g002
Figure 3. The changing trend and significance levels of grassland Fv, Fb and NPP. ((AC) are the changing trend of grassland Fv, Fb and NPP, respectively. (ac) are the corresponding significance levels. ESD (extremely significant decrease, slope < 0, p < 0.01); SD (significant decrease, slope < 0, 0.01 < p < 0.05); NSC (no significant change, slope = 0, p > 0.05); SI (Significant Increase, Slope > 0, 0.01 < p < 0.05); ESI (extremely significant increase, slope > 0, p < 0.01)).
Plants 11 00310 g003
Figure 4. The spatial distribution and pixel frequency of correlation coefficient between scPDSI and three vegetation indicators ((AC) are the correlation coefficient spatial distribution and (ac) corresponding its pixel frequency).
Plants 11 00310 g004
Figure 5. The control response of Fv, Fb, and NPP to PDSI changes in the Mongolian plateau from 2000 to 2013. ((AC) are the correlation coefficient spatial distribution and (ac) corresponding its pixel frequency).
Plants 11 00310 g005
Figure 6. The counter response of Fv, Fb, and NPP to PDSI changes in the Mongolian plateau from 2000 to 2013. ((AC) are the correlation coefficient spatial distribution and (ac) corresponding its pixel frequency).
Plants 11 00310 g006
Figure 7. Temporal variations of meteorological variables during 2000–2013 ((AC) are the annual mean temperature, annual cumulative precipitation, and annual cumulative solar radiation, respectively).
Plants 11 00310 g007
Figure 8. The spatial distribution (A-1) and changing trend (A-2) of scPDSI and the reaction of Fv, Fb, and NPP to scPDSI changes (B-1,B-2) in the MP from 2000 to 2013.
Plants 11 00310 g008
Figure 9. Elevation of the MP (a) and grassland types derived from MODIS land cover product (MCD12Q1, IGBP) by the year of 2013 (b).
Plants 11 00310 g009
Table 1. The reclassification of land use type according to the IGBP classification system.
Original Serial NumberOriginal Land Use TypeSerial Number after ReclassificationLand Use Type after Reclassification
1Evergreen Needleleaf Forest1Forest
2Evergreen Broadleaf Forest
3Deciduous Needleleaf Forest
4Deciduous Broadleaf Forest
5Mixed Forest
6Closed Shrublands2Shrubland
7Open Shrublands
8Woody Savannas
9Savannas
10Grasslands3Grassland
11Permanent Wetlands4Wetland
12Croplands5Farmland
13Cropland/Natural Vegetation Mosaic
14Barren or Sparsely Vegetated6Desert
15Snow and Ice7Water
16Water Bodies
17City and Built-up8City
Table 2. Classification relevant of self-calibrating Palmer drought severity index (scPDSI).
scPDSIClassification of Dry and Wet scPDSIClassification of Dry and Wet
≥4Extreme moist−1~−2Slightly drought
3~4Heavy moist−2~−3Moderate drought
2~3Moderate moist−3~−4Heavy drought
1~2Slightly moist≤−4Extreme drought
−1~1Normally--
Table 3. Scenarios to assess the role of Fv, Fb and NPP responding to scPDSI in the MP.
Change DirectionGrassland ConditionsscPDSIFvFbNPP
control responseGrassland RestorationSlope > 0Slope > 0
Slope > 0 Slope < 0
Slope > 0 Slope > 0
Grassland degradationSlope < 0Slope < 0
Slope < 0 Slope > 0
Slope < 0 Slope < 0
counter responseGrassland RestorationSlope < 0Slope > 0
Slope < 0 Slope < 0
Slope < 0 Slope > 0
Grassland degradationSlope > 0Slope < 0
Slope > 0 Slope > 0
Slope > 0 Slope < 0
Publisher’s Note: MDPI stays neutral with regard to jurisdictional claims in published maps and institutional affiliations.

