Article

Optimization of Microwave Assisted Extraction Conditions to Improve Phenolic Content and In Vitro Antioxidant and Anti-Microbial Activity in Quercus cerris Bark Extracts

1
Doctoral School of Medicine and Pharmacy, “George Emil Palade” University of Medicine, Pharmacy, Sciences and Technology of Târgu Mureș, 38 Gheorghe Marinescu Street, 540139 Târgu Mureș, Romania
2
Department of Pharmacognosy and Phytotherapy, Faculty of Pharmacy, “George Emil Palade” University of Medicine, Pharmacy, Sciences and Technology of Târgu Mureș, 38 Gheorghe Marinescu Street, 540139 Târgu Mureș, Romania
3
Department of Pharmaceutical Botany, Faculty of Pharmacy, “Iuliu Hațieganu” University of Medicine and Pharmacy, 8 Victor Babeș Street, 400012 Cluj-Napoca, Romania
4
Laboratory of Chromatography, Institute of Advanced Horticulture Research of Transylvania, University of Agricultural Sciences and Veterinary Medicine, 400372 Cluj-Napoca, Romania
5
Department of Microbiology, Faculty of Medicine, “George Emil Palade” University of Medicine, Pharmacy, Sciences and Technology of Târgu Mureș, 38 Gheorghe Marinescu Street, 540139 Târgu Mureș, Romania
6
Department of Analytical Chemistry and Drug Analysis, Faculty of Pharmacy, University of Medicine, Pharmacy, Sciences and Technology of Târgu-Mureș, Gh. Marinescu Street No. 38, 540139 Târgu Mureș, Romania
7
Department of Pharmaceutical Botany, Faculty of Pharmacy, “George Emil Palade” University of Medicine, Pharmacy, Sciences and Technology of Târgu Mures, 38 Gheorghe Marinescu Street, 540139 Târgu Mures, Romania
*
Author to whom correspondence should be addressed.
Plants 2022, 11(3), 240; https://doi.org/10.3390/plants11030240
Submission received: 22 December 2021 / Revised: 12 January 2022 / Accepted: 12 January 2022 / Published: 18 January 2022
(This article belongs to the Special Issue Plant Polyphenols - from Plants to Human Health Volume II)

Abstract

:
The species of the Quercus genus, including Quercus cerris L., are widely used and their wood represents a valuable material utilized for various purposes. The intense industrial processing of wood results in a considerable amount of poorly-used natural by-products, such as bark, and a loss of potentially useful raw materials. Thus, the aim of our study was to evaluate the phytochemical characteristics and potential biological activities of Quercus cerris bark extracts obtained by optimizing the parameters of microwave assisted extraction (MAE). The optimum conditions for MAE were determined using a design of experiments (DoE) model, which set the experimental variables (irradiation time and microwave power) and their values. Aqueous and hydroalcoholic extractions were performed and the optimum parameters of extraction were determined for both solvents. The total polyphenolic and tannin contents were determined. The biological activities representative of antioxidant capacity were determined using two free radical scavenging methods, the DPPH and ABTS methods, and the antibacterial activity was assessed with the microdilution method. The results showed different optimal extraction conditions for aqueous (30 min at 850 W) and hydroalcoholic (18 min at 650 W) extracts. A higher yield of total polyphenols was observed in the hydroalcoholic bark extract (403.73 ± 7.35 mg gallic acid equivalents/g dried weight); however a lower level of tannins was registered in comparison to the aqueous extract. In addition, both extracts exerted high antioxidant activities, with the aqueous extracts having a stronger inhibitory effect against the DPPH radical. Moreover, the extracts exhibited antibacterial activity against the tested bacterial strains, especially against the Gram-positive strains and Klebsiella pneumoniae, with the hydroalcoholic extracts being more efficient overall. To conclude, the optimized MAE was an efficient method to extract phytochemical compounds with potential biological effects from Quercus cerris bark.

1. Introduction

The Quercus genus is one of the most important genera of the Fagaceae family, as it comprises over 600 species, mainly trees, that are widely spread in the Northern Hemisphere, mainly in Europe, Asia, and the Americas (especially North America) [1,2]. Due to the properties of their wood, oaks have great economic importance, and they are used in different fields, such as construction, furniture, and barrel production [3,4]. Considering the current spread of the genus and the value of oak wood, the large amount of oak bark that results after wood processing is considered natural waste. However, recent research focused on the analysis of different types of oak barks suggested that this so-called natural waste might be an important source of bioactive compounds, mainly polyphenols, such as phenolic acids, tannins, and flavonoids [5]. It is believed that because of these secondary metabolites, the oak bark extracts can exert a series of biological activities, including antioxidant, antimicrobial, anti-inflammatory, antitumoral, cardioprotective, and hepatoprotective activities [6,7,8].
Turkey oak (Quercus cerris L.) represents one of the native oak species found in central Europe [4], and one of the oak species found in all the regions of Romania but mainly in the western part of the country [9,10,11]. Data regarding the phytochemical composition and the biological activity of the Q. cerris bark extracts are very limited. Previous studies focus more on the potential use of the bark as a material, due to some of the physical characteristics of the cork, rather than on the identification and use of the bioactive compounds that may be found in the vegetal matrix [12,13,14]. However, in one study, Sen et al. determined the total phenolic acids, condensed tannins, and flavonoid contents in hydroalcoholic extracts obtained from the cork and phloem fractions of Q. cerris. The same study indicated the antioxidant capacity of the extracts [15]. Additionally, phenolic compounds, such as vanillic, homovanillic, and isovanillic acids, vanillin, and syringic acid, were identified in the hydroalcoholic extracts obtained from the wood of Q. cerris. These extracts also exerted antioxidant activities [16]. The presence of these compounds in the wood may indicate their potential presence in the bark as well. Moreover, aqueous and methanolic Q. cerris bark extracts have been shown to inhibit the proliferation of the Hep-2 (human larynx carcinoma) cell line [17].
To benefit from the health-improving effects provided by the bioactive compounds comprised in vegetal matrices, such as bark, these phytochemicals must first be extracted using specific extraction methods (i.e., the Soxhlet method, ultrasound assisted, or microwave assisted extractions) [18,19]. Microwave assisted extraction (MAE) is one of the most modern and efficient methods used to recover bioactive compounds from vegetal matrices [20]; however, a prior optimization of the extraction parameters must be performed to assure that the maximum yield of phytochemical compounds is achieved [21].
To the best of our knowledge, there are no studies focused on the optimization of the MAE of phenol compounds from Q. cerris bark, and even less using a “green solvent” as water. Therefore, a systematic approach was used to optimize the extraction factors, including microwave power and irradiation time, leading to the maximum extraction of phenols and the highest in vitro antioxidant and antibacterial activity.
Thus, the aim of this study was to optimize the extraction parameters of microwave assisted extraction (used solvent, microwave power, and irradiation time) of Q. cerris bark and to determine the phytochemical profile and the potential biological activities of the extracts obtained via the optimized parameters.

2. Materials and Methods

2.1. Chemicals, Reagents, and Bacterial Strains

The chemicals used for the extraction procedures and total phenolic content determination were 95% ethanol (used to obtain a 70% solution) purchased from Girelli Alcool Srl (Zibido, San Giacomo, Italy), Na2CO3 decahydrate purchased from Reactivul Srl (Râmnicu, Vâlcea, Romania), gallic acid monohydrate purchased from Sigma-Aldrich Chemie GmbH (Steinheim, Germany), and Folin–Ciocâlteu reagent purchased from Merck KGaA (Darmstadt, Germany). The protocols used for the assessment of total tannin content and antioxidant activity additionally required 2,2-diphenyl-1-picrylhydrazyl (DPPH), 2,2′-azino-bis(3-ethylbenzothiazoline-6-sulfonic acid) (ABTS), hide powder, and pyrogallol, which were all acquired from Sigma-Aldrich Chemie GmbH (Steinheim, Germany).
The antibacterial activity was tested on 5 different bacterial strains: Staphylococcus aureus ATCC 25923, Methicillin-resistant Staphylococcus aureus ATCC 43300, Escherichia coli ATCC 25922, Klebsiella pneumoniae ATCC 13883, and Pseudomonas aeruginosa ATCC 27853. These strains were provided by the Microbiology Department of the George Emil Palade University of Medicine, Pharmacy, Sciences, and Technology from Târgu-Mureș.

2.2. Plant Sample

The Quercus cerris L. bark samples were collected from Deva, Hunedoara County, Romania, during May 2021. The bark was collected from the stems of Q. cerris specimens, aged between 15 and 20 years. These samples were collected by using the itinerary method. The samples were shredded manually and dried in a Nahita 631 Plus drying oven (Auxilab S.L., Beriáin, Spain) at 50 °C for 24 h. The dried material was then milled using a Pulverisette 15 cutting mill (Fritsch GmbH, Idar-Oberstein, Germany).

2.3. Optimization and Extraction/Design of Experiments (DoE)

Before the development of a design of experiments (DoE) that would allow the comprehensive study of the extraction process, some preliminary experiments were performed. The output of these experiments was analyzed by a team of experienced researchers. The aim of this was to define the most significant process parameters and their fundamental values (data not shown).
MODDE 13.1 software (Sartorius Stedim, Umeå, Sweden) was employed for the development of a D-optimal DoE, which permitted the integration of the experimental variability for studying its effects and established the optimal experimental values for the extraction.
The D-optimal model allows the study of multiple combinations of qualitative and quantitative multilevel factors in the same experimental design. Unlike standard classical designs, such as factorials and fractional factorials, D-optimal design matrices are usually not orthogonal and effect estimates are correlated. In this model, several experimental runs are chosen to include the largest possible volume of the variability matrix. [22].
Furthermore, by the analysis of coefficients, we evaluated the effects of the process variables over the measured extraction performances. Next, the optimal formulation and design space were defined in accordance with the obtained results.
A proven acceptable range (PAR) was established within the design space. The PAR is defined as “a characterized range of a process parameter for which operation within this range, while keeping other parameters constant, will result in producing a material meeting relevant quality criteria” [23]. After the determination of the design space and PAR, the optimal extraction parameters were established by defining combinations of factors (i.e., microwave power, irradiation time) that predicted a result as close as possible to the target values of the response [24].
The developed optimization DoE considered two quantitative factors: irradiation time, varied over 3 levels of variation (10, 20, and 30 min) and microwave power, varied over 3 levels of variation (200, 500, and 1000 W). It consisted in 14 experimental runs, including 3 replicates performed in order to assess the reproducibility of the extractions. To reduce the risk of systematic errors, the 14 runs were performed in a randomized order. These data are presented in Table 1.
Ten grams of Q. cerris bark were placed into the microwave extractor vessel with 200 mL of water or 70% ethanol. The extractions were performed using all the combinations of the above-mentioned parameters in an Ethos X Advanced microwave extractor (Milestone, Sorisole, Italy). All the extracts were filtered through vacuum filtration and then added to a 200 mL volumetric flask, completing the volume with the specific solvent. To evaluate the optimum parameters for both solvents used, the total phenolic content (TPC) of the extracts was determined. The results were expressed as mg gallic acid equivalents (GAE)/g dried bark. After determining the optimal conditions of extraction for both solvents, the extractions were reperformed with these parameters. The extracts obtained via the optimal parameters were centrifuged for 11 min at 15,000 RPM and 10 °C with a Hettich Mikro 200R (Andreas Hettich GmbH, Tuttlingen, Germany). The supernatant was carefully collected and reused in the next steps. The ethanolic extracts were then concentrated in a rotary evaporator at 75 °C, removing the ethanol; this step was required to freeze the extracts. Finally, the unconcentrated aqueous extracts and concentrated ethanolic extracts were freeze dried in a BK-FD12S freeze dryer (Biobase Biodustry Co., Ltd., Shandong, China).

2.4. Quantification of Total Phenolics

The total polyphenolic content was assessed using the Folin–Ciocâlteu method, as previously described with slight modifications [25].
The TPC of the aqueous (QCA) and hydroalcoholic (QCE) extracts obtained using the parameters set by the design of experiments software was determined by adding 400 µL of Folin–Ciocâlteu reagent to 400 µL of appropriately diluted extract, and finally adding 3200 µL of 5% Na2CO3 solution, shaking the test tubes well and leaving them at room temperature in darkness for one hour. For each diluted extract, 3 replicates were performed. The absorbance of each replicate was measured at 750 nm with a Specord 200 Plus (Analytik Jena AG, Jena, Germany). The results were expressed as mg GAE/g dried bark.
The TPC of the extracts obtained using the optimal parameters was determined before and after freeze drying. Approximately 2 mg of lyophilized extract were redissolved in 1 mL solvent used for extraction. The reconstituted solutions were then similarly analyzed. The results were expressed as mg GAE/g dried weight.

2.5. Quantification of Tannins

For the determination of tannins, the freeze-dried extracts (0.01 g) were dissolved in 50% methanol. The quantitative determination of tannins was performed according to the method described in the European Pharmacopoeia 8th edition [26]. Thus, for the determination of total polyphenols, 2 mL of extract (diluted 1:25) were treated with 1 mL of Folin–Ciocâlteu reagent, 10 mL of distilled water, and 29% Na2CO3 solution. The flask was left in the dark at room temperature for 30 min. Afterwards, the absorbance of the solution was measured at 760 nm (A1). To determine the content of polyphenols, which were not adsorbed on the hide powder, 10 mL of extract were added to a volumetric flask with 0.1 g of hide powder. The mixture was shaken for sixty minutes and then filtered. Finally, 2 mL of this solution were used for the total polyphenols determination (A2). The total tannin content (TTC) was determined by comparing the absorbance difference (A1–A2) to a pyrogallol solution representing an external standard. The final TTC was expressed as % of pyrogallol/vegetal material.

2.6. Antioxidant In Vitro Assays

2.6.1. Determination of DPPH Radical Scavenging Activity

The free radical scavenging activity was determined according to a previously described method with slight modifications [27]. Different concentrations of the extract solutions (50 µL freeze dried extract in 50% methanol) and methanolic solution of 0.1 mM DPPH (200 µL) were incubated in darkness at room temperature for 30 min. The absorbance of each reaction mixture was read at 517 nm against the corresponding blank with a microplate reader (Epoch, BioTek, Winooski, VT, USA). The inhibition capacity was calculated using the following equation:
inhibition   % = A c A s A c × 100
where Ac is the absorbance of the control solution determined in the same conditions and As is the absorbance of the sample [28].
The concentration of extract or pyrogallol solution responsible for 50% inhibition of the DPPH radical (IC50) was determined from the nonlinear regression plot of inhibition percentage against the logarithms of concentrations.

2.6.2. Determination of ABTS Free Radical-Scavenging Activity

Radical scavenging activity was measured as previously described with slight modifications [29]. Briefly, 50 µL of the extract solutions (freeze dried extract in 50% methanol) and 200 µL of ABTS methanolic solution (10 mM) were incubated at room temperature. The absorbance of each sample was read at 734 nm with a microplate reader. The inhibition capacity was calculated using the following equation:
inhibition   % = A c A s A c × 100
where Ac is the absorbance of the control solution determined in the same conditions and As is the absorbance of the sample.

2.7. Antibacterial Activity

The antibacterial activity of the freeze-dried extracts was quantified by determining the minimum inhibitory concentrations (MICs), using the microdilution method as previously described [30]. Briefly, the freeze-dried extracts were redissolved in 5% DMSO (achieving a concentration of 10 mg/mL) and added (200 µL) to the wells of the first column of a 96-well plate. The tested solutions were then binary diluted with sterile distilled water. Bacterial suspensions of each strain were prepared by adding 10 µL of inoculum in 9990 µL of Muller–Hinton broth 2X. A total of 100 µL of the bacterial suspensions were added to each well. For each tested substance and bacterial strain, the method was performed three times. Both the tested extracts and each bacterial strain suspension were added in separate wells as negative and positive controls, respectively. Additionally, a row of the microdilution plate was used to screen the potential antibacterial activity of the DMSO in the mixture. Finally, the microdilution plates were left in an incubator at 37 °C for 24 h. The MICs were considered in the first wells where no bacterial growth was observed (optical evaluation).

2.8. Statistical Analysis

All the determinations were performed in triplicate. The statistical analysis was performed using GraphPad Prism 8. The significance level was chosen before performing the statistical analysis (α = 0.05). First, the Kolmogorov–Smirnov normality test was used to assess if the data were taken from a Gaussian distribution. The F test was then used to compare the variance differences between the 2 groups. The correct t-test was chosen accordingly, comparing the means of the two data series. A p value less than 0.05 was considered significant.

3. Results and Discussions

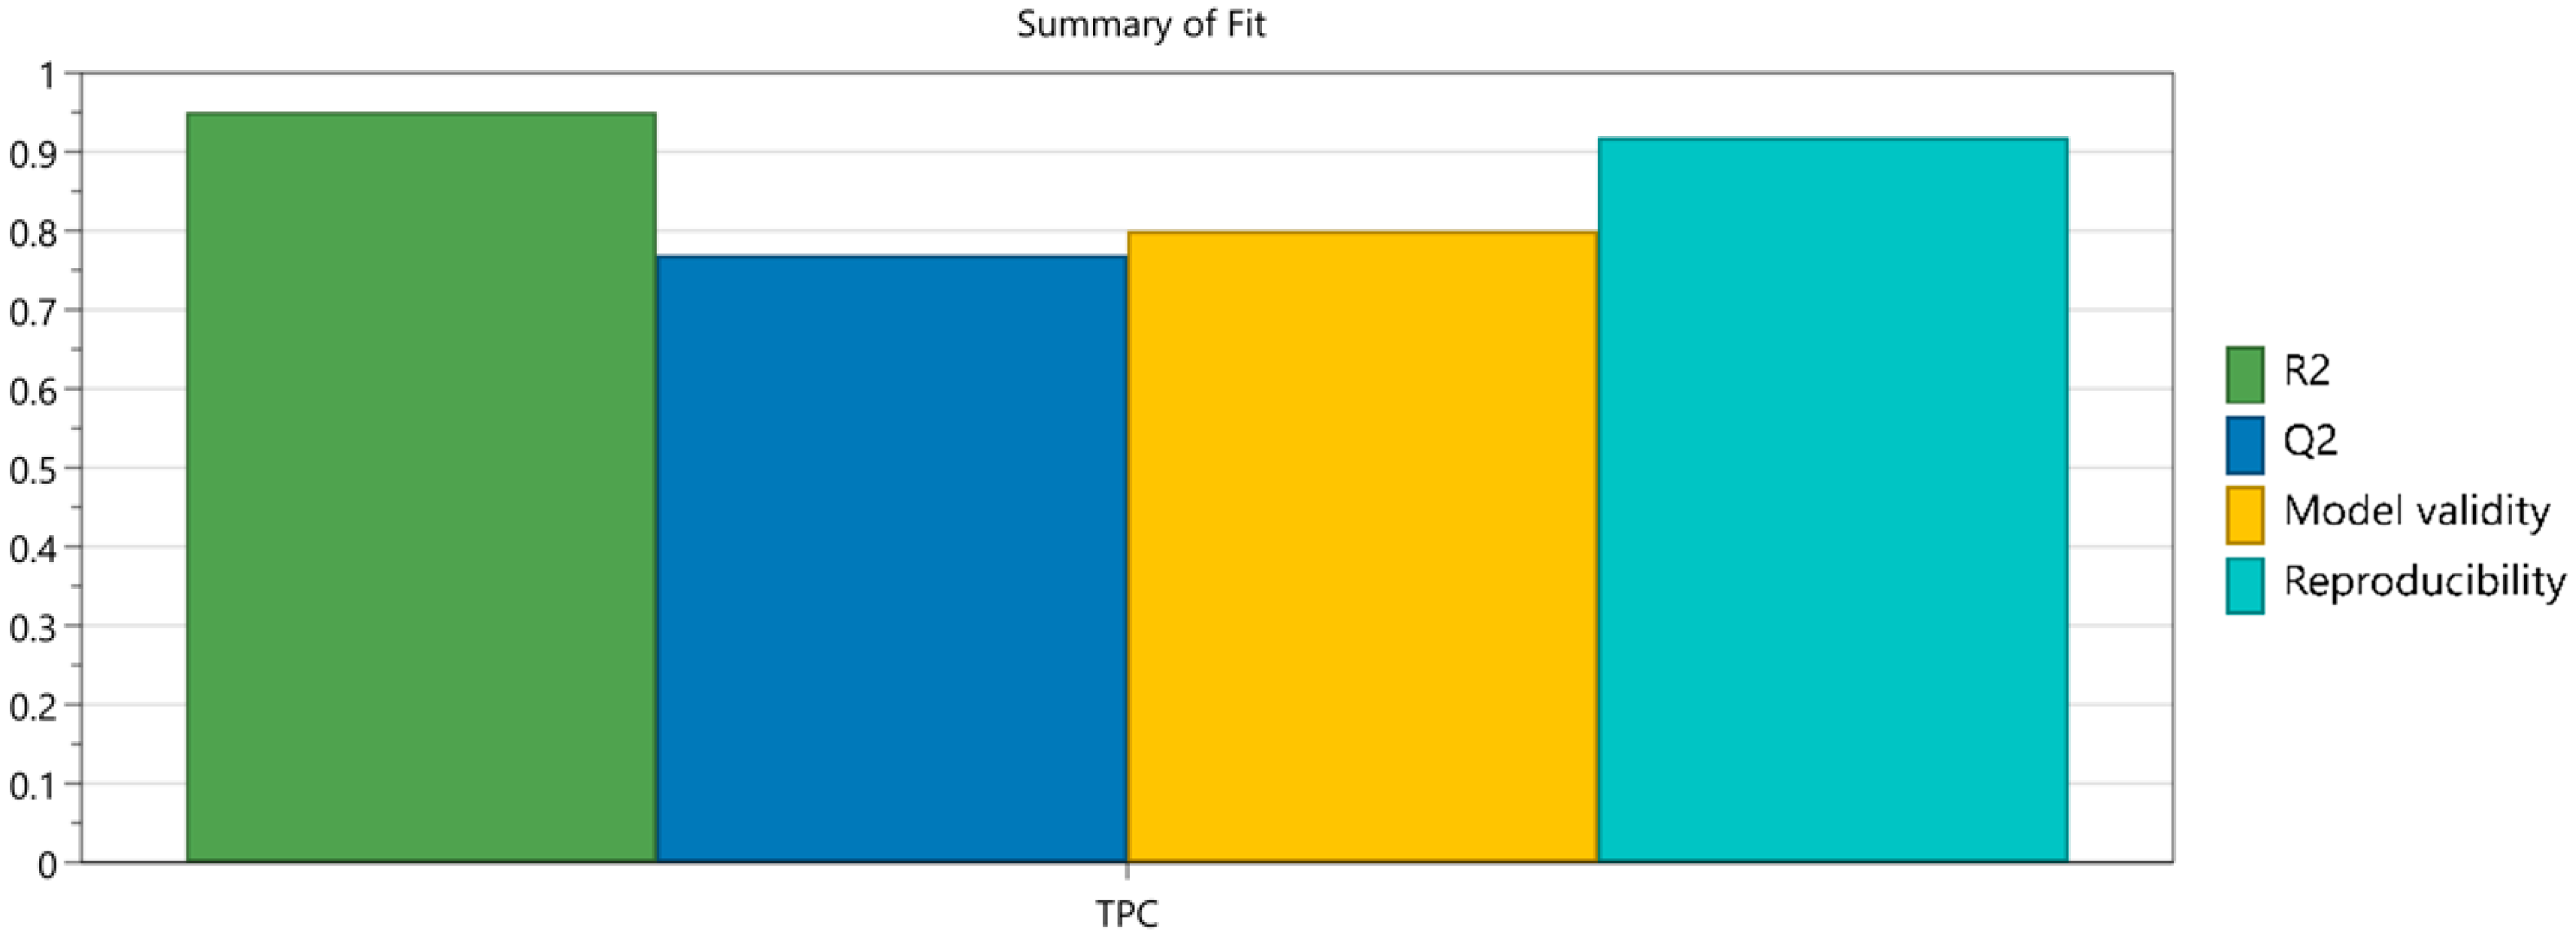
3.1. Design of Experiments

When quantitative and qualitative factors are studied in a D-optimal design of experiments, the selection of experimental runs included in the design matrix is critical and should be performed employing scientific methods. In the present case, two statistical parameters were taken into account: condition number and G-efficiency [31].
The condition number assesses the sphericity of a design and is computed for an extended design matrix. Briefly, it represents the ratio of the largest and smallest values of the variability matrix. The ideal condition number value is 1, representing an orthogonal design. For optimization designs with multilevel factors, as in this case, the condition number value could increase considerably; therefore, a DoE with a condition number <8 is considered statistically efficient. For a high quality, reliable D-optimal DoE, a G-efficiency above 50% is recommended [22].
The condition number for the DoE had a value of 3.84 and a G-efficiency of 57%, values which describe a highly reliable statistical model [22]. The studied response was the TPC, assayed for each individual sample.
The results were introduced into the design matrix and the fitting of the experimental data was carried out using multiple linear regression (MLR). The model fitting was evaluated using the standard, most reliable statistical parameters: R2 (goodness of fit), which describes the fraction of the response variation explained by the model; Q2 (goodness of prediction), which estimates the prediction capacities of the model; and ANOVA test and model reproducibility, which are calculated and represented based strictly on the replicates specified in the design matrix [32].
A good fitting is represented by high values of the model performance indicators, as close as possible to value of 1. Moreover, for a valid model, the difference between R2 and Q2 should be no more than 0.2–0.3, as higher differences indicate an inappropriately selected model. Reproducibility should be well over 0.5 [33].
The summary of fit and the statistical parameters were calculated based on the experimental design data.
The results confirmed that the developed model was statistically robust, indicating a significant influence of the factors on the responses and that the model has no lack of fit (Figure 1). Similar statistical results have been registered in other studies where the DoE has been applied for optimization purposes [34].

3.2. Effects of Process Variables on the Extracted TPC

The regression coefficients were automatically established for the studied variables based on the DoE model. Figure 2 presents the scaled and centered coefficient plots that highlight the influence of the extraction parameters over the extracted TPC content for water and EtOH 70% extract, respectively.
All parameters studied had a statistically significant influence. Irradiation time was the least influential parameter, whereas the irradiation power had a positive influence; increasing the microwave power increased the TPC of extracts.
The interaction between parameters is further discussed here. Power × power and time × time are quadratic interactions, meaning that the influence exerted on TPC solely by time or power is not linear. The interaction exerted by the two factors combined (time × power) is positive, meaning that an increase in the two would enhance their effect on TPC. It is important to note that such interactions can only be assessed using experimental designs [32].

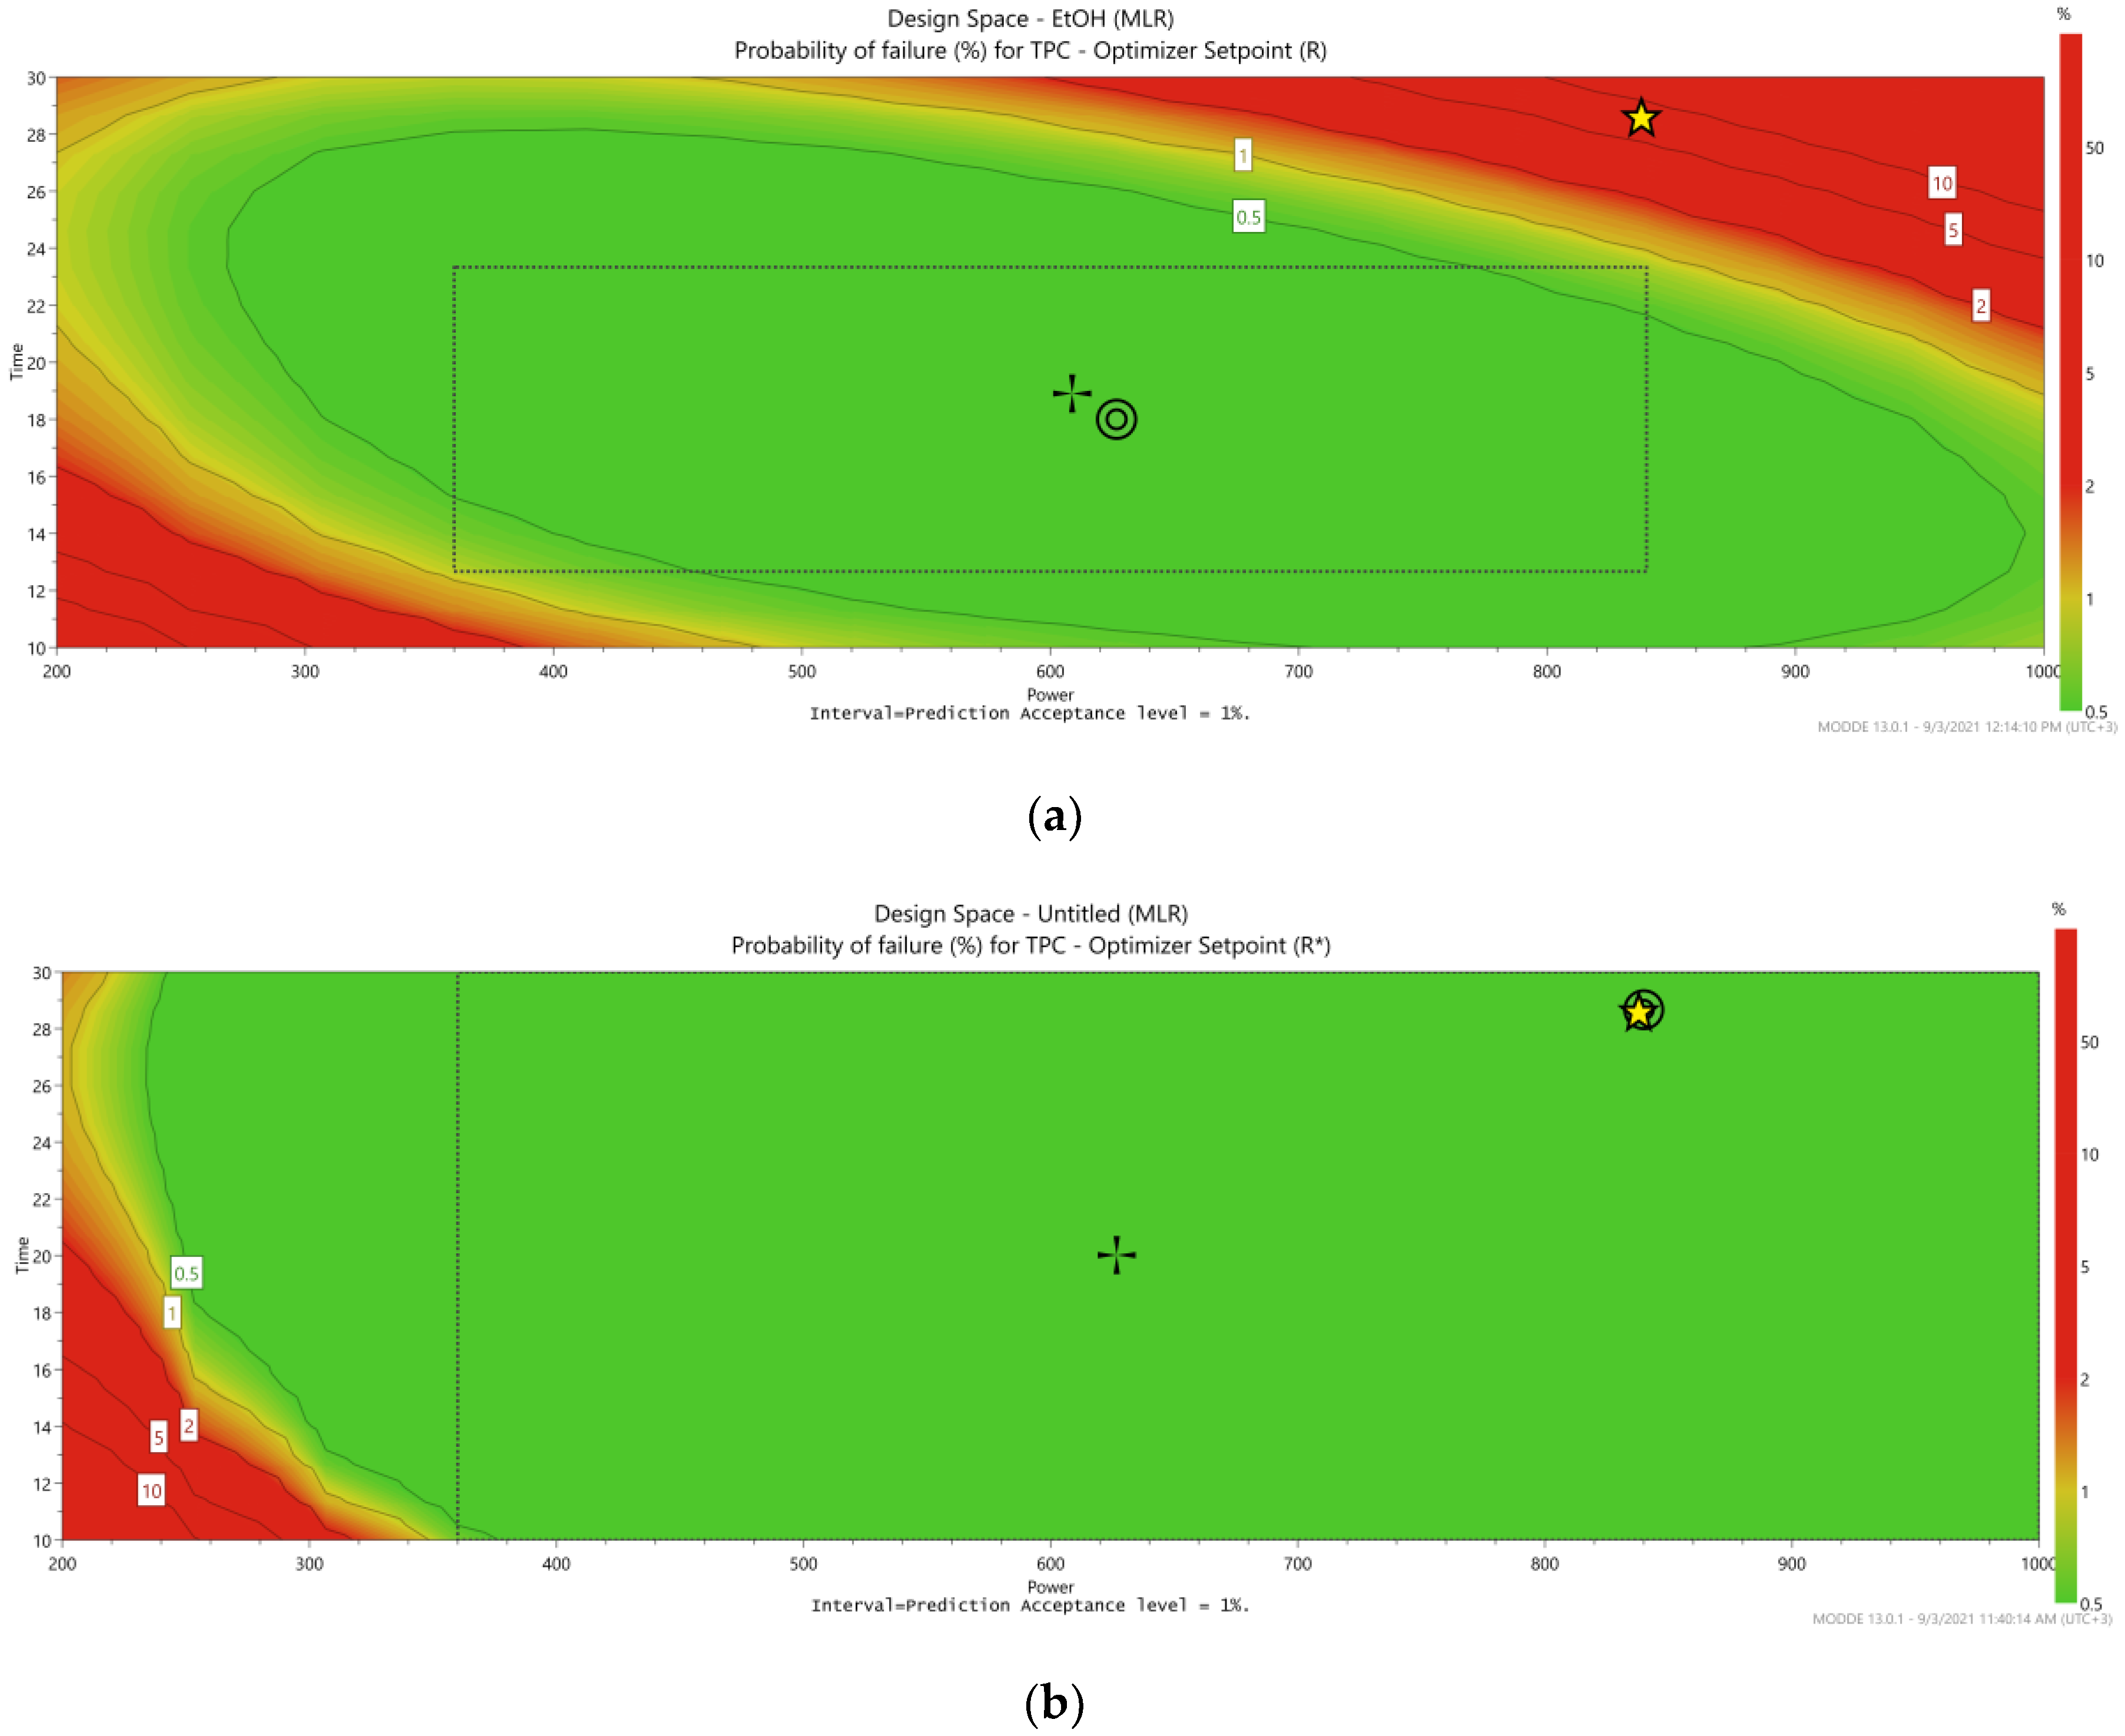
3.3. Design Space and Process Optimization

The previously described approach provided a comprehensive understanding of the variables’ influence over the extraction process. Next, the optimization function of MODDE software was used to generate a design space by introducing the desired TPC values in order to maximize the extraction capacities (Figure 3).
The desired values that were introduced to the MODDE software included: a TPC minimum of 25 mg GAE/g oak bark and target of 27 mg GAE/g oak bark for the water extract, and a minimum 30 mg GAE/g oak bark and target of 31.5 mg GAE/g oak bark for the 70% EtOH extract.
The desired process parameters were set as follows: irradiation time as short as possible and microwave power low as possible. Given these parameters, the optimization feature of the optimization software generated the following extraction parameters: for 70% EtOH extract, an irradiation time of 18 min at a microwave power of 650 W, and for water extract, an irradiation time of 30 min at 850 W.
The experimentally obtained TPC was 26.19 ± 0.29 mg GAE/g oak bark for the water extract and 31.27 ± 1.80 mg GAE/g oak bark for the 70% EtOH extract.

3.4. Total Polyphenolic and Tannin Content

The TPCs of the aqueous and ethanolic extracts were determined after the freeze-drying process and reconstitution, considering the absorption of the samples after the Folin–Ciocâlteu reaction and the calibration curve of the gallic acid standards: y = 11.767x + 0.2737, R2 = 0.9984. The results were expressed as mg GAE/g dry weight, and they are presented in Table 2.
As shown in Table 2, the QCE variant had a significantly higher level of total polyphenols (p = 0.0015), suggesting that the 70% ethanol–water mixture was a better solvent for the extraction of polyphenolic compounds from the Q. cerris bark. A previous study also indicated the presence of polyphenols in the bark of Q. cerris, presenting relatively similar values of TPC compared to our results [15]. Moreover, data in the literature suggest that using mixtures of solvents, such as our combination, may result in higher polyphenolic yields when using microwave assisted extraction because of a greater solubility of the target compounds and a better penetrability of the vegetal material [35,36].
In contrast with the results regarding the polyphenol content, the total tannin content was slightly higher in the QCA variant; however, the difference was not significant. This indicates that water and the ethanol–water mixture had a similar efficiency regarding the extraction of tannins from the hard vegetal matrix of the bark

3.5. Antioxidant Activity

Antioxidant activity was determined using the DPPH and ABTS methods, and results are presented in Table 2. The DPPH assay showed that the aqueous extract had significantly higher antioxidant activity compared with the ethanolic extracts, which is likely related to the tannin content (although the concentration of tannins was not significantly different between the two extracts, and the aqueous extract contained a higher concentration than the ethanolic extract). As can be seen in Figure 4, the two extracts had different interactions with the DPPH radical. The IC50 of pyrogallol was 6.67 ± 0.47, which indicates a high antioxidant potential of the tested extracts. As can be seen in Table 2, the DPPH assay results could not be correlated with the total polyphenolic content. Such discrepancies could be attributed to the fact that different phenol compounds react differently with Folin–Ciocâlteu reagent; in addition, not all phenolic compounds are potent radical scavengers, nor do they all have the same matrix effect [37]. The ABTS+ scavenging assay, however, did not highlight any differences between the two extracts. It has been previously reported that, depending on the matrix of the herbal drug, DPPH and ABTS results sometimes cannot be correlated [38].

3.6. Antibacterial Activity

The antibacterial activity of the redissolved freeze-dried extracts was tested on the previously mentioned bacterial strains by determining the MICs of the experimental variants. As shown in Table 3, both tested extracts exhibited improved activity against the Gram-positive bacterial strains in comparison to the Gram-negative strains, especially QCE, which inhibited both S. aureus and MRSA at an MIC of 0.625 mg/mL. Similarly, QCE had improved activity against the Gram-negative bacterial strains compared to QCA, with the exception of K. pneumoniae for which both extracts exhibited the same MIC. Additionally, the DMSO used for redissolving the freeze-dried extracts had no effect against any of the tested bacterial strains; thus, the registered antibacterial effects were caused by the presence of the tested extracts. Previous studies have also indicated the antibacterial potential of extracts obtained from Quercus spp. barks. This activity hints towards the presence of polyphenols in the mentioned extracts [5,6,39,40].

4. Conclusions

The results revealed that aqueous and hydroalcoholic extracts have distinct optimal extraction conditions (30 min at 850 W for the aqueous extracts and 18 min at 650 W for the hydroalcoholic extracts). The hydroalcoholic bark extract had a larger yield of total polyphenols and a lower quantity of tannins when compared to the aqueous extract, and both extracts had considerable antioxidant activity. Furthermore, the extracts showed antibacterial activity against the tested bacterial strains, particularly against the Gram-positive strains and Klebsiella pneumoniae, with the hydroalcoholic extracts being more effective overall. To summarize, the improved MAE is an effective approach for extracting phytochemical components from Quercus cerris bark with possible biological effects.

Author Contributions

Conceptualization, C.T. and A.M. (Andrei Mocan); methodology, C.T., A.N., R.Ș., A.M. (Andrei Mocan), C.M., A.D.M., A.M. (Adrian Man), C.N.C. and D.-L.M.; software, C.M.; validation, C.M. and A.M. (Andrei Mocan); investigation, C.T., A.N., R.Ș., Adrian Man, C.M., A.D.M., A.M. (Andrei Mocan), C.N.C. and D.-L.M.; resources, C.T.; data curation, C.T., A.N., R.Ș., A.M. (Andrei Mocan), C.M., A.D.M., Adrian Man., C.N.C. and D.-L.M.; writing—original draft preparation, A.N., R.Ș., Andrei Mocan and C.M.; writing—review and editing, C.T., A.D.M., Adrian Man and D.-L.M.; supervision, C.T.; project administration, C.T.; funding acquisition, C.T. All authors have read and agreed to the published version of the manuscript.

Funding

This work was supported by a grant from the Romanian Ministry of Education and Research, CNS-UEFISCDI, project number PN-III-P1-1.1-TE-2019-1549, within PNCDI III.

Institutional Review Board Statement

Not applicable.

Informed Consent Statement

Not applicable.

Data Availability Statement

Not applicable.

Acknowledgments

This work was supported by a grant from the Romanian Ministry of Education and Research, CNS-UEFISCDI, project number PN-III-P1-1.1-TE-2019-1549, within PNCDI III.

Conflicts of Interest

The authors declare no conflict of interest.

References

  1. Tantray, Y.R.; Wani, M.S.; Hussain, A. Genus Quercus: An Overview. Inter. J. Adv. Res. Sci. Eng. 2017, 6, 1880–1886. [Google Scholar]
  2. Giertych, M.J.; Chmielarz, P. Size Variability in Embryonic Axes, Cotyledons, Acorns and Seedlings in Fifteen Species of the Genus Quercus. Trees 2020, 34, 593–601. [Google Scholar] [CrossRef]
  3. Popović, B.M.; Štajner, D.; Ždero, R.; Orlović, S.; Galić, Z. Antioxidant Characterization of Oak Extracts Combining Spectrophotometric Assays and Chemometrics. Sci. World J. 2013, 2013, 134656. [Google Scholar] [CrossRef] [PubMed]
  4. Mölder, A.; Meyer, P.; Nagel, R.-V. Integrative Management to Sustain Biodiversity and Ecological Continuity in Central European Temperate Oak (Quercus robur Q. petraea) Forests: An Overview. For. Ecol. Manag. 2019, 437, 324–339. [Google Scholar] [CrossRef]
  5. Burlacu, E.; Nisca, A.; Tanase, C. A Comprehensive Review of Phytochemistry and Biological Activities of Quercus Species. Forests 2020, 11, 904. [Google Scholar] [CrossRef]
  6. Elansary, H.; Szopa, A.; Kubica, P.; Ekiert, H.; A Mattar, M.; Al-Yafrasi, M.A.; El-Ansary, D.O.; Zin El-Abedin, T.K.; Yessoufou, K. Polyphenol Profile and Pharmaceutical Potential of Quercus Spp. Bark Extracts. Plants 2019, 8, 486. [Google Scholar] [CrossRef] [Green Version]
  7. Yin, J.; Kim, H.H.; Hwang, I.H.; Kim, D.H.; Lee, M.W. Anti-Inflammatory Effects of Phenolic Compounds Isolated from Quercus mongolica Fisch. Ex Ledeb. on UVB-Irradiated Human Skin Cells. Molecules 2019, 24, 3094. [Google Scholar] [CrossRef] [Green Version]
  8. Panchal, S.K.; Brown, L. Cardioprotective and Hepatoprotective Effects of Ellagitannins from European Oak Bark (Quercus petraea L.) Extract in Rats. Eur. J. Nutr. 2013, 52, 397–408. [Google Scholar] [CrossRef]
  9. Fodor, E.; Timofte, A.; Geambașu, T. Mycorrhizal Status of Several Quercus Species in Romania (Quercus cerris, Q. frainetto, Q. robur) and the Optimization Perspective of Growth Conditions for in Vitro Propagated Plants Transplanted in the Field. Ann. For. Res. 2011, 54, 57–71. [Google Scholar]
  10. Chisăliță, I.; Dincă, L.; Spârchez, G.; Crăciunescu, A.; Vişoiu, D. The nfluence of some stagnoluvosols characteristics on the productivity of Quercus cerris and Quercus frainetto stands from os Faget, ds Timiş. Res. J. Agric. Sci. 2015, 47, 23–28. [Google Scholar]
  11. Adam, I. The Spreading of the Turkey Oak (Quercus cerris L.) in Romania. Forestry Sites and Turkey Oak Stands. J. Hortic. For. Biotechnol. 2009, 13, 309–314. [Google Scholar]
  12. Şen, A.; Miranda, I.; Pereira, H. Temperature-Induced Structural and Chemical Changes in Cork from Quercus cerris. Ind. Crops Prod. 2012, 37, 508–513. [Google Scholar] [CrossRef]
  13. Lakreb, N.; As, N.; Gorgun, V.; Sen, U.; Gomes, M.G.; Pereira, H. Production and Characterization of Particleboards from Cork-Rich Quercus cerris Bark. Eur. J. Wood Wood Prod. 2018, 76, 989–997. [Google Scholar] [CrossRef]
  14. Şen, A.; Quilhó, T.; Pereira, H. The Cellular Structure of Cork from Quercus cerris Var. Cerris Bark in a Materials’ Perspective. Ind. Crops Prod. 2011, 34, 929–936. [Google Scholar] [CrossRef]
  15. Sen, A.; Miranda, I.; Esteves, B.; Pereira, H. Chemical Characterization, Bioactive and Fuel Properties of Waste Cork and Phloem Fractions from Quercus cerris L. Bark. Ind. Crops Prod. 2020, 157, 112909. [Google Scholar] [CrossRef]
  16. Cetera, P.; Russo, D.; Milella, L.; Todaro, L. Thermo-Treatment Affects Quercus cerris L. Wood Properties and the Antioxidant Activity and Chemical Composition of Its By-Product Extracts. Ind. Crops Prod. 2019, 130, 380–388. [Google Scholar] [CrossRef]
  17. Şöhretoğlu, D.; Sabuncuoğlu, S.; Harput, Ü.Ş. Evaluation of Antioxidative, Protective Effect against H2O2 Induced Cytotoxicity, and Cytotoxic Activities of Three Different Quercus Species. Food Chem. Toxicol. 2012, 50, 141–146. [Google Scholar] [CrossRef]
  18. Tanase, C.; Coșarcă, S.; Muntean, D.-L. A Critical Review of Phenolic Compounds Extracted from the Bark of Woody Vascular Plants and Their Potential Biological Activity. Molecules 2019, 24, 1182. [Google Scholar] [CrossRef] [Green Version]
  19. Meullemiestre, A.; Petitcolas, E.; Maache-Rezzoug, Z.; Chemat, F.; Rezzoug, S.A. Impact of Ultrasound on Solid-Liquid Extraction of Phenolic Compounds from Maritime Pine Sawdust Waste. Kinetics, Optimization and Large Scale Experiments. Ultrason. Sonochem. 2016, 28, 230–239. [Google Scholar] [CrossRef]
  20. Vinatoru, M.; Mason, T.J.; Calinescu, I. Ultrasonically Assisted Extraction (UAE) and Microwave Assisted Extraction (MAE) of Functional Compounds from Plant Materials. TrAC Trends Anal. Chem. 2017, 97, 159–178. [Google Scholar] [CrossRef]
  21. Dahmoune, F.; Nayak, B.; Moussi, K.; Remini, H.; Madani, K. Optimization of Microwave-Assisted Extraction of Polyphenols from Myrtus communis L. Leaves. Food Chem. 2015, 166, 585–595. [Google Scholar] [CrossRef]
  22. Eriksson, L.; Johansson, E.; Kettaneh-Wold, N.; Wikström, C.; Wold, S. Design of Experiments. In Principles and Applications; Learn Ways AB: Stockholm, Sweden, 2000. [Google Scholar]
  23. European Medicines Agency, ICH Guideline Q8 (R2) on Pharmaceutical Development. 2009. Available online: https://www.ema.europa.eu/en/ich-q8-r2-pharmaceutical-development (accessed on 17 December 2021).
  24. Moldovan, C.; Frumuzachi, O.; Babotă, M.; Menghini, L.; Cesa, S.; Gavan, A.; Sisea, C.R.; Tanase, C.; Dias, M.I.; Pereira, C.; et al. Development of an Optimized Drying Process for the Recovery of Bioactive Compounds from the Autumn Fruits of Berberis vulgaris L. and Crataegus monogyna Jacq. Antioxidants 2021, 10, 1579. [Google Scholar] [CrossRef]
  25. Cicco, N.; Lanorte, M.T.; Paraggio, M.; Viggiano, M.; Lattanzio, V. A Reproducible, Rapid and Inexpensive Folin-Ciocalteu Micro-Method in Determining Phenolics of Plant Methanol Extracts. Microchem. J. 2009, 91, 107–110. [Google Scholar] [CrossRef]
  26. Council of Europe. European Pharmacopoeia, 2nd ed.; Council of Europe: Strasbourg, France, 2019; ISBN 92-871-8505-0. [Google Scholar]
  27. Bondet, V.; Brand-Williams, W.; Berset, C. Kinetics and Mechanisms of Antioxidant Activity Using the DPPH.Free Radical Method. LWT-Food Sci. Technol. 1997, 30, 609–615. [Google Scholar] [CrossRef]
  28. Nisca, A.; Ștefănescu, R.; Stegăruș, D.I.; Mare, A.D.; Farczadi, L.; Tanase, C. Comparative Study Regarding the Chemical Composition and Biological Activity of Pine (Pinus nigra and P. sylvestris) Bark Extracts. Antioxidants 2021, 10, 327. [Google Scholar] [CrossRef]
  29. Re, R.; Pellegrini, N.; Proteggente, A.; Pannala, A.; Yang, M.; Rice-Evans, C. Antioxidant Activity Applying an Improved ABTS Radical Cation Decolorization Assay. Free Radic. Biol. Med. 1999, 26, 1231–1237. [Google Scholar] [CrossRef]
  30. Tănase, C.; Coşarcă, S.; Toma, F.; Mare, A.; Man, A.; Miklos, A.; Imre, S.; Boz, I. Antibacterial Activities of Beech Bark (Fagus sylvatica, L.) Polyphenolic Extract. Environ. Engin. Manag. J. 2018, 17, 877–884. [Google Scholar] [CrossRef]
  31. Vera Candioti, L.; De Zan, M.M.; Cámara, M.S.; Goicoechea, H.C. Experimental Design and Multiple Response Optimization. Using the Desirability Function in Analytical Methods Development. Talanta 2014, 124, 123–138. [Google Scholar] [CrossRef] [PubMed]
  32. Anderson, M.J.; Whitcomb, P.J. RSM Simplified: Optimizing Processes Using Response Surface Methods for Design of Experiments; Productivity Press: New York, NY, USA, 2016; ISBN 1315382326. [Google Scholar]
  33. Delgado-Moreno, L.; Peña, A.; Mingorance, M.D. Design of Experiments in Environmental Chemistry Studies: Example of the Extraction of Triazines from Soil after Olive Cake Amendment. J. Hazard. Mater. 2009, 162, 1121–1128. [Google Scholar] [CrossRef]
  34. Moldovan, C.; Babotă, M.; Mocan, A.; Menghini, L.; Cesa, S.; Gavan, A.; Sisea, C.; Vodnar, D.C.; Dias, M.I.; Pereira, C.; et al. Optimization of the Drying Process of Autumn Fruits Rich in Antioxidants: A Study Focusing on Rosehip (Rosa canina L.) and Sea Buckthorn (Elaeagnus rhamnoides (L.) A. Nelson) and Their Bioactive Properties. Food Funct. 2021, 12, 3939–3953. [Google Scholar] [CrossRef]
  35. Moreira, M.M.; Barroso, M.F.; Boeykens, A.; Withouck, H.; Morais, S.; Delerue-Matos, C. Valorization of Apple Tree Wood Residues by Polyphenols Extraction: Comparison between Conventional and Microwave-Assisted Extraction. Ind. Crops Prod. 2017, 104, 210–220. [Google Scholar] [CrossRef] [Green Version]
  36. Bouras, M.; Chadni, M.; Barba, F.J.; Grimi, N.; Bals, O.; Vorobiev, E. Optimization of Microwave-Assisted Extraction of Polyphenols from Quercus Bark. Ind. Crops Prod. 2015, 77, 590–601. [Google Scholar] [CrossRef]
  37. Mohamed, S.A.; Awad, M.A.; Al-Qurashi, A.D. Antioxidant Activity, Antioxidant Compounds, Antioxidant and Hydrolytic Enzymes Activities of ‘Barhee’ Dates at Harvest and during Storage as Affected by Pre-Harvest Spray of Some Growth Regulators. Sci. Hortic. 2014, 167, 91–99. [Google Scholar] [CrossRef]
  38. Floegel, A.; Kim, D.-O.; Chung, S.-J.; Koo, S.I.; Chun, O.K. Comparison of ABTS/DPPH Assays to Measure Antioxidant Capacity in Popular Antioxidant-Rich US Foods. J. Food Compos. Anal. 2011, 24, 1043–1048. [Google Scholar] [CrossRef]
  39. Semwal, P.; Painuli, S.; Badoni, H.; Bacheti, R.K. Screening of Phytoconstituents and Antibacterial Activity of Leaves and Bark of Quercus leucotrichophora A. Camus from Uttarakhand Himalaya. Clin. Phytosci. 2018, 4, 30. [Google Scholar] [CrossRef]
  40. Valencia-Avilés, E.; Martínez-Flores, H.-E.; García-Pérez, M.; Meléndez-Herrera, E.; García-Pérez, M.-E. Investigation of the Antibacterial Activity and Subacute Toxicity of a Quercus crassifolia Polyphenolic Bark Extract for Its Potential Use in Functional Foods. J. Food Sci. 2019, 84, 1692–1702. [Google Scholar] [CrossRef]
Figure 1. Summary of fit for DoE model.
Plants 11 00240 g001
Figure 2. Scaled and centered coefficient plot.
Plants 11 00240 g002
Figure 3. Design space for EtOH 70% extract (a) and water extract (b).
Plants 11 00240 g003
Figure 4. Logarithmic curves of antioxidant activity of QC extracts (n = 3).
Plants 11 00240 g004
Table 1. Experimental parameters set by DoE for the optimization of the extraction method.
Exp NoExp NameRun OrderPower (W)Time (min)
1N11120010
2N213100010
3N32100010
4N4450010
5N51020030
6N612100030
7N73100030
8N8150030
9N91420020
10N109100020
11N11650020
12N12750020
13N13850020
14N14550020
Table 2. Total polyphenolic content (TPC), total tannin content (TTC), and antioxidant activity.
SampleTPC (mg GAE/g d.w.)IC50 DPPH
(µg/mL)
IC50 ABTS
(µg/mL)
TTC (%)
QCA382.26 ± 0.97 a2.446 ± 0.24 a6.211 ± 0.5149.14 ± 1.36 a
QCE403.73 ± 7.35 b6.92 ± 0.39 b6.19 ± 0.3545.68 ± 1.75 a
Note: d.w.—dry weight. Different superscript letters (a, b) in the same column mean statistically significant differences at p < 0.05. QCA—Q. cerris aqueous bark extracts; QCE—Q. cerris ethanolic bark extracts.
Table 3. Antibacterial activity (MIC in mg/mL) of the Q. cerris bark extracts.
Bacterial StrainMIC (mg/mL)
QCAQCE
Gram-positive bacteria
Staphylococcus aureus ATCC 259230.6250.625
Methicillin-resistant Staphylococcus
aureus ATCC 43300
1.250.625
Gram-negative bacteria
Escherichia coli ATCC 25922>52.5
Klebsiella pneumoniae ATCC 138831.251.25
Pseudomonas aeruginosa ATCC 27853>55
QCA—Q. cerris aqueous bark extracts; QCE—Q. cerris ethanolic bark extracts.
Publisher’s Note: MDPI stays neutral with regard to jurisdictional claims in published maps and institutional affiliations.

