
Carbon-11 Radiotracing Reveals Physiological and Metabolic Responses of Maize Grown under Different Regimes of Boron Treatment

 , and
, and
Abstract
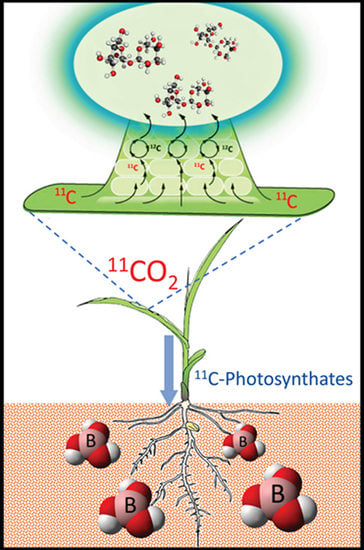
1. Introduction
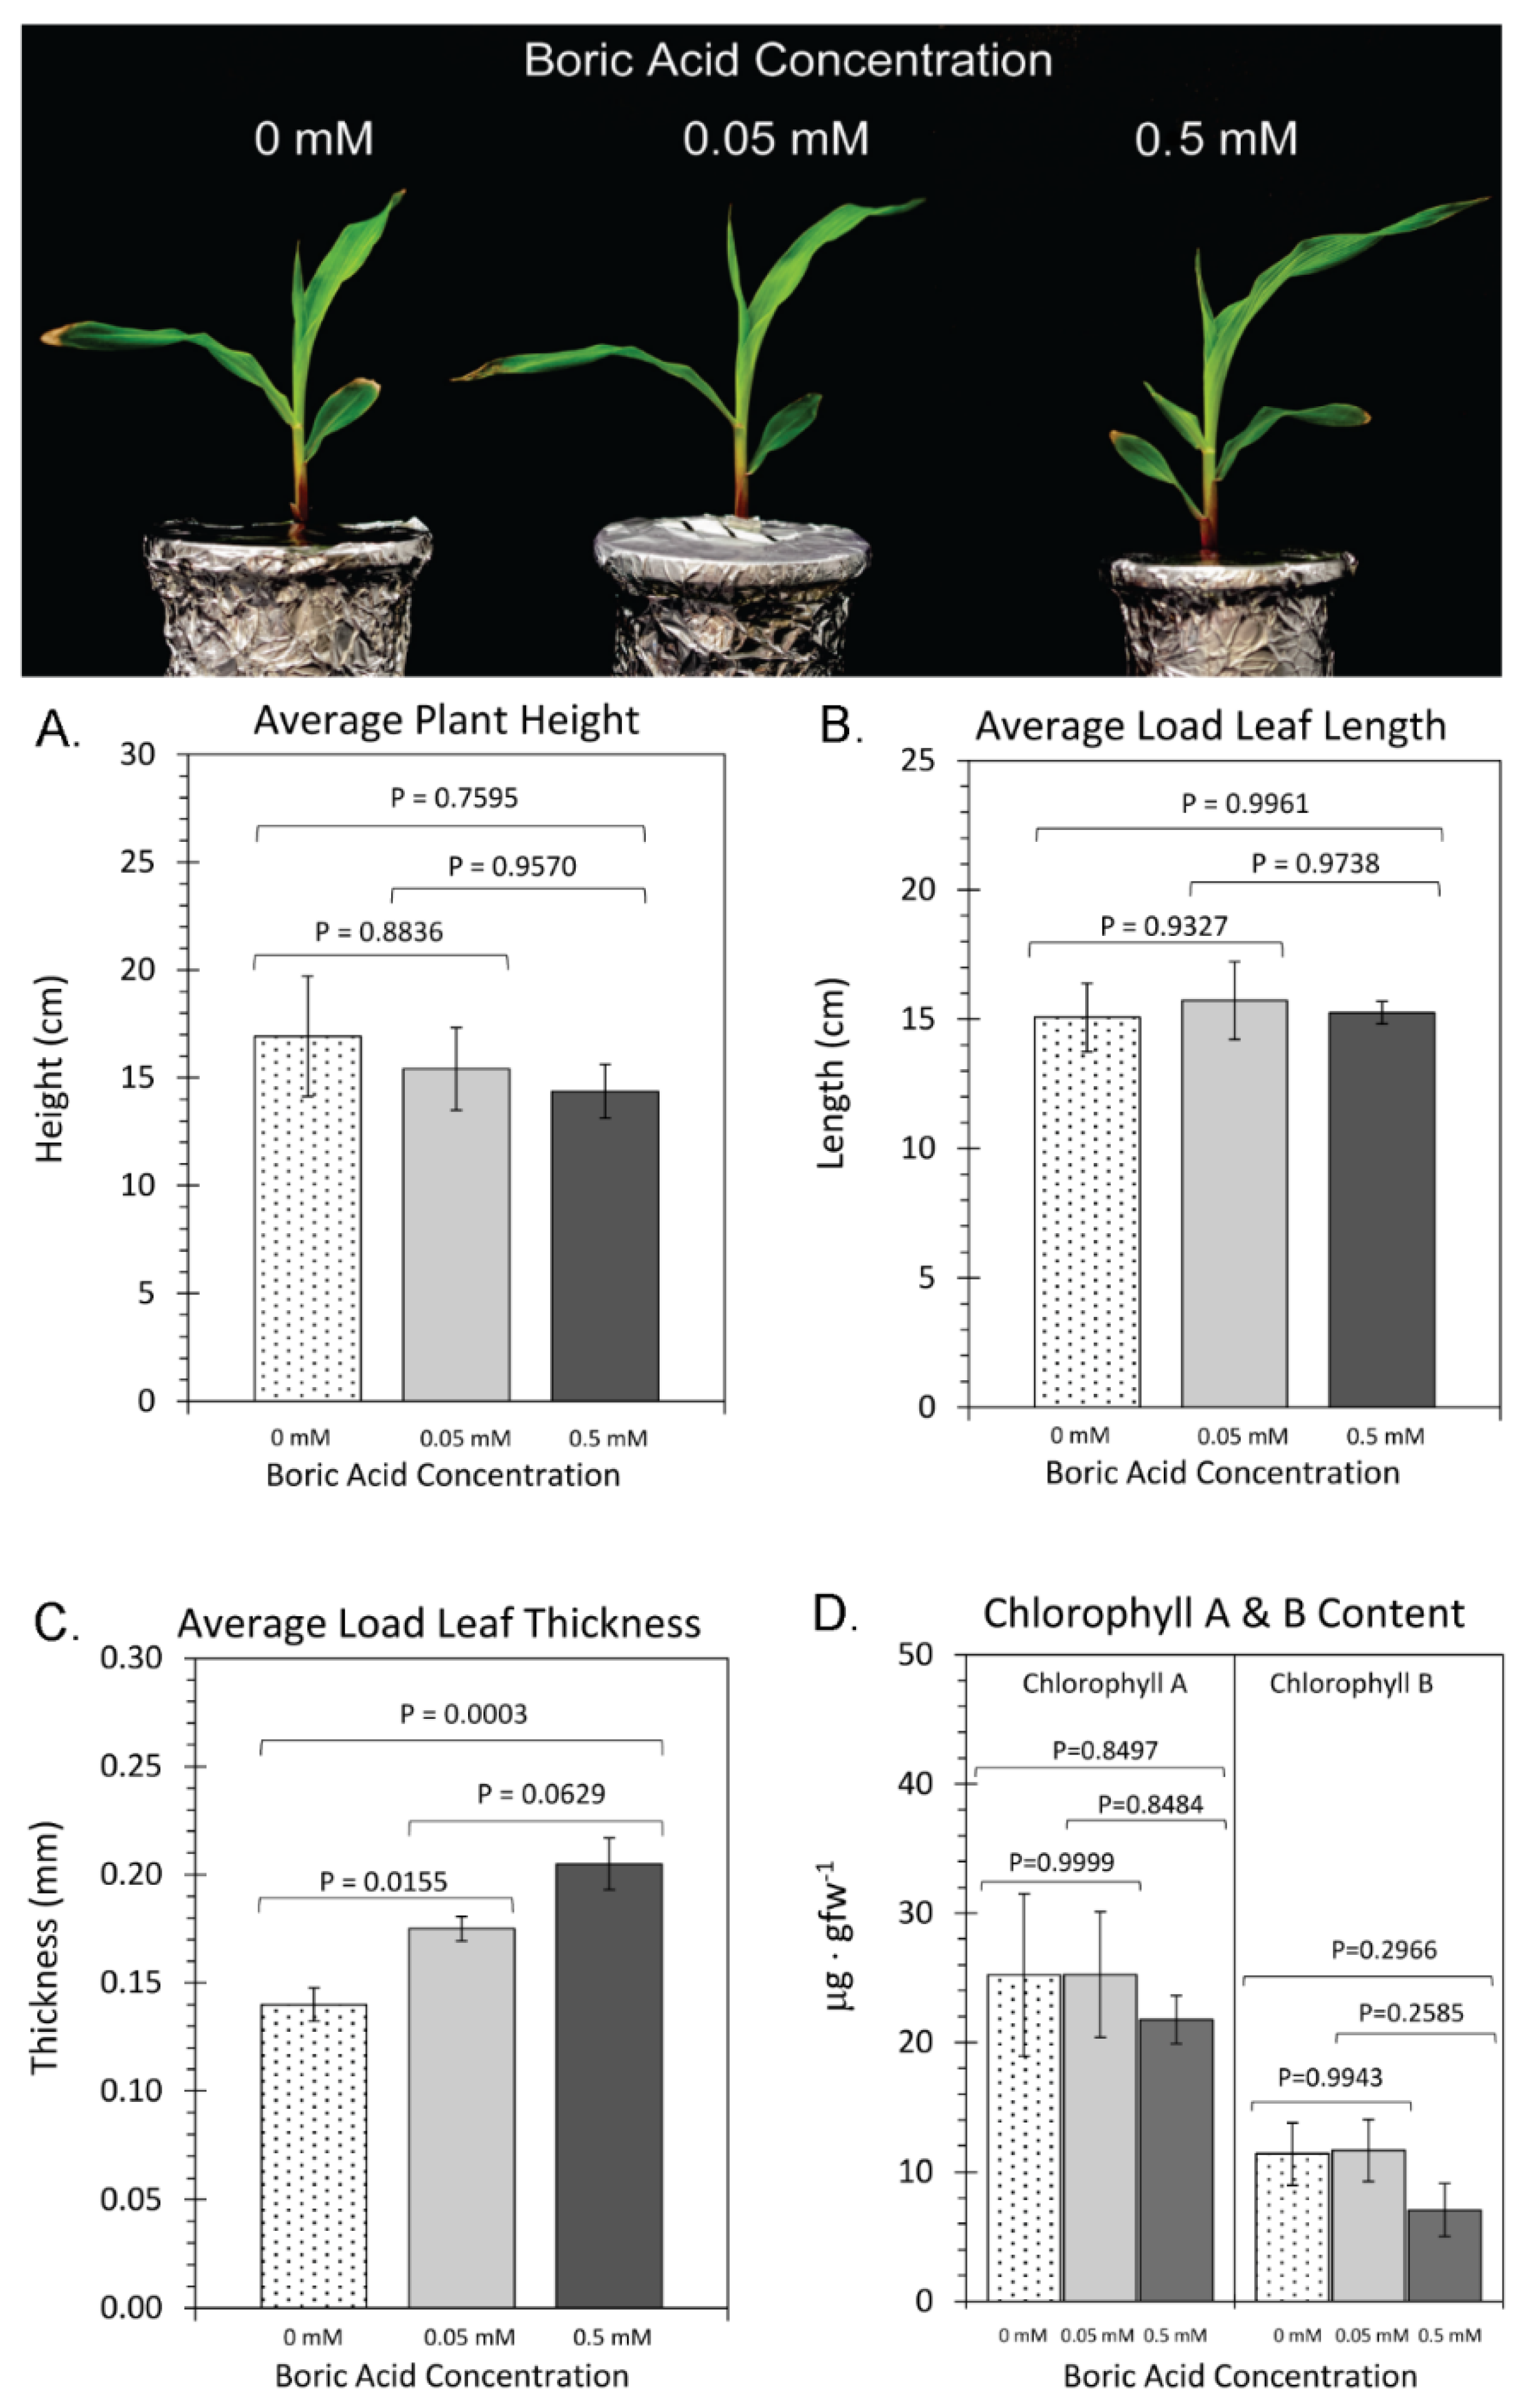
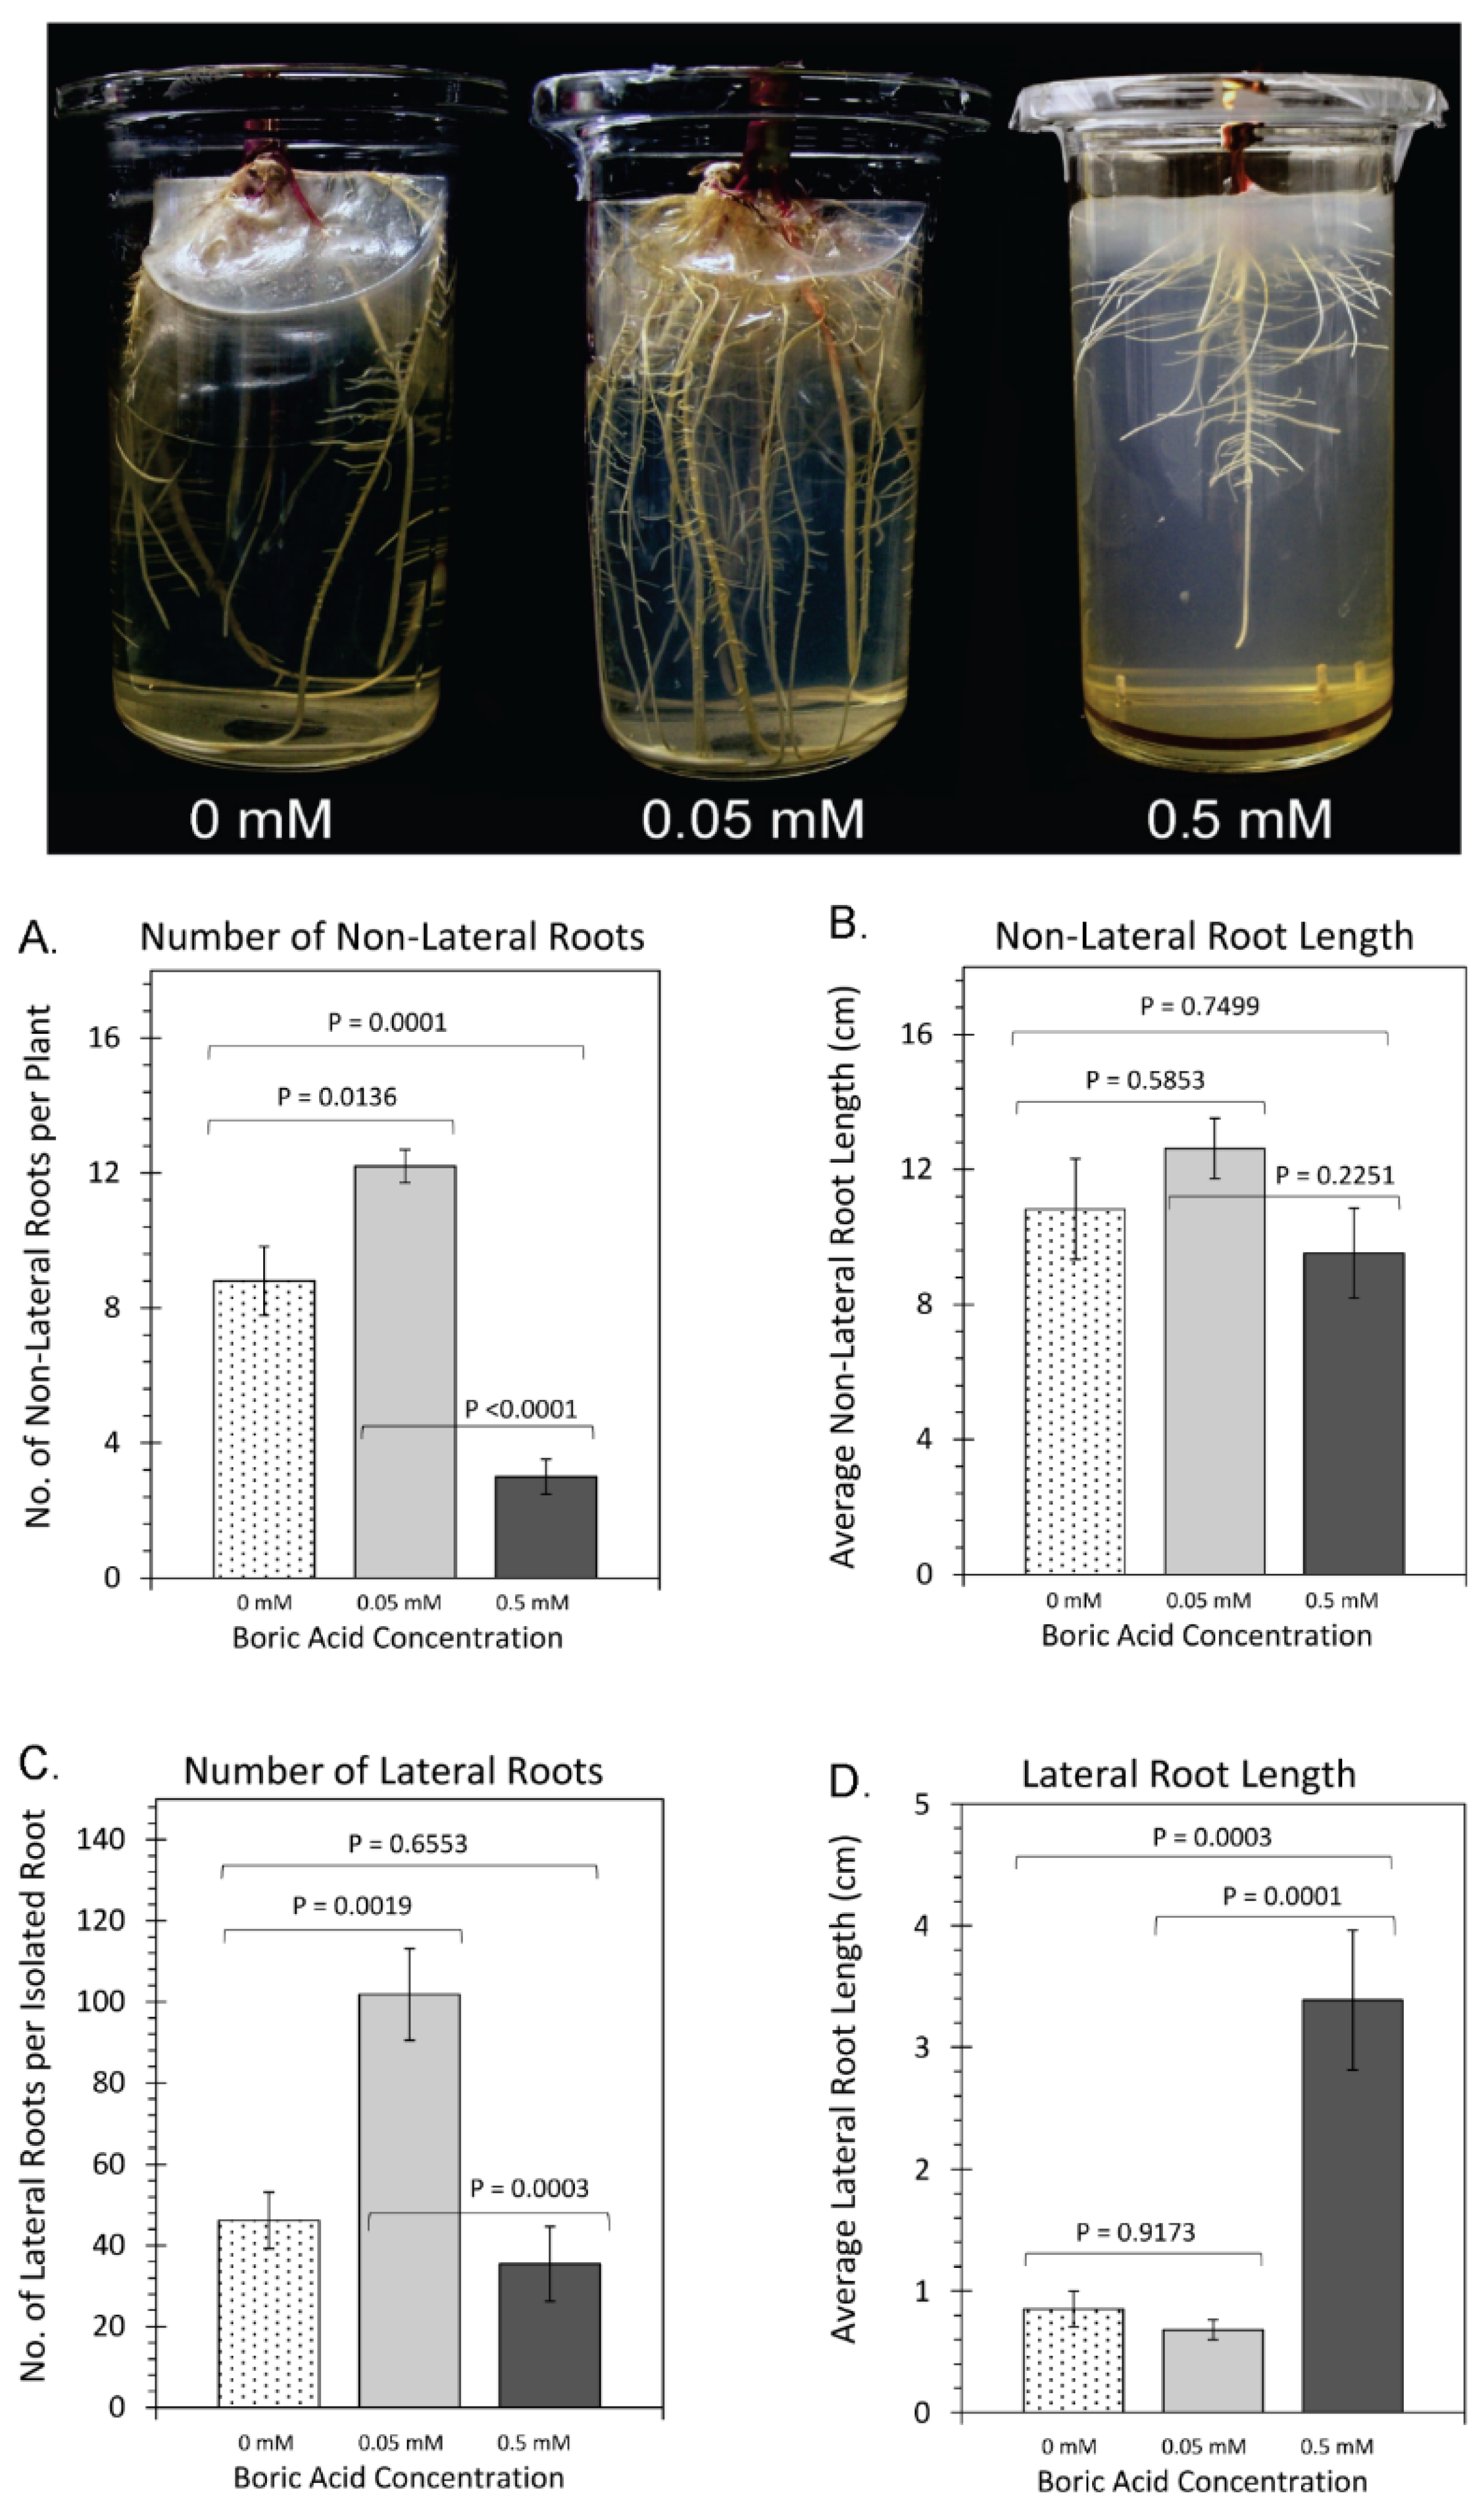
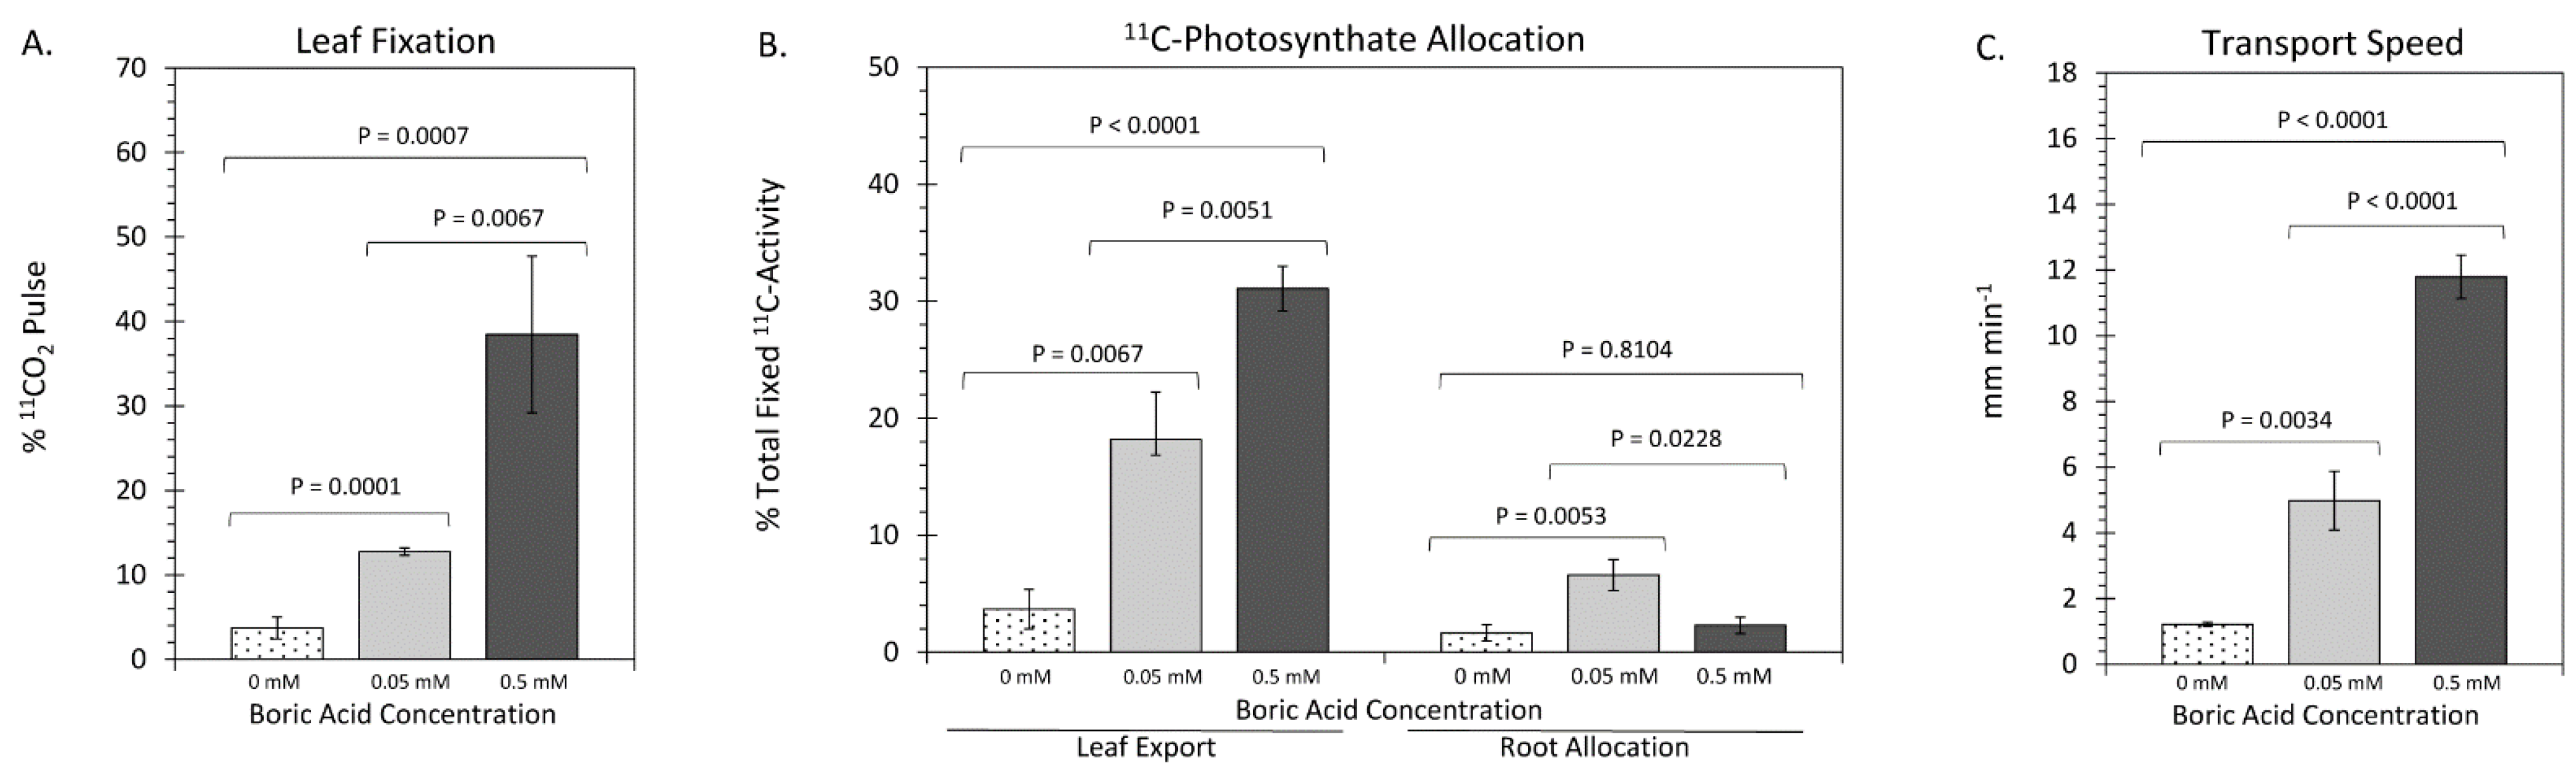
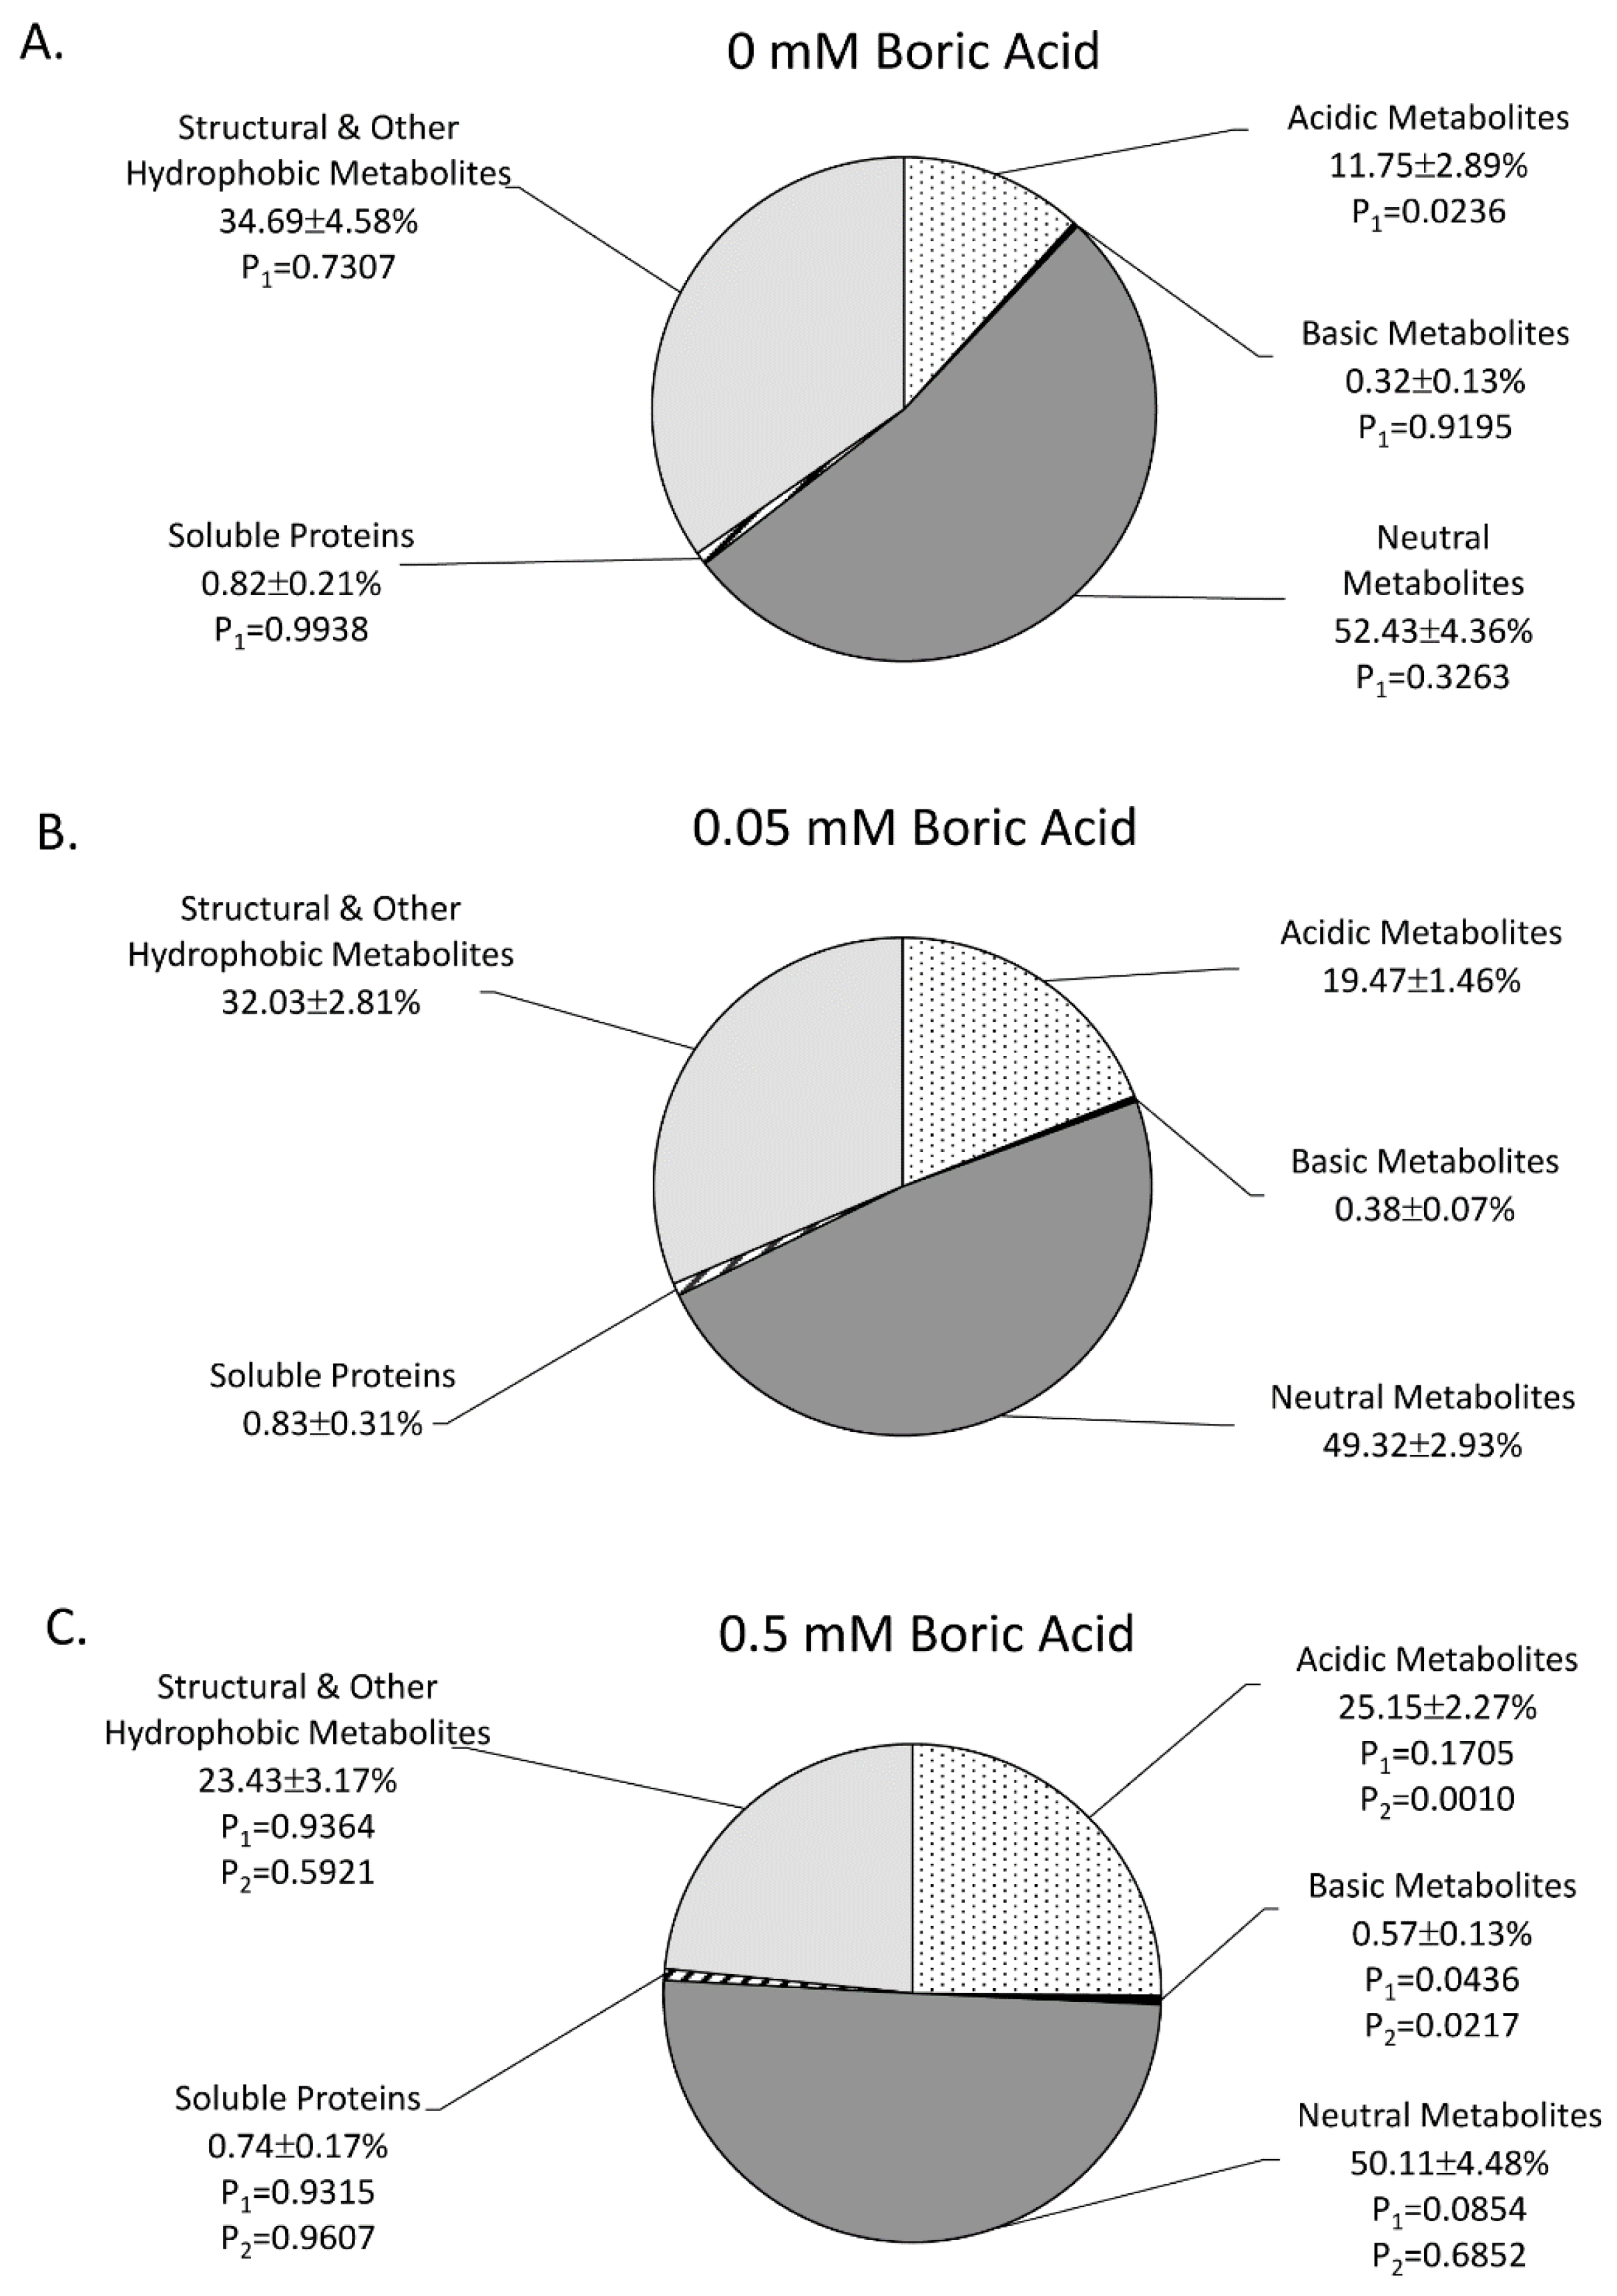
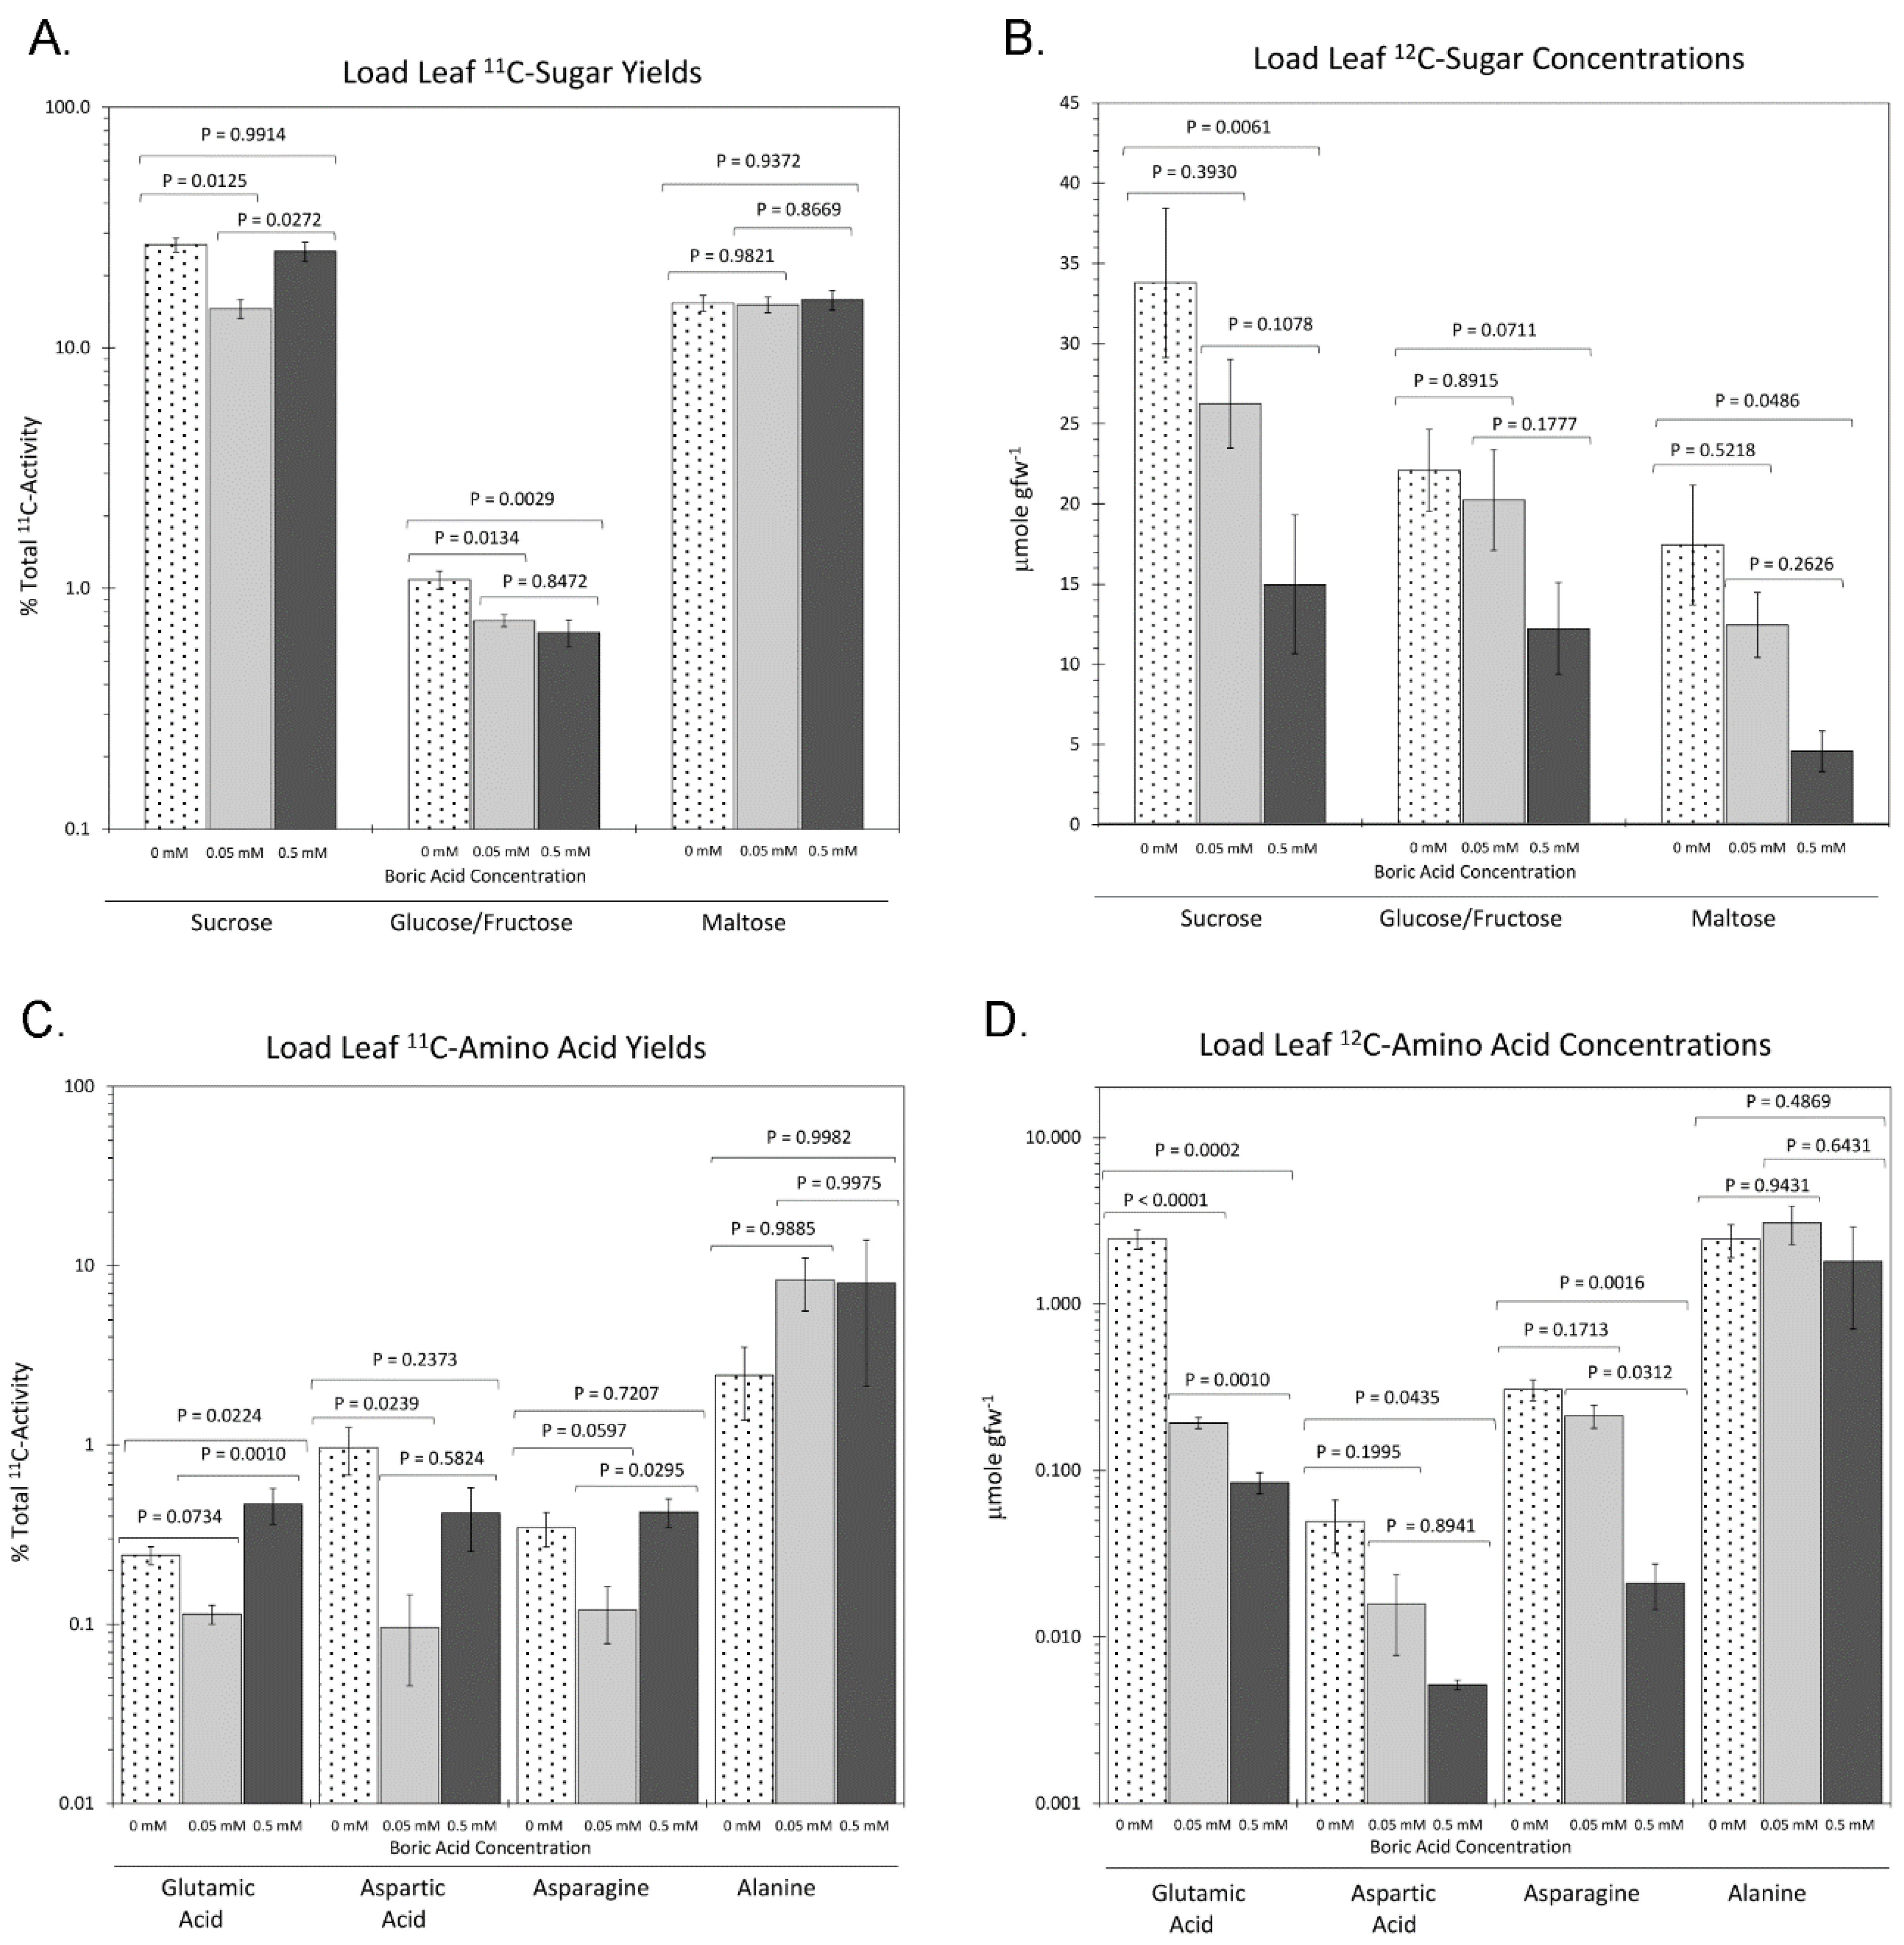
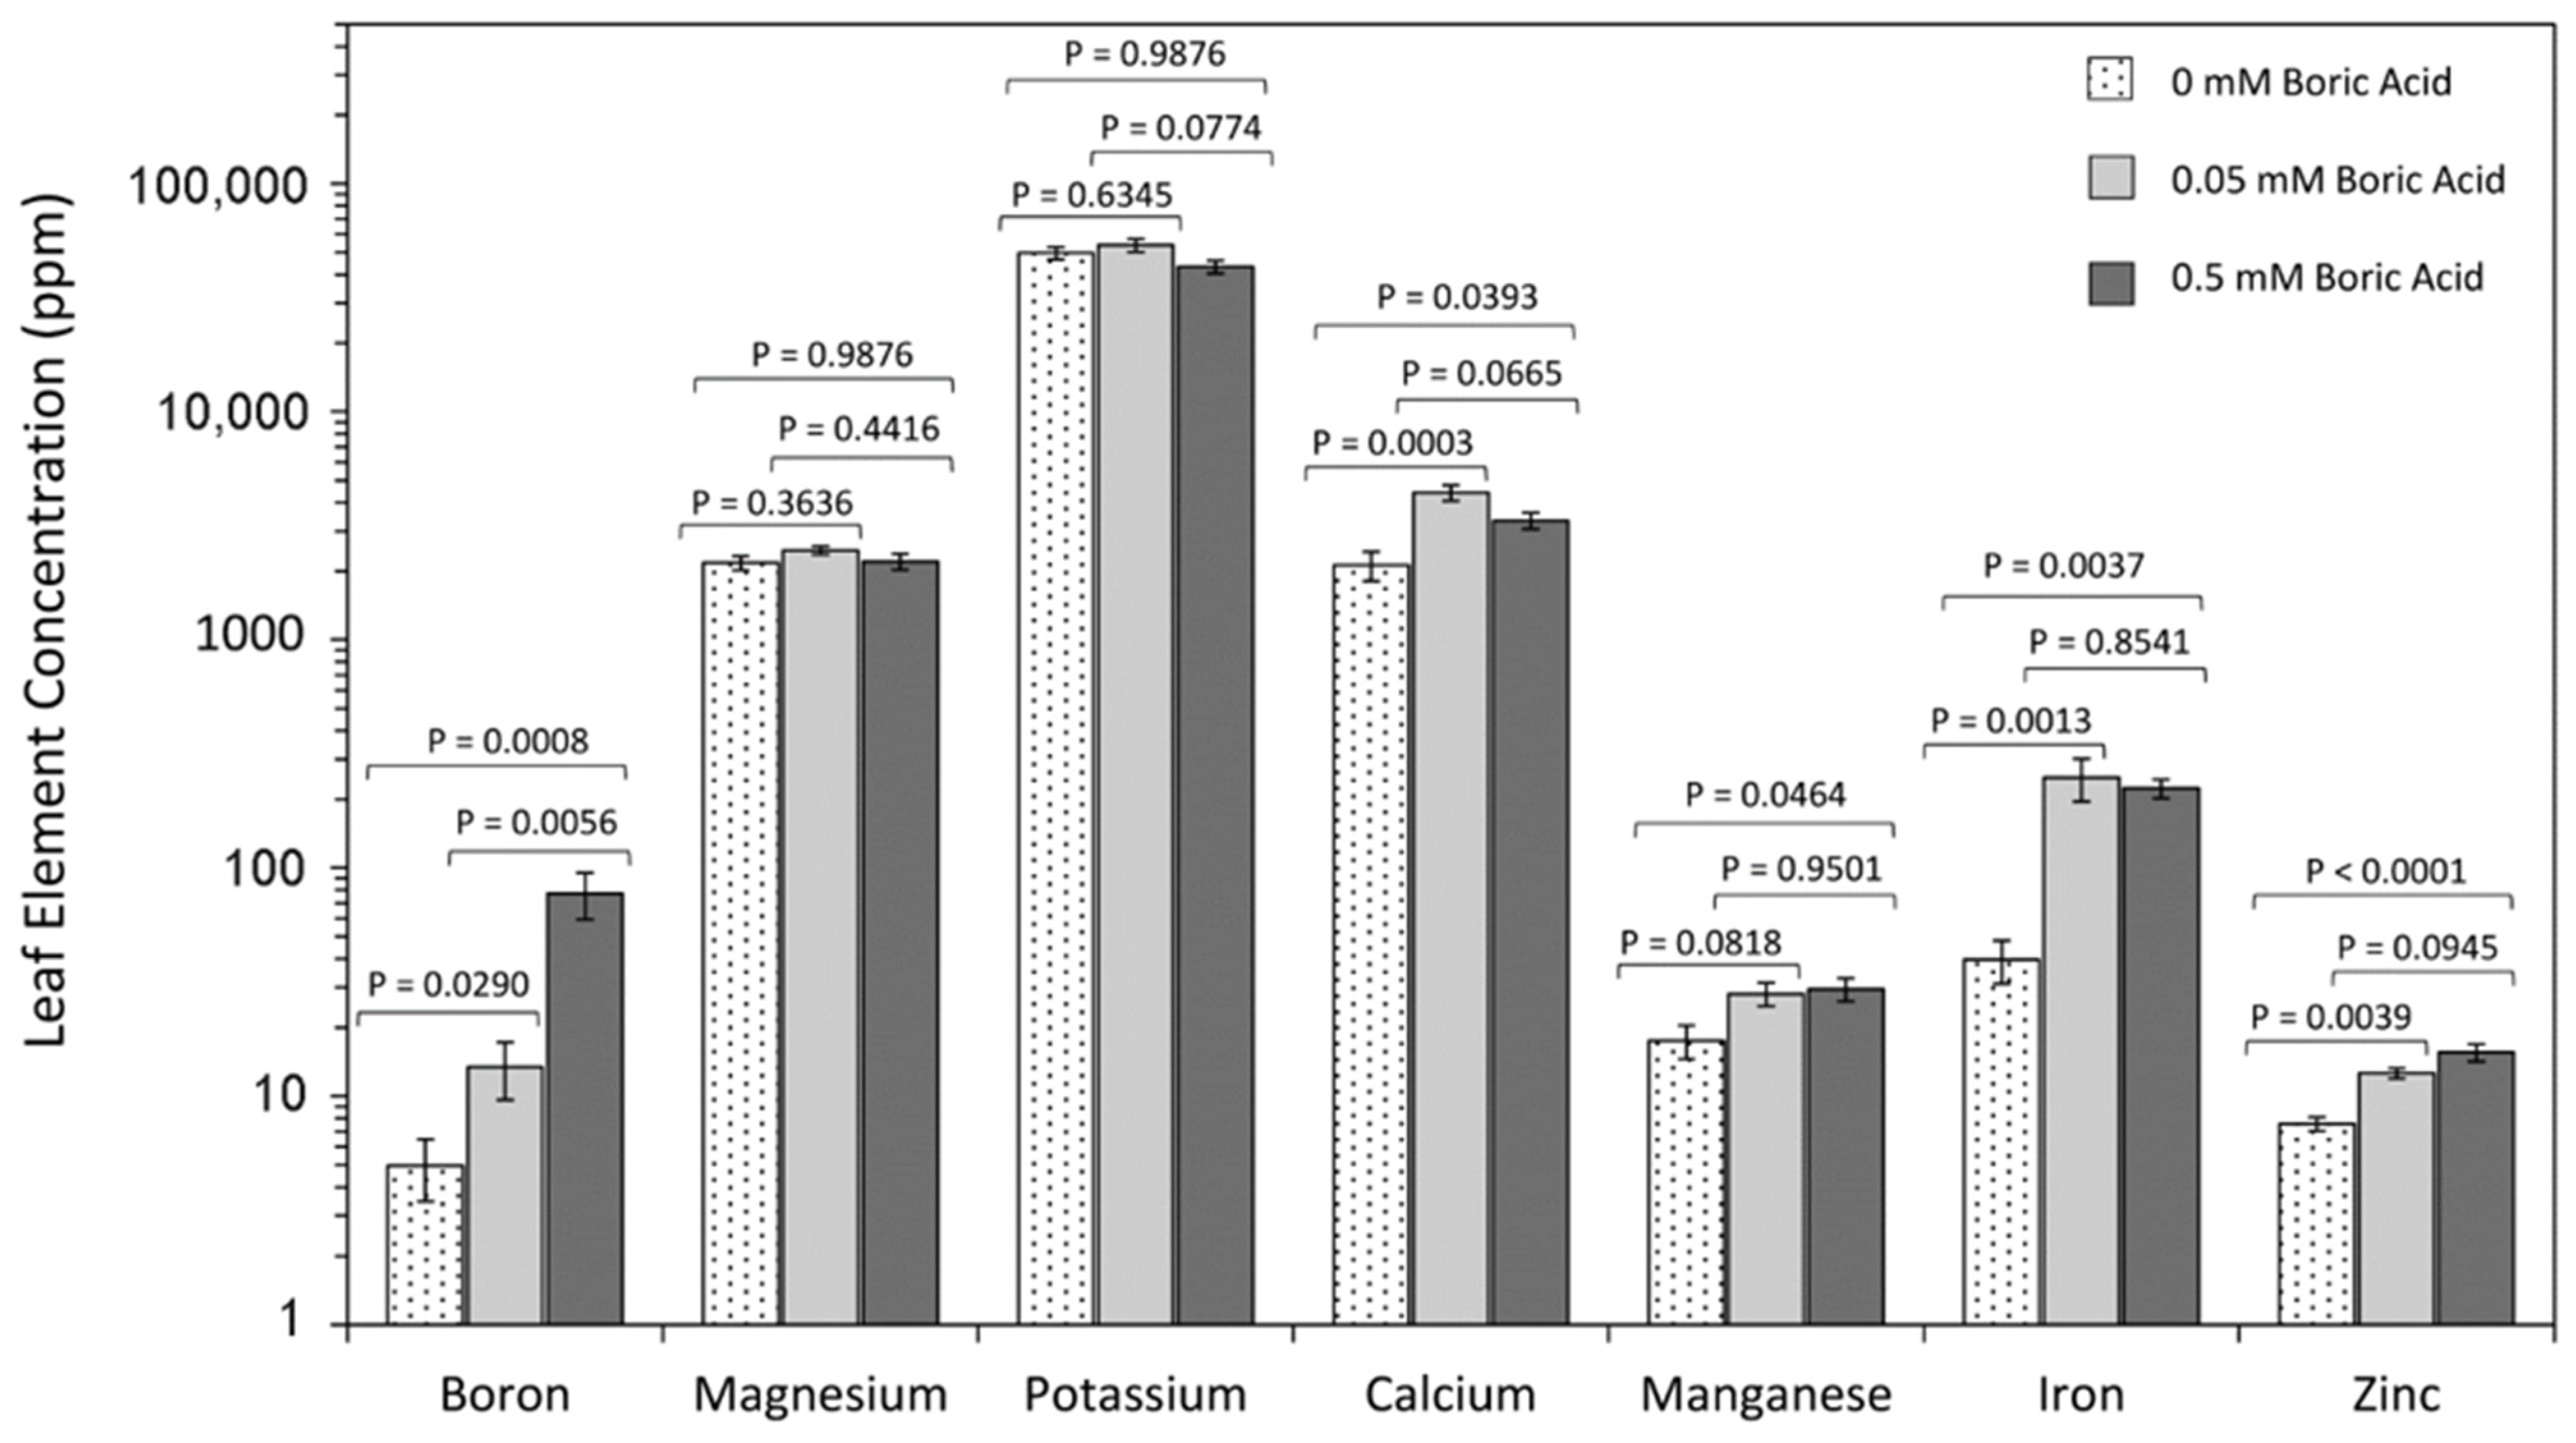
2. Results
3. Discussion
4. Materials and Methods
5. Conclusions
Supplementary Materials
Author Contributions
Funding
Data Availability Statement
Conflicts of Interest
References
- Warrington, K. The effect of boric acid and borax on the broad bean and certain other plants. Ann. Bot. 1923, 37, 457–466. [Google Scholar] [CrossRef]
- Shorrocks, V.M. The occurrence and correction of boron deficiency. Plant Soil 1997, 193, 121–148. [Google Scholar] [CrossRef]
- Blevins, D.G.; Lukaszewski, K.M. Boron in plant structure and function. Annu. Rev. Plant Biol. 1998, 49, 481–500. [Google Scholar] [CrossRef]
- Brown, P.H.; Bellaloui, N.; Wimmer, M.A.; Bassil, E.S.; Ruiz, J.; Hu, H.; Pffefer, H.; Dannel, F.; Romheld, V. Boron in plant biology. Plant Biol. 2002, 4, 205–223. [Google Scholar] [CrossRef]
- Wimmer, M.A.; Eichert, T. Review: Mechanisms for boron deficiency-mediated changes in plant water relations. Plant Sci. 2013, 203–204, 25–32. [Google Scholar] [CrossRef] [PubMed]
- Loomis, W.D.; Durst, R.W. Chemistry and biology of boron. Biofactors 1992, 3, 229–239. [Google Scholar]
- Goldberg, S. Reactions of boron with soils. Plant Soil 1997, 193, 35–48. [Google Scholar] [CrossRef]
- Eaton, F.M. Deficiency, toxicity and accumulation of boron in plants. J. Agric. Res. 1944, 69, 237–277. [Google Scholar]
- Nable, R.O.; Bañuelos, G.S.; Paul, J.G. Boron toxicity. Plant Soil 1997, 193, 181–198. [Google Scholar] [CrossRef]
- Sommer, A.L.; Sorokin, H. Effects of the absence of boron and of some other essential elements on the cell and tissue structure of the root tips of Pisum sativum. Plant Physiol. 1928, 3, 237–260. [Google Scholar] [CrossRef]
- Durbak, A.R.; Phillips, K.A.; Pike, S.; O’Neill, M.A.; Mares, J.; Gallavotti, A.; Malcomber, S.T.; Gassmann, W.; McSteen, P. Transport of boron by the tassel-less1 aquaporin is critical for vegetative and reproductive development in maize. Plant Cell 2014, 26, 2978–2995. [Google Scholar] [CrossRef] [PubMed]
- Poza-Viejo, L.; Abreu, I.; González-García, M.P.; Allauca, P.; Bonilla, I.; Bolaños, L.; Reguera, M. Boron deficiency inhibits root growth by controlling meristem activity under cytokinin regulation. Plant Sci. 2018, 270, 176–189. [Google Scholar] [CrossRef]
- Camacho-Cristóbal, J.J.; Martín-Rejano, E.M.; Herrera-Rodríguez, M.B.; Navarro-Gochicoa, M.T.; Rexach, J.; González-Fontes, A. Boron deficiency inhibits root cell elongation via an ethylene/auxin/ROS-dependent pathway in Arabidopsis seedlings. J. Exp. Bot. 2015, 66, 3831–3840. [Google Scholar] [CrossRef]
- Martín-Rejano, E.M.; Camacho-Cristóbal, J.J.; Herrera-Rodríguez, M.B.; Rexach, J.; Navarro-Gochicoa, M.T.; González-Fontes, A. Auxin and ethylene are involved in the responses of root system architecture to low boron supply in Arabidopsis seedlings. Physiol. Plant. 2011, 142, 170–178. [Google Scholar] [CrossRef]
- Gómez-Soto, D.; Galván, S.; Rosales, E.; Bienert, P.; Abreu, I.; Bonilla, I.; Bolaños, L.; Reguera, M. Insights into the role of phytohormones regulating pAtNIP5;1 activity and boron transport in Arabidopsis thaliana. Plant Sci. 2019, 287, 110198. [Google Scholar] [CrossRef] [PubMed]
- Housh, A.B.; Matthes, M.S.; Gerheart, A.; Wilder, S.L.; Kil, K.E.; Schueller, M.; Guthrie, J.M.; McSteen, P.; Ferrieri, R. Assessment of a 18F-phenylboronic acid radiotracer for imaging boron in maize. Int. J. Mol. Sci. 2020, 21, 976. [Google Scholar] [CrossRef]
- Matthes, M.S.; Robil, J.M.; McSteen, P. From element to development: The power of the essential micronutrient boron to shape morphological processes in plants. J. Exp. Bot. 2020, 71, 1681–1693. [Google Scholar] [CrossRef] [PubMed]
- Reid, R.J.; Hayes, J.E.; Post, A.; Stangoulis, J.C.R.; Graham, R.D. A critical analysis of the causes of boron toxicity in plants. Plant Cell Environ. 2004, 27, 1405–1414. [Google Scholar] [CrossRef]
- Choi, E.Y.; Kolesik, P.; McNeill, A.; Collins, H.; Zhang, Q.; Huynh, B.L.; Graham, R.; Stangoulis, J. The mechanism of boron tolerance for maintenance of root growth in barley (Hordeum vulgare L.). Plant Cell Environ. 2007, 30, 984–993. [Google Scholar] [CrossRef]
- Aquea, F.; Federici, F.; Moscoso, C.; Vega, A.; Jullian, P.; Haseloff, J.; Arce-Johnson, P. A molecular framework for the inhibition of Arabidopsis root growth in response to boron toxicity. Plant Cell Environ. 2012, 35, 719–734. [Google Scholar] [CrossRef]
- Esim, N.; Tiryaki, D.; Karadagoglu, O.; Atici, O. Toxic effects of boron on growth and antioxidant system parameters of maize (Zea mays L.) roots. Toxicol. Ind. Health 2013, 29, 800–805. [Google Scholar] [CrossRef] [PubMed]
- Lovatt, C.J.; Bates, L.M. Early effects of excess boron on photosynthesis and growth of Cucurbita pepo. J. Exp. Bot. 1984, 35, 297–305. [Google Scholar] [CrossRef]
- Marschner, H. Mineral Nutrition of Higher Plants, 3rd ed.; Marschner, P., Ed.; Elsevier: Amsterdam, The Netherlands, 2012. [Google Scholar]
- Brown, P.H.; Shelp, B.J. Boron mobility in plants. Plant Soil 1997, 193, 85–101. [Google Scholar] [CrossRef]
- Kohl, H.C.; Oertli, J.J. Distribution of boron in leaves. Plant Physiol. 1961, 36, 420–424. [Google Scholar] [CrossRef]
- Goldbach, H.E.; Wimmer, M.A. Boron in plants and animals: Is there a role beyond cell-wall structure? J. Plant Nutr. Soil Sci. 2007, 170, 39–48. [Google Scholar] [CrossRef]
- Camacho-Cristóbal, J.J.; Rexach, J.; Herrera-Rodríguez, M.B.; Navarro-Gochicoa, M.T.; González-Fontes, A. Boron deficiency and transcript level changes. Plant Sci. 2011, 181, 85–89. [Google Scholar] [CrossRef]
- Kobayashi, M.; Matoh, T.; Azuma, J.I. Two chains of rhamnogalacturonan II are cross-linked by borate-diol ester bonds in higher plant cell walls. Plant Physiol. 1996, 110, 1017–1020. [Google Scholar] [CrossRef]
- Matoh, T.; Kawaguchi, S.; Kobayashi, M. Ubiquity of a borate-rhamnogalacturonan II complex in the cell walls of higher plants. Plant Cell Physiol. 1996, 37, 636–640. [Google Scholar] [CrossRef]
- O’Neill, M.A.; Warrenfeltz, D.; Kates, K.; Pellerin, P.; Doco, T.; Darvill, A.G.; Albersheim, P. Rhamnogalacturonan-II, a pectic polysaccharide in the walls of growing plant cell, forms a dimer that is covalently cross-linked by a borate ester. In vitro conditions for the formation and hydrolysis of the dimer. J. Biol. Chem. 1996, 271, 22923–22930. [Google Scholar] [CrossRef]
- Hu, H.; Brown, P.H.; Labavitch, J.M. Species variability in boron requirement is correlated with cell wall pectin. J. Exp. Bot. 1996, 47, 227–232. [Google Scholar] [CrossRef]
- Hochholdinger, F.; Yu, P.; Marcon, C. Genetic Control of Root System Development in Maize. Trends Plant Sci. 2018, 23, 79–88. [Google Scholar] [CrossRef] [PubMed]
- Eltinge, E. Effect of boron deficiency upon the structure of Zea mays. Plant Physiol. 1936, 11, 765–778. [Google Scholar] [CrossRef]
- Lordkaew, S.; Dell, B.; Jamjod, S.; Rerkasem, B. Boron deficiency in maize. Plant Soil 2011, 342, 207–220. [Google Scholar] [CrossRef]
- Chatterjee, M.; Liu, Q.; Menello, C.; Galli, M.; Gallavotti, A. The combined action of duplicated boron transporters is required for maize growth in boron-deficient conditions. Genetics 2017, 206, 2041–2051. [Google Scholar] [CrossRef]
- Chatterjee, M.; Tabi, Z.; Galli, M.; Malcomber, S.; Buck, A.; Muszynski, M.; Gallavotti, A. The boron efflux transporter ROTTEN EAR is required for maize inflorescence development and fertility. Plant Cell 2014, 26, 2962–2977. [Google Scholar] [CrossRef]
- Leonard, A.; Holloway, B.; Guo, M.; Rupe, M.; Yu, G.; Beatty, M.; Zastrow-Hayes, G.; Meeley, R.; Llaca, V.; Butler, K.; et al. Tassel-less1 encodes a boron channel protein required for inflorescence development in maize. Plant Cell Physiol. 2014, 55, 1044–1054. [Google Scholar] [CrossRef]
- Kaya, C.; Akram, N.A.; Ashraf, M. Kinetin and Indole Acetic Acid Promote Antioxidant Defense System and Reduce Oxidative Stress in Maize (Zea mays L.) Plants Grown at Boron Toxicity. J. Plant Growth Regul. 2018, 37, 1258–1266. [Google Scholar] [CrossRef]
- Fuertes-Mendizábal, T.; Bastías, E.I.; González-Murua, C.; González-Moro, M.B. Nitrogen assimilation in the highly salt-and boron-tolerant ecotype Zea mays L. Amylacea. Plants 2020, 9, 322. [Google Scholar] [CrossRef]
- Sakcali, S.M.; Kekec, G.; Uzonur, I.; Alpsoy, L.; Tombuloglu, H. Randomly amplified polymorphic-DNA analysis for detecting genotoxic effectsof Boron on maize (Zea mays L.). Toxicol. Ind. Health 2015, 31, 712–720. [Google Scholar] [CrossRef]
- Matthes, M.S.; Robil, J.M.; Tran, T.; Kimble, A.; McSteen, P. Increased transpiration is correlated with reduced boron deficiency symptoms in the maize tassel-less1 mutant. Physiol. Plant. 2018, 163, 344–355. [Google Scholar] [CrossRef] [PubMed]
- Cakmak, I.; Römheld, V. Boron deficiency-induced impairments of cellular functions in plants. Plant Soil 1997, 193, 71–83. [Google Scholar] [CrossRef]
- Landi, M.; Margaritopoulou, T.; Papadakis, I.E.; Araniti, F. Boron toxicity in higher plants: An update. Planta 2019, 250, 1011–1032. [Google Scholar] [CrossRef]
- Bolaños, L.; Lukaszewski, K.; Bonilla, I.; Blevins, D. Why boron? Plant Physiol. Biochem. 2004, 42, 907–912. [Google Scholar] [CrossRef] [PubMed]
- Dordas, C.; Brown, P.H. Boron deficiency affects cell viability, phenolic leakage and oxidative burst in rose cell cultures. Plant Soil 2005, 268, 293–301. [Google Scholar] [CrossRef]
- Beato, V.M.; Rexach, J.; Navarro-Gochicoa, M.T.; Camacho-Cristóbal, J.J.; Herrera-Rodríguez, M.B.; Maldonado, J.M.; González-Fontes, A. A tobacco asparagine synthetase gene responds to carbon and nitrogen status and its root expression is affected under boron stress. Plant Sci. 2010, 178, 289–298. [Google Scholar] [CrossRef]
- Ruuhola, T.; Keinänen, M.; Keski-Saari, S.; Lehto, T. Boron nutrition affects the carbon metabolism of silver birch seedlings. Tree Physiol. 2011, 31, 1251–1261. [Google Scholar] [CrossRef]
- Wang, G.; DiTusa, S.F.; Oh, D.H.; Herrmann, A.D.; Mendoza-Cozatl, D.G.; O’Neill, M.A.; Smith, A.P.; Dassanayake, M. Cross species multi-omics reveals cell wall sequestration and elevated global transcript abundance as mechanisms of boron tolerance in plants. New Phytol. 2021, 230, 1985–2000. [Google Scholar] [CrossRef]
- Lu, Z.; Ren, T.; Li, J.; Hu, W.; Zhang, J.; Yan, J.; Li, X.; Cong, R.; Guo, S.; Lu, J. Nutrition-mediated cell and tissue-level anatomy triggers the covariation of leaf photosynthesis and leaf mass per area. J. Exp. Bot. 2020, 71, 6524–6537. [Google Scholar] [CrossRef]
- Kastori, R.; Plesnicar, M.; Pankovic, D.; Sakac, Z. Photosynthesis, chlorophyll fluorescence and soluble carbohydrates in sunflower leaves as affected by boron deficiency. J. Plant Nutr. 1995, 18, 1751–1763. [Google Scholar] [CrossRef]
- Li, M.; Zhao, Z.; Zhang, Z.; Zhang, W.; Zhou, J.; Xu, F.; Liu, X. Effect of boron deficiency on anatomical structure and chemical composition of petioles and photosynthesis of leaves in cotton (Gossypium hirsutum L.). Sci. Rep. 2017, 7, 4420. [Google Scholar] [CrossRef] [PubMed]
- Han, S.; Chen, L.S.; Jiang, H.X.; Smith, B.R.; Yang, L.T.; Xie, C.Y. Boron deficiency decreases growth and photosynthesis, and increases starch and hexoses in leaves of citrus seedlings. J. Plant Physiol. 2008, 165, 1331–1341. [Google Scholar] [CrossRef]
- Lu, Y.B.; Yang, L.T.; Li, Y.; Xu, J.; Liao, T.T.; Chen, Y.B.; Chen, L.S. Effects of boron deficiency on major metabolites, key enzymes and gas exchange in leaves and roots of Citrus sinensis seedlings. Tree Physiol. 2014, 34, 608–618. [Google Scholar] [CrossRef]
- Mishra, S.; Heckathorn, S.; Frantz, J.; Yu, F.; Gray, J. Effects of boron deficiency on geranium grown under different nonphotoinhibitory light levels. J. Am. Soc. Hortic. Sci. 2009, 134, 183–193. [Google Scholar] [CrossRef]
- Chen, M.; Mishra, S.; Heckathorn, S.A.; Frantz, J.M.; Krause, C. Proteomic analysis of Arabidopsis thaliana leaves in response to acute boron deficiency and toxicity reveals effects on photosynthesis, carbohydrate metabolism, and protein synthesis. J. Plant Physiol. 2014, 171, 235–242. [Google Scholar] [CrossRef] [PubMed]
- Shah, A.; Wu, X.; Ullah, A.; Fahad, S.; Muhammad, R.; Yan, L.; Jiang, C. Deficiency and toxicity of boron: Alterations in growth, oxidative damage and uptake by citrange orange plants. Ecotoxicol. Environ. Saf. 2017, 145, 575–582. [Google Scholar] [CrossRef] [PubMed]
- Liakopoulos, G.; Stavrianakou, S.; Filippou, M.; Fasseas, C.; Tsadilas, C.; Drossopoulos, I.; Karabourniotis, G. Boron remobilization at low boron supply in olive (Olea europaea) in relation to leaf and phloem mannitol concentrations. Tree Physiol. 2005, 25, 157–165. [Google Scholar] [CrossRef]
- Zhao, D.; Oosterhuis, D.M. Cotton carbon exchange, nonstructural carbohydrates, and boron distribution in tissues during development of boron deficiency. Field Crops Res. 2002, 78, 75–87. [Google Scholar] [CrossRef]
- Camacho-Cristóbal, J.J.; Lunar, L.; Lafont, F.; Baumert, A.; González-Fontes, A. Boron deficiency causes accumulation of chlorogenic acid and caffeoyl polyamine conjugates in tobacco leaves. J. Plant Physiol. 2004, 161, 879–881. [Google Scholar] [CrossRef]
- Dong, X.; Liu, G.; Wu, X.; Lu, X.; Yan, L.; Muhammad, R.; Shah, A.; Wu, L.; Jiang, C. Different metabolite profile and metabolic pathway with leaves and roots in response to boron deficiency at the initial stage of citrus rootstock growth. Plant Physiol. Biochem. 2016, 108, 121–131. [Google Scholar] [CrossRef] [PubMed]
- Yang, L.T.; Qi, Y.P.; Lu, Y.B.; Guo, P.; Sang, W.; Feng, H.; Zhang, H.X.; Chen, L.S. ITRAQ protein profile analysis of Citrus sinensis roots in response to long-term boron-deficiency. J. Proteom. 2013, 93, 179–206. [Google Scholar] [CrossRef]
- Camacho-Cristóbal, J.J.; González-Fontes, A. Boron deficiency decreases plasmalemma H+-ATPase expression and nitrate uptake, and promotes ammonium assimilation into asparagine in tobacco roots. Planta 2007, 226, 443–451. [Google Scholar] [CrossRef] [PubMed]
- Lukaszewski, K.M.; Blevins, D.G. Root growth inhibition in boron-deficient or aluminum-stressed squash may be a result of impaired ascorbate metabolism. Plant Physiol. 1996, 112, 1135–1140. [Google Scholar] [CrossRef] [PubMed]
- Han, S.; Tang, N.; Jiang, H.X.; Yang, L.T.; Li, Y.; Chen, L.S. CO2 assimilation, photosystem II photochemistry, carbohydrate metabolism and antioxidant system of citrus leaves in response to boron stress. Plant Sci. 2009, 176, 143–153. [Google Scholar] [CrossRef]
- Housh, A.B.; Benoit, M.; Wilder, S.L.; Scott, S.; Powell, G.; Schueller, M.J.; Ferrieri, R.A. Plant-growth-promoting bacteria can impact zinc uptake in Zea mays: An examination of the mechanisms of action using functional mutants of azospirillum brasilense. Microorganisms 2021, 9, 1002. [Google Scholar] [CrossRef]
- Wang, X.; Brockman, J.D.; Guthrie, J.M.; Lever, S.Z. Analysis and imaging of boron distribution in maize by quantitative neutron capture radiography. Appl. Radiat. Isot. 2018, 140, 252–261. [Google Scholar] [CrossRef]
- Mills, H.A.; Jones, J.B. Plant Analysis Handbook II: A Practical Sampling, Preparation, Analysis, and Interpretation Guide; Micro Macro Intl.: Athens, GA, USA, 1996. [Google Scholar]
- Peng, L.; Shi, L.; Cai, H.; Xu, F.; Zeng, C. Transcriptional profiling reveals adaptive responses to boron deficiency stress in Arabidopsis. Z. Fur Nat.-Sect. C J. Biosci. 2012, 67, 510–524. [Google Scholar] [CrossRef]
- Brdar-Jokanović, M. Boron toxicity and deficiency in agricultural plants. Int. J. Mol. Sci. 2020, 21, 1424. [Google Scholar] [CrossRef]
- Nable, R.O. Resistance to boron toxicity amongst several barley and wheat cultivars: A preliminary examination of the resistance mechanism. Plant Soil 1988, 112, 45–52. [Google Scholar] [CrossRef]
- Roessner, U.; Patterson, J.H.; Forbes, M.G.; Fincher, G.B.; Langridge, P.; Bacic, A. An investigation of boron toxicity in Barley using metabolomics. Plant Physiol. 2006, 142, 1087–1101. [Google Scholar] [CrossRef] [PubMed]
- Josten, P.; Kutschera, U. The micronutrient boron causes the development of adventitious roots in sunflower cuttings. Ann. Bot. 1999, 84, 337–342. [Google Scholar] [CrossRef]
- González-Fontes, A.; Herrera-Rodríguez, M.B.; Martín-Rejano, E.M.; Navarro-Gochicoa, M.T.; Rexach, J.; Camacho-Cristóbal, J.J. Root responses to boron deficiency mediated by ethylene. Front. Plant Sci. 2016, 6, 1103. [Google Scholar] [CrossRef]
- Kelling, K.A. Soil and Applied Boron. Underst. Plant Nutr. 1999, A2522. Available online: http://corn.agronomy.wisc.edu/Management/pdfs/a2522.pdf (accessed on 16 November 2021).
- Günes, A.; Alpaslan, M. Boron uptake and toxicity in maize genotypes in relation to boron and phosphorus supply. J. Plant Nutr. 2000, 23, 541–550. [Google Scholar] [CrossRef]
- El-Sheikh, A.M.; Ulrich, A.; Awad, S.K.; Mawardy, A.E. Boron tolerance of squash. melon, cucumber, and corn. J. Am. Soc. Hortic. Sci. 1971, 96, 536–537. [Google Scholar]
- Tewari, R.K.; Kumar, P.; Sharma, P.N. Morphology and oxidative physiology of boron-deficient mulberry plants. Tree Physiol. 2010, 30, 68–77. [Google Scholar] [CrossRef] [PubMed]
- Price, C.A. Molecular Approaches to Plant Physiology; McGraw Hill: New York, NY, USA, 1970. [Google Scholar]
- Haga, K.; Iino, M. Auxin-growth relationships in maize coleoptiles and pea internodes and control by auxin of the tissue sensitivity to auxin. Plant Physiol. 1998, 117, 1473–1486. [Google Scholar] [CrossRef] [PubMed][Green Version]
- Ahmed, A.M.H.; Khalil, M.K.; Abd Ei-Rahman, A.M.; Nadia, A.M.H. Effect of zinc, tryptophan and indole acetic acid on growth, yield and chemical composition of Valencia orange trees. J. Appl. Sci. Res. 2012, 8, 901–914. [Google Scholar]
- McSteen, P. Auxin and monocot development. Cold Spring Harb. Perspect. Biol. 2010, 2, a001479. [Google Scholar] [CrossRef]
- Singh, M. Effect of zinc, phosphorus and nitrogen on tryptophan concentration in rice grains grown on limed and unlimed soils. Plant Soil 1981, 62, 305–308. [Google Scholar] [CrossRef]
- Camacho-Cristóbal, J.J.; González-Fontes, A. Boron deficiency causes a drastic decrease in nitrate content and nitrate reductase activity, and increases the content of carbohydrates in leaves from tobacco plants. Planta 1999, 209, 528–536. [Google Scholar] [CrossRef]
- Koshiba, T.; Kobayashi, M.; Ishihara, A.; Matoh, T. Boron nutrition of cultured Tobacco BY-2 Cells. VI. calcium is involved in early responses to Boron deprivation. Plant Cell Physiol. 2010, 51, 323–327. [Google Scholar] [CrossRef] [PubMed]
- Quiles-Pando, C.; Navarro-Gochicoa, M.T.; Herrera-Rodríguez, M.B.; Camacho-Cristóbal, J.J.; González-Fontes, A.; Rexach, J. Boron deficiency increases cytosolic Ca2+ levels mainly via Ca2+ influx from the apoplast in arabidopsis thaliana roots. Int. J. Mol. Sci. 2019, 20, 2297. [Google Scholar] [CrossRef]
- Quiles-Pando, C.; Rexach, J.; Navarro-Gochicoa, M.T.; Camacho-Cristóbal, J.J.; Herrera-Rodríguez, M.B.; González-Fontes, A. Boron deficiency increases the levels of cytosolic Ca2+ and expression of Ca2+-related genes in Arabidopsis thaliana roots. Plant Physiol. Biochem. 2013, 65, 55–60. [Google Scholar] [CrossRef]
- Fang, K.F.; Du, B.S.; Zhang, Q.; Xing, Y.; Cao, Q.Q.; Qin, L. Boron deficiency alters cytosolic Ca2+ concentration and affects the cell wall components of pollen tubes in Malus domestica. Plant Biol. 2019, 21, 343–351. [Google Scholar] [CrossRef]
- Wang, N.; Yang, C.; Pan, Z.; Liu, Y.; Peng, S. Boron deficiency in woody plants: Various responses and tolerance mechanisms. Front. Plant Sci. 2015, 6, 916. [Google Scholar] [CrossRef]
- Shireen, F.; Nawaz, M.A.; Chen, C.; Zhang, Q.; Zheng, Z.; Sohail, H.; Sun, J.; Cao, H.; Huang, Y.; Bie, Z. Boron: Functions and approaches to enhance its availability in plants for sustainable agriculture. Int. J. Mol. Sci. 2018, 19, 1856. [Google Scholar] [CrossRef]
- Sharma, P.N.; Kumar, N.; Bisht, S.S. Effect of zinc deficiency on chlorophyll content, photosynthesis and water relations of cauliflower plants. Photosynthetica 1994, 30, 353–359. [Google Scholar]
- Ohki, K. Effect of Zinc Nutrition on Photosynthesis and Carbonic Anhydrase Activity in Cotton. Physiol. Plant. 1976, 38, 300–304. [Google Scholar] [CrossRef]
- Rengel, Z. Carbonic Anhydrase Activity in Leaves of Wheat Genotypes Differing in Zn Efficiency. J. Plant Physiol. 1995, 147, 251–256. [Google Scholar] [CrossRef]
- Cakmak, I.; Engels, C. Role of mineral nutrients in photosynthesis and yield formation. In Mineral Nutrition in Crops; Rengel, Z., Ed.; Haworth Press: New York, NY, USA, 1999; pp. 141–168. [Google Scholar]
- Hacisalihoglu, G.; Hart, J.J.; Wang, Y.H.; Cakmak, I.; Kochian, L.V. Zinc efficiency is correlated with enhanced expression and activity of zinc-requiring enzymes in wheat. Plant Physiol. 2003, 131, 595–602. [Google Scholar] [CrossRef]
- Fischer, E.S.; Thimm, O.; Rengel, Z. Zinc nutrition influences the CO2 gas exchange in wheat. Photosynthetica 1997, 33, 505–508. [Google Scholar]
- Wang, H.; Liu, R.L.; Jin, J.Y. Effects of zinc and soil moisture on photosynthetic rate and chlorophyll fluorescence parameters of maize. Biol. Plant. 2009, 53, 191–194. [Google Scholar] [CrossRef]
- Wimmer, M.A.; Lochnit, G.; Bassil, E.; Mhling, K.H.; Goldbach, H.E. Membrane-associated, boron-interacting proteins isolated by boronate affinity chromatography. Plant Cell Physiol. 2009, 50, 1292–1304. [Google Scholar] [CrossRef]
- Voxeur, A.; Fry, S.C. Glycosylinositol phosphorylceramides from Rosa cell cultures are boron-bridged in the plasma membrane and form complexes with rhamnogalacturonan II. Plant J. 2014, 79, 139–149. [Google Scholar] [CrossRef]
- Seth, K.; Aery, N.C. Boron induced changes in biochemical constituents, enzymatic activities, and growth performance of wheat. Acta Physiol. Plant. 2017, 39, 244. [Google Scholar] [CrossRef]
- Liu, G.; Dong, X.; Liu, L.; Wu, L.; Peng, S.; Jiang, C. Metabolic profiling reveals altered pattern of central metabolism in navel orange plants as a result of boron deficiency. Physiol. Plant. 2015, 153, 513–524. [Google Scholar] [CrossRef]
- Miyashita, Y.; Good, A.G. Contribution of the GABA shunt to hypoxia-induced alanine accumulation in roots of Arabidopsis thaliana. Plant Cell Physiol. 2008, 49, 92–102. [Google Scholar] [CrossRef] [PubMed]
- Azevedo, R.A.; Lancien, M.; Lea, P.J. The aspartic acid metabolic pathway, an exciting and essential pathway in plants. Amino Acids 2006, 30, 143–162. [Google Scholar] [CrossRef]
- Alves, M.; Chicau, P.; Matias, H.; Passarinho, J.; Pinheiro, C.; Ricardo, C.P. Metabolic analysis revealed altered amino acid profiles in Lupinus albus organs as a result of boron deficiency. Physiol. Plant. 2011, 142, 224–232. [Google Scholar] [CrossRef]
- Kimball, S.R.; Jefferson, L.S. New functions for amino acids: Effects on gene transcription and translation. Am. J. Clin. Nutr. 2006, 83, 500S–507S. [Google Scholar] [CrossRef]
- Abendroth, L.J.; Elmore, R.W.; Boyer, M.J.; Marlay, S.K. Corn Growth and Development. Extension Publication #PMR-1009. Available online: https://store.extension.iastate.edu/Product/Corn-Growth-and-Development (accessed on 16 November 2021).
- Ferrieri, R.A.; Wolf, A.P. The chemistry of positron emitting nucleogenic (hot) atoms with regard to preparation of labelled compounds of practical utility. Radiochim. Acta 1983, 34, 69–84. [Google Scholar] [CrossRef]
- Ferrieri, R.A. Production and application of synthetic precursors labeled with carbon-11 and fluorine-18. In Handbook of Radiopharmaceuticals: Radiochemistry and Applications; John Wiley and Sons, Ltd.: New York, NY, USA, 2003. [Google Scholar]
- Ferrieri, R.A.; Gray, D.W.; Babst, B.A.; Schueller, M.J.; Schlyer, D.J.; Thorpe, M.R.; Orians, C.M.; Lerdau, M. Use of carbon-11 in Populus shows that exogenous jasmonic acid increases biosynthesis of isoprene from recently fixed carbon. Plant Cell Environ. 2005, 25, 591–602. [Google Scholar] [CrossRef]
- Qu, W.; Robert, C.A.M.; Erb, M.; Hibbard, B.E.; Paven, M.; Gleede, T.; Riehl, B.; Kersting, L.; Cankaya, A.S.; Kunert, A.T.; et al. Dynamic precision phenotyping reveals mechanism of crop tolerance to root herbivory. Plant Physiol. 2016, 172, 776–788. [Google Scholar] [CrossRef]
- Babst, B.A.; Karve, A.A.; Judt, T. Radio-metabolite analysis of carbon-11 biochemical partitioning to non-structural carbohydrates for integrated metabolism and transport studies. Plant Cell Physiol. 2013, 54, 1016–1025. [Google Scholar] [CrossRef] [PubMed]
- Piepho, H.P. An algorithm for a letter-based representation of all-pairwise comparisons. J. Comput. Graph. Stat. 2004, 13, 456–466. [Google Scholar] [CrossRef]


| Micronutrients | Concentration | |
|---|---|---|
| KNO3 | 6.0 mM | |
| CaCl2 | 2.0 mM | |
| KH2PO4 | 2.0 mM | |
| MgSO4 | 2.0 mM | |
| FeEDTA Solution 1 M KOH 1.04% EDTA∙2Na 0.78% FeSO4∙7H2O |  | 0.078% |
| MnCl2∙4H2O | 9.1 µM | |
| ZnSO4∙7H2O | 0.76 µM | |
| CuSO4∙5H2O | 0.32 µM | |
| NaMoO4∙2H2O | 0.50 µM | |
| H3BO3 (3 levels) | 0 mM, 0.05 mM, 0.5 mM | |
Publisher’s Note: MDPI stays neutral with regard to jurisdictional claims in published maps and institutional affiliations. |
© 2022 by the authors. Licensee MDPI, Basel, Switzerland. This article is an open access article distributed under the terms and conditions of the Creative Commons Attribution (CC BY) license (https://creativecommons.org/licenses/by/4.0/).
Share and Cite
Wilder, S.L.; Scott, S.; Waller, S.; Powell, A.; Benoit, M.; Guthrie, J.M.; Schueller, M.J.; Awale, P.; McSteen, P.; Matthes, M.S.; et al. Carbon-11 Radiotracing Reveals Physiological and Metabolic Responses of Maize Grown under Different Regimes of Boron Treatment. Plants 2022, 11, 241. https://doi.org/10.3390/plants11030241
Wilder SL, Scott S, Waller S, Powell A, Benoit M, Guthrie JM, Schueller MJ, Awale P, McSteen P, Matthes MS, et al. Carbon-11 Radiotracing Reveals Physiological and Metabolic Responses of Maize Grown under Different Regimes of Boron Treatment. Plants. 2022; 11(3):241. https://doi.org/10.3390/plants11030241
Chicago/Turabian StyleWilder, Stacy L., Stephanie Scott, Spenser Waller, Avery Powell, Mary Benoit, James M. Guthrie, Michael J. Schueller, Prameela Awale, Paula McSteen, Michaela S. Matthes, and et al. 2022. "Carbon-11 Radiotracing Reveals Physiological and Metabolic Responses of Maize Grown under Different Regimes of Boron Treatment" Plants 11, no. 3: 241. https://doi.org/10.3390/plants11030241
APA StyleWilder, S. L., Scott, S., Waller, S., Powell, A., Benoit, M., Guthrie, J. M., Schueller, M. J., Awale, P., McSteen, P., Matthes, M. S., & Ferrieri, R. A. (2022). Carbon-11 Radiotracing Reveals Physiological and Metabolic Responses of Maize Grown under Different Regimes of Boron Treatment. Plants, 11(3), 241. https://doi.org/10.3390/plants11030241