1. Introduction
In recent years, the increased demand for food as a result of the increase in the global population has led to the exploitation of greater areas of agriculture [
1]. Among the most important global problems in agricultural land use is soil erosion. It has been found that 80% of agricultural fields suffer from severe erosion impacts [
2] (Pimentel and Burgess, 2013). Sloping lands cause more than the 60% of soil erosion [
3]. The factors that can affect soil erosion can be divided into two categories: those occurring naturally and human induced. A number of studies have shown that slope gradient is the main natural factor that affects tillage erosion, and tillage erosion increases along with the increase in slope gradient [
4,
5,
6]. Soil erosion in agriculture is mainly caused by rainfall (water-induced erosion), leading to land degradation, surface runoff, and soil and nutrient loss [
7,
8].
The human factors involved in the soil erosion process are farming practices and cropping systems. Proper tillage direction can affect runoff and soil and nutrient loss. Contour tillage is a more sustainable practice in comparison to that usually expected in flat fields (in straight lines) or along-the-slope tillage. Adverse effects become more pronounced under intensive rainfall events. Contour cultivation on fields with a high incline can decrease soil erodibility, thus increasing topsoil resistance [
9]. Due to soil erosion, pollution by NPK borne onto eroded soil particles has become a major threat to surface waters. Globally, due to soil erosion, approximately 95% of phosphorus, 55% of nitrogen and up to 40% of carbon are being carried in rivers and deposited in their sediments [
10]. In Europe, 12% of agricultural fields are negatively affected by erosion caused by water and this costs the EU-27 an approximately EUR 0.7–14.0 billion [
11].
Soil erosion can cause ecological problems such as eutrophication of surface waters, lakes and reservoirs and can have severe negative impacts on the aquatic biota. Soil erosion can also lead to economical losses for farmers as well to a reduction in agricultural productivity [
11,
12,
13].
In recent years, conservation tillage has been mentioned as an effective way to reduce soil erosion and, therefore, minimize soil and nutrient loss [
14,
15]. Conservation agriculture has three main principles—no-tillage cultivation, crop rotation and the use of permanent cover crops [
16,
17].
Regardless of the above reported advantages of conservation agriculture, especially for the Mediterranean countries, very often farmers and local communities believe that a field with continuous cover crops or intercropping, as well the use of minimum or no-tillage cultivation, is a “dirty” action [
18,
19].
Farmers should be taught the benefits of sustainable agricultural management, which is necessary to avoid soil and nutrient loss as well as to improve the physical and chemical characteristics of soil [
14,
19].
Greece, in the Mediterranean, is a country with a high risk of soil and nutrient loss due to soil erosion. This is due to the many sloping cultivated fields and the climate that is characterized by warm and rainy winters and erosive rains. Intensive rains in combination with hot and dry summers have intensified the soil erosion problem [
19,
20].
Although some studies have been conducted to evaluate the influence of soil tillage systems on surface runoff, soil and nutrient transport from agricultural fields [
21,
22,
23] worldwide, not much information exists concerning Greece. Furthermore, studies that assess the effect of soil tillage (contour farming, CF, and non-CF) on the surface runoff are also rare.
Additionally, only a few studies have been conducted regarding the effects of a rotation system with legume–cereal and sunflower on runoff, soil, nutrient loss and plant biomass.
For that reason, the aim of this work was to study the effect of tillage (conventional and no tillage), planting direction (parallel and perpendicular to the contours), and vegetation cover (with or without crops of autumn and spring cultivations) on the runoff, soil loss, nutrient loss (recorded with Olsen P and exchangeable K) and plant total biomass.
2. Results
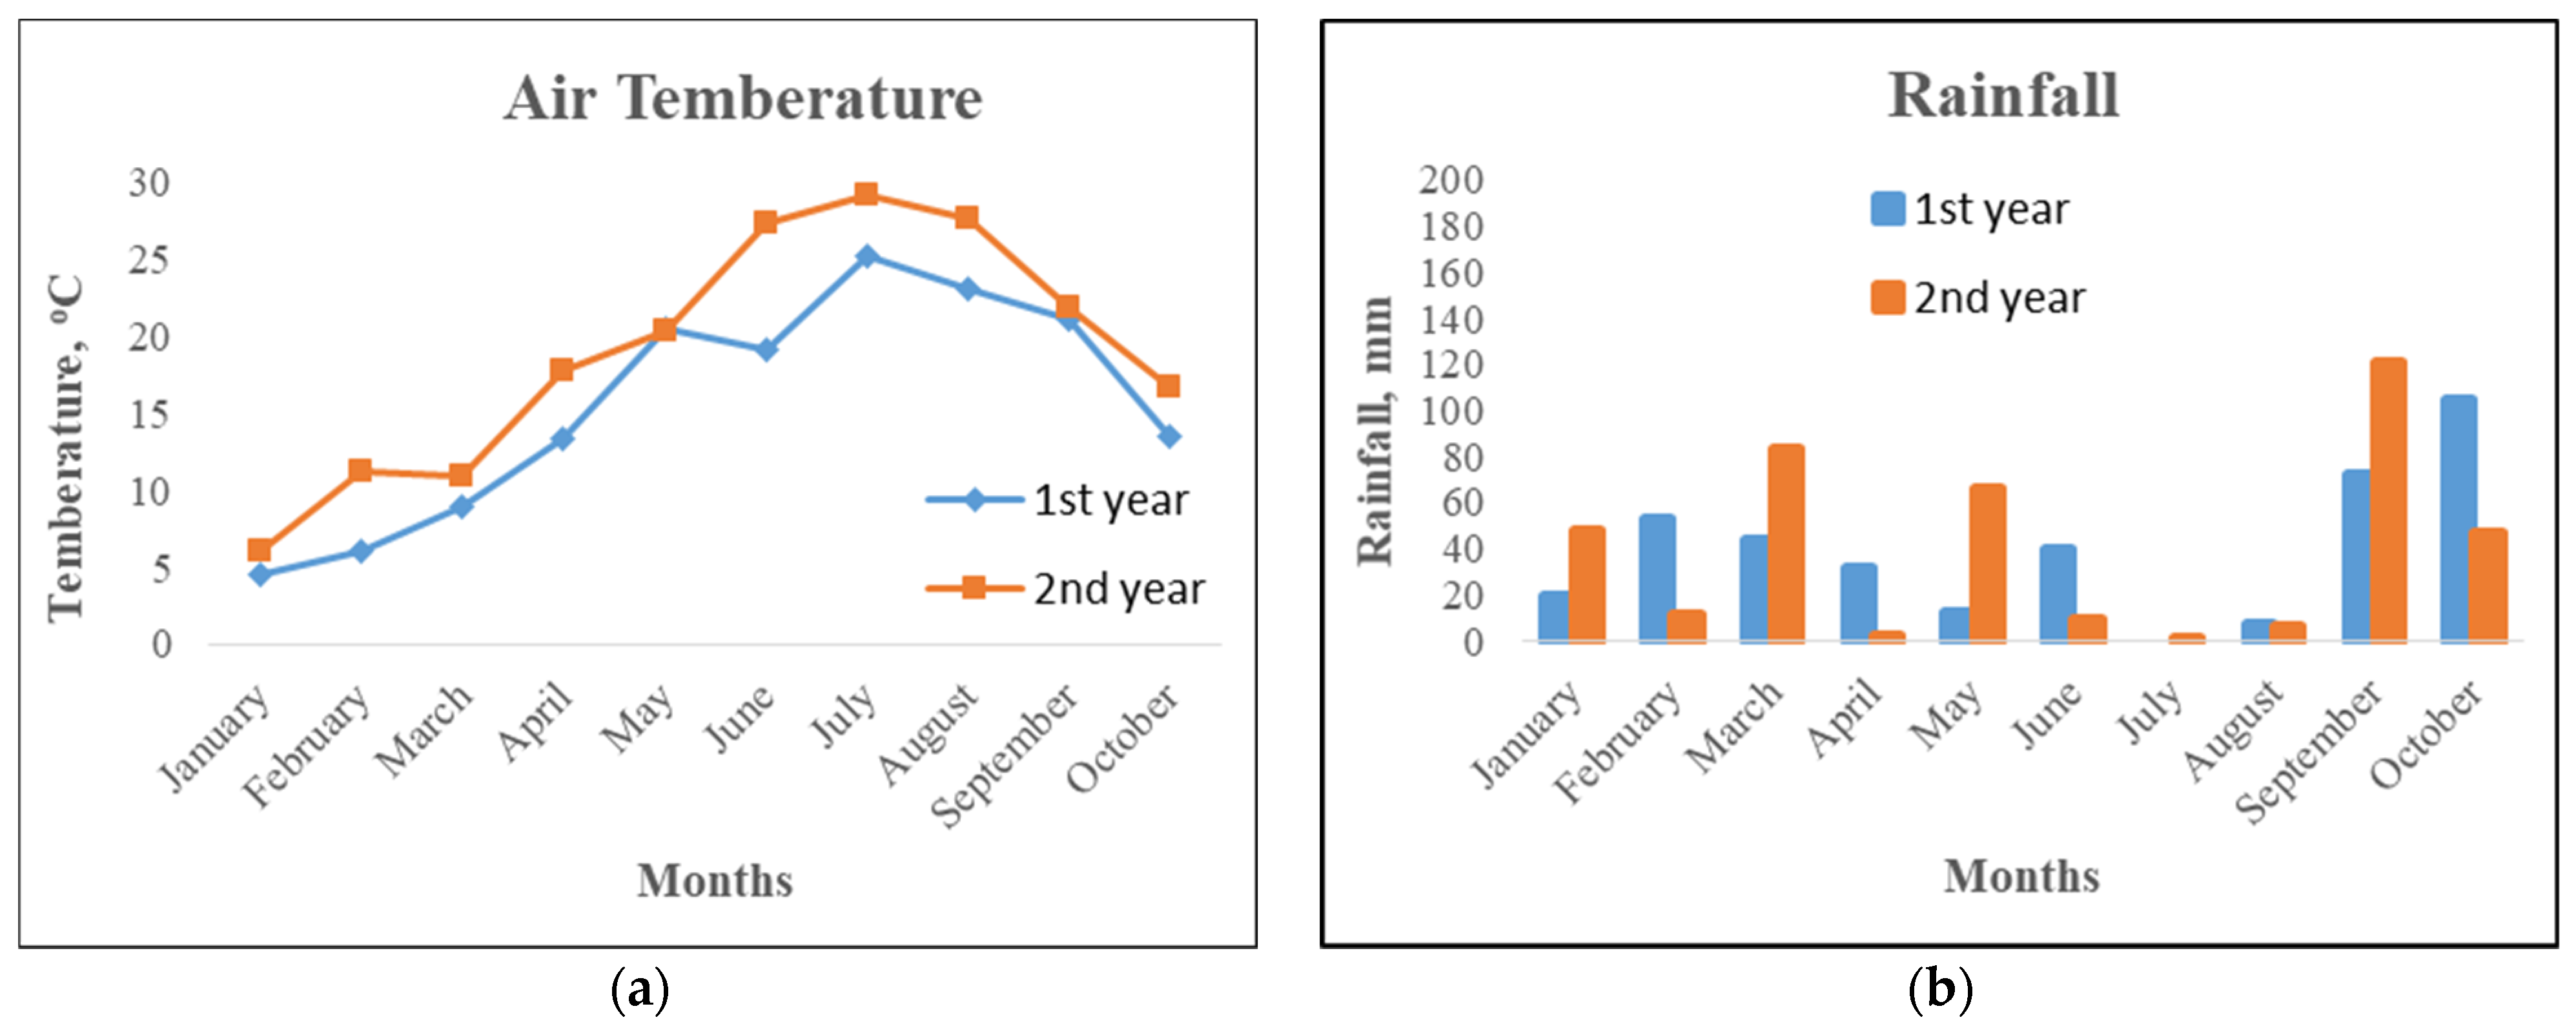
2.1. Meteorological Data
The meteorological data were recorded from an automatic station installed next to the experimental area.
Air temperature was at least 2–3 °C higher during the 2nd year of the experiment in almost all months. The total precipitation from March to October was 314.9 and 340 mm in 2015 and 2016, respectively (
Figure 1).
2.2. Soil Analyses
The soil was clay loam (38.41% sand, 36.11% clay, 25.48% silt), with a pH of 8.21 and organic matter content of 1.65%. The physicochemical properties of the soil are shown in
Table 1.
2.3. Runoff Events Results
In total, 11 runoff events were conducted over the rainy season between the beginning of March and the end of May for the autumn cultivation and from mid-September to mid–October for the two experimental years. Specifically, three (March to May) and two (September to October) runoff events were measured in the 1st year, and three (March to May) and three (September to October) in the 2nd year. The rainfall, a characteristic from which runoff was generated, is shown in
Table 2. The total amount of rainfall that resulted in runoff was 141.4 mm in 2015 and 310.9 mm in 2016, representing 45% and 91% of the total precipitation from March to October.
In order to evaluate the reduction in runoff, the RRB in % was calculated. The values of the RRB in % confirmed that the no-tillage treatments presented a decrease in runoff volumes in comparison to conventional blocks. In all four runoff events, no-tillage parallel to the contours caused a greater reduction than tillage perpendicular to the contours (
Table 3).
The results of the runoff volumes are illustrated in
Table 4. The runoff volumes of all treatments were lower in comparison to the control plots (no-tillage and no plant); and in 10 out of the 11 runoff events, the difference was statistically significant. The runoff values, from lowest to highest, follow the order: TR1 < TR2 < TR4 < TR5 < TR3 < TR6 < control. The TR1 (no tillage-planting parallel to the contour direction-plant) plots had a lower runoff volume. The highest runoff was observed for tillage perpendicular to the contour. Additionally, greater runoff volumes were observed in NT (no-tillage) plots than in CT (conventional tillage), regardless of the cultivated soil direction (parallel or perpendicular to the contour). During the 1st year, the total rainfall was 141.4 mm and the runoff values ranged from 5.004 (TR1) to 13.396 m
3 ha
−1 (control), while during the 2nd year, the total rainfall was 310.9 mm and the runoff volumes ranged from 3.4112 (TR1) to 21.096 m
3 ha
−1 (control).
2.4. Soil Loss Results
The soil loss concentrations are reported in
Table 5. In all six treatments (TR1, TR2, TR3, TR4, TR5, and TR6), soil loss was lower in comparison to the control (no-tillage and no plant); and in 10 out of the 11 runoff events, the difference was statistically significant (RE3, RE4, RE5, RE6, RE7, RE8, RE9, RE10, and RE11). The soil loss rates followed the order TR1 < TR2 < TR4 < TR5 < TR3 < TR6 < control. The TR1 plots had a statistically significant difference only in the RE9 runoff event (110.7 mm rainfall). Larger soil losses were generally measured in the plots in which the tillage was performed perpendicular in the contour. Furthermore, the NT (no-tillage) produced lower soil loss amounts in comparison to the CT (conventional tillage), regardless of the direction of cultivation (either parallel or perpendicular to the contours). During the 1st year, out of a total rainfall of 141.4 mm, the soil loss values ranged from 0.953 (TR1) to 12.325 m
3 ha
−1 (control). During the 2nd year, out of a total rainfall of 310.9 mm, the runoff volumes ranged from 2.3399 (TR1) to 43.691 m
3 ha
−1 (control). The different land treatments decreased the sediment loss by 71–92% in the 1st year and by 67–95% in the 2nd year. The measurement of the sediment reduction benefit (SRB in %) showed that no-tillage reduced soil loss to a greater amount in comparison to conventional tillage. The reduction in no-tillage parallel to the contour ranged from 15.7 to 60.3%, while reduction in tillage perpendicular to the contour ranged from 18 to 43.1% (
Table 6).
2.5. Nutrient Loss Results
The concentrations of the K and P losses are presented in
Table 7 and
Table 8. According to the results, in all treatments, the potassium and phosphorus losses were lower in comparison to in the control plots (no-tillage and no plant). The reduced potassium values ranged from 39% (TR1) to 72% (TR6) in the 1st year and from 47% (TR1) to 89% (TR6) in the 2nd year for a total rainfall of 141.4 and 310.9 mm, respectively. In the case of phosphorus, the decrease ranged from 35% (TR1) to 86% (TR6) in the 1st year and from 40% (TR1) to 82% (TR6) in the 2nd year.
Comparing the direction of planting tillage (parallel and perpendicular to the contour), the concentrations of potassium and phosphorus losses were reduced in tillage parallel to the contour. Additionally, the decreases in potassium and phosphorus losses were lower in no-tillage plots in comparison to conventional tillage. Analyses of variances were used to compare the amount of potassium and phosphorus losses in the different treatments for the two cultivation years in which total precipitation during the studied periods (March to October) was 141.4 and 310.9 mm in the 1st and 2nd years, respectively. The results (
Table 7 and
Table 8) show that there is a significant difference between all the different treatments and the control plots.
2.6. Total Biomass Results
As shown in
Table 9 and
Table 10, during the 1st and 2nd years, the total biomass of the intercropping
Triticosecale–Pisum sativum in no-tillage treatment, with tillage parallel to the contour was greater than the total biomass in the other three treatments. The NT-PPACD-P treatment had a statistically significant difference with the CT-PPECD-P plots, for both cultivated years. That treatment was higher by 17%, 25% and 33% in comparison to CT-PPACD-P, NT-PPECD-P, CT-PPECD-P during the 1st year and 18%, 26% and 31% during the 2nd year, respectively.
As illustrated in
Table 11 and
Table 12, during both cultivation years, the plots with no-tillage and tillage parallel to the contour (NT-PPACD-P) presented a higher total yield—5350 and 5970 kg ha
−1—during the 1st and 2nd years, respectively. Statistically significant differences were observed between the NT-PPACD-P and CT-PPECD-P treatments.
Furthermore, during the 2nd year the total biomass was greater compared to the 1st year in both cultivations (intercropping Triticosecale–Pisum sativum and Helianthus annuus). The increase in total yield was probably attributed to the positive impact of the residues which were incorporated into the field after the harvest of the intercropping Triticosecale–Pisum sativum.
3. Discussion
In this research, 11 rainfall events were generated by natural precipitation during the two cultivation years. The runoff values according to the results were lower compared to the no tillage-planting parallel to the contour–with plant treatment. Specifically, in the 1st year, the runoff values ranged from 5.004 (TR1) to 13.396 m
3 ha
−1 (control), while during the 2nd year, the runoff volumes ranged from 3.4112 (TR1) to 21.096 m
3 ha
−1 (control). It has to be mentioned that in the 2nd year, precipitation was 55% higher compared to in the 1st cultivation year. Similar results were observed by other studies [
9,
24,
25]. On the other hand, Kebede et al. [
26] reported a lower reduction in runoff (12–39%), using alternative soil erosion amendments (Anionic polyacrylamide, gypsum, lime, and biochar) in comparison to the current investigation results (a reduction from 62 to 86%).
Soil loss results indicated that the different tillage practices decreased sediment loss by 71–92% in the 1st year and by 67–95% in the 2nd year. The lowest reduction was obtained by the no tillage-planting parallel to the contours–with plant treatment. Furthermore, the measurement of the sediment reduction benefit showed that no tillage provoked a higher reduction in soil loss compared to conventional practice. Berihun et al. [
8] found that different land management practices (no crop cultivation on steep slopes > 30%, Khat plantation, forage production, reforestation on communal and hilly croplands) resulted in a reduction in soil loss by 32–95%. Comparing our results with other studies, it can be verified that NT cultivation in lands with slope can significantly reduce soil loss [
9,
17]. Kurothe et al. [
21] found that the average soil loss in NT was 37.2% less than in CT. Additionally, Merten et al. [
22] indicated a decrease in soil loss of more than 70% using no tillage cultivation. Additionally, tillage parallel to the contour is more effective in decreasing sediment loss [
27].
Furthermore, no tillage-planting parallel to the contour had a positive effect on the decrease in potassium and phosphorus content. The same results are mentioned by Peri et al. [
28]. It can be said that agricultural practices such as soil tillage play a significant role in nutrient loss [
10]. Wolka et al. [
29] mentioned that tillage management can affect the nutrient transfer by the surface runoff. According to the literature, there are no studies which have been conducted for the investigation of positive or negative impacts of conventional tillage and no-tillage in combination with tillage parallel and perpendicular to the contour cultivation to the reduction in exchangeable potassium and extractable phosphorus.
Tillage parallel to the contour presented higher total biomass in both cultivations. Specifically, the total yield in NT-PPACD-P was higher by 17%, 25% and 33% in comparison to CT-PPACD-P, NT-PPECD-P, CT-PPECD-P during the 1st year and 18%, 26% and 31% during the 2nd year for
Triticosecale–Pisum sativum intercropping. In sunflower cultivation, the biomass was 5350 and 5970 kg ha
−1 during the 1st and 2nd years, respectively. Our results are in agreement with other studies [
30,
31]. According to our results, intercropping legume–cereal and sunflower cultivation increased the biomass in the 2nd year of the experiments. That legume intercropping in a rotation system promotes an advantageous increase in crop production is also indicated by other studies [
32,
33].
4. Materials and Methods
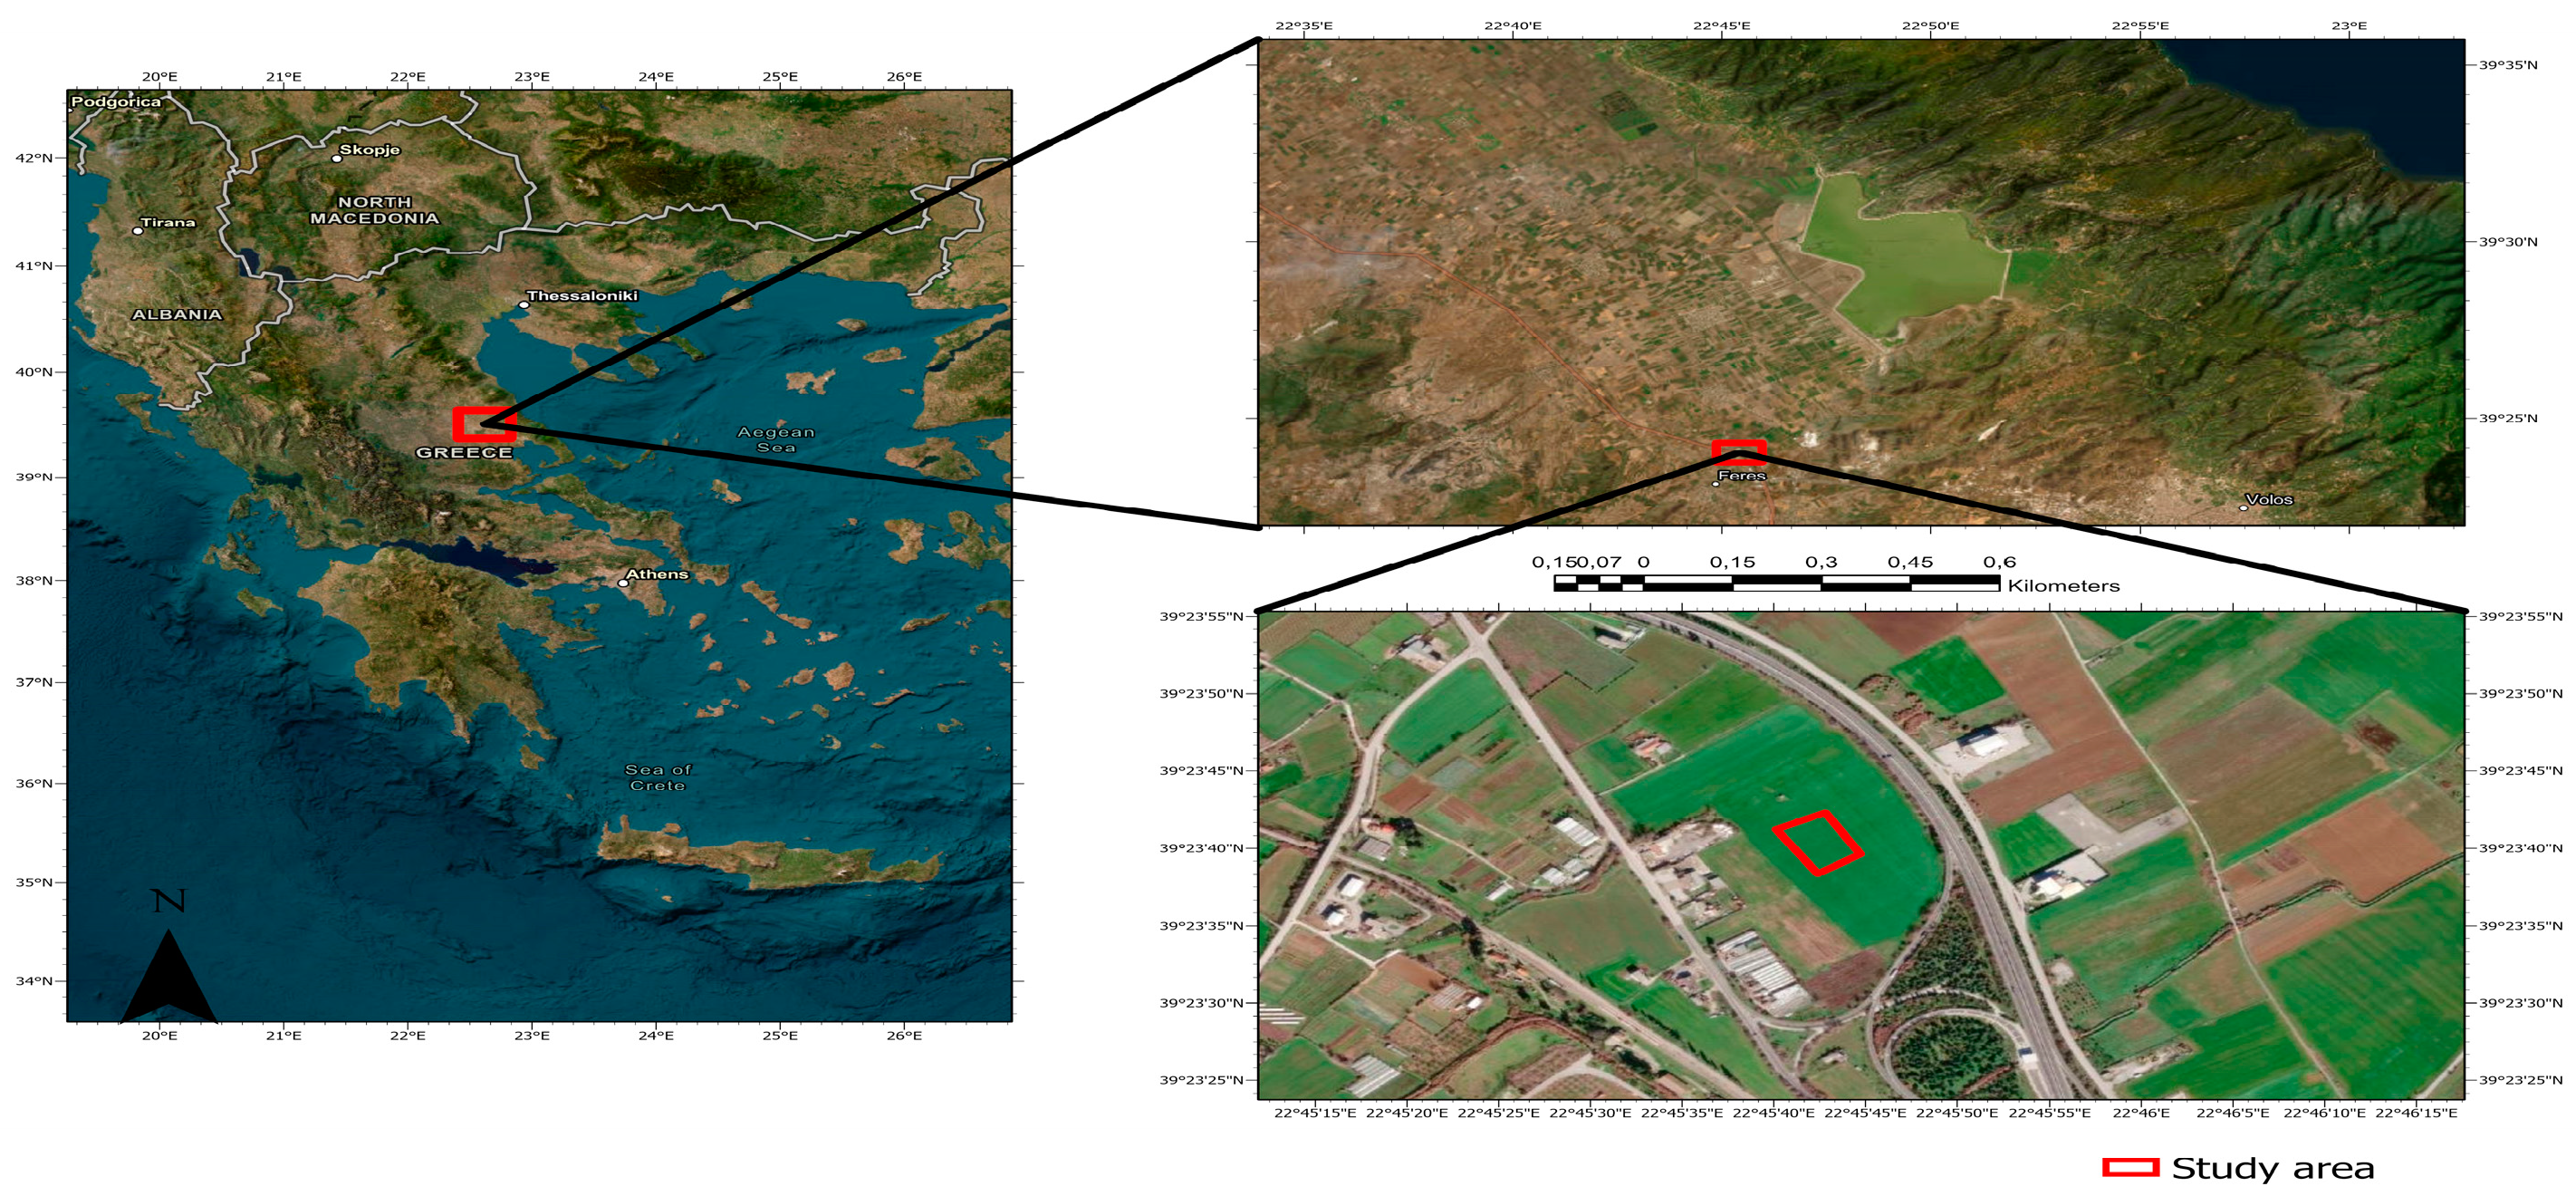
4.1. Study Area
Thus, experiment was established in a field with a slope of at least 5% at the Experimental Station of the University of Thessaly (Larissa—Greece). The studied area, which has latitude of 39°37′30″ and a longitude of 22°22′51″, was located at an altitude of 80 m above sea level (
Figure 2). The climate in the area is characterized as Mediterranean, with hot and dry summers as well as cold and wet winters.
4.2. Soil Analyses
A soil sample from the field was taken from a depth of 0–30 cm using a steel auger, before sowing. The soil sample was transported to the soil laboratory, air-dried and then sieved through a 2mm sieve. The pH (1:2.5 d. H
2O) of the soil was determined along with its electrical conductivity (1:5 d. H
2O),concentration of calcium carbonate (CaCO
3) using a calcimeter, percentage (%) of sand, clay and silt using the Bouyoukos method, organic matter using the Walkley–Black method, total nitrogen (Kjeldahl method), available soil P (Olsen method, analyzed with ammonium vanadomolybdate/ascorbic blue and measured in a UV spectrophotometer at 882 nm) and exchangeable Κ (1:10 at 1M CH
3COONH
4 pH 7, analyzed in a flame photometer). All the analyses were carried out according to Rowell (1994) [
34].
4.3. Field Experiment
The experiment included various combinations of cultivation treatments (conventional tillage and no-tillage), different cultivated soil direction (parallel and perpendicular to the contours), and vegetation covers (with and without crops), resulting in 7 treatments with three replicates each (treatments are explained in
Table 13). The plots were 132 m
2 in size (6 m in width × 22 m in length). A split-plot experimental design was implemented.
The experiment was conducted in two cultivated years. During the experiments, all the necessary cultivation practices were conducted. Conventional tillage included ploughing to a depth of approximately 25 cm in both autumn and spring. For the autumn cultivation, tillage took place on the 6 December in the 1st year and on the 8 November in the 2nd year. For the spring, crop tillage was carried out on the 30 June 2015 and on the 12 June 2016.
All the plots were sprayed with herbicide glyphosate (at 5 L/ha) at least one month before the autumn cultivation in the 1st year of the experiment. Additionally, during the autumn cultivation, the no-tillage plots were sprayed using herbicide glyphosate (3 L/ha) in late March, during both cultivation years.
The plots were sown with intercropping Pisum sativum (140 kg ha−1) and Triticosecale (60 kg ha−1) in the autumn period and with Helianthus annuus (85.000 seeds ha−1) in the spring period.
For the two cultivation periods, the following crop sequence was used for the experiments: (a) winter rotation of legume–cereal (2014/2015); (b) summer sunflower (2015); (c) winter rotation of legume–cereal (2015/2016); (d) summer sunflower (2016).
During the autumn cultivation, N was applied as basic (1/3 at sowing) and as top-dressing fertilizer (2/3 at the end of March). Phosphorus (270 kg P2O5 ha−1) and K (270 kg K2O ha−1) were applied at the same time with sowing. During the spring cultivation, the blocks were treated with N (40 kg N ha−1), P (60 kg P2O5 ha−1) and K (60 kg K2O ha−1) during sowing.
For the 1st year, the autumn cultivation was harvested on the 5 June and the Helianthus annuus plants on the 17 October. For the 2nd year, the harvest was performed on the 3 June for the intercropping cultivation Pisum sativum and Triticosecale and on the 16 October for the Helianthus annuus. The harvest of the plots with plants was conducted using a frame of 1 m2. The frame was placed in 4 random places within each plot and the total biomass from inside the frame was collected and harvested at a height of 1 cm above soil level. In the case of the intercropping cultivation of Pisum sativum and Triticosecale, the two crops were separated. Additionally, the plants of Pisum sativum were separated into stems, seeds and pods and the Triticosecale plants into to stems and spikes. After the harvest of the autumn cultivation, the crop residues of the intercropping Triticosecale and Pisum sativum were incorporated into the field.
4.4. Measurement of Runoff, Soil and Nutrient Loss
This study was conducted under natural rainfall conditions. Every plot was enclosed by a metal pipes system, so that the runoff was discharged into large containers which were installed into the ground at the down slope edge of each plot. In each container, a plastic bag was used; and after a significant natural rainfall event, the bags were put in boxes and transported to the laboratory, where they were left to settle until the sediment subsided. Then, the runoff volume from each box was collected and weighed. The sediment samples were gathered and dried at 60 °C for 48 h. From these samples, soil loss, the Olsen P (extraction at 1:20 with 0.5 M sodium bicarbonate (NaHCO3) and the exchangeable K (extracted at 1:5 with 1 M CH3CHOONH4) were measured (methods according to Rowel 1994).
In order to evaluate the way that the different tillage treatments affect the runoff and soil loss, two indices were chosen: (a) runoff reduction benefit (RRB) in % and (b) sediment reduction benefit (SRB) in % [
9].
These indices were calculated using the following equations:
where
RCT is the runoff volume (m3) in the conventional tillage blocks,
RNT is the runoff volume (m3) in the no-tillage blocks,
SCT is soil loss (kg/ha) in the conventional tillage blocks, and
SNT is soil loss (kg/ha) in the no-tillage blocks.
4.5. Statistical Analysis
The data were analyzed using the Statgraphics plus 8.1 statistical analysis software for the analysis of variance at the 95% significance level (p < 0.05) and the LSD test was employed as a means of indicating the significance of differences among treatments.
5. Conclusions
In this study, we evaluated the impacts of no-tillage on runoff, soil and nutrient losses under natural rainfall in comparison to conventional agriculture. In addition, we investigated the effect of planting direction (parallel and perpendicular to the contour).
The results showed that the runoff volumes, the soil and nutrient losses were generally higher in CT than in NT, regardless of the cultivated soil direction. In the case of tillage direction, tillage parallel to the contour had a positive impact on the investigated parameters (runoff, soil and nutrient losses).
Furthermore, The RRB and SRB values confirm that no-tillage parallel to the contour caused a greater reduction than that in tillage perpendicular to the contour in runoff and in soil loss.
Since potassium and phosphorus nutrients (K and P) are necessary for plant growth, their losses, due to runoff, can lead to a detrimental impact on yield production, especially when the fertilizers are expensive. In the current study, significant differences have been observed regarding potassium and phosphorus losses between the different treatments. Specifically, the decrease was higher in plots cultivated parallel to the contour and with no tillage.
Additionally, plant biomass yield was affected by tillage direction. No-tillage planting parallel to the contour had a positive impact on crop production in comparison to the other treatments. Specifically, intercropping Triticosecale–Pisum sativum and Helianthus annuus yield was higher in the NT-PPACD-P plots in comparison to CT-PPACD-P, NT-PPECD-P, CT-PPECD-P during the 1st and 2nd years. Additionally, it should be noted that during the 2nd year, plant biomass was greater than that of the 1st year. This probably means that the residues that remained in the field after the 1st year harvest positively influenced production in the 2nd year.
To sum up, for Greece’s climate, the best agriculture management for sloping fields is for them to be cultivated using no tillage and planting should be conducted parallel to the contour. Finally, the cultivated plant system legume–cereal and sunflower is a promising crop rotational process in the reduction in soil and nutrient losses.
Author Contributions
Conceptualization, A.M.; methodology, A.M. and A.L.; software, A.L.; investigation, E.S. and K.S.; writing—original draft preparation, A.M. and E.S.; writing—review and editing, A.M.; supervision, A.M. and K.S.; project administration, A.M. All authors have read and agreed to the published version of the manuscript.
Funding
This research received no external funding.
Institutional Review Board Statement
Not applicable.
Informed Consent Statement
Not applicable.
Data Availability Statement
Not applicable.
Conflicts of Interest
The authors declare no conflict of interest.
References
- Choudhury, B.U.; Nengzouzam, G.; Islam, A. Runoff and soil erosion in the integrated farming systems based on micro-watersheds under projected climate change scenarios and adaptation strategies in the eastern Himalayan mountain ecosystem (India). J. Environ. Manag. 2022, 309, 114667. [Google Scholar] [CrossRef] [PubMed]
- Pimentel, D.; Burgess, M. Soil Erosion Threatens Food Production. Agriculture 2013, 3, 443–463. [Google Scholar] [CrossRef]
- Du, Y.; Li, T.; He, B. Runoff-related nutrient loss affected by fertilization and cultivation in sloping croplands: An 11-year observation under natural rainfall. Agric. Ecosyst. Environ. 2021, 319, 107549. [Google Scholar] [CrossRef]
- Ning, A.; Qingke, Z.; Guangquan, L.; Tianxing, W. Soil Erosion Influencing Factors in the Semiarid Area of Northern Shaanxi Province, China. Soil Moisture Importance 2021, 6, 154. [Google Scholar] [CrossRef]
- Su, Z.-A.; Zhang, J.-H.; Nie, X.-J. Effect of Soil Erosion on Soil Properties and Crop Yields on Slopes in the Sichuan Basin, China. Pedosphere 2010, 20, 736–746. [Google Scholar] [CrossRef]
- Wang, L.; Dalabay, N.; Lu, P.; Wu, F. Effects of tillage practices and slope on runoff and erosion of soil from the Loess Plateau, China, subjected to simulated rainfall. Soil Tillage Res. 2017, 166, 147–156. [Google Scholar] [CrossRef]
- Parhizkar, M.; Shabanpour, M.; Lucas-Borja, M.E.; Zema, D.A.; Li, S.; Tanaka, N.; Cerdà, A. Effects of length and application rate of rice straw mulch on surface runoff and soil loss under laboratory simulated rainfall. Int. J. Sediment Res. 2020, 36, 468–478. [Google Scholar] [CrossRef]
- Berihun, M.L.; Tsunekawa, A.; Haregeweyn, N.; Tsubo, M.; Fenta, A.A.; Ebabu, K.; Sultan, D.; Dile, Y.T. Reduced runoff and sediment loss under alternative land capability-based land use and management options in a sub-humid watershed of Ethiopia. J. Hydrol. Reg. Stud. 2022, 40, 100998. [Google Scholar] [CrossRef]
- Carretta, L.; Tarolli, P.; Cardinali, A.; Nasta, P.; Romano, N.; Masin, R. Evaluation of runoff and soil erosion under conventional tillage and no-till management: A case study in northeast Italy. Catena 2021, 197, 104972. [Google Scholar] [CrossRef]
- Liu, Y.; Tao, Y.; Wan, K.Y.; Zhang, G.S.; Liu, D.B.; Xiong, G.Y.; Chen, F. Runoff and nutrient losses in citrus orchards on sloping land subjected to different surface mulching practices in the Danjiangkou Reservoir area of China. Agric. Water Manag. 2012, 110, 34–40. [Google Scholar] [CrossRef]
- Vogel, E.; Deumlich, D.; Kaupenjohann, M. Bioenergy maize and soil erosion—Risk assessment and erosion control concepts. Geoderma 2016, 261, 80–92. [Google Scholar] [CrossRef]
- Yuan, Z.; Chu, Y.; Shen, Y. Simulation of surface runoff and sediment yield under different land-use in a Taihang Mountains watershed, North China. Soil Tillage Res. 2015, 153, 7–19. [Google Scholar] [CrossRef]
- Xu, G.; Cheng, Y.; Li, P.; Li, Z.; Zhang, J.; Wang, T. Effects of natural rainfall on soil and nutrient erosion on sloping cropland in a small watershed of the Dan River, China. Quat. Int. 2015, 380–381, 327–333. [Google Scholar] [CrossRef]
- Klik, A.; Rosner, J. Long-term experience with conservation tillage practices in Austria: Impacts on soil erosion processes. Soil Tillage Res. 2020, 203, 104669. [Google Scholar] [CrossRef]
- Zhang, Y.; Tan, C.; Wang, R.; Li, J.; Wang, X. Conservation tillage rotation enhanced soil structure and soil nutrients in long-term dryland agriculture. Eur. J. Agron. 2021, 131, 126379. [Google Scholar] [CrossRef]
- Blanco-Sepúlveda, R.; Enríquez-Narváez, F.; Lima, F. Effectiveness of conservation agriculture (tillage vs. vegetal soil cover) to reduce water erosion in maize cultivation (Zea mays L.): An experimental study in the sub-humid uplands of Guatemala. Geoderma 2021, 404, 115336. [Google Scholar] [CrossRef]
- Wolschick, N.H.; Bertol, I.; Barbosa, F.T.; Bagio, B.; Biasiolo, L.A. Remaining effect of long-term soil tillage on plant biomass yield and water erosion in a Cambisol after transition to no-tillage. Soil Tillage Res. 2021, 213, 105149. [Google Scholar] [CrossRef]
- Cerdà, A.; Rodrigo-Comino, J.; Giménez-Morera, A.; Keesstra, S.D. Hydrological and erosional impact and farmer’s perception on catch crops and weeds in citrus organic farming in Canyoles river watershed, Eastern Spain. Agric. Ecosyst. Environ. 2018, 258, 49–58. [Google Scholar] [CrossRef]
- Morugán-Coronado, A.; Linares, C.; Gómez-López, M.D.; Faz, Á.; Zornoza, R. The impact of intercropping, tillage and fertilizer type on soil and crop yield in fruit orchards under Mediterranean conditions: A meta-analysis of field studies. Agric. Syst. 2020, 178, 102736. [Google Scholar] [CrossRef]
- Baiamonte, G.; Gristina, L.; Minacapilli, M.; Novara, A. Aridity index, soil erosion and climate drive no-till ecosystem services trade-off in Mediterranean arable land. Catena 2021, 203, 105350. [Google Scholar] [CrossRef]
- Kurothe, R.S.; Kumar, G.; Singh, R.; Singh, H.B.; Tiwari, S.P.; Vishwakarma, A.K.; Sena, D.R.; Pande, V.C. Effect of tillage and cropping systems on runoff, soil loss and crop yields under semiarid rainfed agriculture in India. Soil Tillage Res. 2014, 140, 126–134. [Google Scholar] [CrossRef]
- Merten, G.H.; Araújo, A.G.; Biscaia, R.C.M.; Barbosa, G.M.C.; Conte, O. No-till surface runoff and soil losses in southern Brazil. Soil Tillage Res. 2022, 152, 85–93. [Google Scholar] [CrossRef]
- Bayad, M.; Chau, H.W.; Trolove, S.; Moir, J.; Condron, L.; El Gharous, M. Surface runoff and losses of phosphorus from hydrophobic pastoral soils. Agric. Ecosyst. Environ. 2022, 324, 107690. [Google Scholar] [CrossRef]
- Chen, X.; Zhang, W.; Gruau, G.; Couic, E.; Cotinet, P.; Li, Q. Conservation practices modify soil phosphorus sorption properties and the composition of dissolved phosphorus losses during runoff. Soil Tillage Res. 2022, 220, 105353. [Google Scholar] [CrossRef]
- Tarolli, P.; Cavalli, M.; Masin, R. High-resolution morphologic characterization of conservation agriculture. Catena 2019, 172, 846–856. [Google Scholar] [CrossRef]
- Kebede, B.; Tsunekawa, A.; Haregeweyn, N.; Tsubo, M.; Mulualem, T.; Mamedov, A.I.; Meshesha, D.T.; Adgo, E.; Fenta, A.A.; Ebabu, K. Effect of Polyacrylamide integrated with other soil amendments on runoff and soil loss: Case study from northwest Ethiopia. Int. Soil Water Conserv. Res. 2022, 10, 487–496. [Google Scholar] [CrossRef]
- Mao, Y.-T.; Hu, W.; Chau, H.W.; Lei, B.-K.; Di, H.-J.; Chen, A.-Q.; Hou, M.T.; Whitley, S. Combined Cultivation Pattern Reduces Soil Erosion and Nutrient Loss from Sloping Farmland on Red Soil in Southwestern China. Agronomy 2020, 10, 1071. [Google Scholar] [CrossRef]
- Peri, P.L.; Lasagno, R.G.; Chartier, M.P.; Roig Junent, F.A.; Rosas, M.Y.; Martinez Pastu, G.J. Soil Erosion Rates and Nutrient Loss in Rangelands of Southern Patagonia. In Imperiled: The Encyclopedia of Conservation; Elservier: Amsterdam, The Netherlands, 2022; pp. 102–110. [Google Scholar] [CrossRef]
- Wolka, K.; Biazin, B.; Martinsen, V.; Mulder, J. Soil and water conservation management on hill slopes in Southwest Ethiopia. I. Effects of soil bunds on surface runoff, erosion and loss of nutrients. Sci. Total Environ. 2021, 757, 142877. [Google Scholar] [CrossRef]
- Lorenz, M.; Fürst, C.; Thiel, E. A methodological approach for deriving regional crop rotations as basis for the assessment of the impact of agricultural strategies using soil erosion as example. J. Environ. Manag. 2013, 127, S37–S47. [Google Scholar] [CrossRef]
- Moreau, D.; Pointurier, O.; Nicolardot, B.; Villerd, J.; Colbach, N. In which cropping systems can residual weeds reduce nitrate leaching and soil erosion? Eur. J. Agron. 2020, 119, 126015. [Google Scholar] [CrossRef]
- Ruhlemann, L.; Schmidtke, K. Evaluation of monocropped and intercropped gain legumes for cover cropping in no-tillage and reduced tillage organic agriculture. Eur. J. Agron. 2015, 65, 83–94. [Google Scholar] [CrossRef]
- Kandel, H.J.; Schneiter, A.A.; Johnson, B.L. Intercropping legumes into sunflower at different growth stages. Crop Sci. 1997, 37, 1532–1537. [Google Scholar] [CrossRef]
- Rowell, D.L. Soil Science: Methods and Applications; Longman Group UK Ltd.: London, UK, 1994. [Google Scholar]
| Publisher’s Note: MDPI stays neutral with regard to jurisdictional claims in published maps and institutional affiliations. |
© 2022 by the authors. Licensee MDPI, Basel, Switzerland. This article is an open access article distributed under the terms and conditions of the Creative Commons Attribution (CC BY) license (https://creativecommons.org/licenses/by/4.0/).


