
The Effect of Tree Spacing on Yields of Alley Cropping Systems—A Case Study from Hungary
 ,
,  ,
,  and
and
Abstract
1. Introduction
2. Results
2.1. Features Defining each Treatment
2.2. Tree Component
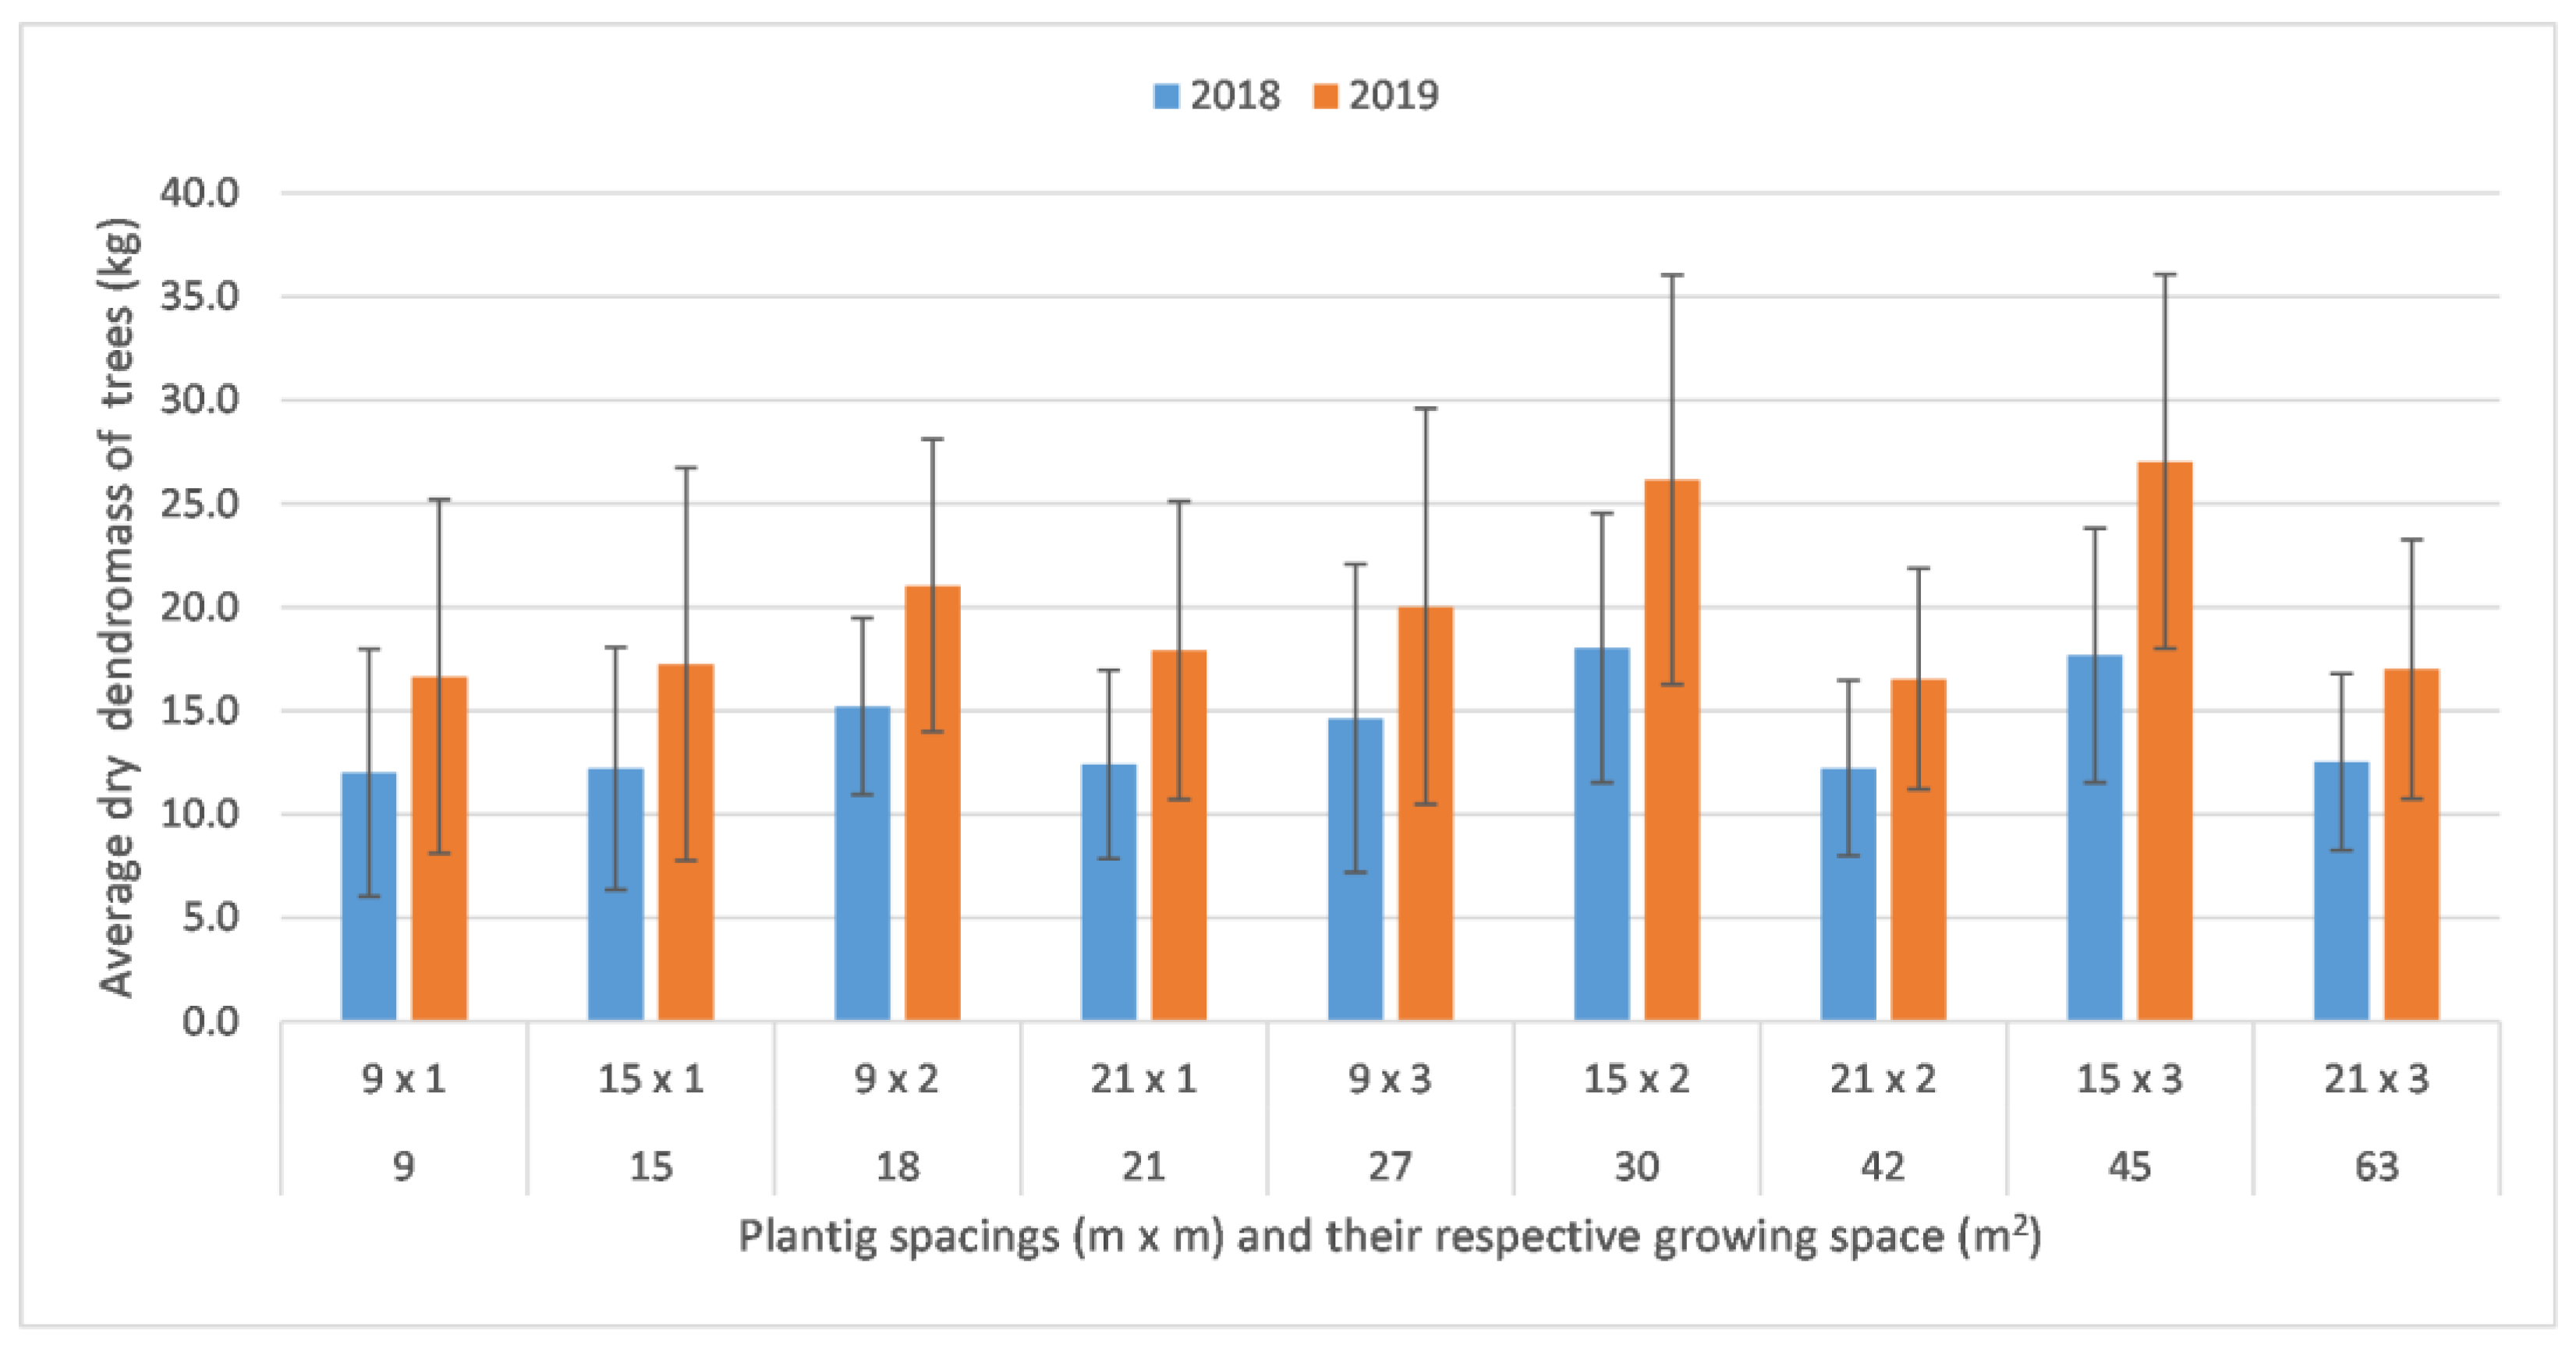
2.2.1. Above-Ground Dendromass of Black Locust
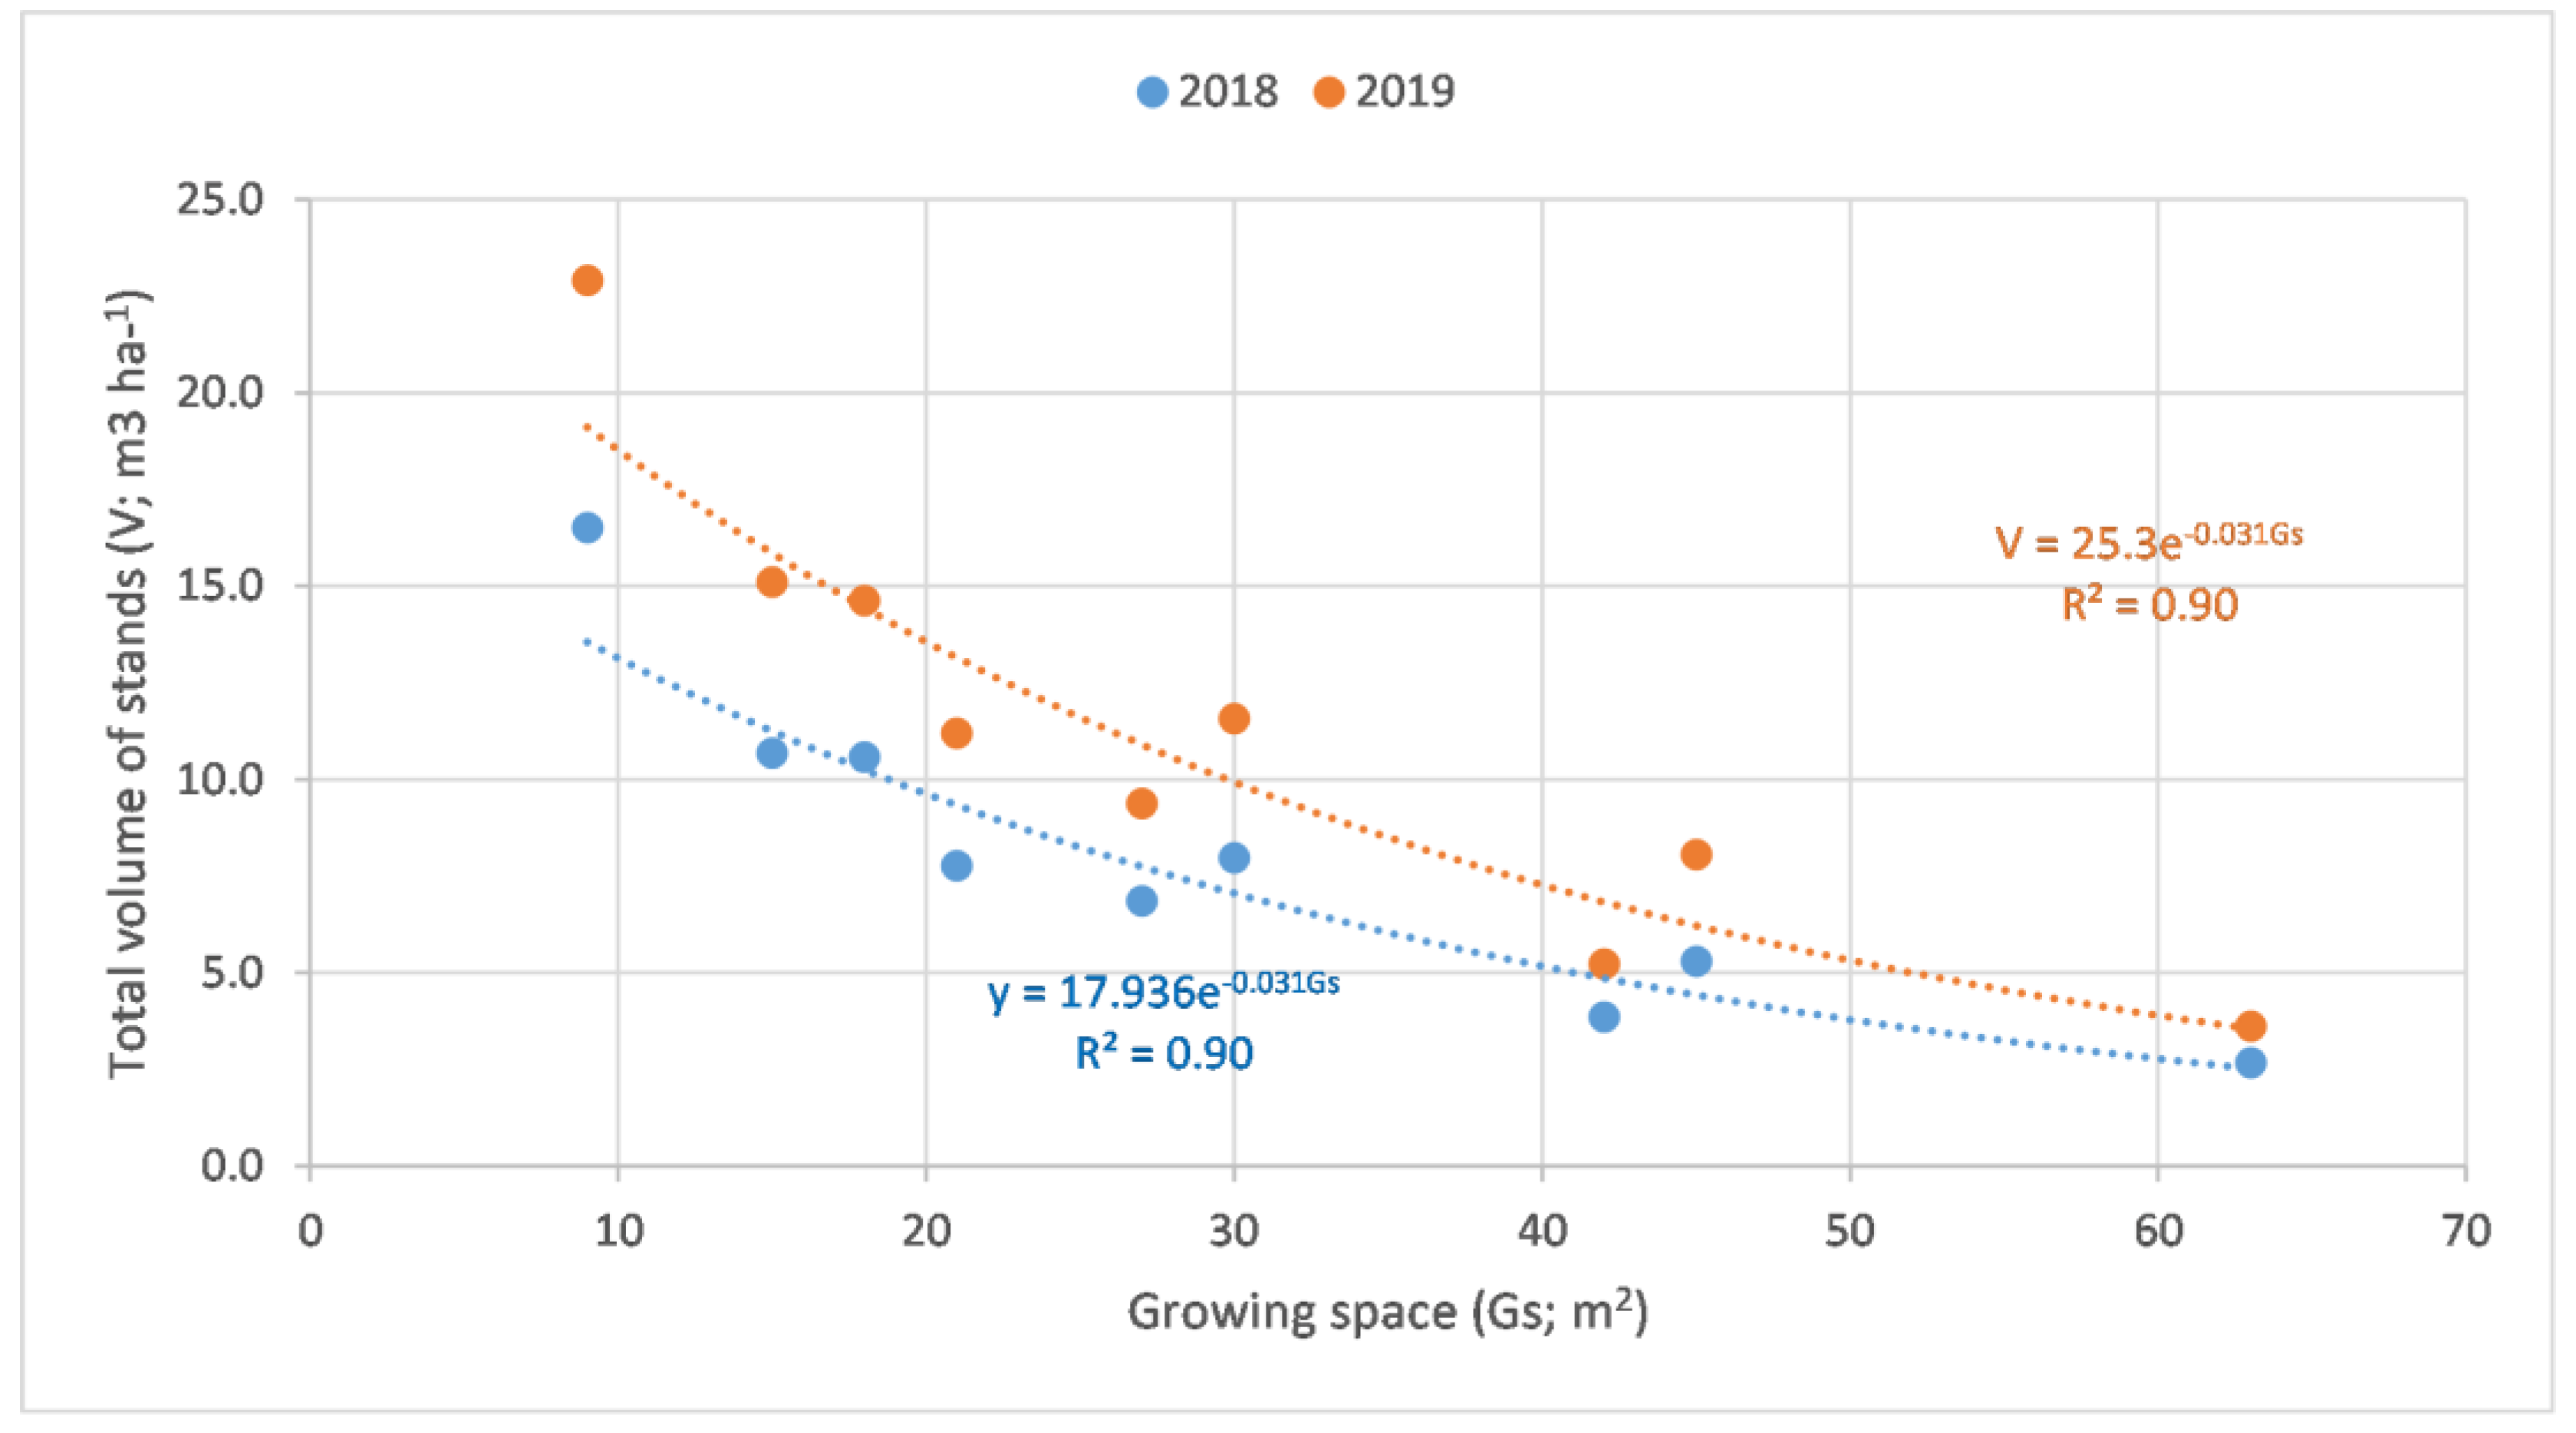
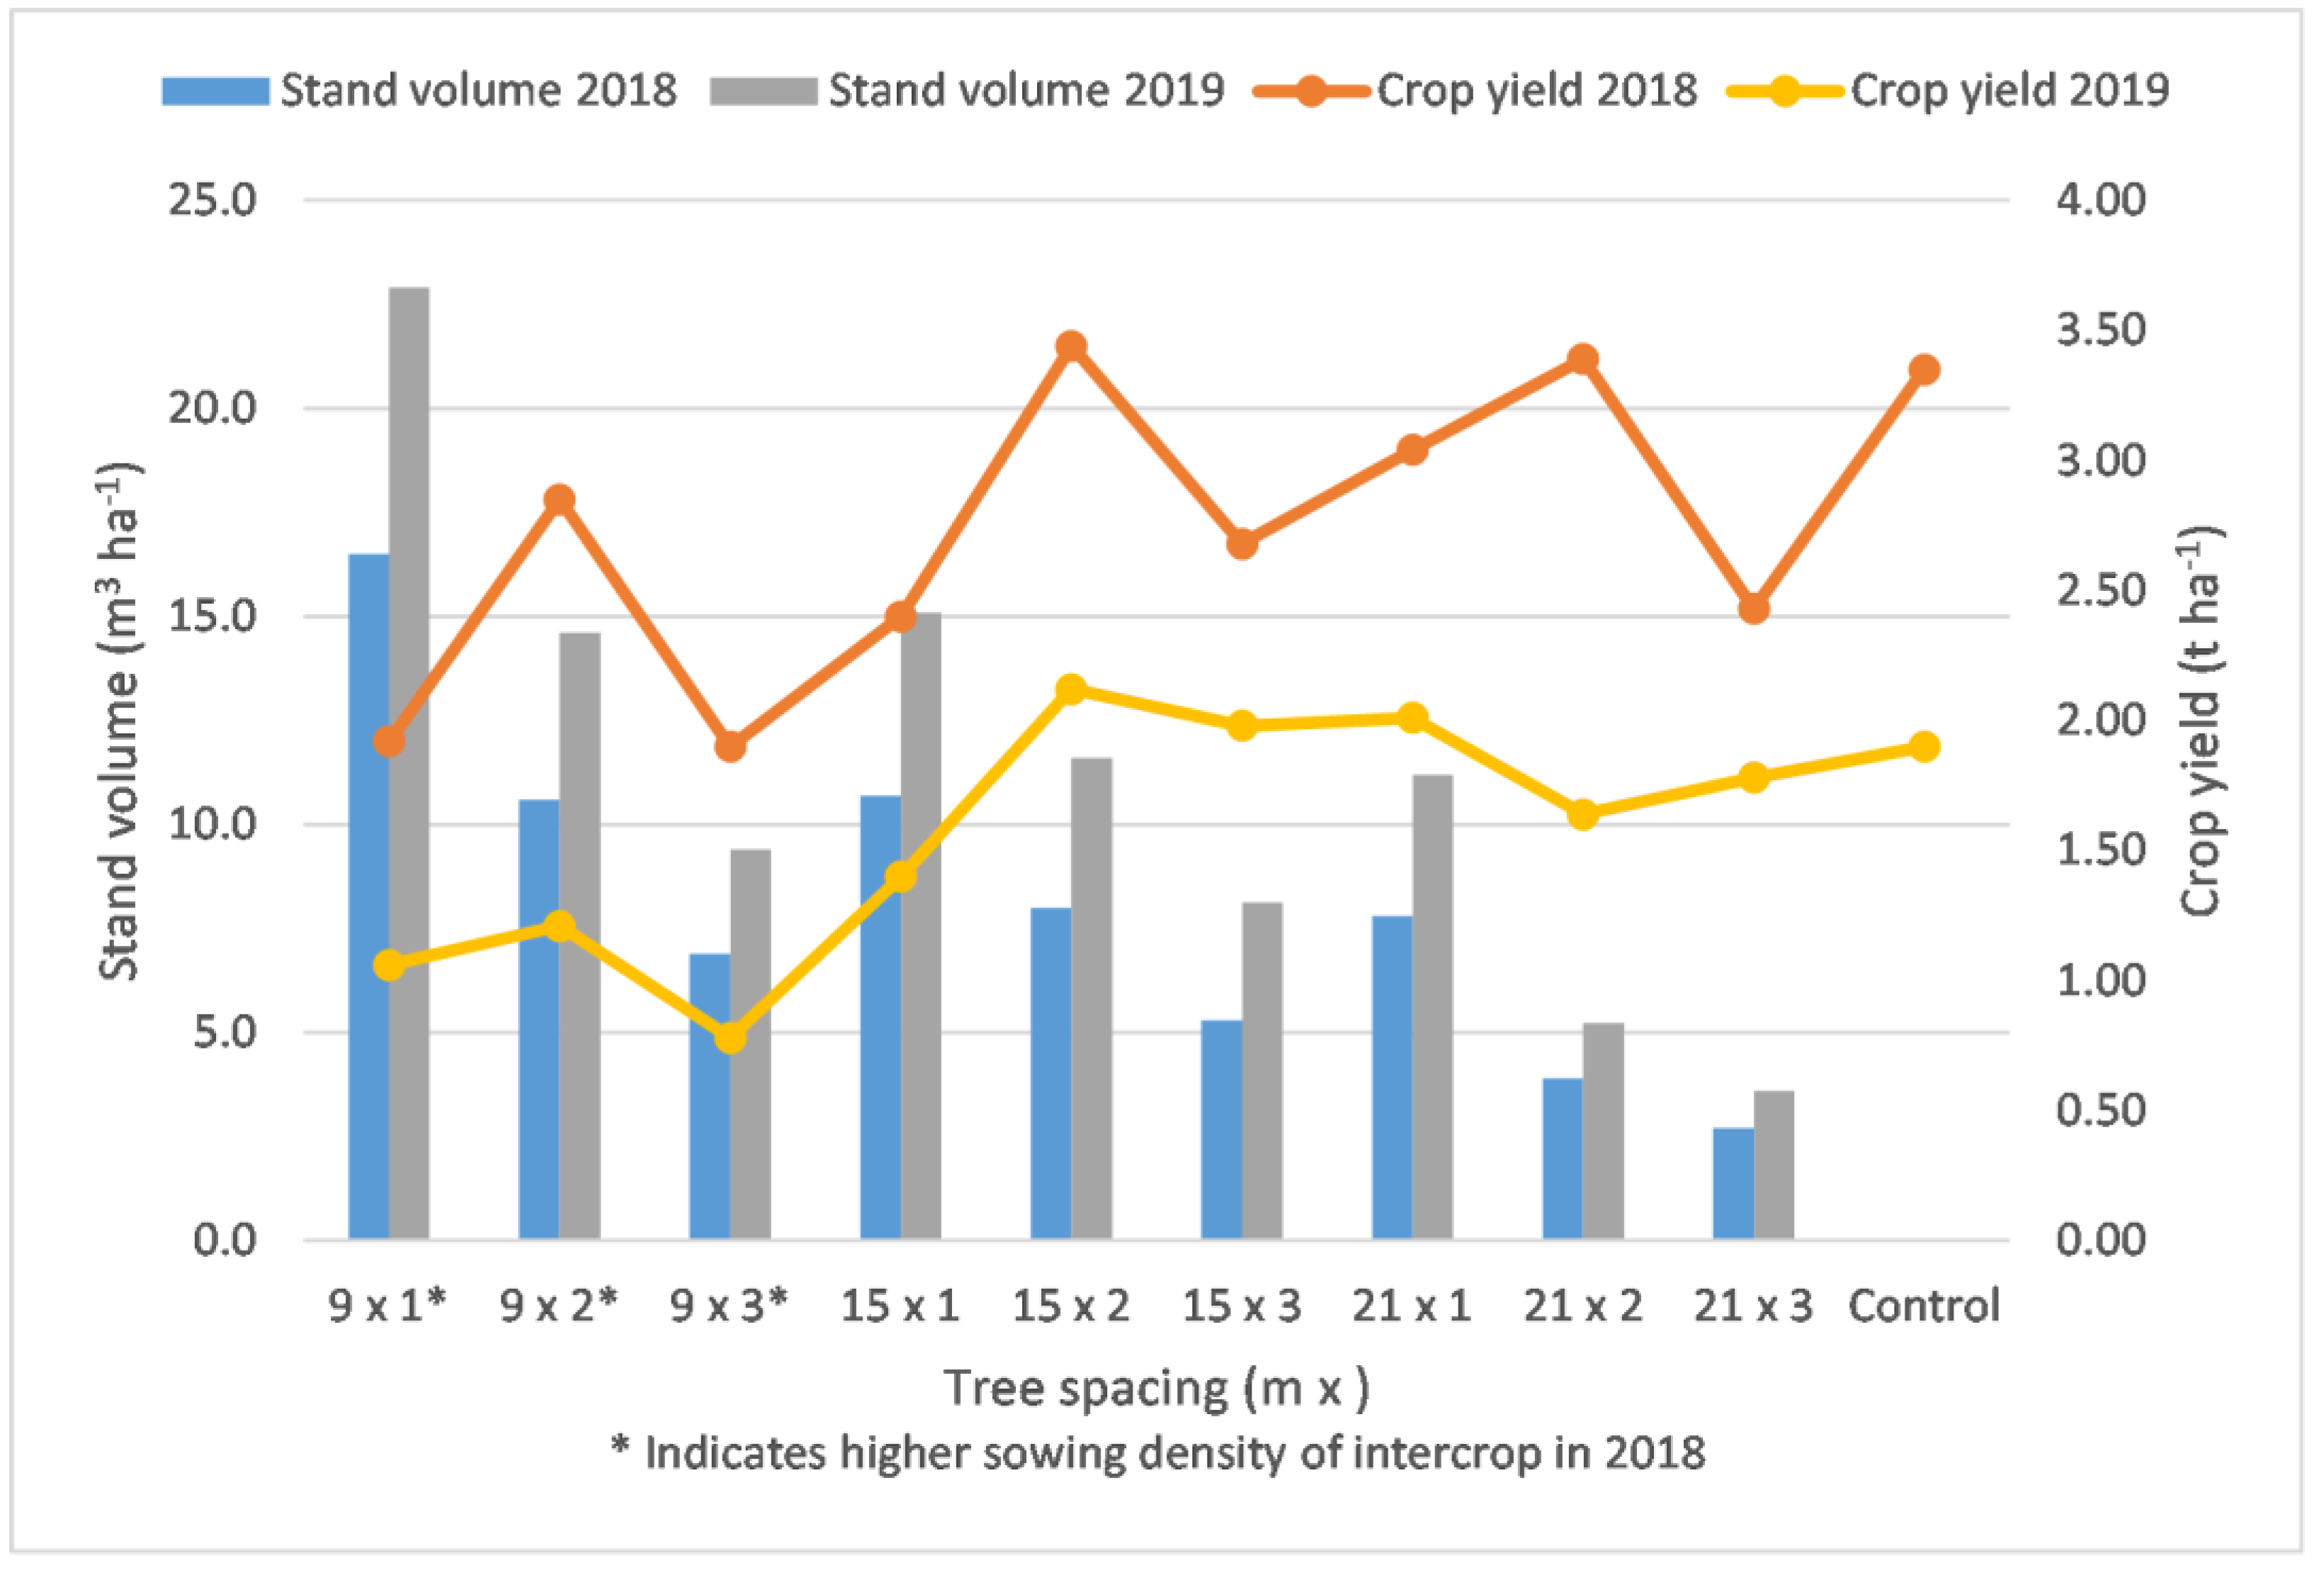
2.2.2. Relationship between the Growing Space and Total Volume of the Stands
2.3. Crop Component
2.3.1. Yields of Triticale
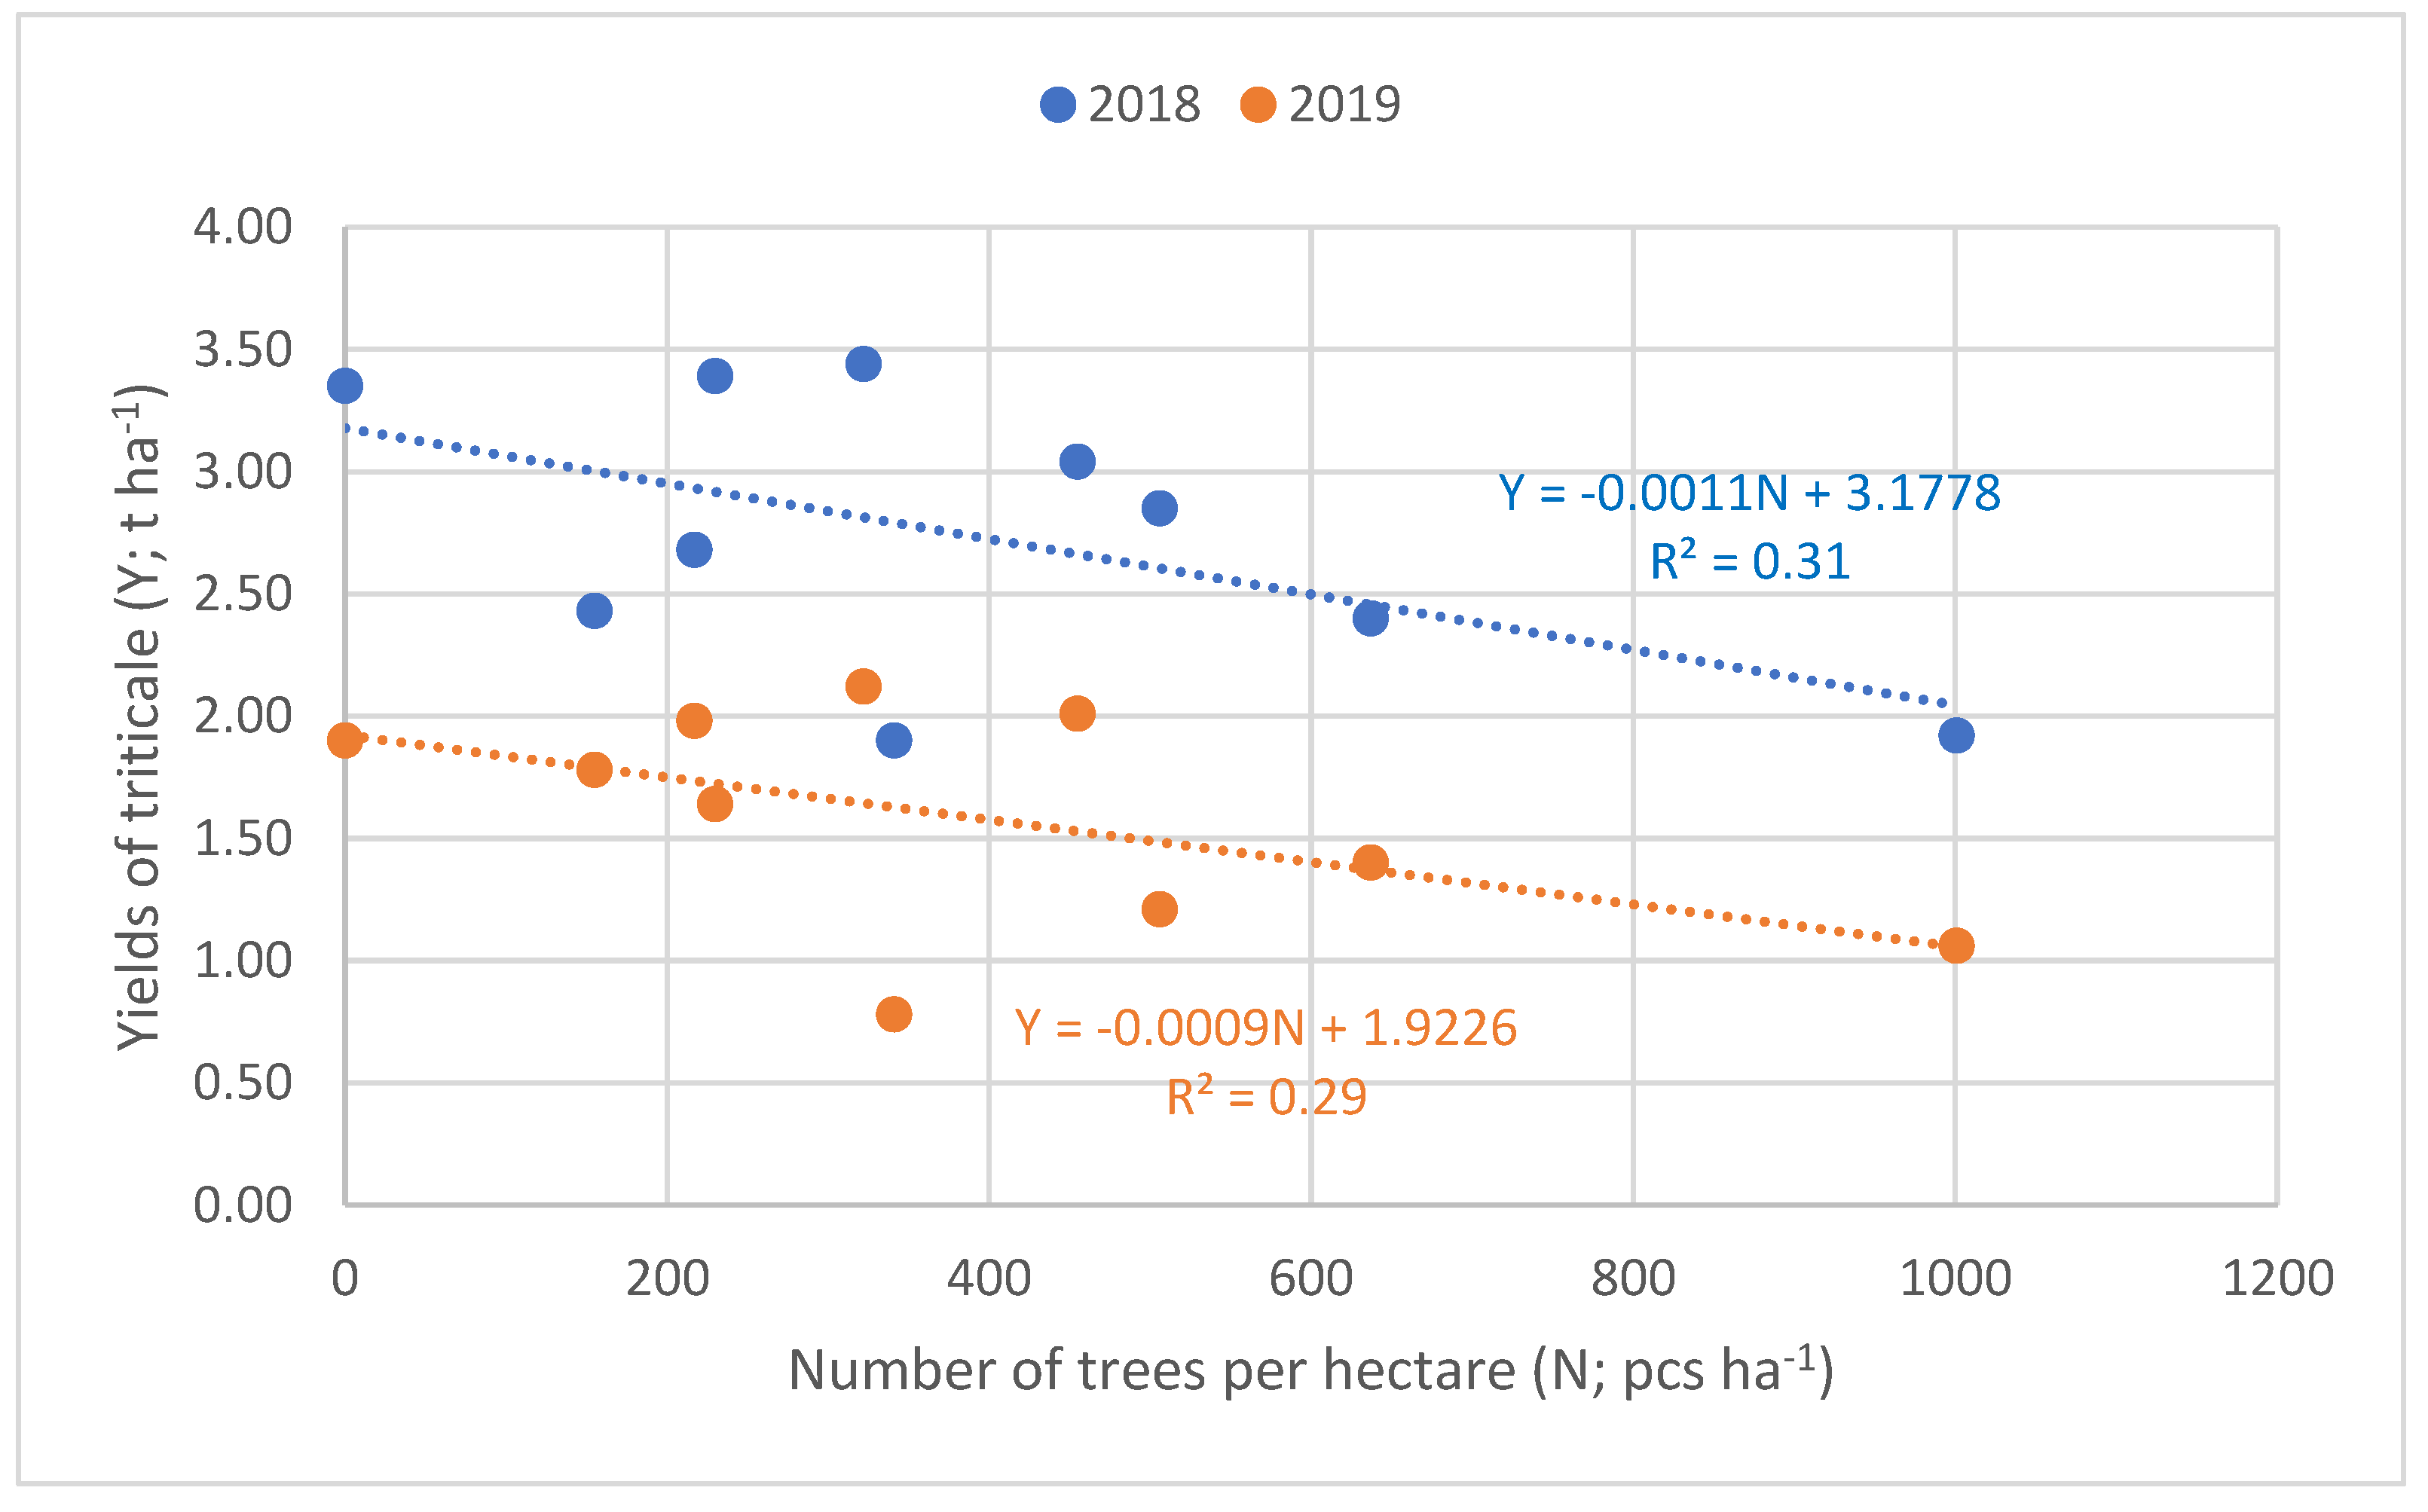
2.3.2. Relationship between the Number of Trees and the Yield of Intercrop
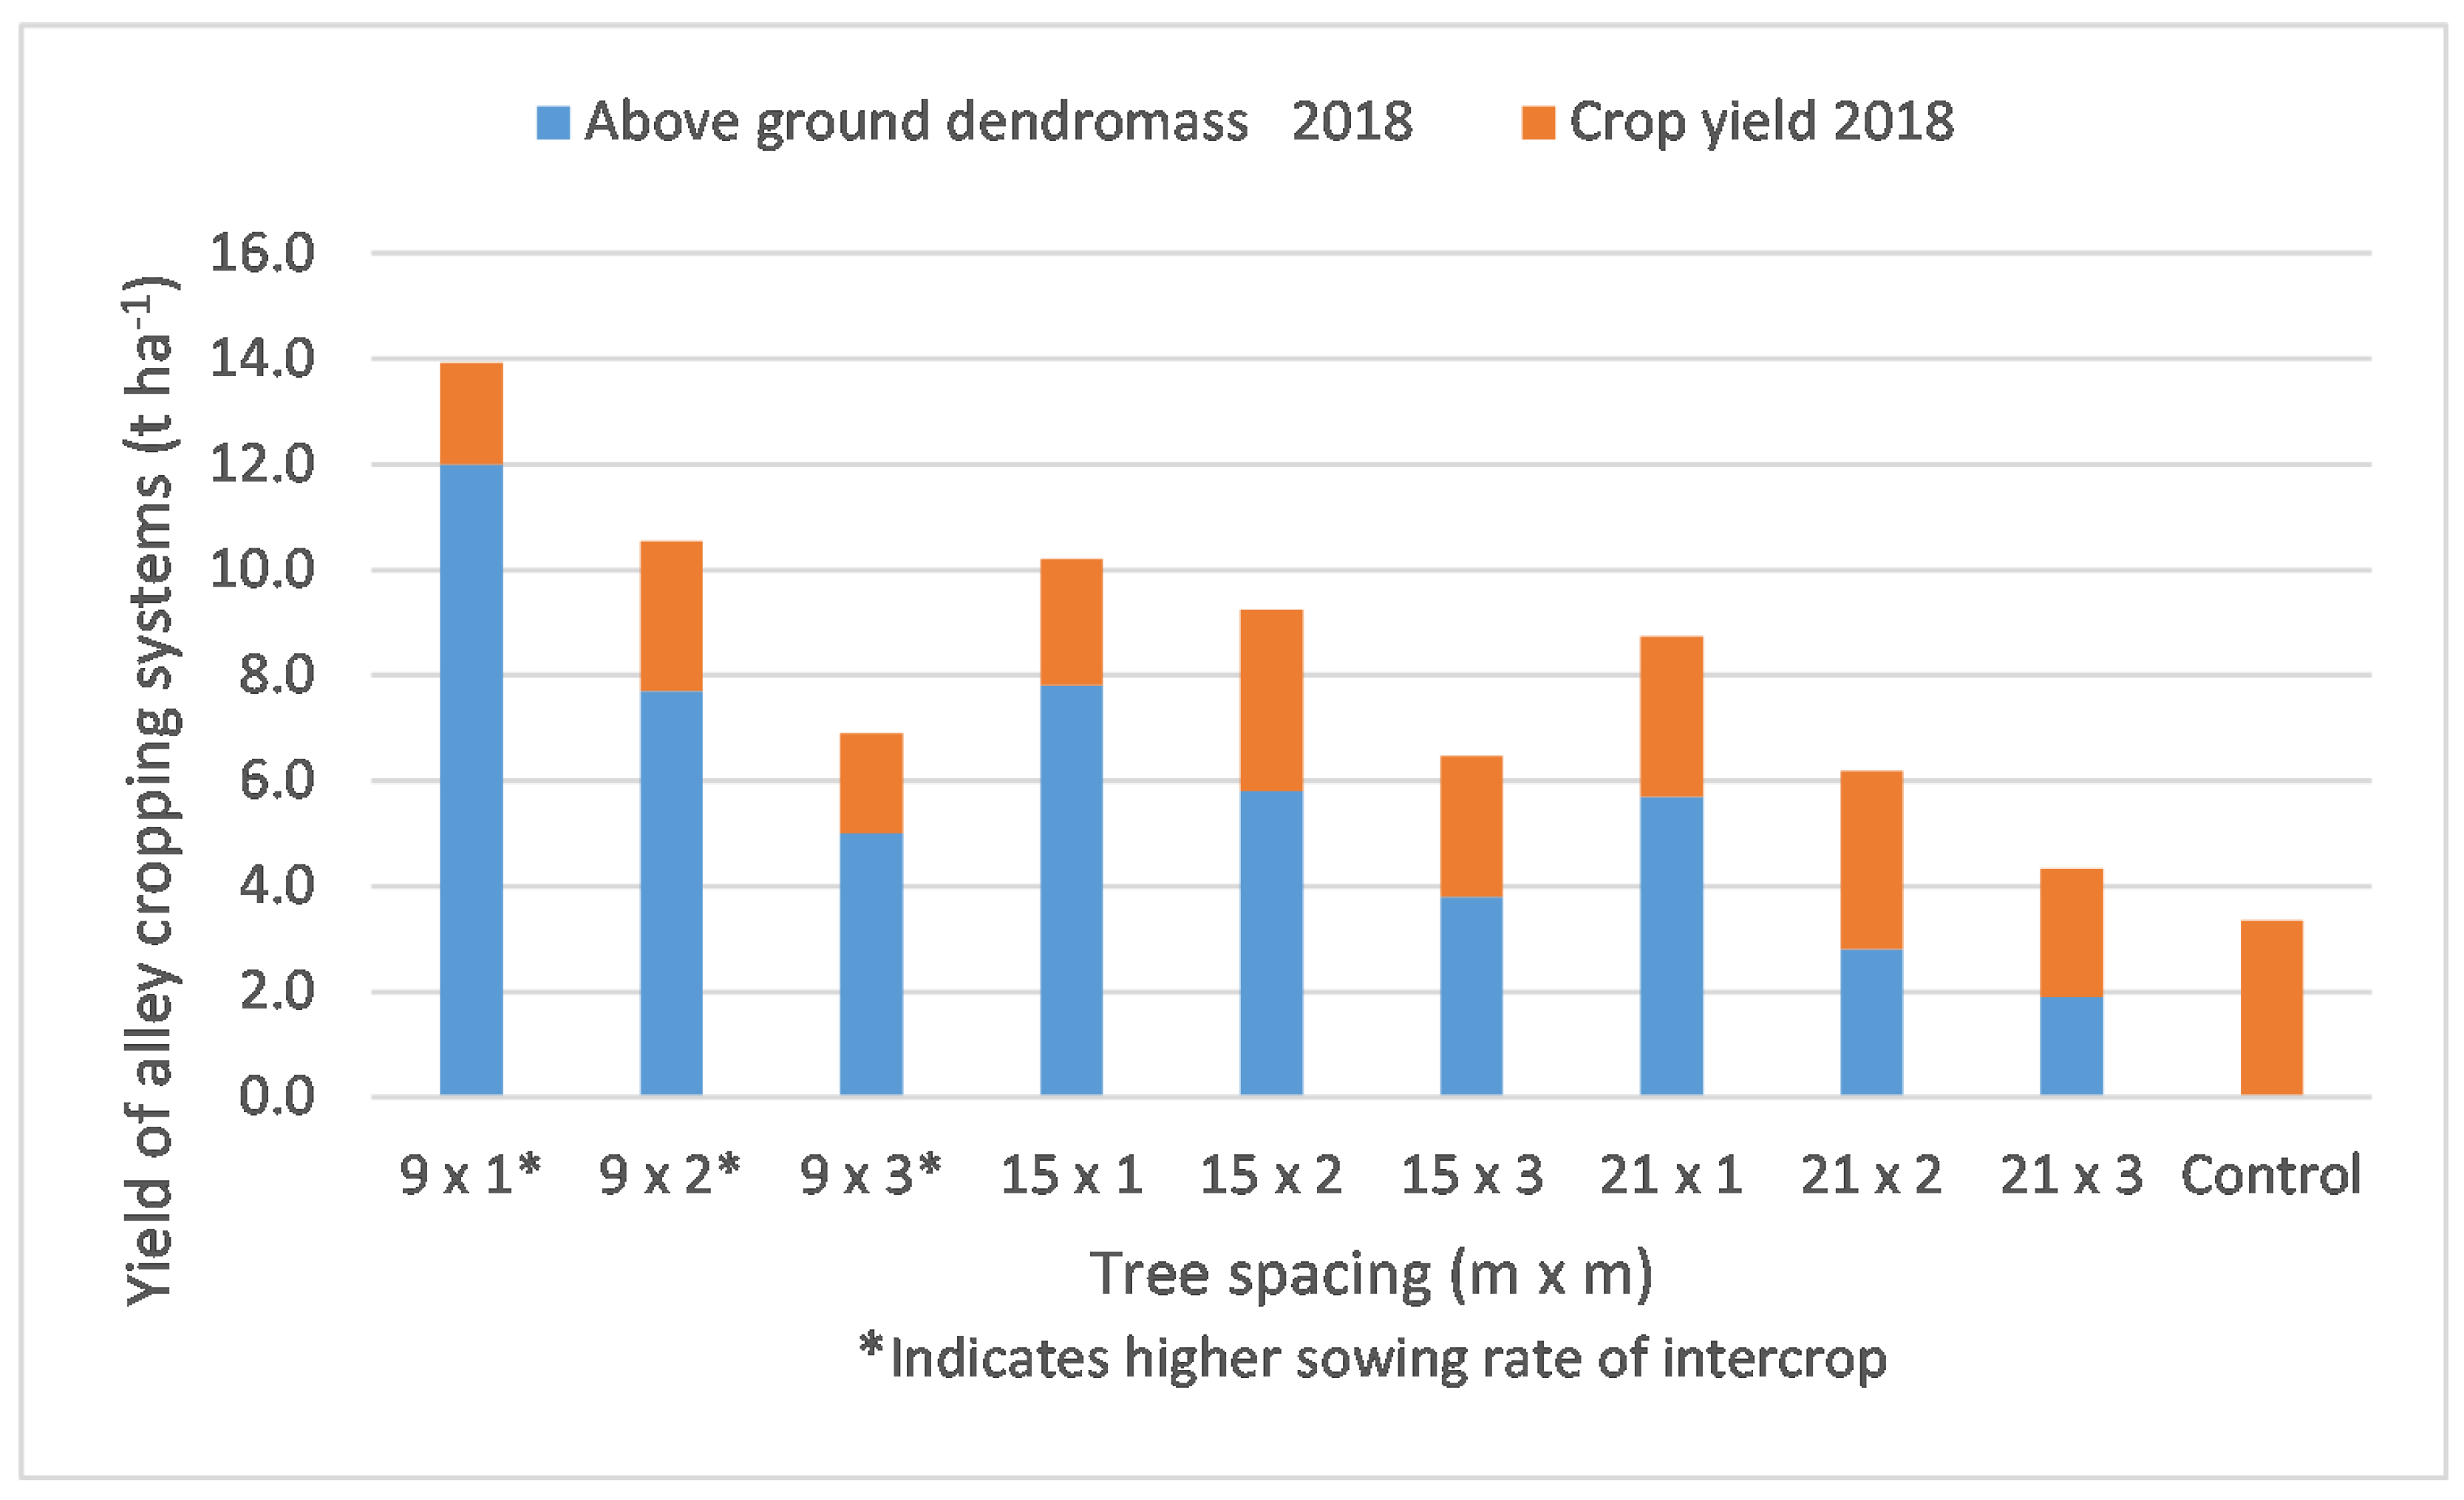
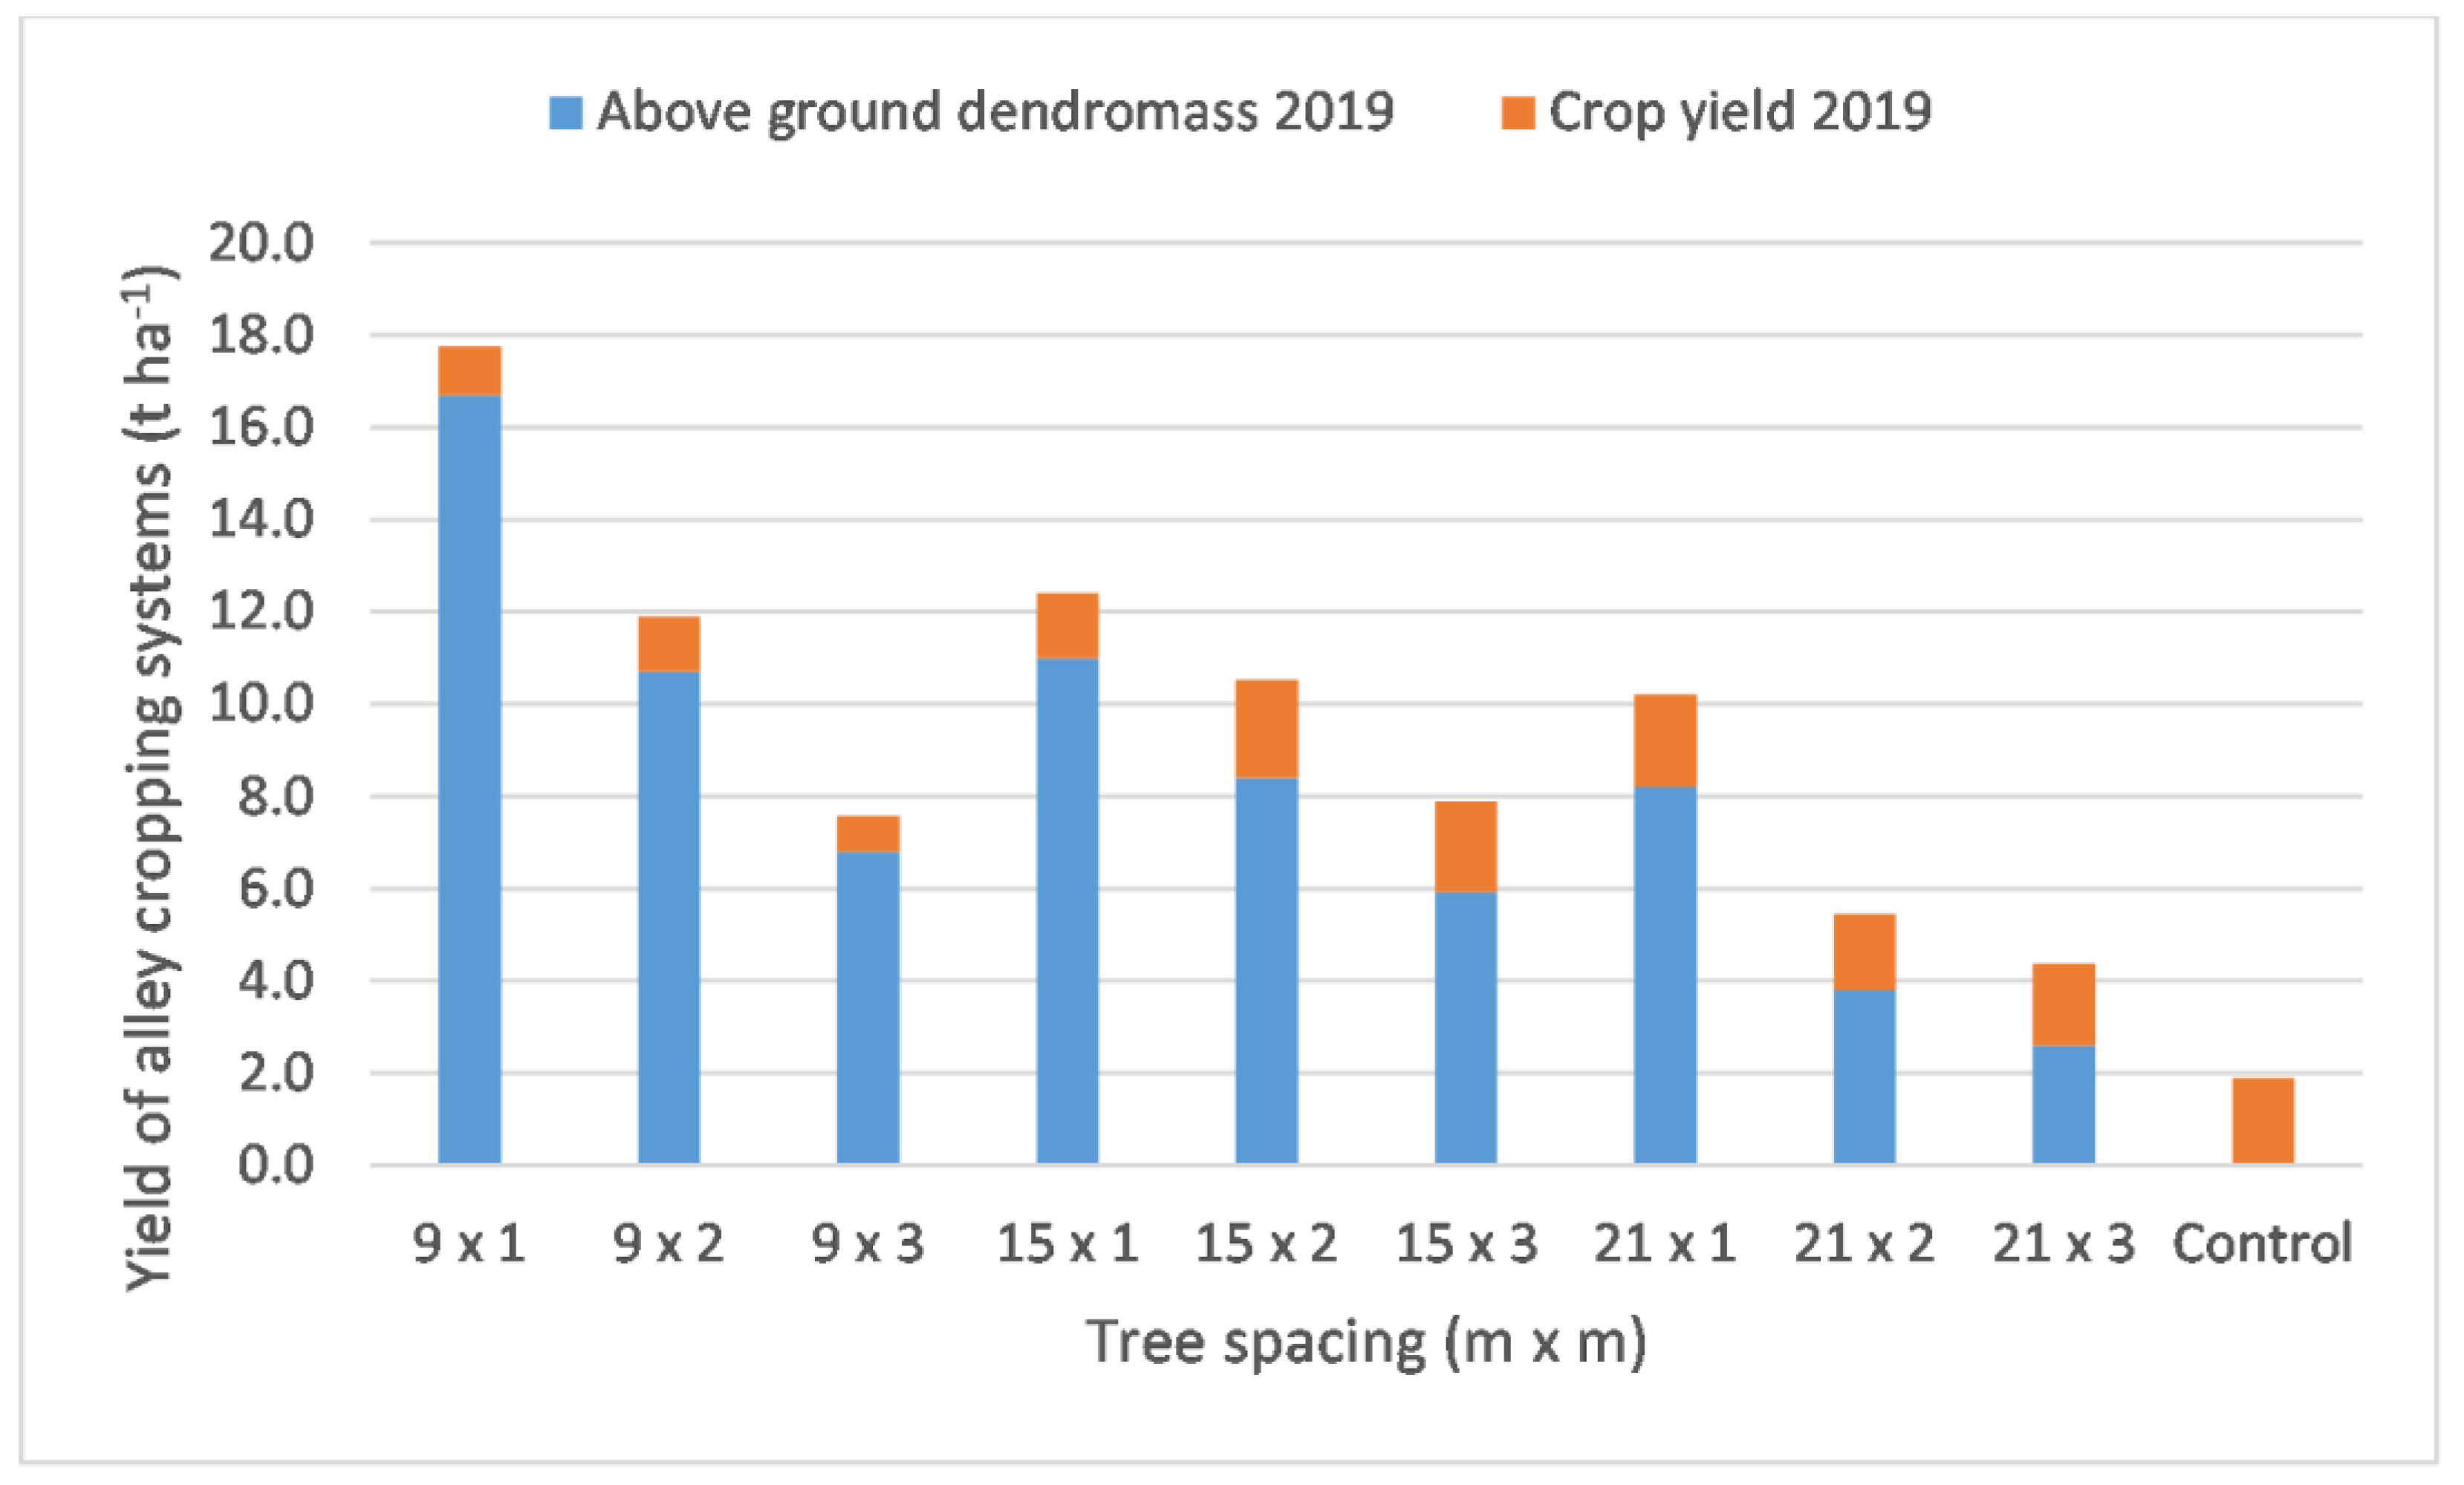
2.4. Yields of the Two Components Combined in an Alley Cropping System
2.5. Land Equivalent Ratio
3. Discussion
3.1. Tree Component
3.2. Crop Component
3.3. Evaluating the Alley Cropping Systems and LER
4. Conclusions
5. Materials and Methods
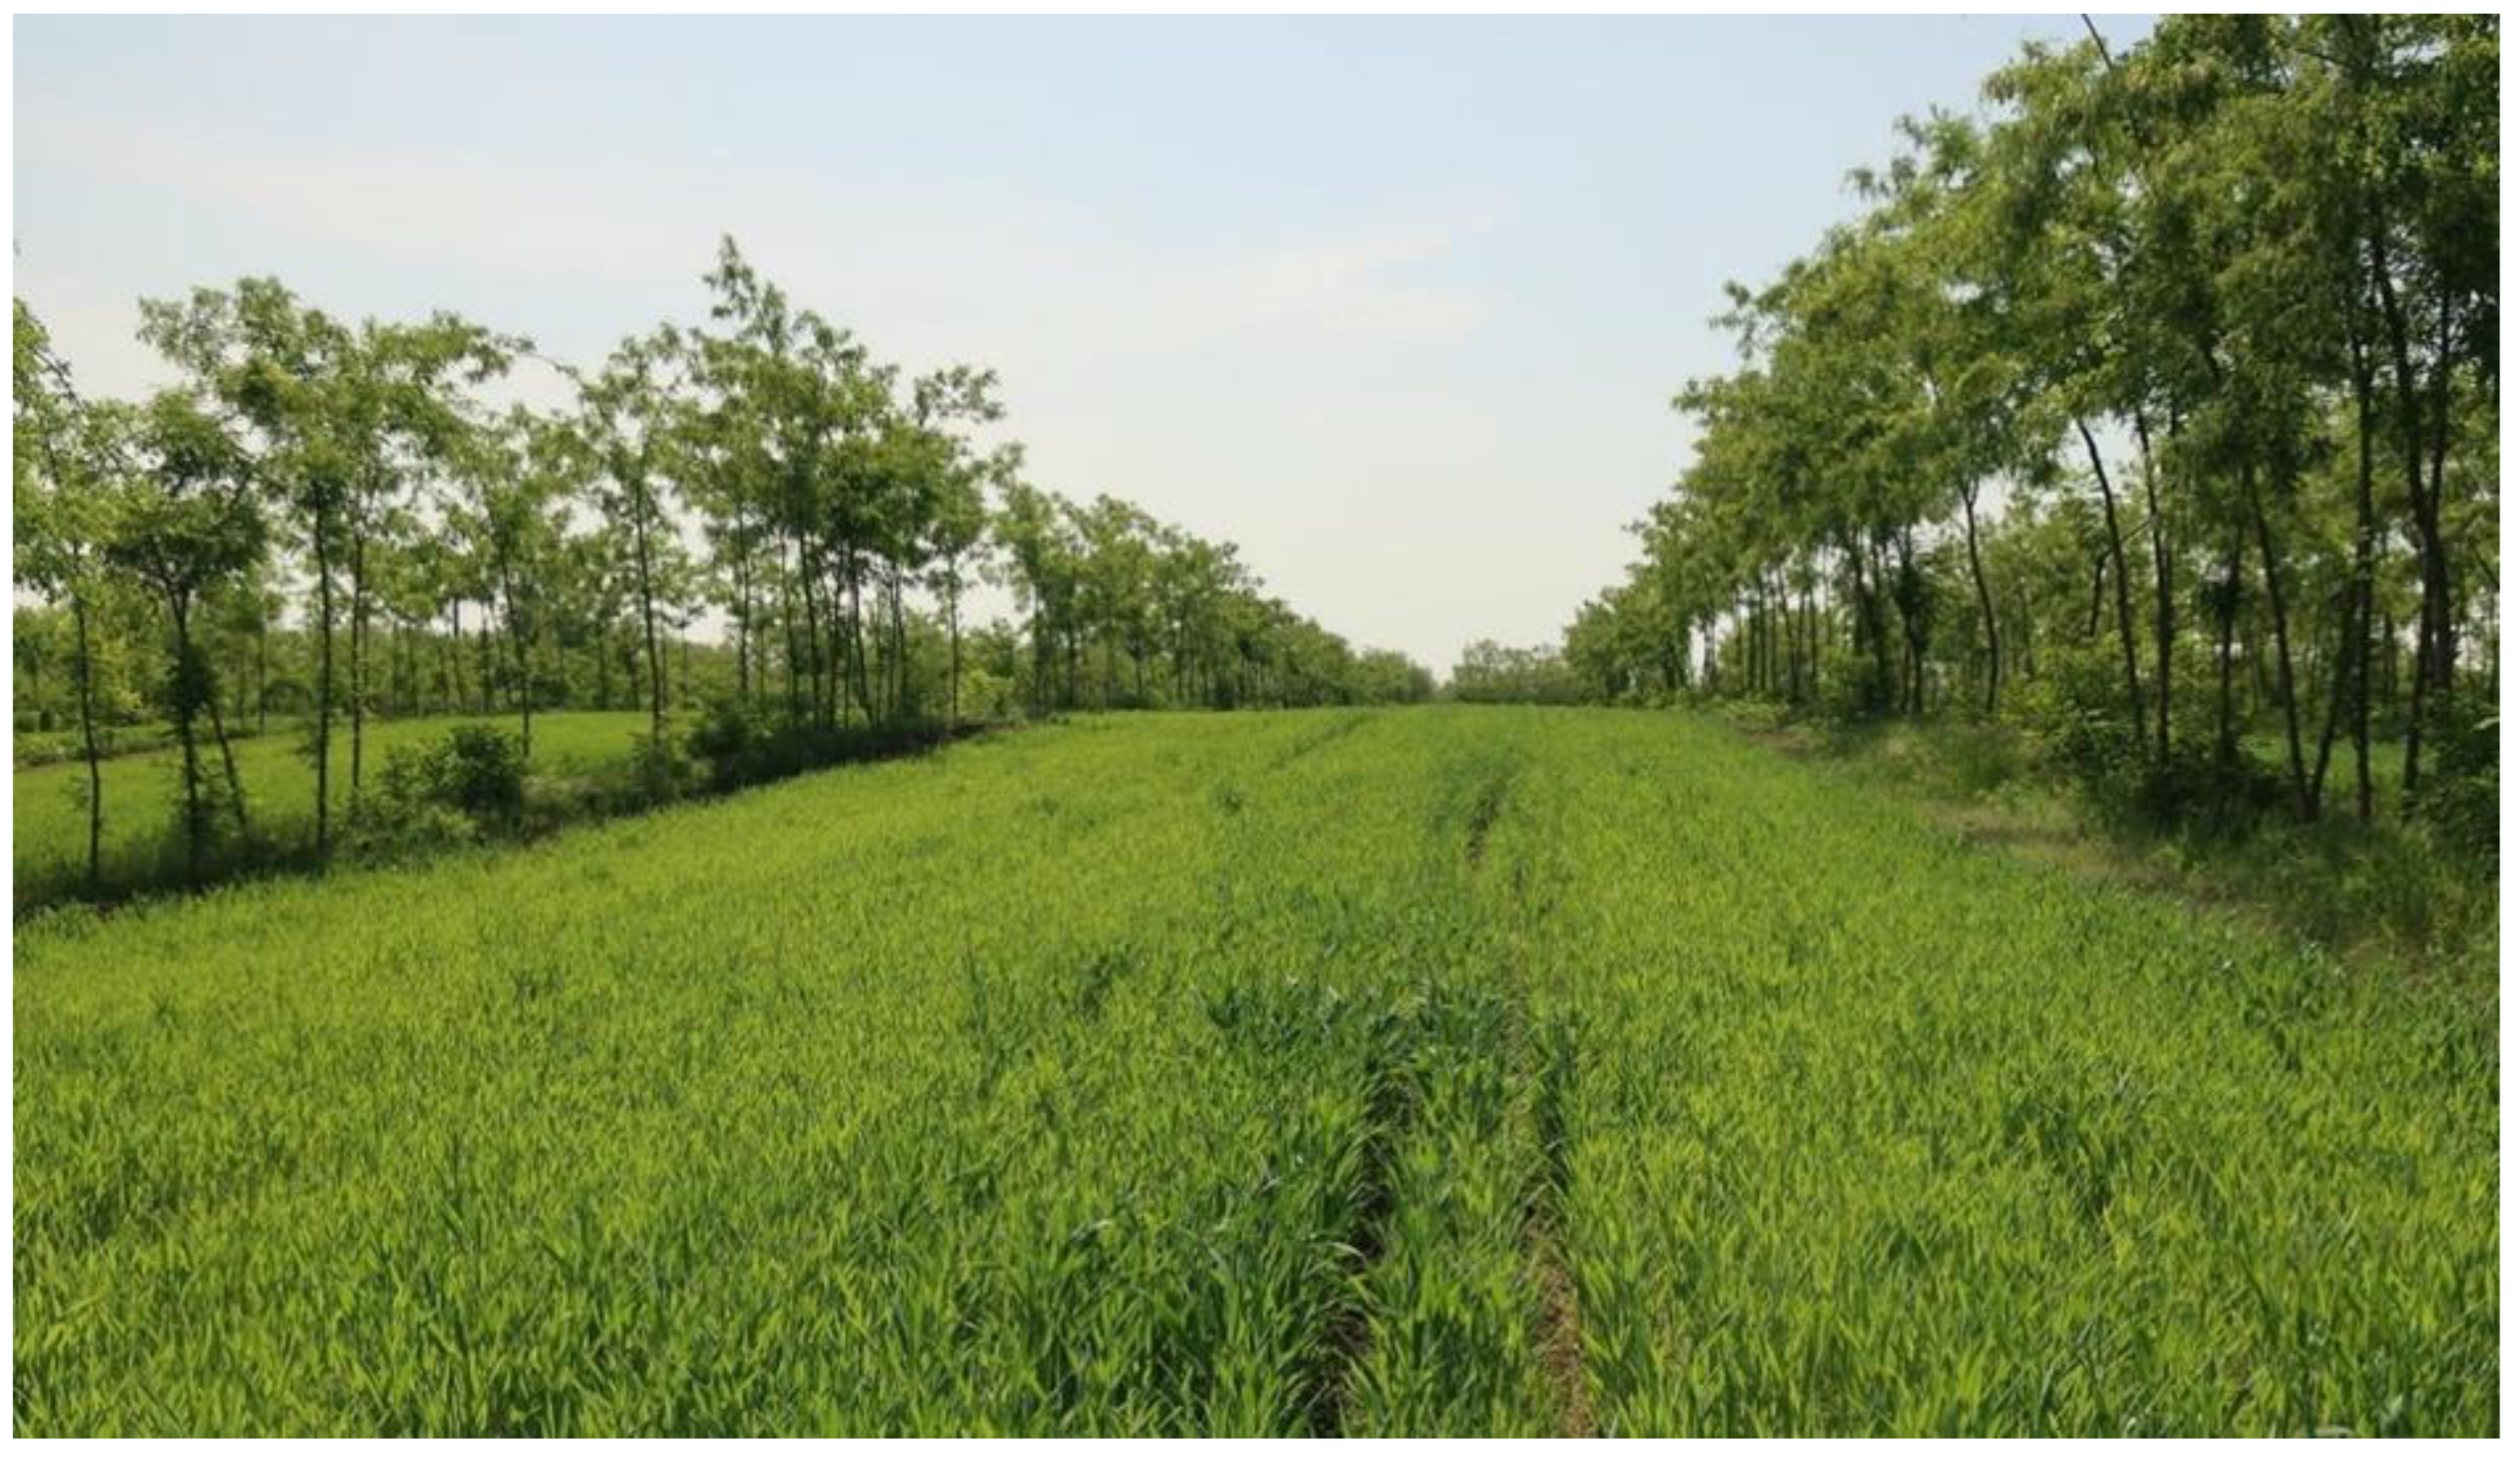
5.1. The Experimental Site
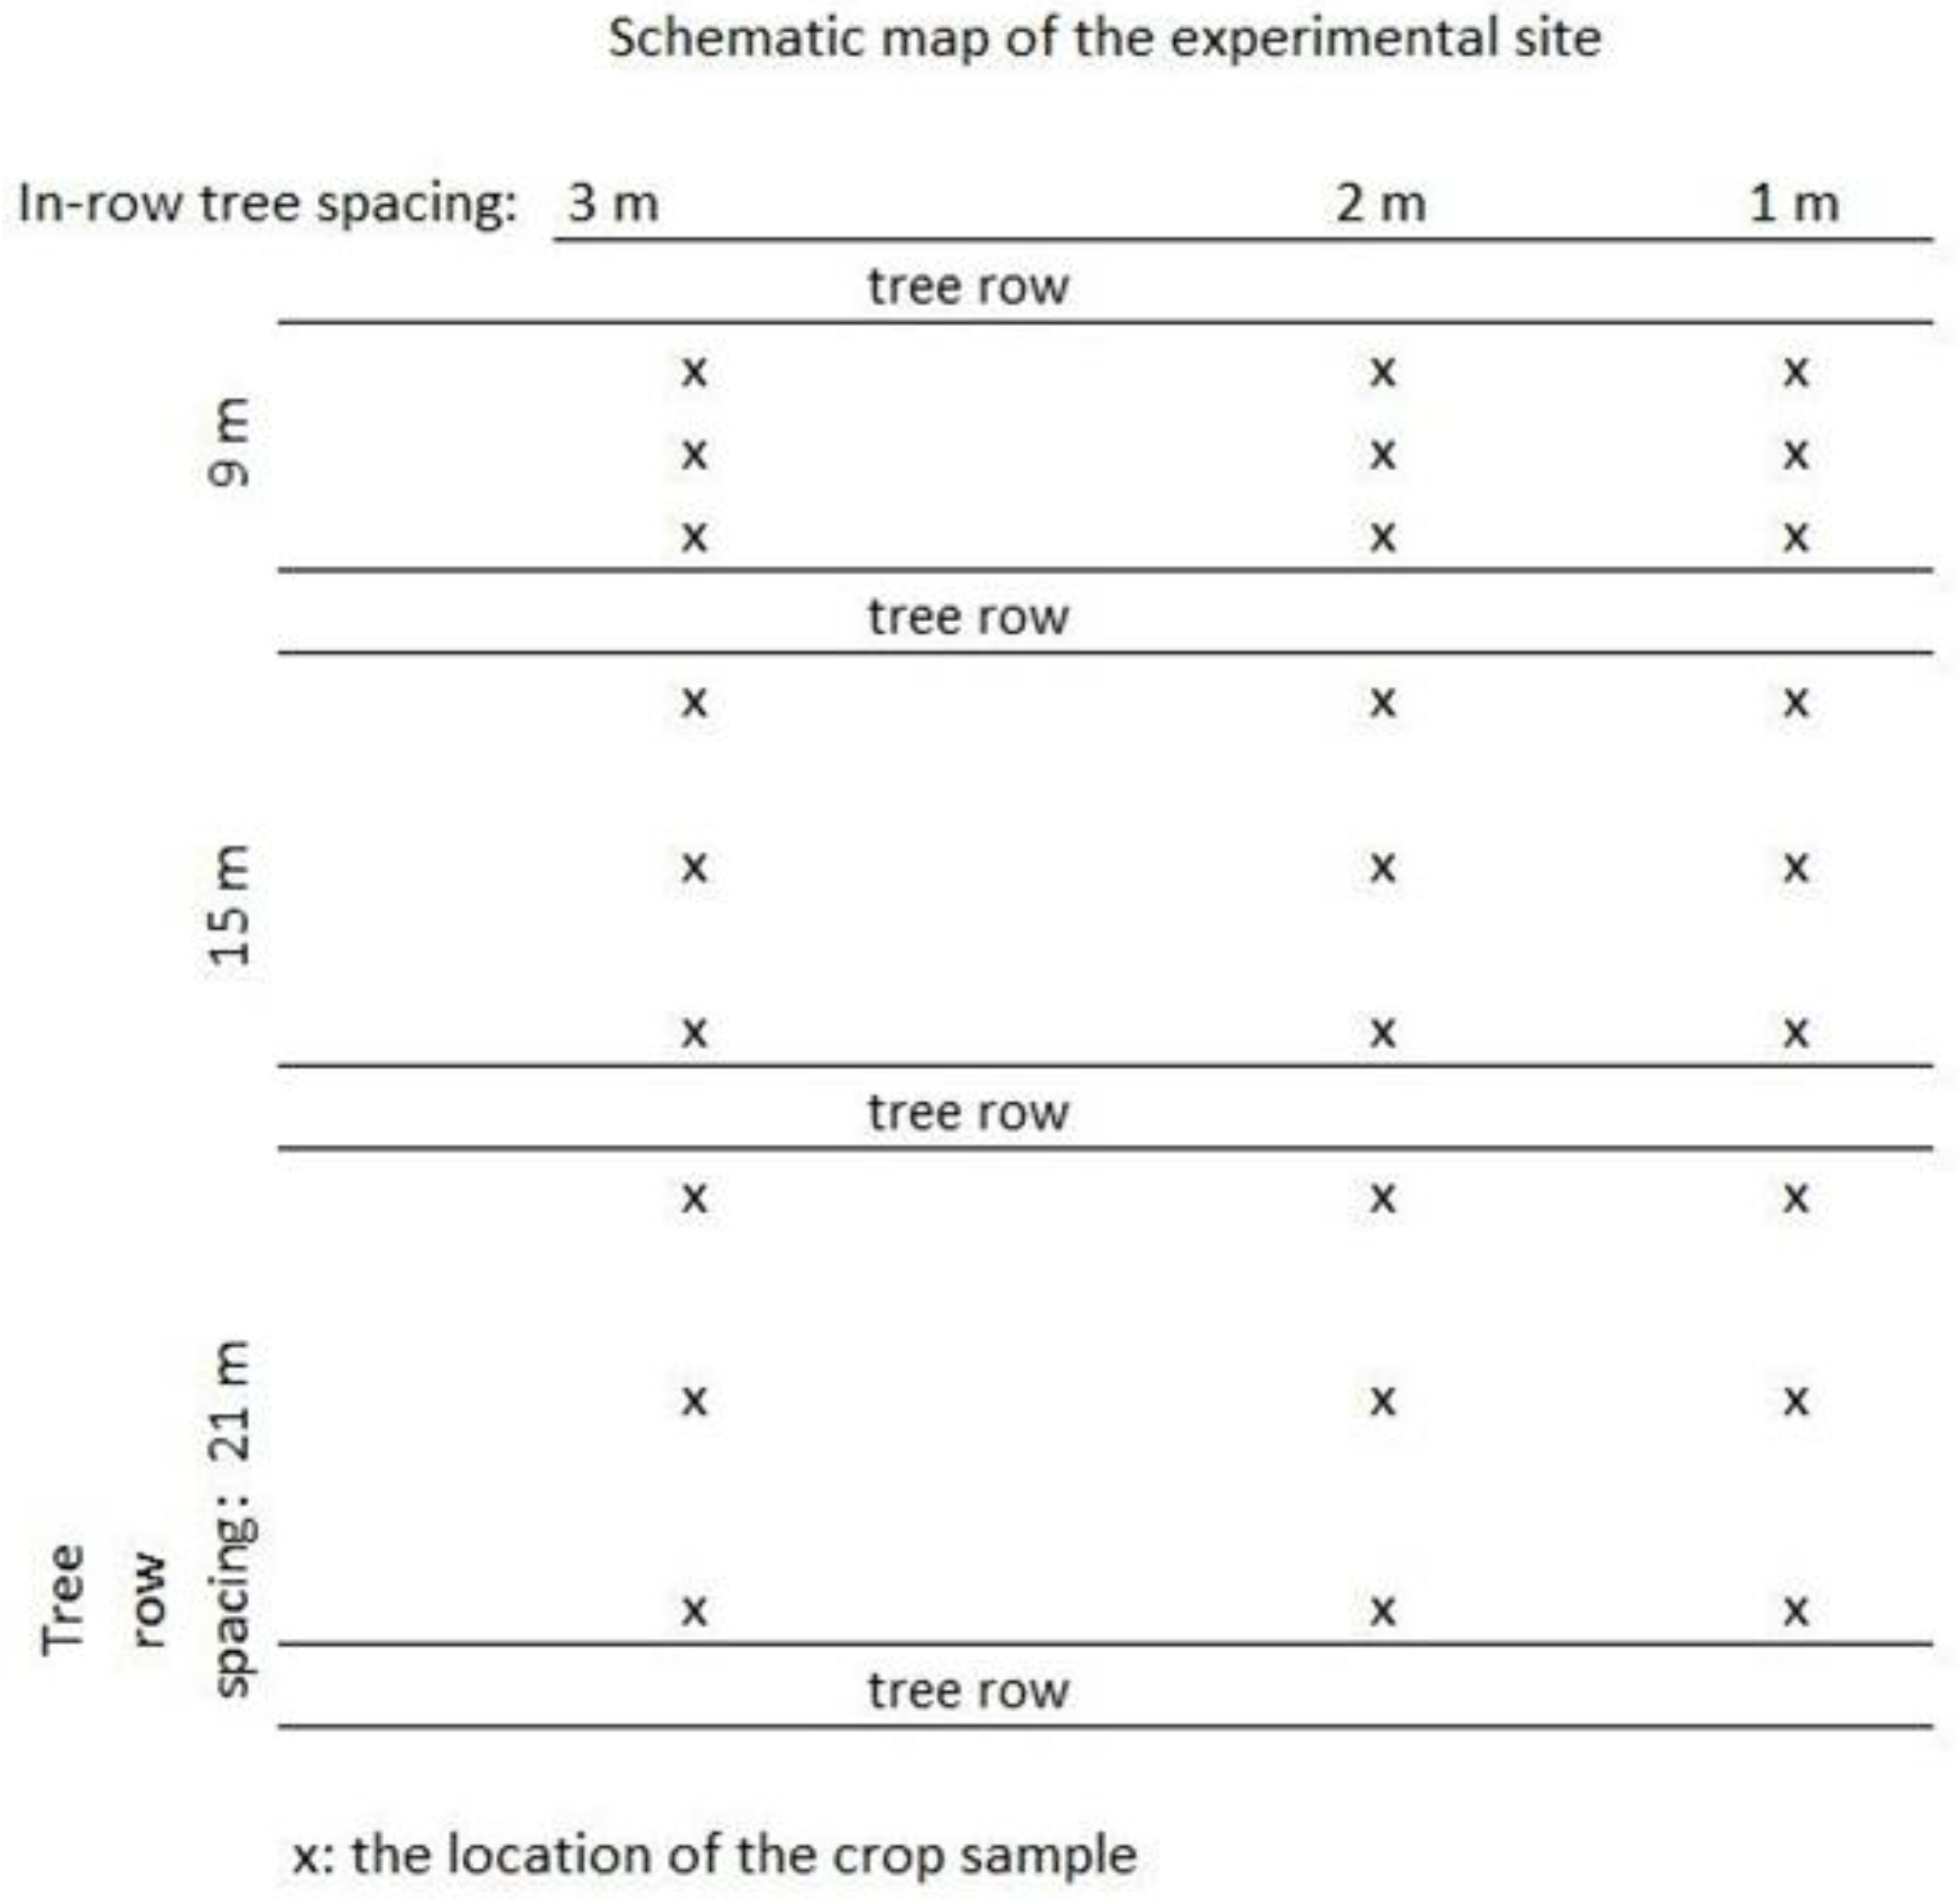
5.2. Experimental Design and Treatments
5.2.1. Black Locust Stands
5.2.2. Triticale
5.3. Sample Collection and Sample Preparation
5.3.1. Dendrometric Measures
5.3.2. Tree Volume and Tree Mass
5.3.3. Stand Volume and Above-Ground Dry Dendromass
5.3.4. Triticale Sample Collection
5.3.5. Triticale Yields
5.4. Defining the Features of Each Treatment
- Growing space (m2): the multiple of the row and in-row spacing of the trees;
- Number of trees (pcs ha−1): number of trees taking into account the requirement defined by the Hungarian Law of Forestry, which is to start planting 5 m away from the edge of the field, that would practically result in 8100 m2 for tree plantation;
- Width of tree row (m): un-sown strip 0.5 m to the west and 2.5 m to the east side of the trees;
- Length of tree row: based on the same principle as the number of trees, having 90 flow metre for planting, where 0 m and 90 m are the planting points of trees, of which an extra 0.5 m has to be left out of sowing for the protection of the trees (not to be damaged by machinery);
- Number of tree rows: assuming that the length of all sides of the parcel are equal;
- Un-sown area (m2): the size of the area excluded from the sowing due to the tree rows;
- Ratio of sown area per hectare (%).
5.5. Land Equivalent Ratio
5.6. Statistical Analysis
Author Contributions
Funding
Data Availability Statement
Acknowledgments
Conflicts of Interest
Appendix A


References
- Zomer, R.J.; Neufeldt, H.; Xu, J.; Ahrends, A.; Bossio, D.; Trabucco, A.; van Noordwijk, M.; Wang, M. Global Tree Cover and Biomass Carbon on Agricultural Land: The Contribution of Agroforestry to Global and National Carbon Budgets. Sci. Rep. 2016, 6, 29987. [Google Scholar] [CrossRef] [PubMed]
- Gombač, P.; Trdan, S. The Efficacy of Intercropping with Birdsfoot Trefoil and Summer Savoury in Reducing Damage Inflicted by Onion Thrips (Thrips Tabaci, Thysanoptera, Thripidae) on Four Leek Cultivars. J. Plant Dis. Prot. 2014, 121, 117–124. [Google Scholar] [CrossRef]
- Santillano-Cázares, J.; Mendoza-Gómez, A.; Vázquez-Angulo, J.C.; Medina-Espinoza, E.; Ail-Catzim, C.E.; Núñez-Ramírez, F. The Compromise of Intercropping: Biological Pest Control Versus Competition by Crop Species. Southwest. Entomol. 2019, 44, 393. [Google Scholar] [CrossRef]
- Dufour, L.; Metay, A.; Talbot, G.; Dupraz, C. Assessing Light Competition for Cereal Production in Temperate Agroforestry Systems Using Experimentation and Crop Modelling. J. Agron. Crop Sci. 2013, 199, 217–227. [Google Scholar] [CrossRef]
- Nair, P.K.R. An Introduction to Agroforestry; Kluwer Academic Publishers in Cooperation with International Centre for Research in Agroforestry: Dordrecht, The Netherlands, 1993; ISBN 0792321340. [Google Scholar]
- Buck, L.E.; Lassoie, J.P.; Fernandes, E.C.M. (Eds.) Agroforestry in Sustainable Agricultural Systems; CRC Press: Boca Raton, FL, USA, 1998; ISBN 9780367802257. [Google Scholar]
- Mosquera-Losada, M.R.; Moreno, G.; Pardini, A.; McAdam, J.H.; Papanastasis, V.; Burgess, P.J.; Lamersdorf, N.; Castro, M.; Liagre, F.; Rigueiro-Rodríguez, A. Past, Present and Future of Agroforestry Systems in Europe. In Agroforestry—The Future of Global Land Use; Springer: Dordrecht, The Netherlands, 2012; Volume 9, pp. 285–312. [Google Scholar]
- Kreiter, S.; Amiri, K.; Douin, M.; Bohinc, T.; Trdan, S.; Tixier, M.-S. Phytoseiid Mites of Slovenia (Acari: Mesostigmata): New Records and First Description of the Male of Amblyseius Microorientalis. Acarologia 2020, 60, 203–242. [Google Scholar] [CrossRef]
- Staton, T.; Walters, R.J.; Smith, J.; Girling, R.D. Evaluating the Effects of Integrating Trees into Temperate Arable Systems on Pest Control and Pollination. Agric. Syst. 2019, 176, 102676. [Google Scholar] [CrossRef]
- van der Werf, W.; Keesman, K.; Burgess, P.; Graves, A.; Pilbeam, D.; Incoll, L.D.; Metselaar, K.; Mayus, M.; Stappers, R.; van Keulen, H.; et al. Yield-SAFE: A Parameter-Sparse, Process-Based Dynamic Model for Predicting Resource Capture, Growth, and Production in Agroforestry Systems. Ecol. Eng. 2007, 29, 419–433. [Google Scholar] [CrossRef]
- Palma, J.H.N.; Graves, A.R.; Burgess, P.J.; Keesman, K.J.; van Keulen, H.; Mayus, M.; Reisner, Y.; Herzog, F. Methodological Approach for the Assessment of Environmental Effects of Agroforestry at the Landscape Scale. Ecol. Eng. 2007, 29, 450–462. [Google Scholar] [CrossRef]
- Vaccaro, C.; Six, J.; Schöb, C. Moderate Shading Did Not Affect Barley Yield in Temperate Silvoarable Agroforestry Systems. Agrofor. Syst. 2022, 96, 799–810. [Google Scholar] [CrossRef]
- Mosquera-Losada, M.R.; Santiago-Freijanes, J.J.; Pisanelli, A.; Rois-Díaz, M.; Smith, J.; den Herder, M.; Moreno-Marcos, G.; Lamersdorf, N.; Ferreiro-Domínguez, N.; Balaguer, F.; et al. How Can Policy Support the Uptake of Agroforestry in Europe? Agforward, 2017; deliverable. [Google Scholar]
- Ivezić, V.; Yu, Y.; van der Werf, W. Crop Yields in European Agroforestry Systems: A Meta-Analysis. Front. Sustain. Food Syst. 2021, 5, 606631. [Google Scholar] [CrossRef]
- Žalac, H.; Burgess, P.; Graves, A.; Giannitsopoulos, M.; Paponja, I.; Popović, B.; Ivezić, V. Modelling the Yield and Profitability of Intercropped Walnut Systems in Croatia. Agrofor. Syst. 2021. [Google Scholar] [CrossRef]
- Batish, D.R.; Kohli, R.K.; Jose, S.; Singh, H.P. Ecological Basis of Agroforestry; CRC Press: Boca Raton, FL, USA, 2007. [Google Scholar]
- Tsonkova, P.; Böhm, C.; Quinkenstein, A.; Freese, D. Ecological Benefits Provided by Alley Cropping Systems for Production of Woody Biomass in the Temperate Region: A Review. Agrofor. Syst. 2012, 85, 133–152. [Google Scholar] [CrossRef]
- Torralba, M.; Fagerholm, N.; Burgess, P.J.; Moreno, G.; Plieninger, T. Do European Agroforestry Systems Enhance Biodiversity and Ecosystem Services? A Meta-Analysis. Agric. Ecosyst. Environ. 2016, 230, 150–161. [Google Scholar] [CrossRef]
- Balandier, P.; Dupraz, C. Growth of Widely Spaced Trees. A Case Study from Young Agroforestry Plantations in France. Agrofor. Syst. 1998, 43, 151–167. [Google Scholar] [CrossRef]
- Seiter, S.; William, R.D.; Hibbs, D.E. Crop Yield and Tree-Leaf Production in Three Planting Patterns of Temperate-Zone Alley Cropping in Oregon, USA. Agrofor. Syst. 1999, 46, 273–288. [Google Scholar] [CrossRef]
- Khan, G.S.; Chaudhry, A.K. Effect of Spacing and Plant Density on the Growth of Poplar (Populus Deltoides) Trees under Agro-Forestry System. Pak. J. Agric. Sci. 2007, 44, 321–327. [Google Scholar]
- Gillespie, A.R.; Jose, S.; Mengel, D.B.; Hoover, W.L.; Pope, P.E.; Seifert, J.R.; Biehle, D.J.; Stall, T.; Benjamin, T.J. Defining Competition Vectors in a Temperate Alley Cropping System in the Midwestern USA; 1. Production Physiology. Agrofor. Syst. 2000, 48, 25–40. [Google Scholar] [CrossRef]
- Pardon, P.; Reubens, B.; Mertens, J.; Verheyen, K.; de Frenne, P.; de Smet, G.; van Waes, C.; Reheul, D. Effects of Temperate Agroforestry on Yield and Quality of Different Arable Intercrops. Agric. Syst. 2018, 166, 135–151. [Google Scholar] [CrossRef]
- Lamerre, J.; Schwarz, K.U.; Langhof, M.; von Wühlisch, G.; Greef, J.M. Productivity of Poplar Short Rotation Coppice in an Alley-Cropping Agroforestry System. Agrofor. Syst. 2015, 89, 933–942. [Google Scholar] [CrossRef]
- Dupraz, C.; Burgess, P.; Gavaland, A.; Graves, A.; Herzog, F.; Incoll, L.; Jackson, N.; Keesman, K.; Lawson, G.; Lecomte, I.; et al. Synthesis of the Silvorable Agroforestry for Europe Project; INRA-UMR System Editions: Montpellier, France, 2005; Volume 254. [Google Scholar]
- Rédei, K. Akác Sarjerdő-Gazdálkodás. (Management of Sprouted Black Locust Stands); NAIK ERTI: Sárvár, Hungary, 2015. (In Hungarian) [Google Scholar]
- Carrier, M.; Rhéaume Gonzalez, F.-A.; Cogliastro, A.; Olivier, A.; Vanasse, A.; Rivest, D. Light Availability, Weed Cover and Crop Yields in Second Generation of Temperate Tree-Based Intercropping Systems. Field Crops Res. 2019, 239, 30–37. [Google Scholar] [CrossRef]
- Seserman, D.M.; Freese, D.; Swieter, A.; Langhof, M.; Veste, M. Trade-Off between Energy Wood and Grain Production in Temperate Alley-Cropping Systems: An Empirical and Simulation-Based Derivation of Land Equivalent Ratio. Agriculture 2019, 9, 147. [Google Scholar] [CrossRef]
- Burgess, P.J.; Incoll, L.D.; Corry, D.T.; Beaton, A.; Hart, B.J. Poplar (Populus spp) Growth and Crop Yields in a Silvoarable Experiment at Three Lowland Sites in England. Agrofor. Syst. 2005, 63, 157–169. [Google Scholar] [CrossRef]
- Graves, A.R.; Burgess, P.J.; Palma, J.H.N.; Herzog, F.; Moreno, G.; Bertomeu, M.; Dupraz, C.; Liagre, F.; Keesman, K.; van der Werf, W.; et al. Development and Application of Bio-Economic Modelling to Compare Silvoarable, Arable, and Forestry Systems in Three European Countries. Ecol. Eng. 2007, 29, 434–449. [Google Scholar] [CrossRef]
- Krisztina, D. A Gödöllői-Dombság Általános Bemutatása. (General Introduction to the Gödöllő Hills). Tájökológiai Lapok 2007, 5, 213–223. (In Hungarian) [Google Scholar]
- Sopp, L.; Kolozs, L. Fatömegszámítási Táblázatok. Állami Erdészeti Szolgálat. (Forestry Yield Tables. State Forestry Service); Mezőgazdasági Kiadó: Budapest, Hungary, 2000. (In Hungarian) [Google Scholar]
- Sándor, M. Relationship of Modern Black Locust Management and Wood Quality. Academic Doctoral Dissertation; Hungarian Academy of Sciences: Budapest, Hungary, 1988. (In Hungarian) [Google Scholar]
- Mead, R.; Willey, R.W. The Concept of a ‘Land Equivalent Ratio’ and Advantages in Yields from Intercropping. Exp. Agric. 1980, 16, 217–228. [Google Scholar] [CrossRef]


| Tree Spacing (m × m) | Growing Space (m2) | Number of Trees (pcs ha−1) | Width of Tree Rows (m) | Length of Tree Rows (m) | Number of Tree Rows (pcs ha−1) | Un-Sown Area (m2) | Sown Area (m2) | Ratio of Sown Area per Hectare (%) |
|---|---|---|---|---|---|---|---|---|
| 9 × 3 | 27 | 341 | 3 | 91 | 11 | 3003 | 6997 | 70 |
| 9 × 2 | 18 | 506 | 3 | 91 | 11 | 3003 | 6997 | 70 |
| 9 × 1 | 9 | 1001 | 3 | 91 | 11 | 3003 | 6997 | 70 |
| 15 × 3 | 45 | 217 | 3 | 91 | 7 | 1911 | 8089 | 81 |
| 15 × 2 | 30 | 322 | 3 | 91 | 7 | 1911 | 8089 | 81 |
| 15 × 1 | 15 | 637 | 3 | 91 | 7 | 1911 | 8089 | 81 |
| 21 × 3 | 63 | 155 | 3 | 91 | 5 | 1365 | 8635 | 86 |
| 21 × 2 | 42 | 230 | 3 | 91 | 5 | 1365 | 8635 | 86 |
| 21 × 1 | 21 | 455 | 3 | 91 | 5 | 1365 | 8635 | 86 |
| Control | - | 0 | - | - | - | - | 10,000 | 100 |
| Growing Space (m2) | Tree Space (m × m) | Average Tree Volume (m3) | Average Dry Mass (kg) | ||
|---|---|---|---|---|---|
| 2018 | 2019 | 2018 | 2019 | ||
| 9 | 9 × 1 | 0.017 | 0.023 | 12.0 a | 16.7 A |
| 15 | 15 × 1 | 0.017 | 0.024 | 12.2 a b | 17.3 A B |
| 18 | 9 × 2 | 0.021 | 0.029 | 15.2 a b | 21.0 A B |
| 21 | 21 × 1 | 0.017 | 0.025 | 12.4 a b | 17.9 A B |
| 27 | 9 × 3 | 0.020 | 0.028 | 14.6 a b | 20.0 A B |
| 30 | 15 × 2 | 0.025 | 0.036 | 18.0 b | 26.2 B |
| 42 | 21 × 2 | 0.017 | 0.023 | 12.2 a c | 16.5 A |
| 45 | 15 × 3 | 0.024 | 0.037 | 17.7 b c | 27.0 B |
| 63 | 21 × 3 | 0.017 | 0.023 | 12.5 a b | 17.0 A |
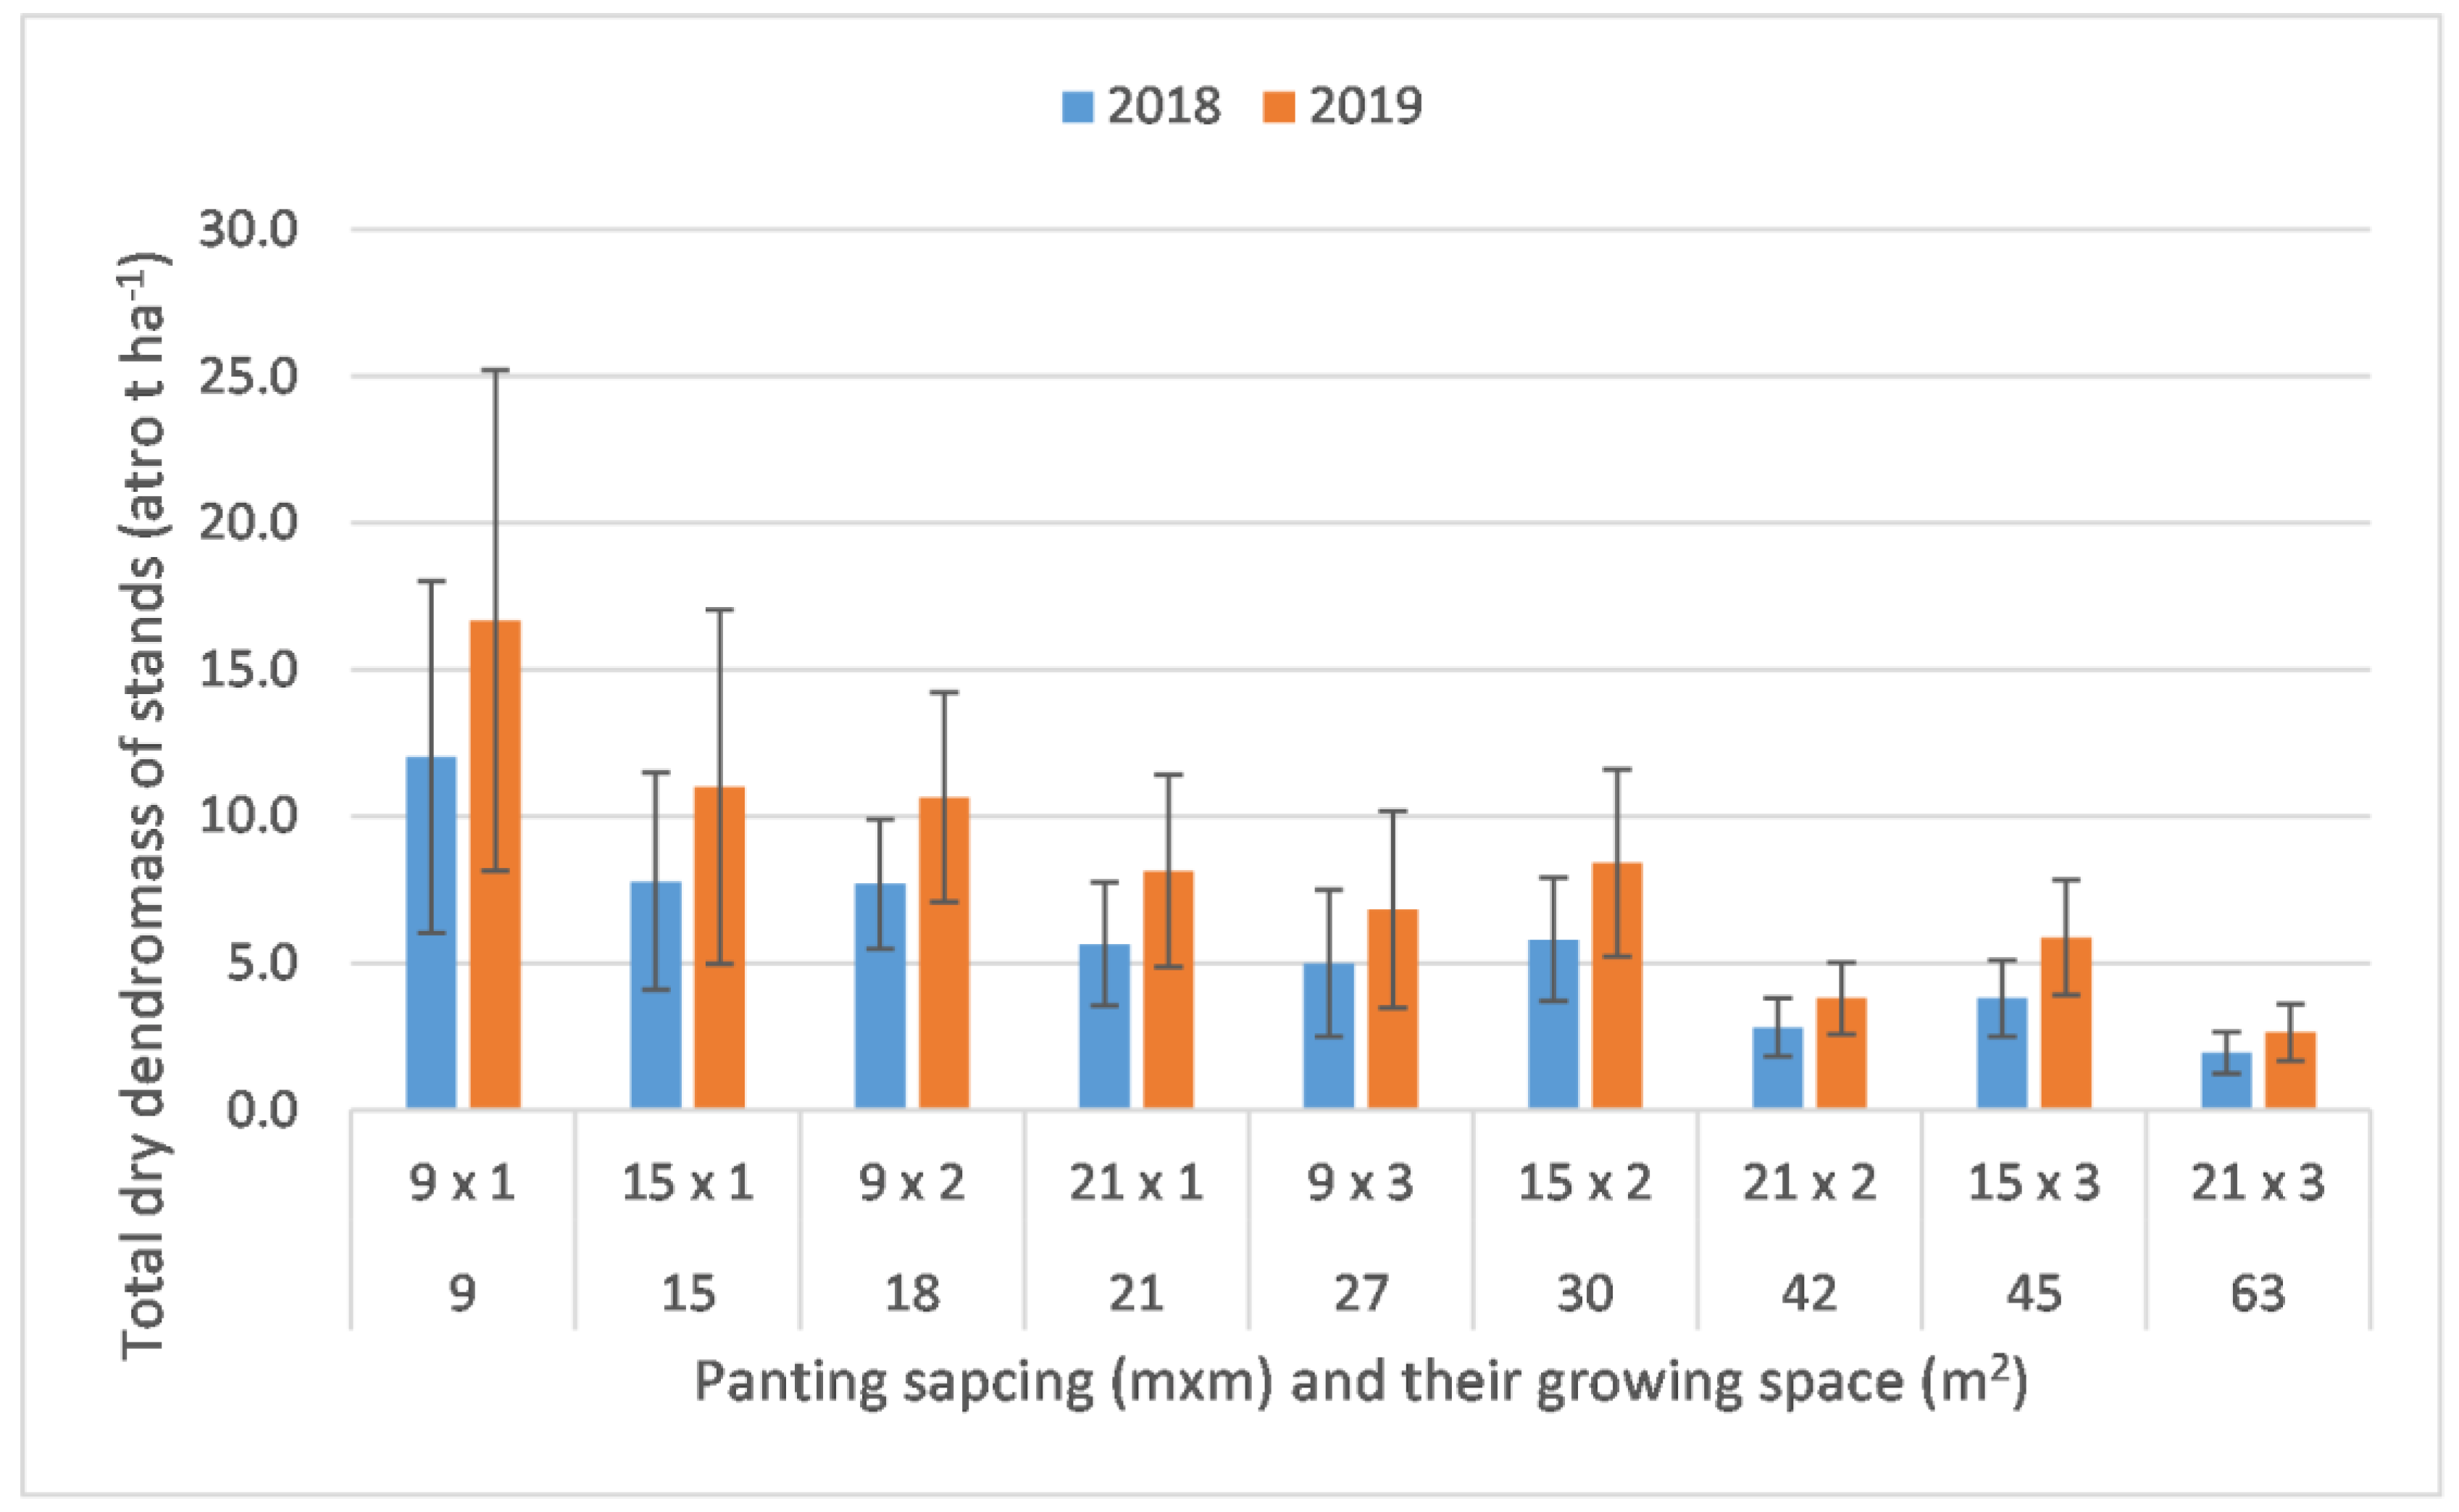
| Growing Space (m2) | Tree Spacing (m × m) | Total Volume (m3 ha−1) | Total Dry Dendromass of Stands (atro t ha−1) | ||
|---|---|---|---|---|---|
| 2018 | 2019 | 2018 | 2019 | ||
| 9 | 9 × 1 | 16.5 | 22.9 | 12.0 a | 16.7 A |
| 15 | 15 × 1 | 10.7 | 15.1 | 7.8 a, b, c | 11.0 A, B, C |
| 18 | 9 × 2 | 10.6 | 14.6 | 7.7 a, b | 10.7 A, B |
| 21 | 21 × 1 | 7.8 | 11.2 | 5.7 b, c | 8.2 B, C |
| 27 | 9 × 3 | 6.9 | 9.4 | 5.0 c | 6.8 C |
| 30 | 15 × 2 | 8.0 | 11.6 | 5.8 b, c | 8.4 A, C |
| 42 | 21 × 2 | 3.9 | 5.2 | 2.8 d | 3.8 D, E |
| 45 | 15 × 3 | 5.3 | 8.1 | 3.8 c, d | 5.9 C, D |
| 63 | 21 × 3 | 2.7 | 3.6 | 1.9 d | 2.6 E |
| Tree Spacing (m × m) | Number of Trees (pcs ha−1) | Sown Area (m2) | Mean DM Yield (g m−2) | Stand. Dev. Of Mean DM Yield (g m−2) | Mean DM Yield (t ha−1) | Stand. Dev. of Mean DM Yield (t ha−1) | ||||
|---|---|---|---|---|---|---|---|---|---|---|
| 2018 | 2019 | 2018 | 2019 | 2018 | 2019 | 2018 | 2019 | |||
| 9 × 1 | 1001 | 6997 | 274.4 * | 150.8 E | 122.2 | 60.74 | 1.92 * | 1.06 | 0.9 | 0.4 |
| 9 × 2 | 506 | 6997 | 407.8 * | 173.2 B E | 222.0 | 95.2 | 2.85 * | 1.21 | 1.6 | 0.7 |
| 9 × 3 | 341 | 6997 | 272.2 * | 110.9 F | 165.2 | 58.3 | 1.90 * | 0.78 | 1.2 | 0.4 |
| 15 × 1 | 637 | 8089 | 297.2 a c | 172.8 B E | 110.6 | 80.7 | 2.40 | 1.40 | 0.9 | 0.7 |
| 15 × 2 | 322 | 8089 | 425.8 b | 262.1 A | 147.3 | 104.5 | 3.44 | 2.12 | 1.2 | 0.8 |
| 15 × 3 | 217 | 8089 | 331.2 a c | 244.6 A B | 142.3 | 156.5 | 2.68 | 1.98 | 1.2 | 1.3 |
| 21 × 1 | 455 | 8635 | 352.2 a d | 232.2 A C | 167.8 | 121.6 | 3.04 | 2.01 | 1.4 | 1.1 |
| 21 × 2 | 230 | 8635 | 392.4 b d | 189.5 B C E | 141.1 | 100.2 | 3.39 | 1.64 | 1.2 | 0.9 |
| 21 × 3 | 155 | 8635 | 280.9 c | 206.0 B C D | 83.4 | 113.1 | 2.43 | 1.78 | 0.7 | 1.0 |
| Control | 0 | 10,000 | 335.1 a c | 192.6 A D E | 120.3 | 95.3 | 3.35 | 1.93 | 1.2 | 1.0 |
| Tree Spacing | LERcrop | LERforest | LERagroforestry |
|---|---|---|---|
| 15 × 2 | 1.08 | 0.27 | 1.35 |
| 21 × 1 | 1.03 | 0.26 | 1.29 |
| 15 × 3 | 1.01 | 0.18 | 1.19 |
| 9 × 1 | 0.50 | 0.57 | 1.07 |
| 15 × 1 | 0.71 | 0.36 | 1.07 |
| 21 × 3 | 0.91 | 0.08 | 0.99 |
| 21 × 2 | 0.84 | 0.12 | 0.96 |
| 9 × 2 | 0.58 | 0.36 | 0.94 |
| 9 × 3 | 0.37 | 0.27 | 0.64 |
| Tree in-Row Spacing (m) | Control | |||
|---|---|---|---|---|
| Tree Row Spacing (m) | 1 | 2 | 3 | No Trees |
| 9 | 9 × 1 (9 m2) | 9 × 2 (18 m2) | 9 × 3 (27 m2) | FS (Full Sun) |
| 15 | 15 × 1 (15 m2) | 15 × 2 (30 m2) | 15 × 3 (45 m2) | |
| 21 | 21 × 1 (21 m2) | 21 × 2 (42 m2) | 21 × 3 (63 m2) | |
| 2018 | 2019 | |
|---|---|---|
| Date of sowing | 20 October 2017 | 10 October 2018 |
| Sowing rate | 220 kg ha−1 at 9 m row space treatments 180 kg ha−1 at the rest of the treatments | 220 kg ha−1 |
| Fertilization | not applicable | not applicable |
| Plant protection | not applicable | not applicable |
| Date of harvest | 9–12 July 2018 | 8–11 July 2019 |
Disclaimer/Publisher’s Note: The statements, opinions and data contained in all publications are solely those of the individual author(s) and contributor(s) and not of MDPI and/or the editor(s). MDPI and/or the editor(s) disclaim responsibility for any injury to people or property resulting from any ideas, methods, instructions or products referred to in the content. |
© 2023 by the authors. Licensee MDPI, Basel, Switzerland. This article is an open access article distributed under the terms and conditions of the Creative Commons Attribution (CC BY) license (https://creativecommons.org/licenses/by/4.0/).
Share and Cite
Honfy, V.; Pödör, Z.; Keserű, Z.; Rásó, J.; Ábri, T.; Borovics, A. The Effect of Tree Spacing on Yields of Alley Cropping Systems—A Case Study from Hungary. Plants 2023, 12, 595. https://doi.org/10.3390/plants12030595
Honfy V, Pödör Z, Keserű Z, Rásó J, Ábri T, Borovics A. The Effect of Tree Spacing on Yields of Alley Cropping Systems—A Case Study from Hungary. Plants. 2023; 12(3):595. https://doi.org/10.3390/plants12030595
Chicago/Turabian StyleHonfy, Veronika, Zoltán Pödör, Zsolt Keserű, János Rásó, Tamás Ábri, and Attila Borovics. 2023. "The Effect of Tree Spacing on Yields of Alley Cropping Systems—A Case Study from Hungary" Plants 12, no. 3: 595. https://doi.org/10.3390/plants12030595
APA StyleHonfy, V., Pödör, Z., Keserű, Z., Rásó, J., Ábri, T., & Borovics, A. (2023). The Effect of Tree Spacing on Yields of Alley Cropping Systems—A Case Study from Hungary. Plants, 12(3), 595. https://doi.org/10.3390/plants12030595