Abstract
Mango (Mangifera indica) is an economically important fruit tree, and is cultivated in tropical, subtropical, and dry-hot valley areas around the world. Mango fruits have high nutritional value, and are mainly consumed fresh and used for commercial purposes. Mango is affected by various environmental factors during its growth and development. The MYB transcription factors participates in various physiological activities of plants, such as phytohormone signal transduction and disease resistance. In this study, 54 MiMYB transcription factors were identified in the mango genome (371.6 Mb). A phylogenetic tree was drawn based on the amino acid sequences of 222 MYB proteins of mango and Arabidopsis. The phylogenetic tree showed that the members of the mango MYB gene family were divided into 7 group, including Groups 1, -3, -4, -5, -6, -8, and -9. Ka/Ks ratios generally indicated that the MiMYBs of mango were affected by negative or positive selection. Quantitative real-time PCR showed that the transcription levels of MiMYBs were different under abiotic and biotic stresses, including salicylic acid, methyl jasmonate, and H2O2 treatments, and Colletotrichum gloeosporioides and Xanthomonas campestris pv. mangiferaeindicae infection, respectively. The transcript levels of MiMYB5, -35, -36, and -54 simultaneously responded positively to early treatments with salicylic acid, methyl jasmonate, and H2O2. The transcript level of MiMYB54 was activated by pathogenic fungal and bacterial infection. These results are beneficial for future interested researchers aiming to understand the biological functions and molecular mechanisms of MiMYB genes.
1. Introduction
Mango (Mangifera indica L., 2n = 40) is an economically important evergreen fruit tree in the Anacardiaceae family [1,2]. In 2020, the global production of mangoes, mangosteens, and guavas yielded 5.71 million hectares, 57.3 million tons (http://www.fao.org/faostat/, accessed on 1 October 2022). In China, the cultivation of fresh mango has been practiced on a considerable scale for many years. Mango is affected by various environmental factors during its growth and development. Plant transcription factors contain special structures that can combines cis-acting elements of stress-related genes to regulate plant responses to abiotic and biotic stresses [3]. Plant growth and development are controlled by multigene families and superfamilies. The MYB transcription factor family exists in a variety of plants and is also one of the larger transcription factor families in all plants [4,5]. The first MYB gene identified in plants was the Zea mays C1 gene [6]. MYB transcription factors participate in various physiological activities of plants, such as phytohormone signal transduction, disease resistance, and responses to biotic and abiotic stresses [5,7,8,9]. MYB proteins contain a highly conserved MYB DNA-binding domain at their N-terminus, which is approximately 50–53 amino acid residues in length, and typically contains one to four imperfect MYB repeats (SONT domains), named R1, R2, R3, and R4 [10].
Bioinformatics and publicly released whole genome have widely analyzed the number, classification, genetic structure, and evolutionary and expression modes of MYB genes, especially in plants [11]. To date, the plant transcription factor database (PlantTFDB, http://planttfdb.gao-lab.org/index.php, accessed on 7 March 2021) contains approximately 22,032 MYB, and 15,369 MYB-related, sequences in 165 species, with 3–489 MYB members. These include Arabidopsis (Arabidopsis thaliana) and rice (Oryza sativa) [12], cotton (Gossypium hirsutum) [10], soybean (Glycine max) [13], apple (Malus pumila) [14], cassava (Manihot esculenta) [15], wheat (Triticum aestivum) [16], Populus trichocarpa [17], and Nicotiana tabacum [18]. However, due to the lack of a genome sequence, the MYB transcription factor of mango has not been identified. Recently, Wang et al. [2] and Li et al. [19], respectively, completed the genome-wide sequencing of mango and obtained genome-wide information with a size of 371.6 Mb and 20 chromosomes. The release of the mango chromosome-scale reference genome provides a basis for future research.
To identify the MiMYBs in mango, using PlantTFDB to search for proteins with the characteristic domains of the plant MYB transcription factors [20]. 54 MiMYBs were identified and subsequently subjected to systematic analyses, including phylogenetic tree analysis, conserved motifs identification, and expression profiles in response to abiotic and biotic stress treatments. The results of our study provide information that could be fundamental to determining the molecular and regulatory mechanisms of MiMYB transcription factors in mango in disease resistance and stress response.
2. Results
2.1. Identification and Bioinformatics Analysis of MYB Transcription Factor Genes in Mango
In this study, 54 MiMYBs were identified in mango and renamed MiMYB1 to MiMYB54 (Table S1, Text S1). Information on these MiMYBs and their corresponding proteins is shown in Table S1 and Text S2. The sizes of the deduced MiMYB proteins varied markedly from 197 amino acids (MiMYB32) to 1121 amino acids (MiMYB13). The corresponding molecular masses varied from 22.64 kDa (MiMYB32) to 125.84 kDa (MiMYB13) and the predicted isoelectric points (pI) varied from 4.87 (MiMYB43) to 9.67 (MiMYB25). The number of exons in MiMYBs varies from 2 to 12. Two exons interrupted by one intron and three exons interrupted by two introns were the most common structures, accounting for 44.44% and 33.33% of the total MiMYBs, respectively. MiMYB26 and MiMYB45 contain 12 exons and 11 introns (Table S1). These results show that the structures of MiMYBs are diverse.
2.2. Phylogenetic, Ka/Ks Analysis, and Synteny Analysis of MYB Transcription Factor Genes in Mango
To study the evolutionary relationships between mango MYB proteins and MYBs from Arabidopsis, a neighbor-joining (NJ) phylogenetic tree was created based on multiple alignments of the predicted amino acid sequences of the MYB domains from mango and Arabidopsis using ClustalX and MEGA 7.0 software (Figure 1). As shown in Figure 1, MYB proteins were classified into 13 groups with a branch length of 0.917 using MEGA 7.0. MiMYBs were distributed in Group 1, -3, -4, -5, -6, -8 and -9, respectively. Among the groups, Group 4 (20 members) and Group 1 (18 members) were the two largest groups and these two groups both represented more than 33% of the total MiMYB members. In contrast, six groups contained no MiMYB genes.
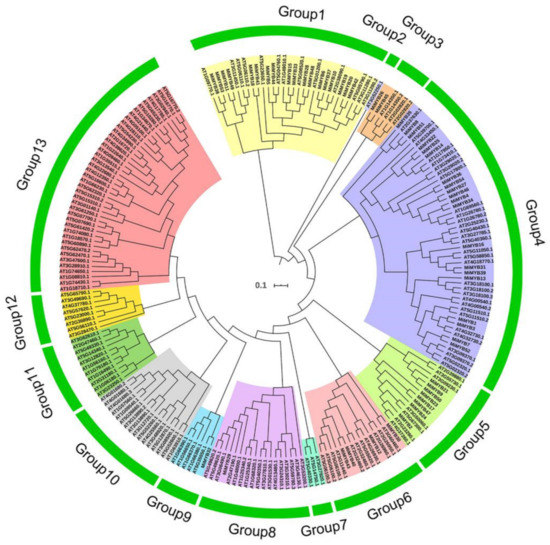
Figure 1.
Phylogenetic analysis of MYB proteins from mango and Arabidopsis. The neighbor-joining (NJ) phylogenetic tree was constructed with MYB domains of MYBs from mango (54 members) and Arabidopsis (168 members) using ClustalX and MEGA 7.0 software with 1000 bootstrap. The MYB proteins were grouped into 13 groups (1–13). ATs are the MYB proteins from Arabidopsis. MiMYBs are the MYB proteins from mango.
Because the ratio of Ka/Ks (synonymous/non-synonymous) is an important indicator of selection pressure occurring at the protein level, we evaluated the values of Ks and Ka as well as the ratio of Ka/Ks (Table S2). A total of 150 segmental duplicated gene pairs displayed Ka/Ks < 1, ranging from 0.32 to 1, with the mean values of Ka, Ks, and Ka/Ks being 2.26, 2.08, and 1.33, respectively. A total of 380 segmental duplicated gene pairs displayed Ka/Ks > 1, ranging from 1 to 2.08, with the mean values of Ka, Ks, and Ka/Ks being 2.70, 2.61, and 0.86, respectively. The Ka/Ks ratios generally indicated that the MiMYBs of mango were affected by negative or positive selection. To deduce the evolutionary relationship of MiMYB genes, syntenic analysis was performed for MiMYB genes using TBtools (Figure S1). The results showed that there are many synteny blocks between MiMYB genes in the mango genome. These data indicated that the MiMYB genes might have evolved from loss or duplication.
2.3. The Conserved Domains and Motifs Analysis of MYB Transcription Factors in Mango
To obtain detailed information about the structures of these MYB proteins in mango, the deduced amino acids collected from the NCBI were aligned, and the conserved domains were analyzed using Pfam and visualized using TBtools software. As shown in Figure 2, the MiMYB proteins contain Myb DNA binding, Myb DNA bind 6, DnaJ, Mur ligase M, Mur ligase C, and Myb Cef domains. Some of the MiMYB members had a single Myb DNA binding domain, such as MiMYB10, -18, or -44. However, MiMYB4, -5, -15, -28, -33, and -41 proteins contained two separate Myb DNA binding domains, which are located in the N-terminus and the middle of the protein. Analyses revealed that the MYB domains of mango were divergently distributed across the gene not only in the N-terminal, but also in the middle or C-terminal regions of the proteins, demonstrating the high diversity of amino acids.
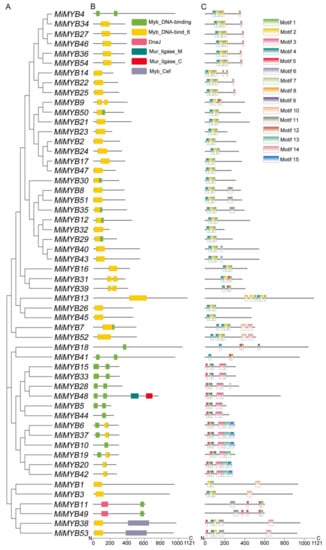
Figure 2.
Conserved domains and motif compositions of MYB proteins in mango. (A) Phylogenetic tree of MiMYB transcription factors. (B) Conserved domains of MiMYB transcription factors. Differently colored boxes represent different domains. (C) Conserved motifs for MiMYB proteins in mango. Different motifs were shown with different gradient-colored boxes and numbers (1–15). The gray lines represent the non-conserved sequences. The lengths of domains and motifs can be estimated using the scale at the bottom.
To further detect the structural features of mango MYBs, conserved motifs were analyzed according to their phylogenetic relationships. A total of 15 conserved motifs in mango MYBs were found with lengths of 11 to 50 amino acids, using MEME software and further visualization by TBtools. As shown in Figure 2, Motif 2 was a relatively conserved motif, being present in most of the family members which made up the core sequence of the single MYB domain. Motif 3 was a distinct motif with a conserved ‘SHAQKY’ sequence. These results indicate that although MiMYB transcription factors belonging to the same group are different, they also have shared identical or similar motif compositions.
2.4. Differential Expression of MiMYBs in Response to SA, MeJA, and H2O2 Treatments
The qRT-PCR primers of the MiMYB genes were designed via Primer 5.0 software and Primer3Plus to determine the optimal primers (Table S3, Text S1). Primer specificity was ensured through PCR and DNA agarose gel electrophoresis (Figure S2). To further investigate the potential functions of MiMYBs under abiotic stress conditions, cDNA samples were obtained using mango seedlings exposed to either SA, MeJA, or H2O2 stress for 0, 3, 6, 12, 24, 48, and 72 h. As shown in Figure 3 and Table S4, MiMYB32 and MiMYB36 showed an overall up-regulated trend at 7 time periods under SA treatment; however, MiMYB21 was not activated during this process. MiMYB5, -23, -24, -35, -39, -44, and -54 were up-regulated at 3–6 h after SA treatment. As shown in Figure 4 and Table S5, under MeJA treatment, seven genes (MiMYB2, -5, -7, -22, -25, -36, and -54) and two genes (MiMYB3 and MiMYB16) transcription levels were up-regulation and down-regulation, respectively. However, MiMYB21, -37, -38 were not activated during this process. MiMYB28, -32, -34, -35, and -44 were up-regulated at 3–6 h after MeJA treatment. As shown in Figure 5 and Table S6, under H2O2 treatment, the expression levels of the MiMYB35 and -54 genes were up-regulated at all time periods. Five MiMYBs (MiMYB21, -23, -25, -38, and -42) were not activated during this process. MiMYB3, -5, -6, -16, -17, -32, -36, -39, -40, -41, and -47 were up-regulated at 3–6 h after H2O2 treatment. In summary, MiMYB5, -35, -36, and -54 simultaneously responded positively to early treatments (3–6 h) of SA, MeJA, and H2O2. There was differential expression of some MiMYB members (MiMYB29, -34, -36, -39, and -54) in response to SA, MeJA, and H2O2 treatments (Figure 6). These results indicated that some of the MiMYBs showed transcriptional changes under abiotic stress.
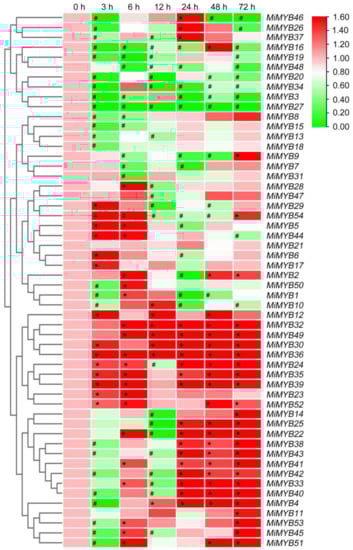
Figure 3.
Differential expression of MiMYBs in response to SA treatments. Relative transcript levels of MiMYBs in 5 mmol/L SA treatment at 0, 3, 6, 12, 24, 48, and 72 h. The relative transcript levels of MiMYBs in the no-treatment mango leaves (0 h) were normalized to 1.0. The color scale represents gene expression levels with high transcript levels (red) or low transcript levels (green). The calculation method was 2−∆∆CT, and ‘*’ means the value exceeds 1.5, while ‘#’ means the value is below 0.5.
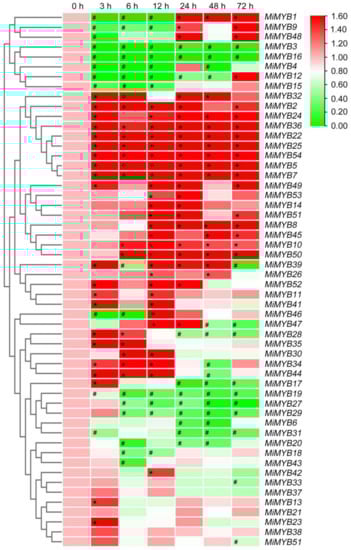
Figure 4.
Differential expression of MiMYBs in response to MeJA treatments. Relative transcript levels of MiMYBs in 5 mmol/L MeJA treatment at 0, 3, 6, 12, 24, 48, and 72 h. The relative transcript levels of MiMYBs in the no-treatment mango leaves (0 h) were normalized to 1.0. The color scale represents gene expression levels with high transcript levels (red) or low transcript levels (green). The calculation method was 2−∆∆CT, and ‘*’ means the value exceeds 1.5, while ‘#’ means the value is below 0.5.
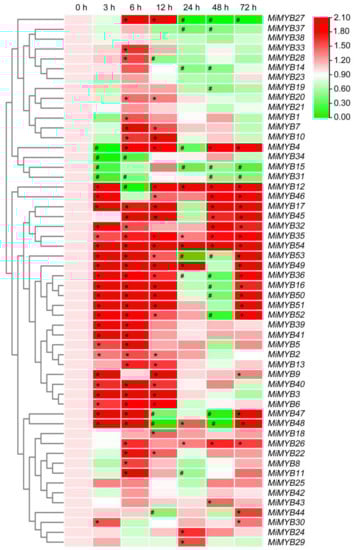
Figure 5.
Differential expression of MiMYBs in response to H2O2 treatments. Relative transcript levels of MiMYBs in 10 mmol/L H2O2 treatment at 0, 3, 6, 12, 24, 48, and 72 h. The relative transcript levels of MiMYBs in the no-treatment mango leaves (0 h) were normalized to 1.0. The color scale represents gene expression levels with high transcript levels (red) or low transcript levels (green). The calculation method was 2−∆∆CT, and ‘*’ means the value exceeds 1.5, while ‘#’ means the value is below 0.5.
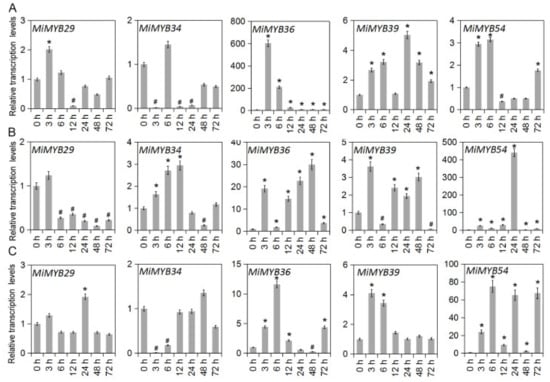
Figure 6.
Differential expression of MiMYB29, -34, -36, -39, -54 in response to SA, MeJA, and H2O2 treatments. (A) shows the results of the SA treatment, (B) shows the results of the MeJA treatment, and (C) shows the results of the H2O2 treatment. The calculation method was 2−∆∆CT, and ‘*’ means the value exceeds 1.5, while ‘#’ means the value is below 0.5.
2.5. Differential Expression of MiMYBs Profiles in Response to Pathogen Infection
To investigate the possible role of MiMYBs in plant-pathogen interactions, qRT-PCR was used to analyze the response of mango leaves infected with C. gloeosporioides and X. campestris pv. mangiferaeindicae in comparison to a control. In the process of C. gloeosporioides infecting mango leaves (Figure 7 and Table S7), the expression of three genes (MiMYB4, -39, -54) was up-regulated overall; however, MiMYB47 was not activated during this process. MiMYB2, -5, -6, -11, -44, and -50 were up-regulated at appressoria formation on leaves. As shown in Figure 8 and Table S8, the 9 genes (MiMYB2, -3, -5, -23, -25, -26, 36, -41, and -54) responded to the expression of X. campestris pv. mangiferaeindicae at all time points; however, MiMYB29 and MiMYB53 were not activated during this process. The transcript levels of MiMYB54 were activated by both pathogenic fungal and bacterial infection. There was differential expression of some MiMYB members (MiMYB29, -34, -36, -39, and -54) in response to C. gloeosporioides and X. campestris pv. mangiferaeindicae infection (Figure 9). The results showed that MiMYB genes had different expression pattern responses to pathogens at different infecting times.
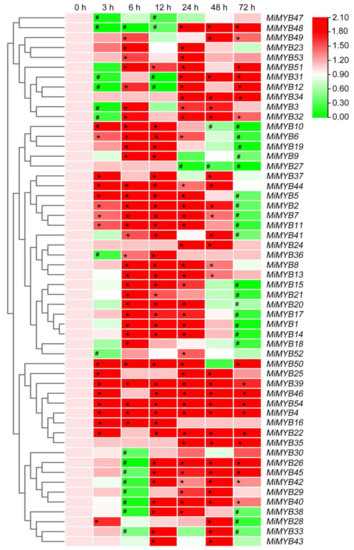
Figure 7.
Expression patterns of MiMYBs in response to C. gloeosporioides infection. Relative transcript levels of MiMYBs with 2 × 10⁶ conidiospores/mL C. gloeosporioides infected mango leaves by spray at 0, 3, 6, 12, 24, 48, and 72 h. The relative transcript levels of MiMYBs in the non-sprayed mango leaves (0 h) were normalized to 1.0. The color scale represents gene expression levels with high transcript levels (red) or low transcript levels (green). The calculation method was 2−∆∆CT, and ‘*’ means the value exceeds 1.5, while ‘#’ means the value is below 0.5.
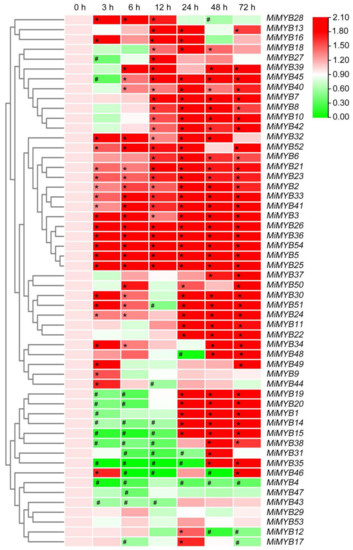
Figure 8.
Expression patterns of MiMYBs in response to X. campestris pv. mangiferaeindicae infection. Relative transcript levels of MiMYBs with 2 × 10⁷ CFU/mL X. campestris pv. mangiferaeindicae infected mango leaves by spray at 0, 3, 6, 12, 24, 48, and 72 h. The relative transcript levels of MiMYBs in the non-sprayed mango leaves (0 h) were normalized to 1.0. The color scale represents gene expression levels with high transcript levels (red) or low transcript levels (green). The calculation method was 2−∆∆CT, and ‘*’ means the value exceeds 1.5, while ‘#’ means the value is below 0.5.
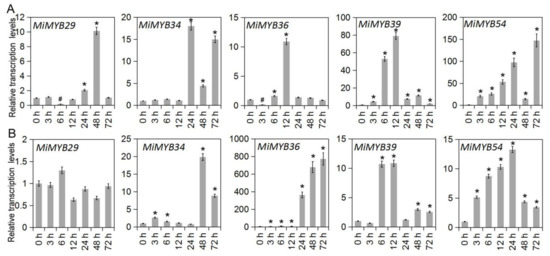
Figure 9.
Differential expression of MiMYB29, -34, -36, -39, -54 in response to pathogen infection. (A) shows the results of the C. gloeosporioides infection, and (B) shows the results of the X. campestris pv. mangiferaeindicae infection. The calculation method was 2−∆∆CT, and ‘*’ means the value exceeds 1.5, while ‘#’ means the value is below 0.5.
3. Discussion
The MYB transcription factor gene family is one of the largest transcription factor gene families in plants with special structures [5,21]. To date, although some studies have reported on MYB transcription factors in model plants and crops, there is still little information available on this family in the mango genome. Zheng et al. [22], Tafolla-Arellano et al. [23], and Zhang et al. [24], using different transcriptome data, analyzed for mango MYB transcription factors. Kanzaki and colleagues found that MiMYB1 regulates the light-dependent red coloration of the ‘Irwin’ mango fruit skin [25]. Recently, large-scale data sets describing the mango genome, transcriptome, and proteome have become available [2,19,23,26,27]. In this study, 54 MiMYB transcription factors were identified in the mango genome (371.6 Mb) at the genome-wide level, and were named MiMYB1 to MiMYB54, with 0.14 MYB per Mb genome size [2]. The phylogenetic relationships, conserved domains, motif composition, and expression profiles of MiMYBs were investigated systematically. In various plants, the number of MYB transcription factors are different; for instance, 198 MYBs were identified in Arabidopsis [28], 252 in G. max [29], and 524 in G. hirsutum [10]. Previous studies showed that the huge MYBs in plants are generated due to gene expansion [30]. Tandem and segmental duplications distribute and separate family members in the genome [31]. MiMYB proteins and Arabidopsis MYBs were not equally distributed into 13 different groups. In the phylogenetic tree, 54 MiMYBs exist in seven different groups, which indicates that MiMYBs are highly differentiated in the mango genome. One possible reason is that close MiMYBs in the phylogenetic tree are similar in MYB domains, but may not be in full-length amino acids or rest domains which may have other functions. Among them, the two largest groups (Group 1, Group 4) represented more than 33% of the total MiMYB members. This has been observed in sweet osmanthus (Osmanthus fragrans) [32] and soybeans (G. max) [29]. Members of the same group may have experienced common evolutionary origins and conserved functional domains [10]. The results for Ka/Ks further validate that most duplicated genes underwent negative or positive selection to reduce deleterious mutations, thus maintaining this gene subfamily’s members and possible expression. This is consistent with the results for other plants [33,34].
In general, the MYB protein has a conserved domain at the N-terminus, which is constituted by up to three adjacent repeats, each containing three helices. The second and third helices form the HTH structure combining cis-elements [5]. In our study, all members showed one to two MYB conserved domains at the N-terminus, except for MiMYB11 and MiMYB49. In addition, some conserved amino acids were especially distributed in the third helix. Therefore, the conserved third helix could predict that the activity of a MYB gene bound to DNA is stable. The alterations in the third helix could result in targeting genes specifically and/or could affect DNA binding activity [32]. Most of the MiMYB proteins within the same group showed similar motif compositions, while high differences were observed between the different groups [5]. Dubos et al., expressed the opinion that groups that share similar protein motifs probably share similar functions [5]. In fact, the functions of most conserved motifs remain to be identified and described [24,35].
Gene expression patterns can provide important clues for gene function. Many MYBs were reported to be involved in biotic and abiotic stress responses in Arabidopsis and other plants. In our study, we analyzed the expression profiles of MiMYBs under various biotic and abiotic stress factors in mango. MiMYBs showed different expression patterns, and certain MiMYBs exhibited the highest expression abundance in a specific period during infestation. These MiMYBs may participate in specific biotic or abiotic stress responses through the regulation of different target genes. MiMYBs clustered in the same group did not show similar expression patterns. In this study, MiMYB36 showed up-regulated transcription in SA stress, MeJA stress, and X. campestris pv. mangiferaeindicae infection, and MiMYB54 has a certain up-regulated response to MeJA, H2O2 stress, C. gloeosporioides, and X. campestris pv. mangiferaeindicae infection. Thus, we speculated that these two genes participate in biotic and abiotic stress processes. A considerable amount of research demonstrated that MYB transcription factors play important roles in responses to biotic and abiotic stress [36,37]. At the early stage of Colletotrichum spp. conidiospores infection, appressoria formation on plants [38,39], the transcript levels of nine MiMYB genes (MiMYB2, -4, -5, -6, -11, -39, -44, -50, and -54) were up-regulated. In Vitis davidii, grape ripe rot pathogenic fungi (C. viniferum) invasion produces intracellular and extracellular Ca2+ deregulation to stimulate MYB up-regulation [40]. This led us to speculate that mango regulates the transcription of MiMYB54 through MeJA and ROS to achieve disease-resistant immune responses. Similarly, mango regulates the transcription of MiMYB36 through SA and MeJA, thereby achieving resistance to X. campestris pv. mangiferaeindicae. Evidence suggests that the transcriptional levels of TaMYB29 in wheat [41], FtMYB3 in Tartary buckwheat (Fagopyrum tataricum) [42], and MYB34 in Brassica oleracea [43] were significantly induced by both SA and MeJA. TaMYB29 positively regulates the defense response against stripe rust in wheat by H2O2 accumulation and SA-signaling-pathway-induced cell death [34]. MYB34 is involved in the biosynthesis and breakdown of glucosinolate to resist against black rot pathogen (X. campestris pv. campestris) in cabbage (Brassica oleracea var. capitata) [44].
4. Materials and Methods
4.1. Identification of MYB Transcription Factor Genes in Mango
The sequences of 169 MYB proteins from Arabidopsis were downloaded from the PlantTFDB v5.0, and mango protein sequences were downloaded from the National Genome Science Data Center (BioProject: PRJCA002248, accession no. GWHABLA00000000, accessed on 7 March 2020) [19]. To identify the mango MYB members, two different approaches were used as follows: firstly, local hidden Markov model-based searches (HMMER: http://www.ebi.ac.uk/Tools/hmmer/, accessed on 7 March 2021) built from known MYBs to search the mango genome database; secondly, BLAST analyses with all the Arabidopsis MYBs as queries were employed to check the predicted MYBs in the mango database. With the help of the CDD (http://www.ncbi.nlm.nih.gov/cdd/, accessed on 7 March 2021) and PFAM databases (http://pfam.sanger.ac.uk/, accessed on 7 March 2021), the potential mango MYB members identified from HMM and BLAST searches were only accepted if they contained the MYB domain, and then multiple sequence alignments were used to confirm the conserved domains of predicted MYB sequences. ExPASy (http://web.expasy.org/protparam/, accessed on 7 March 2021) was used to calculate the number of amino acids, molecular weights (MW), and theoretical isoelectric points (pI) of MiMYB proteins. The MEME (http://meme-suite.org/tools/meme/, accessed on 7 March 2021) program was used to identify the conserved motifs in MiMYB protein sequences. The motif distribution type was set as zero or one occurrence per sequence. The number of motifs was set as 15, and the motif width was between 6 and 50 amino acids. These data were integrated and visualized using TBtools [45].
4.2. Multiple Sequence Alignments, Phylogenetic Analysis, Ka/Ks Calculation, and Synteny Analysis
The protein sequences of MYB proteins from mango and Arabidopsis were aligned by the ClustalX program and adjusted manually, and the multiple sequence alignments were used for phylogenetic analysis. Phylogenetic trees based on protein sequence alignments of MYBs from mango and Arabidopsis were constructed by the neighbor-joining method with 1000 bootstrap replicates in MEGA 7.0 (http://www.megasoftware.net/download_form/, accessed on 7 March 2021), and grouped according to genetic distance. of the phylogenetic tree was optimized using iTOL (https://itol.embl.de/#/, 7 March 2021). In order to analyze and calculate the pattern of gene duplication in MiMYBs, the non-synonymous (Ka) and synonymous substitutions (Ks), and evolutionary rates (Ka/Ks) in their paralogs and orthologs were evaluated using TBtools software [45] and MEGA 7.0. Ka/Ks < 1, Ka/Ks = 1, and Ka/Ks > 1 generally indicate negative, neutral, and positive selection, respectively [33,46]. The circle map of synteny analysis was performed for MiMYB genes in mango genome using TBtools software [45].
4.3. Plant Materials, Growth Conditions, and Treatments
One-year-old mango seedlings (Guifei mango) were cultured in pots containing well-mixed soil (soil:vermiculite, 3:1) in a greenhouse in Haikou, China. The newly grown tender leaves were cut out separately and quick-frozen in liquid nitrogen, stored at −80 °C, and used as a 0 h control sample. For biotic and abiotic stress treatment [47,48,49], the mango seedlings were treated with sprinkler irrigation, which included C. gloeosporioides (Cg, 2 × 10⁶ conidiospores/mL) and X. campestris pv. mangiferaeindicae (Xcm, 2 × 10⁷ CFU/mL), and salicylic acid (SA, 5 mmol/L), methyl jasmonate (MeJA, 5 mmol/L), and hydrogen peroxide (H2O2, 10 mmol/L), respectively. Each treatment was set to 3 repetitions, and samples were taken at the treatment time intervals of 3, 6, 12, 24, 48, and 72 h separately and quick-frozen in liquid nitrogen, then RNA was isolated and stored at −80 °C.
4.4. RNA Extraction and qRT-PCR Analysis
RNAprep Pure Plant Plus Kit (Tiangen, Beijing, China) was used to extract total RNA from mango leaves, determine the concentration of total RNA, and check its quality. FastKing RT Kit (with gDNase) (Tiangen, Beijing, China) was then used for reverse transcription to generate first-strand cDNA, and stored at −80 °C.
The gene-specific primer sequences were designed by Primer 5.0 software, Primer3Plus (https://www.bioinformatics.nl/cgi-bin/primer3plus/primer3plus.cgi, accessed on 7 March 2021) [50] and listed in Table S3, Text S1. Using cDNA as a template, QuantStudio 6Flex real-time fluorescent quantitative PCR was used to detect the expression of MiMYBs under different pathogen infections and treatments. The reaction program is 95 °C pre-denaturation for 10 min, 95 °C denaturation for 15 s, 60 °C annealing extension for 1 min, fluorescence signal collection, a total of 50 cycles; after the end of the cycle, when heating from 60 °C to 95 °C for melting curve analysis, MiActin [51] was employed as a reference gene. The expression level at 0 h was used as a control. The 2−∆∆Ct method and SPSS software were used to perform data statistics and variance analysis on the Ct value of each sample, calculate the relative gene expression levels of MiMYBs, and visualize the genes’ expression heat map with TBtools software. Relative expression levels greater than 1.5-fold (1.5-fold higher than control) were considered up-regulated, whereas relative expression levels that were less than 0.5-fold (0.5-fold lower than control) were considered down-regulated.
5. Conclusions
In this study, 54 MiMYB transcription factors were identified from the mango genome and classified into 7 group, including Groups 1, -3, -4, -5, -6, -8 and -9, with high similarities in the MYB domain and motif composition within the same group. Quantitative real-time PCR showed that the transcription levels of MiMYBs were different under abiotic and biotic stresses, including SA, MeJA, and H2O2 treatments, and C. gloeosporioides and X. campestris pv. mangiferaeindicae infection, respectively. The transcript levels of MiMYB5, -35, -36, and -54 simultaneously responded positively to early treatments of SA, MeJA, and H2O2. The transcript levels of MiMYB54 were activated by both pathogenic fungal and bacterial infection. These results will be beneficial for future interested researchers aiming to understand the biological functions and molecular mechanisms of MiMYBs, which could be further confirmed through functional characterization by overexpression and gene silencing. In addition, the results will be of interest to scientists working on transcription factor studies of mango and tree crops, as well as to the wider plant research community.
Supplementary Materials
The following are available online at https://www.mdpi.com/article/10.3390/plants11223141/s1: Table S1. Detailed information of MiMYBs genes in mango; Table S2. The Ka, Ks and Ka/Ks values of MiMYB genes; Table S3. Primer sequences for qRT-PCR; Table S4. The expression data of MiMYB genes response to SA treatment; Table S5. The expression data of MiMYB genes response to MeJA treatment; Table S6. The expression data of MiMYB genes response to H2O2 treatment; Table S7. The expression data of MiMYB genes response to C. gloeosporioides infection; Table S8. The expression data of MiMYB genes response to X. campestris pv. mangiferaeindicae infection; Figure S1. The circle map of synteny analysis was performed for MiMYB genes in mango genome by TBtools software; Figure S2. MiMYBs of agarose gel electrophoresis of products amplified by qRT-PCR; Text S1. Nucleotide sequences of 54 MiMYB; Text S2. Amino acid sequences of 54 MiMYB.
Author Contributions
H.Z. and J.P. conceived the study and participated in its design and coordination; H.Z. and Z.L. performed most experimental work and wrote the manuscript; R.L., Y.S. and C.Y. performed experimental work and database analysis; R.L., X.L. and A.G. performed experimental work; H.Z. supervised this project. All authors have read and agreed to the published version of the manuscript.
Funding
This work was supported by grants from the National Key R&D Program of China (2019YFD1000500), the Central Public-interest Scientific Institution Basal Research Fund (no. 1630042022009, 1630032022007), the Open Project of Guangxi Key Laboratory of Biology for Mango (GKLBM02201), the major science and technology project of Hainan Province (ZDKJ2021014), and the Open Project of Key Laboratory of Biotechnology of Salt Tolerant Crops of Hainan Province (KLBSTCHN2022-3).
Institutional Review Board Statement
Not applicable.
Informed Consent Statement
Not applicable.
Data Availability Statement
Not applicable.
Acknowledgments
The authors are grateful to Chengjie Chen from South China Agricultural University for kindly providing the TBtools software and manual.
Conflicts of Interest
The authors declare no conflict of interest.
References
- Warschefsky, E.; von Wettberg, E. Population genomic analysis of mango (Mangifera indica) suggests a complex history of domestication. New Phytol. 2019, 222, 2023–2037. [Google Scholar] [CrossRef] [PubMed]
- Wang, P.; Luo, Y.F.; Huang, J.F.; Gao, S.H.; Zhu, G.P.; Dang, Z.G.; Gai, J.T.; Yang, M.; Zhu, M.; Zhang, H.K.; et al. The genome evolution and domestication of tropical fruit mango. Genome Biol. 2020, 21, 60. [Google Scholar] [CrossRef] [PubMed]
- Riechmann, J.L.; Heard, J.; Martin, G.; Reuber, L.; Jiang, C.; Keddie, J.; Adam, L.; Pineda, O.; Ratcliffe, O.J.; Samaha, R.R.; et al. Arabidopsis transcription factors: Genome-wide comparative analysis among eukaryotes. Science 2000, 290, 2105–2110. [Google Scholar] [CrossRef] [PubMed]
- Feller, A.; Machemer, K.; Braun, E.L.; Grotewold, E. Evolutionary and comparative analysis of MYB and bHLH plant transcription factors. Plant J. 2011, 66, 94–116. [Google Scholar] [CrossRef] [PubMed]
- Dubos, C.; Stracke, R.; Grotewold, E.; Weisshaar, B.; Martin, C.; Lepiniec, L. MYB transcription factors in Arabidopsis. Trends Plant Sci. 2010, 15, 573–581. [Google Scholar] [CrossRef]
- Paz-Ares, J.; Ghosal, D.; Wienand, U.; Peterson, P.A.; Saedler, H. The regulatory c1 locus of Zea mays encodes a protein with homology to myb proto-oncogene products and with structural similarities to transcriptional activators. EMBO J. 1987, 6, 3553–3558. [Google Scholar] [CrossRef] [PubMed]
- Campos, J.F.; Cara, B.; Pérez-Martín, F.; Pineda, B.; Egea, I.; Flores, F.B.; Fernandez-Garcia, N.; Capel, J.; Moreno, V.; Angosto, T.; et al. The tomato mutant ars1 (altered response to salt stress 1) identifies an R1-type MYB transcription factor involved in stomatal closure under salt acclimation. Plant Biotechnol. J. 2016, 14, 1345–1356. [Google Scholar] [CrossRef]
- Chezem, W.R.; Memon, A.; Li, F.S.; Weng, J.K.; Clay, N.K. SG2-Type R2R3-MYB Transcription factor MYB15 controls defense-induced lignification and basal immunity in Arabidopsis. Plant Cell. 2017, 29, 1907–1926. [Google Scholar] [CrossRef] [PubMed]
- Han, X.Y.; Yin, Q.G.; Liu, J.Y.; Jiang, W.B.; Di, S.K.; Pang, Y.Z. GmMYB58 and GmMYB205 are seed-specific activators for isoflavonoid biosynthesis in Glycine max. Plant Cell Rep. 2017, 36, 1889–1902. [Google Scholar] [CrossRef] [PubMed]
- Salih, H.; Gong, W.F.; He, S.P.; Sun, G.F.; Sun, J.L.; Du, M.M. Genome-wide characterization and expression analysis of MYB transcription factors in Gossypium hirsutum. BMC Genet. 2016, 17, 129. [Google Scholar] [CrossRef]
- Wang, L.N.; Gao, W.; Wu, X.L.; Zhao, M.R.; Qu, J.B.; Huang, C.Y.; Zhang, J.X. Genome-wide characterization and expression analyses of Pleurotus ostreatus MYB transcription factors during developmental stages and under heat stress based on de novo sequenced genome. Int. J. Mol. Sci. 2018, 19, 2052. [Google Scholar] [CrossRef] [PubMed]
- Katiyar, A.; Smita, S.; Lenka, S.K.; Rajwanshi, R.; Chinnusamy, V.; Bansal, K.C. Genome-wide classification and expression analysis of MYB transcription factor families in rice and Arabidopsis. BMC Genom. 2012, 13, 544. [Google Scholar] [CrossRef]
- Bian, S.H.; Jin, D.H.; Sun, G.Q.; Shan, B.H.; Zhou, H.N.; Wang, J.Y.; Zhai, L.L.; Li, X.Y. Characterization of the soybean R2R3-MYB transcription factor GmMYB81 and its functional roles under abiotic stresses. Gene 2020, 753, 144803. [Google Scholar] [CrossRef]
- An, J.P.; Wang, X.F.; Zhang, X.W.; Xu, H.F.; Bi, S.Q.; You, C.X.; Hao, Y.J. An apple MYB transcription factor regulates cold tolerance and anthocyanin accumulation and undergoes MIEL1-mediated degradation. Plant Biotechnol. J. 2020, 18, 337–353. [Google Scholar] [CrossRef] [PubMed]
- Ruan, M.B.; Guo, X.; Wang, B.; Yang, Y.L.; Li, W.Q.; Yu, X.L.; Zhang, P.; Peng, M. Genome-wide characterization and expression analysis enables identification of abiotic stress-responsive MYB transcription factors in cassava (Manihot esculenta). J. Exp. Bot. 2017, 68, 3657–3672. [Google Scholar] [CrossRef]
- Wei, Q.H.; Chen, R.; Wei, X.; Liu, Y.H.; Zhao, S.J.; Yin, X.P.; Xie, T. Genome-wide identification of R2R3-MYB family in wheat and functional characteristics of the abiotic stress responsive gene TaMYB344. BMC Genom. 2020, 21, 792. [Google Scholar] [CrossRef] [PubMed]
- Wan, S.Z.; Li, C.F.; Ma, X.D.; Luo, K.M. PtrMYB57 contributes to the negative regulation of anthocyanin and proanthocyanidin biosynthesis in poplar. Plant Cell Rep. 2017, 36, 1263–1276. [Google Scholar] [CrossRef] [PubMed]
- Song, Z.P.; Luo, Y.; Wang, W.F.; Fan, N.B.; Wang, D.B.; Yang, C.; Jia, H.F. NtMYB12 positively regulates flavonol biosynthesis and enhances tolerance to low pi stress in Nicotiana tabacum. Front. Plant Sci. 2020, 10, 1683. [Google Scholar] [CrossRef]
- Li, W.; Zhu, X.G.; Zhang, Q.J.; Li, K.; Zhang, D.; Shi, C.; Gao, L.Z. SMRT sequencing generates the chromosome-scale reference enome of tropical fruit mango, Mangifera indica. bioRxiv 2020. [Google Scholar] [CrossRef]
- Tian, F.; Yang, D.C.; Meng, Y.Q.; Jin, J.; Gao, G. PlantRegMap: Charting functional regulatory maps in plants. Nucleic Acids Res. 2020, 48, D1104–D1113. [Google Scholar] [CrossRef]
- Kim, S.H.; Kim, H.S.; Bahk, S.; An, J.; Yoo, Y.; Kim, J.Y.; Chung, W.S. Phosphorylation of the transcriptional repressor MYB15 by mitogen-activated protein kinase 6 is required for freezing tolerance in Arabidopsis. Nucleic Acids Res. 2017, 45, 6613–6627. [Google Scholar] [CrossRef] [PubMed]
- Zheng, B.; Wu, H.; Wang, S.; Ma, X.; Luo, W.; Yao, Q. Identification and analysis of MYB transcription factor family based on transcriptome data in mango (Mangifera indica L.). Chin. J. Trop. Crops 2017, 38, 1285–1294. [Google Scholar] [CrossRef]
- Tafolla-Arellano, J.C.; Zheng, Y.; Sun, H.G.; Jiao, C.; Ruiz-May, E.; Hernández-Oñate, M.A.; González-León, A.; Báez-Sañudo, R.; Fei, Z.J.; Domozych, D.; et al. Transcriptome analysis of mango (Mangifera indica L.) fruit epidermal peel to identify putative cuticle-associated genes. Sci. Rep. 2017, 7, 46163. [Google Scholar] [CrossRef] [PubMed]
- Zhang, Y.; Xu, Y.; Huang, D.; Xing, W.; Wu, B.; Wei, Q.; Xu, Y.; Zhan, R.; Ma, F.; Song, S. Research progress on the MYB transcription factors in tropical fruit. Trop. Plants 2022, 1, 5. [Google Scholar] [CrossRef]
- Kanzaki, S.; Ichihi, A.; Tanaka, Y.; Fujishige, S.; Koeda, S.; Shimizu, K. The R2R3-MYB transcription factor MiMYB1 regulates light dependent red coloration of ‘Irwin’ mango fruit skin. Sci. Hortic. 2020, 272, 109567. [Google Scholar] [CrossRef]
- Sivankalyani, V.; Sela, N.; Feygenberg, O.; Zemach, H.; Maurer, D.; Alkan, N. Transcriptome dynamics in mango fruit peel reveals mechanisms of chilling stress. Front. Plant Sci. 2016, 7, 1579. [Google Scholar] [CrossRef]
- Dautt-Castro, M.; López-Virgen, A.G.; Ochoa-Leyva, A.; Contreras-Vergara, C.A.; Sortillón-Sortillón, A.P.; Martínez-Téllez, M.A.; González-Aguilar, G.A.; Casas-Flores, J.S.; Sañudo-Barajas, A.; Kuhn, D.N.; et al. Genome-wide identification of mango (Mangifera indica L.) polygalacturonases: Expression analysis of family members and total enzyme activity during fruit ripening. Front. Plant Sci. 2019, 10, 969. [Google Scholar] [CrossRef] [PubMed]
- Chen, Y.H.; Yang, X.Y.; He, K.; Liu, M.H.; Li, J.G.; Gao, Z.F.; Lin, Z.Q.; Zhang, Y.F.; Wang, X.X.; Qiu, X.M.; et al. The MYB transcription factor superfamily of Arabidopsis: Expression analysis and phylogenetic comparison with the rice MYB family. Plant Mol. Biol. 2006, 60, 107–124. [Google Scholar] [CrossRef]
- Du, H.; Yang, S.S.; Liang, Z.; Feng, B.R.; Liu, L.; Huang, Y.B.; Tang, Y.X. Genome-wide analysis of the MYB transcription factor superfamily in soybean. BMC Plant Biol. 2012, 12, 106. [Google Scholar] [CrossRef]
- Sun, W.; Ma, Z.; Chen, H.; Liu, M. MYB gene family in Potato (Solanum tuberosum L.): Genome-wide identification of hormone-responsive reveals their potential functions in growth and development. Int. J. Mol. Sci. 2019, 20, 4847. [Google Scholar] [CrossRef] [PubMed]
- Wang, F.; Li, X. Genome-wide characterization and expression analysis of MYB transcription factors in Lotus japonicas and Medicago truncatula. Genes Genom. 2017, 39, 831–842. [Google Scholar] [CrossRef]
- Li, H.Y.; Yue, Y.Z.; Ding, W.J.; Chen, G.W.; Li, L.; Li, Y.L.; Shi, T.T.; Yang, X.L.; Wang, L.G. Genome-wide identification, classification, and expression profiling reveals R2R3-MYB transcription factors related to monoterpenoid biosynthesis in Osmanthus fragrans. Genes 2020, 11, 353. [Google Scholar] [CrossRef]
- Wu, Z.; Shen, S.; Wang, Y.; Tao, W.; Zhao, Z.; Hu, X.; Yu, P. Genome-wide identification and expression analysis of the Zinc Finger Protein gene subfamilies under drought stress in Triticum aestivum. Plants 2022, 11, 2511. [Google Scholar] [CrossRef] [PubMed]
- He, H.; Crabbe, M.J.C.; Ren, Z. Detoxification gene families at the genome-wide level of rhus gall aphid Schlechtendalia chinensis. Genes 2022, 13, 1627. [Google Scholar] [CrossRef] [PubMed]
- Wang, X.; Niu, Y.; Zheng, Y. Multiple functions of MYB transcription factors in abiotic stress responses. Int. J. Mol. Sci. 2021, 22, 6125. [Google Scholar] [CrossRef] [PubMed]
- Gong, X.X.; Yan, B.Y.; Hu, J.; Yang, C.P.; Li, Y.J.; Liu, J.P.; Liao, W.B. Transcriptome profiling of rubber tree (Hevea brasiliensis) discovers candidate regulators of the cold stress response. Genes Genom. 2018, 40, 1181–1197. [Google Scholar] [CrossRef] [PubMed]
- Roy, S. Function of MYB domain transcription factors in abiotic stress and epigenetic control of stress response in plant genome. Plant Signal. Behav. 2016, 11, e1117723. [Google Scholar] [CrossRef] [PubMed]
- O’Connell, R.J.; Thon, M.R.; Hacquard, S.; Amyotte, S.G.; Kleemann, J.; Torres, M.F.; Damm, U.; Buiate, E.A.; Epstein, L.; Alkan, N.; et al. Lifestyle transitions in plant pathogenic Colletotrichum fungi deciphered by genome and transcriptome analyses. Nat. Genet. 2012, 44, 1060–1065. [Google Scholar] [CrossRef] [PubMed]
- Alkan, N.; Friedlander, G.; Ment, D.; Prusky, D.; Fluhr, R. Simultaneous transcriptome analysis of Colletotrichum gloeosporioides and tomato fruit pathosystem reveals novel fungal pathogenicity and fruit defense strategies. New Phytol. 2015, 205, 801–815. [Google Scholar] [CrossRef]
- Lei, Y.; Yuan, X.; Chen, T.; Yuan, Y.; Liu, X.; Tang, X.; Chen, Q. Transcriptome analysis of berries of spine grape (Vitis davidii Föex) infected by Colletotrichum viniferum during symptom development. Horticulturae 2022, 8, 843. [Google Scholar] [CrossRef]
- Zhu, X.; Li, X.; He, Q.; Guo, D.; Liu, C.; Cao, J.; Wu, Z.; Kang, Z.; Wang, X. TaMYB29: A novel R2R3-MYB transcription factor involved inwheat defense against stripe rust. Front. Plant Sci. 2021, 12, 783388. [Google Scholar] [CrossRef] [PubMed]
- Wang, L.; Deng, R.; Bai, Y.; Wu, H.; Li, C.; Wu, Q.; Zhao, H. Tartary buckwheat R2R3-MYB gene FtMYB3 negatively regulates anthocyanin and proanthocyanin biosynthesis. Int. J. Mol. Sci. 2022, 23, 2775. [Google Scholar] [CrossRef] [PubMed]
- Yi, G.E.; Robin, A.H.K.; Yang, K.; Park, J.I.; Hwang, B.H.; Nou, I. Exogenous methyljasmonate and salicylic acid induce subspeciess-specific patterns of glucosinolate accumulation and gene expression in Brassica oleracea L. Molecules 2016, 21, 1417. [Google Scholar] [CrossRef] [PubMed]
- Rubel, M.H.; Abuyusuf, M.; Nath, U.K.; Robin, A.H.K.; Jung, H.J.; Kim, H.T.; Park, J.I.; Nou, I. Glucosinolate profile and glucosinolate biosynthesis and breakdown gene expression manifested by black rot disease infection in cabbage. Plants 2020, 9, 1121. [Google Scholar] [CrossRef]
- Chen, C.; Chen, H.; Zhang, Y.; Thomas, H.R.; Frank, M.H.; He, Y.; Xia, R. TBtools: An integrative toolkit developed for interactive analyses of big biological data. Mol. Plant 2020, 13, 1194–1202. [Google Scholar] [CrossRef]
- Kesawat, M.S.; Kherawat, B.S.; Singh, A.; Dey, P.; Routray, S.; Mohapatra, C.; Saha, D.; Ram, C.; Siddique, K.H.M.; Kumar, A.; et al. Genome-wide analysis and characterization of the proline-rich extensin-like receptor kinases (PERKs) gene family reveals their role in different developmental stages and stress conditions in wheat (Triticum aestivum L.). Plants 2022, 11, 496. [Google Scholar] [CrossRef]
- Winter, D.; Vinegar, B.; Nahal, H.; Ammar, R.; Wilson, G.V.; Provart, N.J. An “Electronic Fluorescent Pictograph” browser for exploring and analyzing large-scale biological data sets. PLoS ONE 2007, 2, e718. [Google Scholar] [CrossRef]
- Jiang, Y.; Duan, Y.; Yin, J.; Ye, S.; Zhu, J.; Zhang, F.; Lu, W.; Fan, D.; Luo, K. Genome-wide identification and characterization of the Populus WRKY transcription factor family and analysis of their expression in response to biotic and abiotic stresses. J. Exp. Bot. 2014, 65, 6629–6644. [Google Scholar] [CrossRef]
- Zhang, H.; Kang, H.; Su, C.; Qi, Y.; Liu, X.; Pu, J. Genome-wide identification and expression profile analysis of the NAC transcription factor family during abiotic and biotic stress in woodland strawberry. PLoS ONE 2018, 13, e0197892. [Google Scholar] [CrossRef]
- Untergasser, A.; Nijveen, H.; Rao, X.; Bisseling, T.; Geurts, R.; Leunissen, J.A.M. Primer3Plus, an enhanced web interface to Primer3. Nucleic Acids Res. 2007, 35, W71–W74. [Google Scholar] [CrossRef]
- Luo, C.; He, X.H.; Chen, H.; Hu, Y.; Ou, S.J. Molecular cloning and expression analysis of four actin genes (MiACT) from mango. Biol. Plantarum 2013, 57, 238–244. [Google Scholar] [CrossRef]
Publisher’s Note: MDPI stays neutral with regard to jurisdictional claims in published maps and institutional affiliations. |
© 2022 by the authors. Licensee MDPI, Basel, Switzerland. This article is an open access article distributed under the terms and conditions of the Creative Commons Attribution (CC BY) license (https://creativecommons.org/licenses/by/4.0/).