Article

Genome-Wide Identification and Expression Profiling of the SRS Gene Family in Melilotus albus Reveals Functions in Various Stress Conditions

1
College of Resources and Environmental Sciences, Gansu Agricultural University, Lanzhou 730070, China
2
College of Forestry, Gansu Agricultural University, Lanzhou 730070, China
3
Centre of Genomics and Biotechnology, Fujian Agriculture and Forestry University, Jinshan, Fuzhou 350002, China
4
College of Agronomy, Gansu Agricultural University, Lanzhou 730070, China
5
Key Laboratory of Vegetation Restoration and Management of Degraded Ecosystems, South China Botanical Garden, Chinese Academy of Sciences, Guangzhou 510650, China
6
University of Chinese Academy of Sciences, Beijing 100039, China
*
Authors to whom correspondence should be addressed.
Plants 2022, 11(22), 3101; https://doi.org/10.3390/plants11223101
Submission received: 25 October 2022 / Revised: 6 November 2022 / Accepted: 9 November 2022 / Published: 15 November 2022

Abstract

:
The plant-specific SHI-related sequence (SRS) family of transcription factors plays a vital role in growth regulation, plant development, phytohormone biosynthesis, and stress response. However, the genome-wide identification and role in the abiotic stress-related functions of the SRS gene family were not reported in white sweet clover (Melilotus albus). In this study, nine M. albus SRS genes (named MaSRS01-MaSRS09) were identified via a genome-wide search method. All nine genes were located on six out of eight chromosomes in the genome of M. albus and duplication analysis indicated eight segmentally duplicated genes in the MaSRS family. These MaSRS genes were classified into six groups based on their phylogenetic relationships. The gene structure and motif composition results indicated that MaSRS members in the same group contained analogous intron/exon and motif organizations. Further, promoter region analysis of MaSRS genes uncovered various growth, development, and stress-responsive cis-acting elements. Protein interaction networks showed that each gene has both functions of interacting with other genes and members within the family. Moreover, real-time quantitative PCR was also performed to verify the expression patterns of nine MaSRS genes in the leaves of M. albus. The results showed that nine MaSRSs were up- and down-regulated at different time points after various stress treatments, such as salinity, low-temperature, salicylic acid (SA), and methyl jasmonate (MeJA). This is the first systematic study of the M. albus SRS gene family, and it can serve as a strong foundation for further elucidation of the stress response and physiological improvement of the growth functions in M. albus.

1. Introduction

Transcription factors (trans-acting elements, Tfs), are protein molecules with specific modular domains performing core functions in transcription by recruiting target DNA and playing an essential role in plant growth and development [1]. SHI-related sequence (SRS) is a family of plant-specific Tfs, known as short internodes (SHI) or STY/SRS/SHI family, that comprises two distinct conserved regions [2]. The first region is a ring-shaped zinc finger structure (CX2CX7CX4CX2C2X6C) that contains the C3HC3H motif and is referred to as the RING region [3]. This ring-shaped conserved domain was first discovered in an African clawed frog (Xenopus laevis) and identified as a DNA binding motif [4]. The ring domain comprises cysteine-rich residues that couple with zinc atoms [5], bind to RNA, proteins, and lipid substrates and enhance their conservation [6]. This suggests that SRS may play an essential role in multicellular physiological and biochemical processes [4]. The second region is a short IXGH domain at the C-terminus, which is required for homologous isomerization and contains transcriptional activators from acidic amino acids [7]. Some members of the SRS family have lost this domain during evolution [8,9].
SRS TFs play imperative roles in plant organ growth, carpel development, photomorphogenesis, photoperiod regulation, and phytohormone response [10,11]. In Arabidopsis, 11 AtSRS genes (AtSRS3, AtSRS4, AtSRS5, AtSRS6, AtSRS7, AtSRS8, AtSHI, AtSTY1, AtSTY2, AtLRP1, and AT1G32730) have been identified and play essential roles in Arabidopsis growth and development [12,13]. Overexpression of AtSRS5 directly activates the expression of HY5, BBX21, and BBX22 genes, thereby regulating photomorphogenesis in the dark [14], and can also inhibit the expression of LBD16 and LBD29 genes, leading to hindered lateral root formation [15]. The partially redundant AtSTY1 and AtSTY2 genes promote pistil development and stigma formation in a dose-dependent manner in Arabidopsis [8]. Another study revealed that SRS Tfs in barley (Hordeum vulgare) could regulate hormone biosynthesis, and inflorescence growth, inhibit gibberellin (GA), induce barley amylase expression and also control the awn elongation of barley, regulate pistil morphology and promote flowering [16,17]. Studies have also shown that SRS gene expression patterns and biological functions of SRS are quite diverse. For example, only the gene GRMZM2G077752 was strongly expressed in senescent leaves of maize (Zea mays). In contrast, the other ten SRS genes were not expressed at all in senescent leaves because GRMZM2G077752 may be responsive to abscisic acid (ABA) signals and activate carbohydrate reactivation in senescent leaves [18]. This suggests that the interaction between the SRS gene and plant hormone-responsive elements may stimulate plant leaf senescence. Five OsSRS genes in japonica rice (Oryza sativa subsp. Japonica) indicated different responses to different abiotic stresses and hormone treatments. Interestingly, GA induced the expression of one SRS gene, while paclobutrazol (PB) inhibited the expression, suggesting the antagonistic effects of GA and PB [3]. In addition, 21 members of the soybean (Glycine max) SRS demonstrated similar expression patterns subjected to drought, salinity, and exogenous ABA could induce the expression of these genes. Zhao and his co-workers’ selected drought and salinity treatments for further functional screening of the GmSRS18 gene. The results showed that GmSRS18 was a negative regulator in the drought and salt stresses signaling pathway [2]. It was reported that 27 SRS genes in alfalfa (Medicago sativa) stem tissue were significantly induced by cold and salt stress and exhibited differential expression patterns, showing that MsSRSs may play essential roles in stem tissue-dependent regulatory networks [1].
White sweet clover (Melilotus albus) is native to temperate regions of Europe and Asia and is cultivated worldwide [19]. The plant has a great cold, drought, and salt tolerance [20]. It is reported that the yield and nitrogen-fixing ability of M. albus are better than those of alfalfa. It is vital in improving soil quality and is often regarded as excellent green manure and feed [21,22]. In recent years, many researchers have identified and analyzed SRS transcription factors and their functions in plants such as maize (Zea mays) [18], Arabidopsis (Arabidopsis thaliana) [23], barley (Hordeum vulgare) [17], rice (Oryza sativa Indica) [3], soybean (Glycine max) [2], and alfalfa (Medicago sativa) [1]. However, the genome-wide identification of the SRS family in M. albus and the molecular regulatory mechanism under abiotic and abiotic stress have not been reported. In this paper, MaSRS was extracted from the published wide genome sequence information of Melilotus albus [19]. Therefore, the primary aim of this study was to identify the putative members of the MaSRS gene family and explore the subsequent basic physicochemical properties, phylogeny, gene structure, and protein interaction of nine MaSRS genes using bioinformatics and computational methods. The relative expression of MaSRS family members at different time points under various stress conditions was also investigated using PCR (qRT-PCR) technology. This study serves as a theoretical framework for analyzing SRS genes in plants, which will help in understanding the stress response behaviors that might be helpful for future breeding programs.

2. Results

2.1. Identification and Analysis of SRS Family Members in M. albus

After a series of screening and identification, nine SRS genes were identified in M. albus and named MaSRS01-MaSRS09 according to the position of these genes on the chromosome. The amino acid lengths of these genes varied from 197 (MaSRS08) to 368 (MaSRS06) and, correspondingly, the relative molecular weight ranged from 22.52211 (MaSRS08) kDa to 40.82662 (MaSRS06) kDa. The average molecular weight was 34.55999 kDa. Isoelectric points of the encoded proteins ranged from 5.79 (MaSRS07) to 8.79 (MaSRS09), and the instability index ranged from 47.07 (MaSRS09) to 61.44 (MaSRS05), with a difference of 14.37. The GRAVY values of the MaSRS proteins were all less than 0, indicating that these proteins were hydrophilic. The results of subcellular localization showed that all members of the MaSRS family were localized in the nucleus (Table 1).

2.2. Chromosomal Locations and Gene Duplication Analysis of MaSRS Genes

The chromosome distribution map showed that nine MaSRS members were distributed on six chromosomes (Figure 1), three members on Chr5 (MaSRS04, MaSRS05, MaSRS06), two members on Chr2 (MaSRS02, MaSRS03), and only one member on Chr1 (MaSRS01), Chr6 (MaSRS07), Chr7 (MaSRS08), Chr8 (MaSRS09). Segmental duplications and tandem duplications contribute to the evolution of gene families. According to Figure 2 and Table 2, Duplication analysis indicated eight pairs of segmental duplication: MaSRS01, MaSRS02; MaSRS01, MaSRS05; MaSRS02, MaSRS05; MaSRS02, MaSRS08; MaSRS03, MaSRS04; MaSRS05, MaSRS07; MaSRS05, MaSRS08 and MaSRS07, MaSRS08. However, no tandem, proximal, or disperse duplicate was found in the MaSRS gene family, and thus only segmental duplication seems to have participated in the evolution of the M. albus SRS gene family. To investigate potential selective pressure for MaSRS gene duplication events, we calculated the nonsynonymous (Ka) and synonymous (Ks) substitution rates. All segmentally duplicated gene pairs in M. albus showed Ka/Ks ratios < 1, indicating that they evolved mainly under purifying selection. In M. albus, the divergence time of segmental duplication events was about 79 to 360 million years ago (Mya).

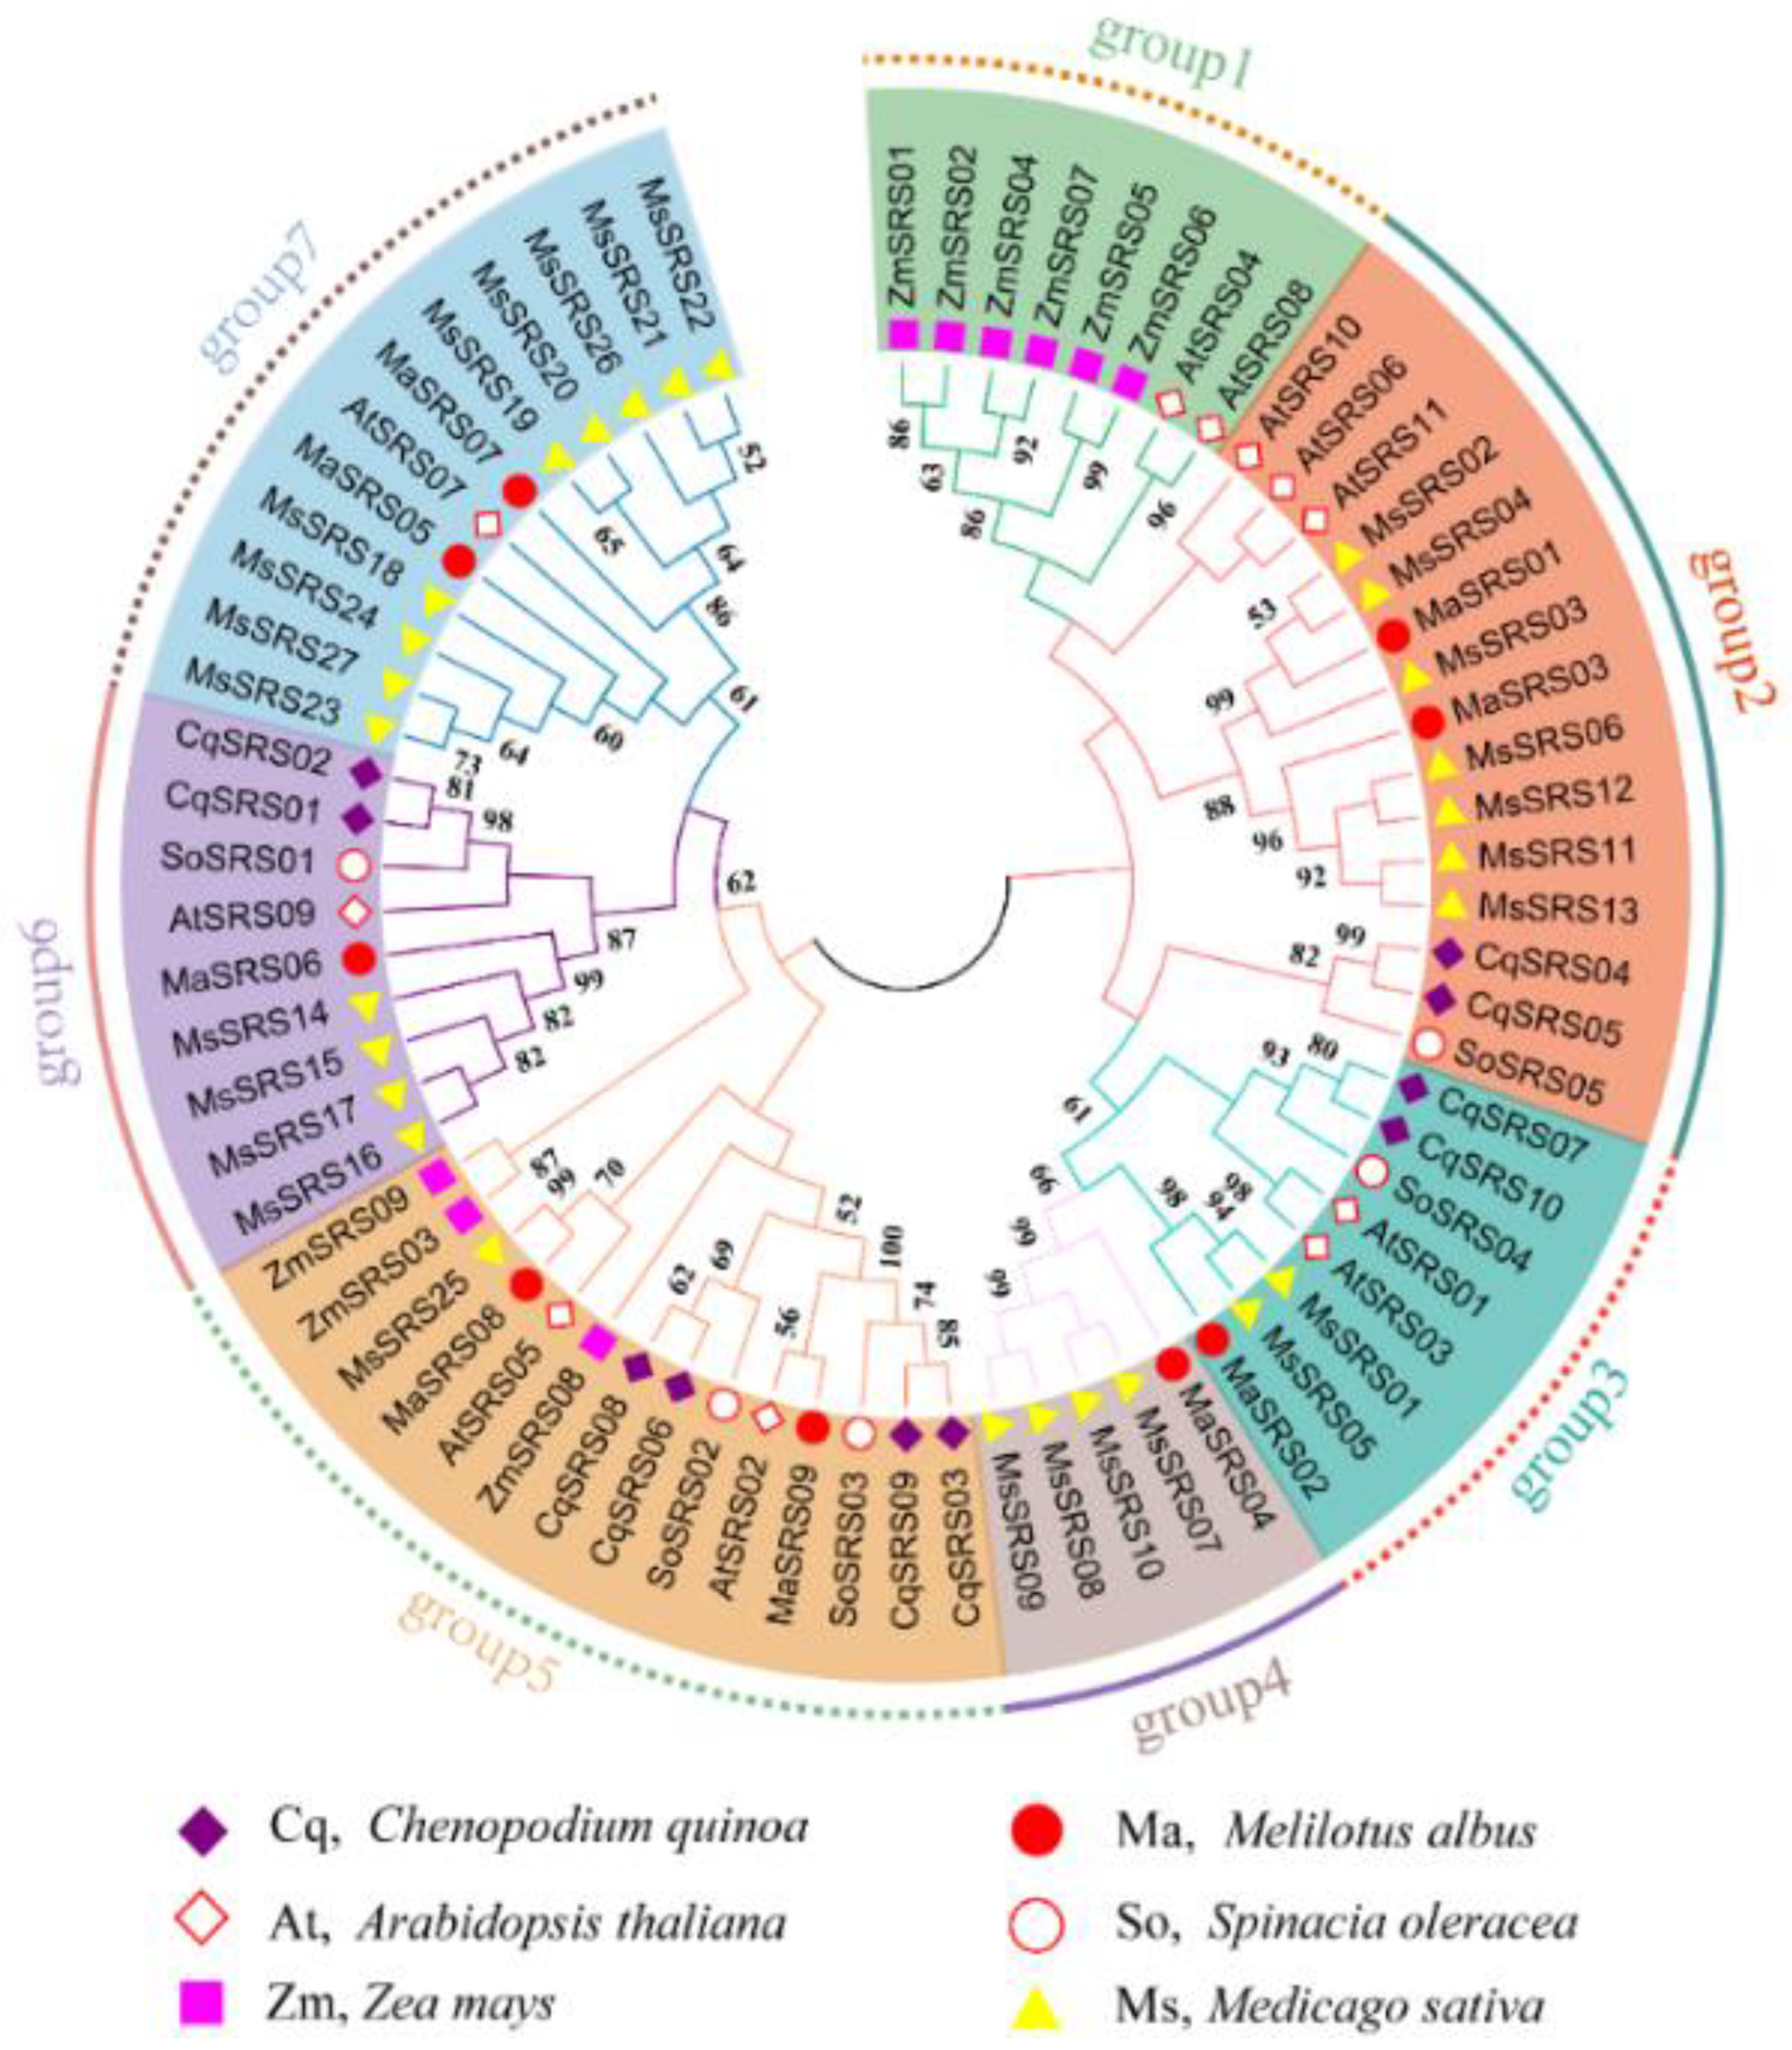
2.3. Phylogenetic Relationship, Gene Structure, Conserved Motif, and Domain Analysis of MaSRS Family

To explore the evolutionary relationships between the MaSRS family and SRS families of other plants, a phylogenetic tree was constructed based on MEGA7.0 software for 71 SRS genes in A. thaliana, Z. mays, S. oleracea, C. quinoa, M. sativa, and M. albus (Supplementary Table S1). As shown in Figure 3, the SRS gene family members can be classified into seven clusters (no MaSRS gene in group 1), which is similar to AtSRS. Among them, MaSRS01 and MaSRS03 were in group 2, MaSRS08 and MaSRS09 were in group 5, and MaSRS05 and MaSRS07 were in group 7. The identical clusters of MaSRS genes may share a common ancestor and retain similar biological functions during evolution. We found that the closest relationship with the M. albus SRS gene family was with alfalfa.
As shown in the phylogeny tree, it is evident that the SRS genes of the legume plants (M. albus and alfalfa) clustered together. And most of the M. albus SRSs also clustered together with proteins from Arabidopsis, quinoa, and spinach, instead of maize, consistent with the closer relationship of M. albus to the three dicotyledons.
To better understand the structure and function of the MaSRS family, the conserved domains and motifs of nine genes were analyzed (Figure 4). As shown in the figures (Figure 4A,B,D), these genes were classified into six subfamilies (subfamily I, subfamily II, subfamily III, subfamily IV, subfamily V, and subfamily VI) based on the evolutionary tree and conserved motifs, with a similar distribution of conserved motifs in the same subfamily. Motif1 (including the RING domain) is the basic sequence of the MaSRS family, which is ubiquitous and most conserved in all genes. Motif2 (with an IXGH structural domain), along with Motif3 and Motif5, are present in eight MaSRS genes (except MaSRS06) and are relatively well conserved. Motif6 has the least width and is present in six MaSRSs. The distribution of Motif3 and Motif4 in MaSRS genes was very similar, and it is worth noting that there is only one Motif (Motif1) in MaSRS06. These conserved motifs may play an important role in the evolution of the SRS gene in M. albus.
The distribution of the number and length of introns and exons shows the gene structure of MaSRS family members, which showed a relatively simple configuration (Figure 4C). Seventy-eight percent of the MaSRS genes had only one intron, MaSRS09 contained two introns, and MaSRS06 showed a distinct configuration, containing four introns. The intron sequences of the different genes varied greatly in length, with the intron of MaSRS06 being the longest, that of MaSRS09 the second longest, and that of MaSRS08 the shortest. However, genes with close relatives (MaSRS01 and MaSRS02, MaSRS03, and MaSRS04, MaSRS05, and MaSRS07) had similar exon and intron lengths. Therefore, we speculated that these genes with similar structural features might play similar functions in response to external stimuli in plants.

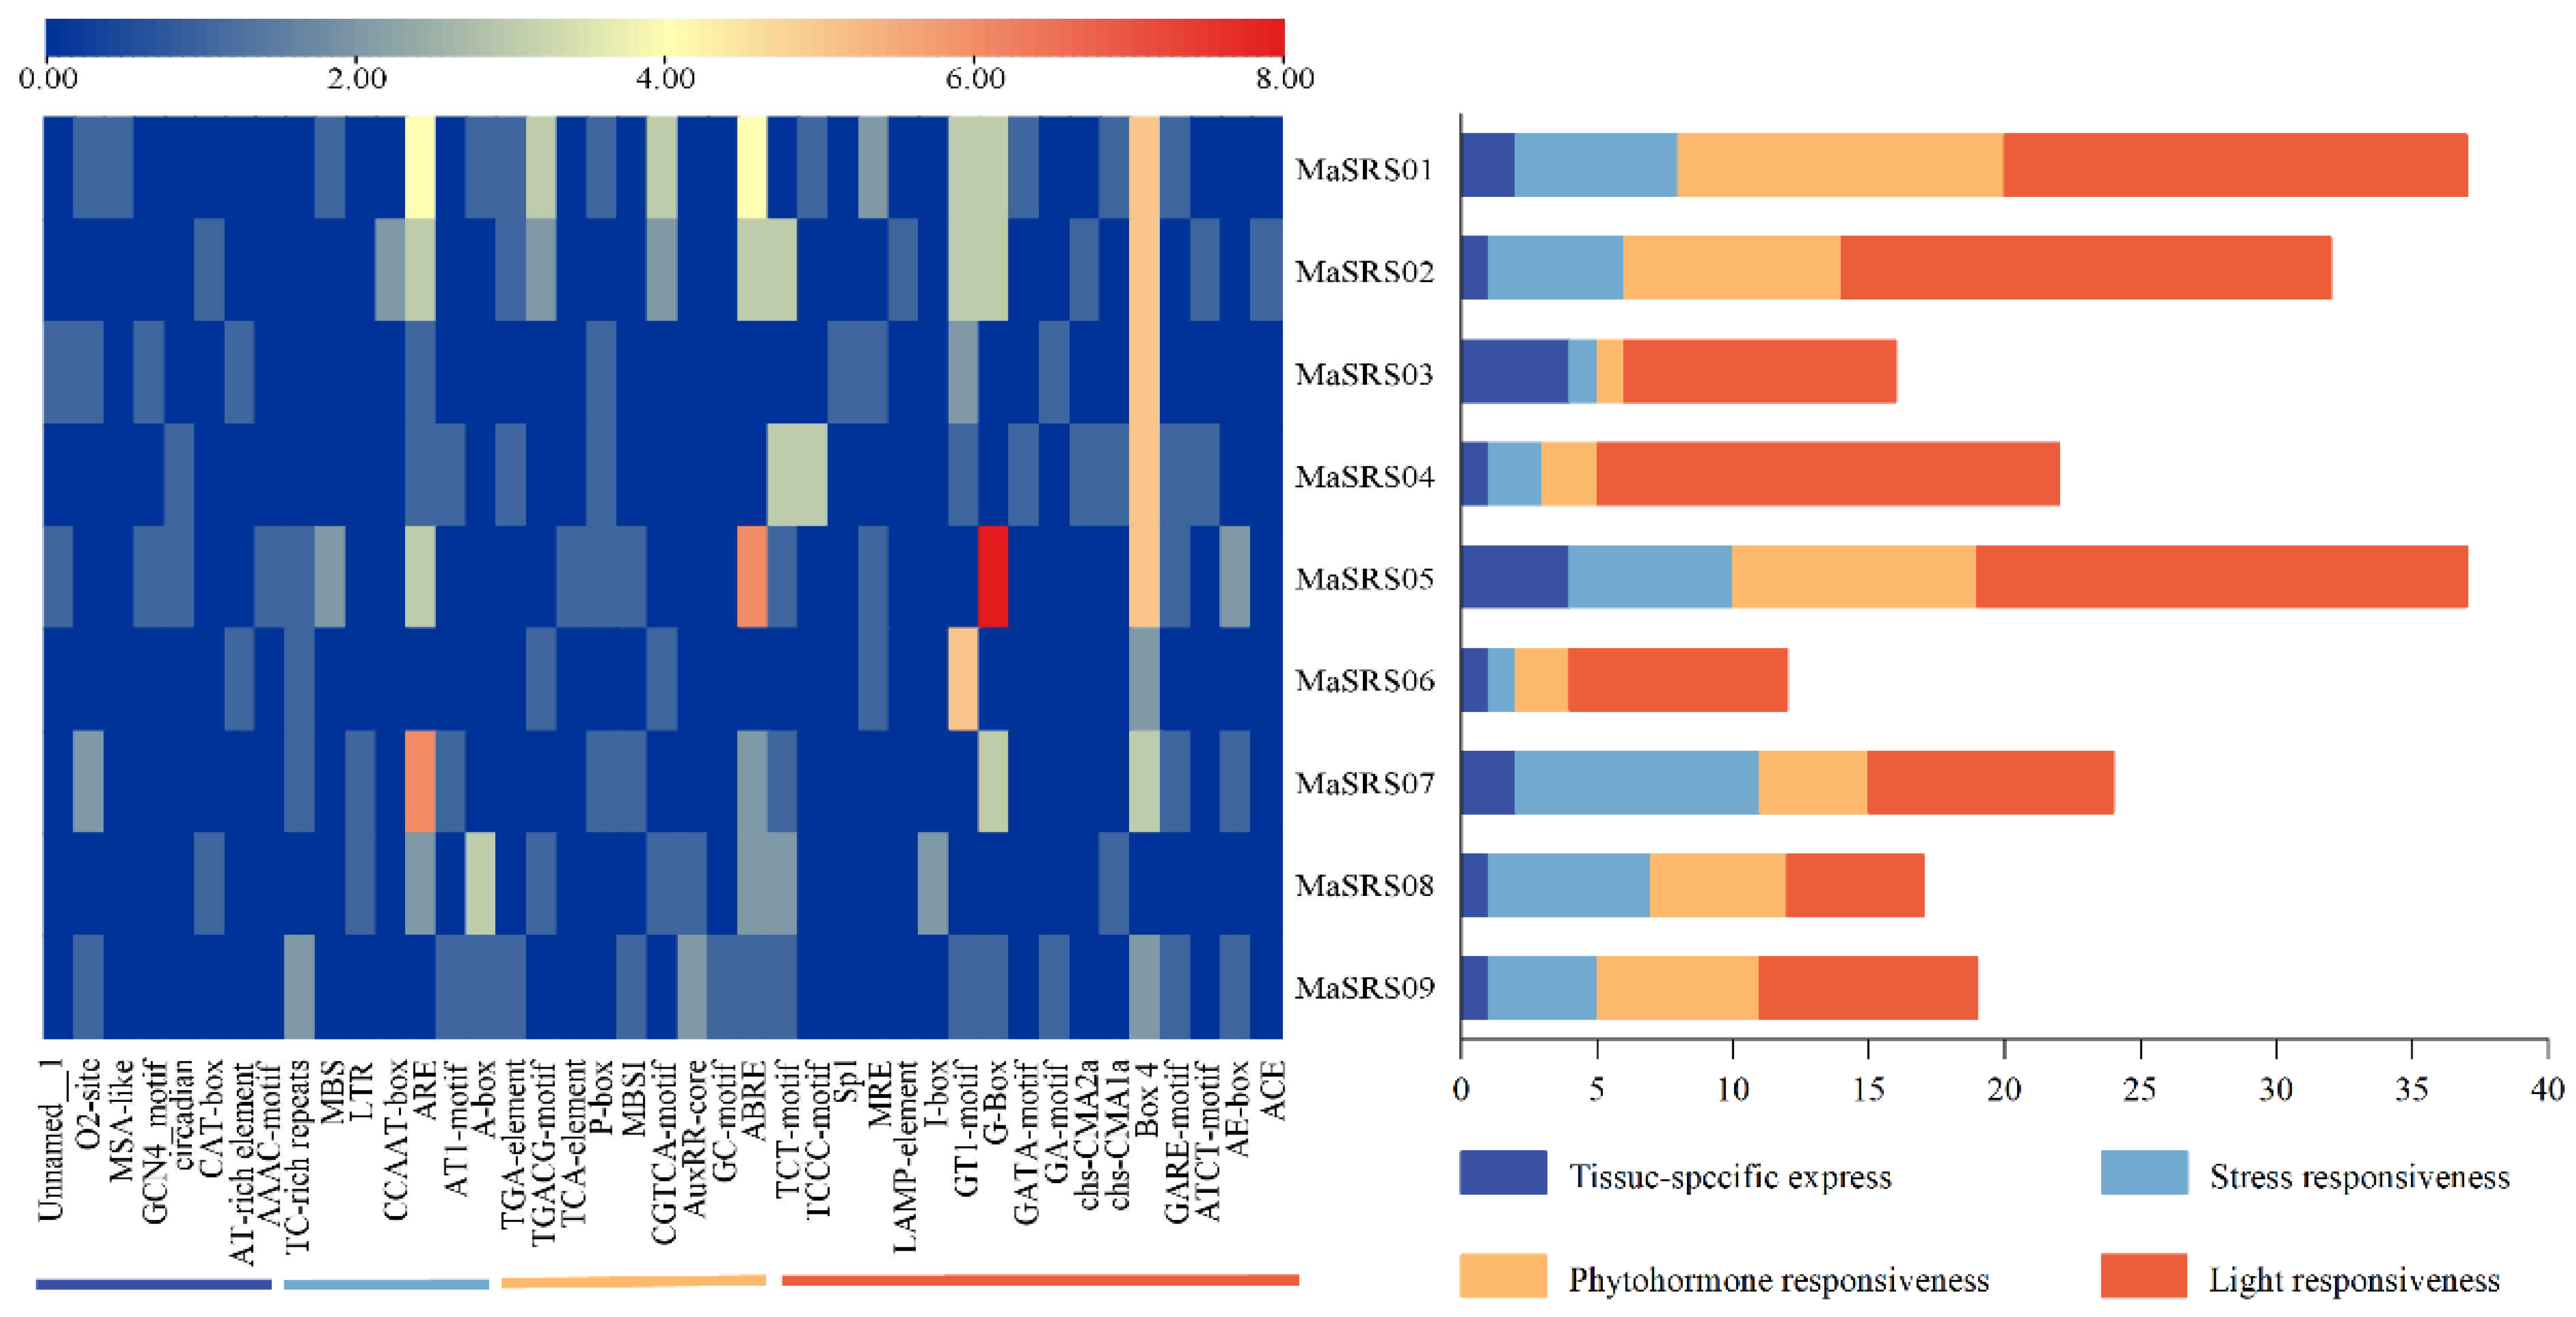
2.4. Identification and Analysis of MaSRS Promoter Cis-Acting Elements

The results of the cis-acting elements in the promoter region of the MaSRS family showed that this family contained a total of 41 specific cis-regulatory elements related to light response [17], plant hormone [9], tissue-specific expression [8], and stress response [7], respectively. The elements for the light response were the most represented, accounting for 41% of the total, while the stress response was the least represented, accounting for only 17% (Figure 5). These specific elements had their unique sequences and performed particular functions that played important roles in regulating gene expression. The gradual transition of color from blue to red in the figure shows that the abundance of the specific elements in the MaSRS gene gradually increased. The results show that the action element G-box (CACGTG), which contains six base palindrome sequences, was the most abundant in MaSRS05, followed by ABRE (AACCCGG/CACGTG/ACGTG/GCCGCGTGGC). Box4 (ATTAAT) appeared with equal frequency in MaSRS01-MaSRS05. Except for MaSRS06 and MaSRS09, the other MaSRS genes contained the cis-regulatory element ARE (AAACCA) required for anaerobic induction. The six MaSRS genes had a GT1-motif (GGTTAA/GGTTAAT), and individual genes contained some LTR (CCGAAA), TC-rich repeats (GTTTTCTTAC), MBS (CAACTG), GCN4_motif (TGAGTCA), CGTCA-motif (CGTCA), and GA-motif (ATAGATAA), which are related to low-temperature response, defense, drought resistance, involvement in endosperm expression, signaling of the hormone methyl jasmonate (MeJA) and the light response, respectively.
Different elements in each gene indicate different contributions to the family. MaSRS01 and MaSRS05 contained the most cis-acting elements, indicating that their functions were complex and diverse, whereas MaSRS06 was relatively simple. Compared with the other seven MaSRS genes, MaSRS03, and MaSRS05 had relatively many tissue-specific expression elements, suggesting that these two genes play important roles in organ development in M. albus. MaSRS07 exhibited the most elements related to stress response, suggesting that it may play an important role in abiotic stress.

2.5. Protein Interaction Network Construction and Structure Prediction of MaSRS Tfs

The STRING database contains information about direct physical interactions and potential functions of proteins in several species. Because the protein information of M. albus was missing from the database, a MaSRS protein interaction network map was constructed based on the protein information of Arabidopsis (Supplementary Figure S1). We predicted that seven AtSRSs (AtSRS3, AtSRS6, AtSRS7, LRP1, SHI, STY1, and AT1G32730) had sequence proximity and thus relates physical interaction and associated functional relationships with MaSRS genes, and five AtSRSs (AtSRS4, AtSRS8, YUC4, NGA3, and AT3G06840) had potential interaction with MaSRSs. It is worth noting that both MaSRS06 and LRP1 contained a conserved domain of Put_zinc_LRP1, and MaSRS06 could act on YUC4 through LRP1. Studies had shown that YUC4 is an enzyme that activates plant auxin biosynthesis and plays an important role in the growth of Arabidopsis seedlings, which could regulate flower shape [24]. In addition, the results showed that proteins (SHI and STY1) interact with proteins (YUC4 and NGA3). Studies had shown that NGA3 and STY3 can induce ovarian transformation into stylar tissue, and also mediate YUCCA to promote auxin synthesis in the apical pistil domain [25].
The secondary structure of the SRS proteins in M. albus was also predicted in this study. The results showed that the nine proteins are mainly composed of the random coil, which accounts for 66.91% on average. The proportion of alpha helix in MaSRS06 (44.29%) was much larger than in the other MaSRSs, while the proportion of extended chain (1.90%) and beta-turn (0.54%) was the smallest (Supplementary Table S2)
The prediction results of the 3D structure indicated that homologous proteins genes (MaSRS03 and MaSRS09) had similar 3D structures, but there were also exceptions, such as the difference between MaSRS01 and MaSRS02 (Figure 6).

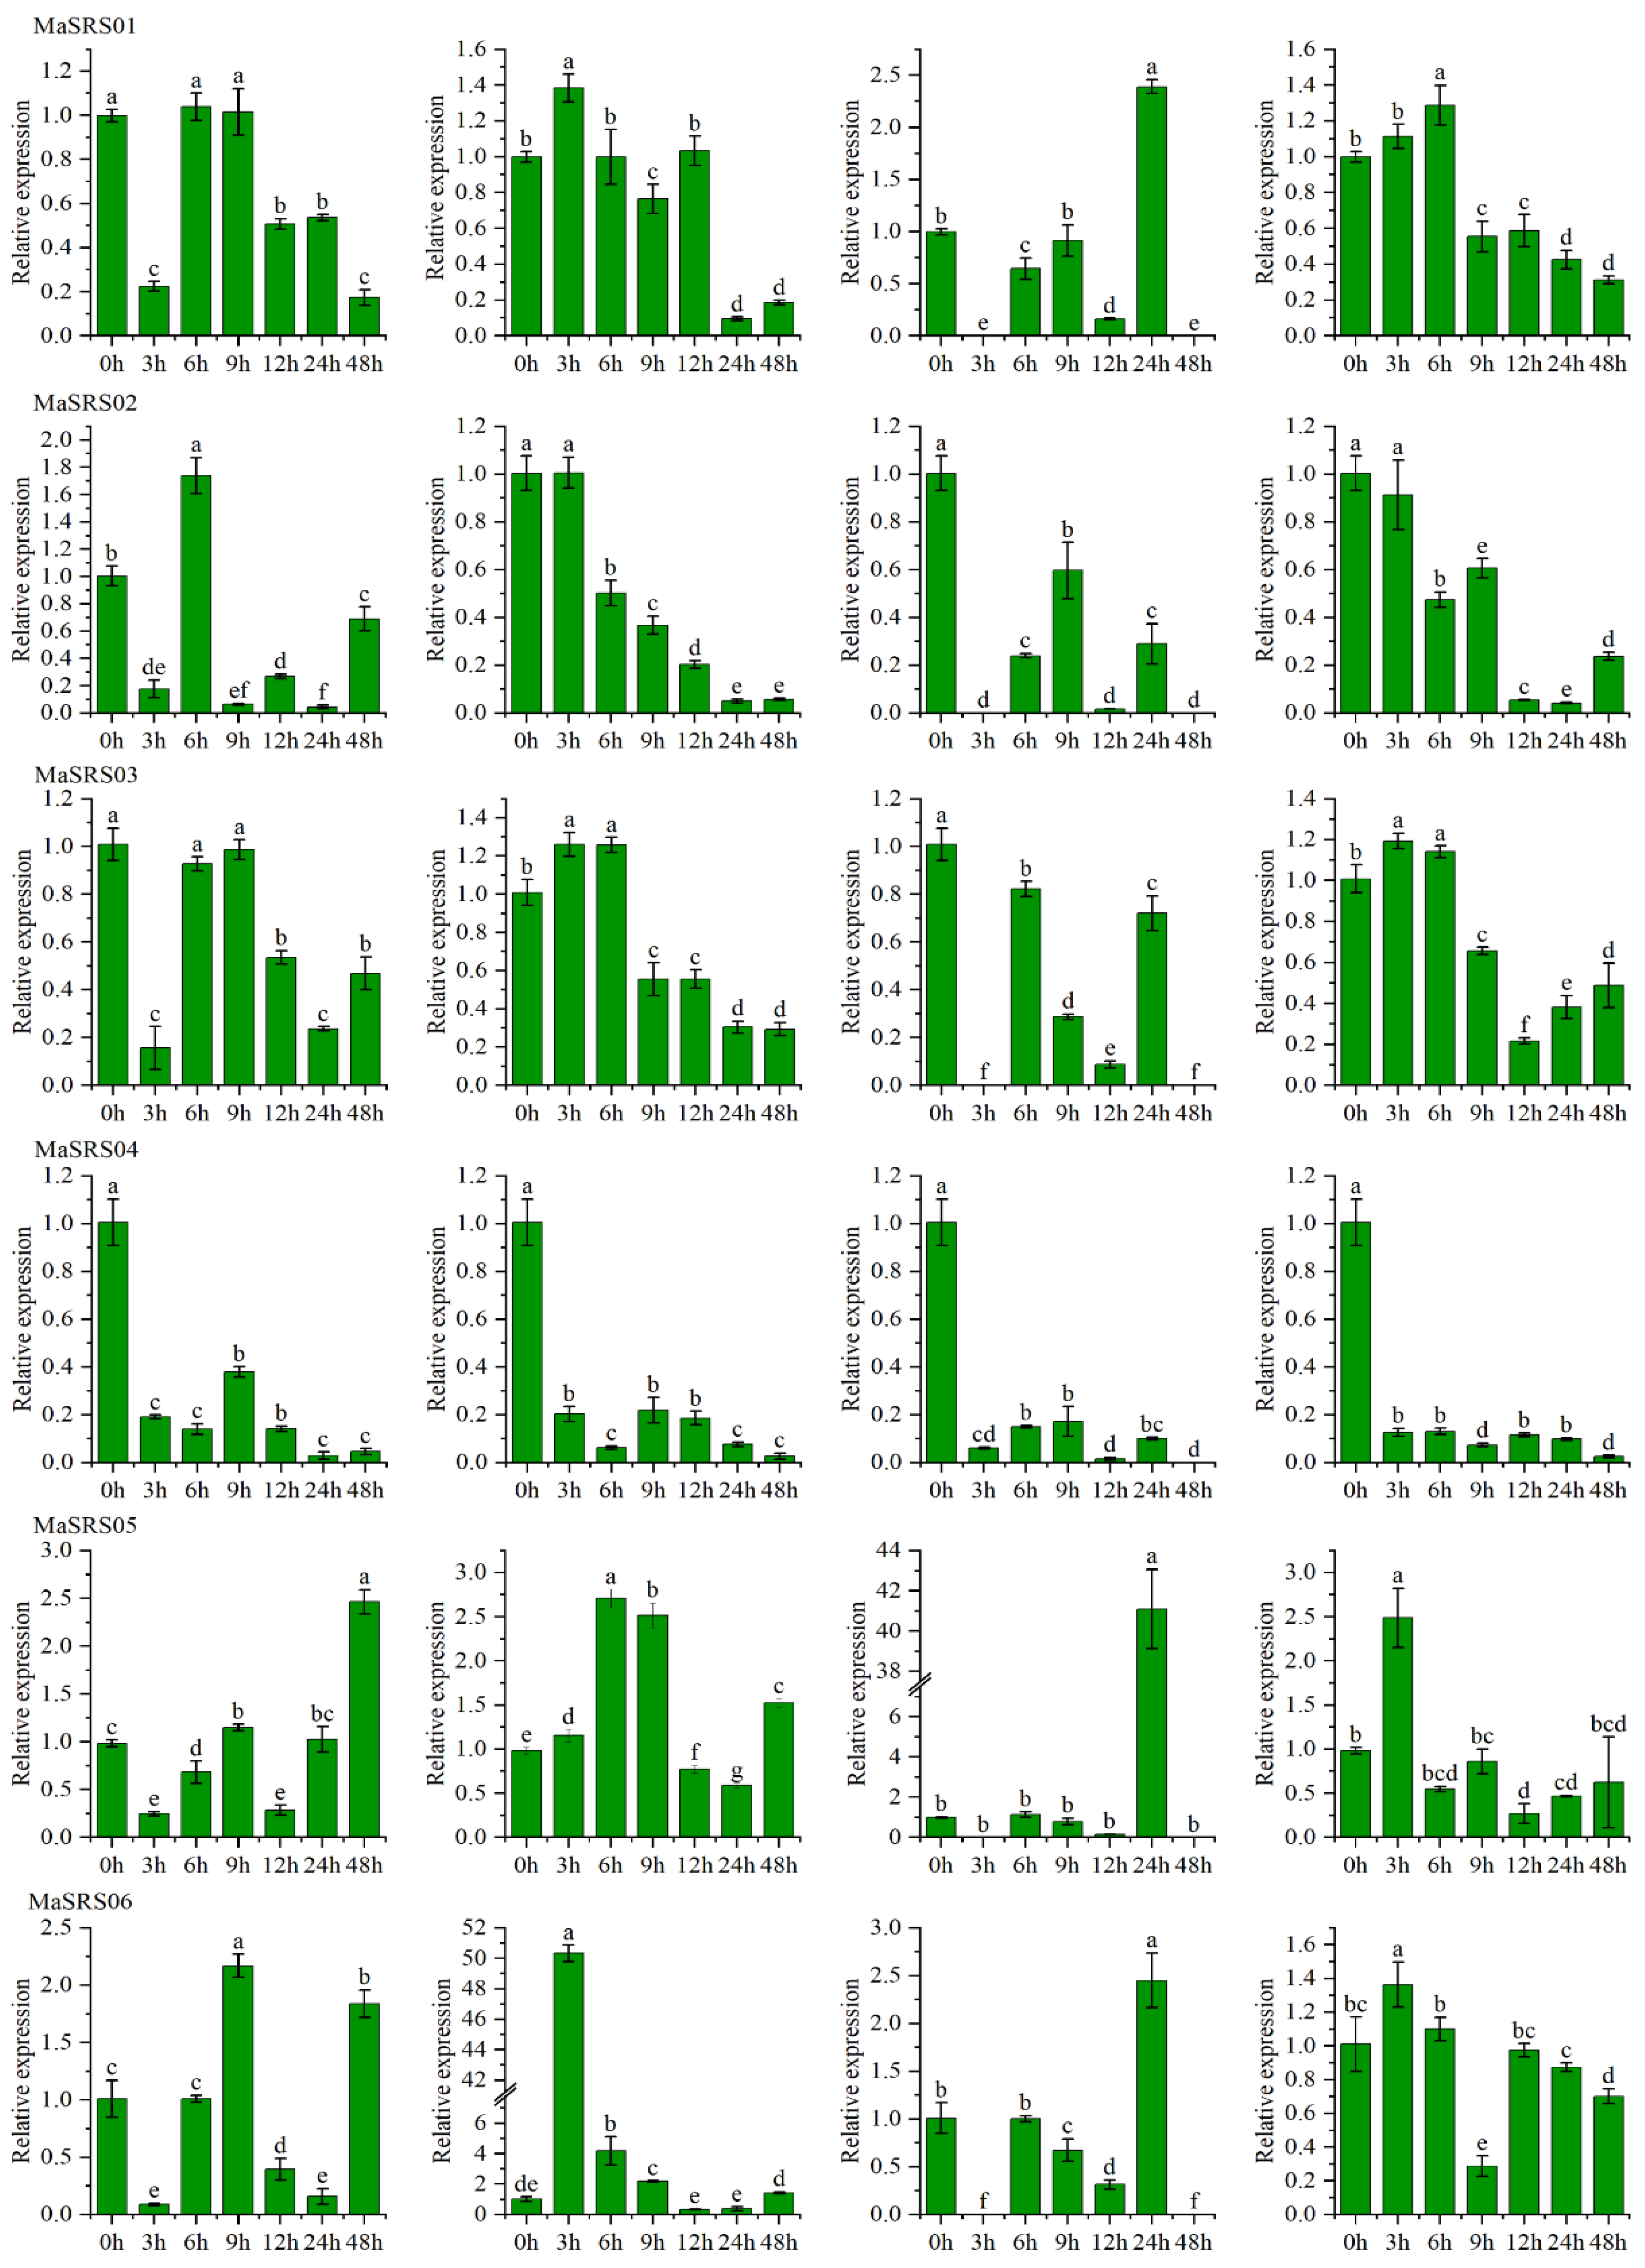
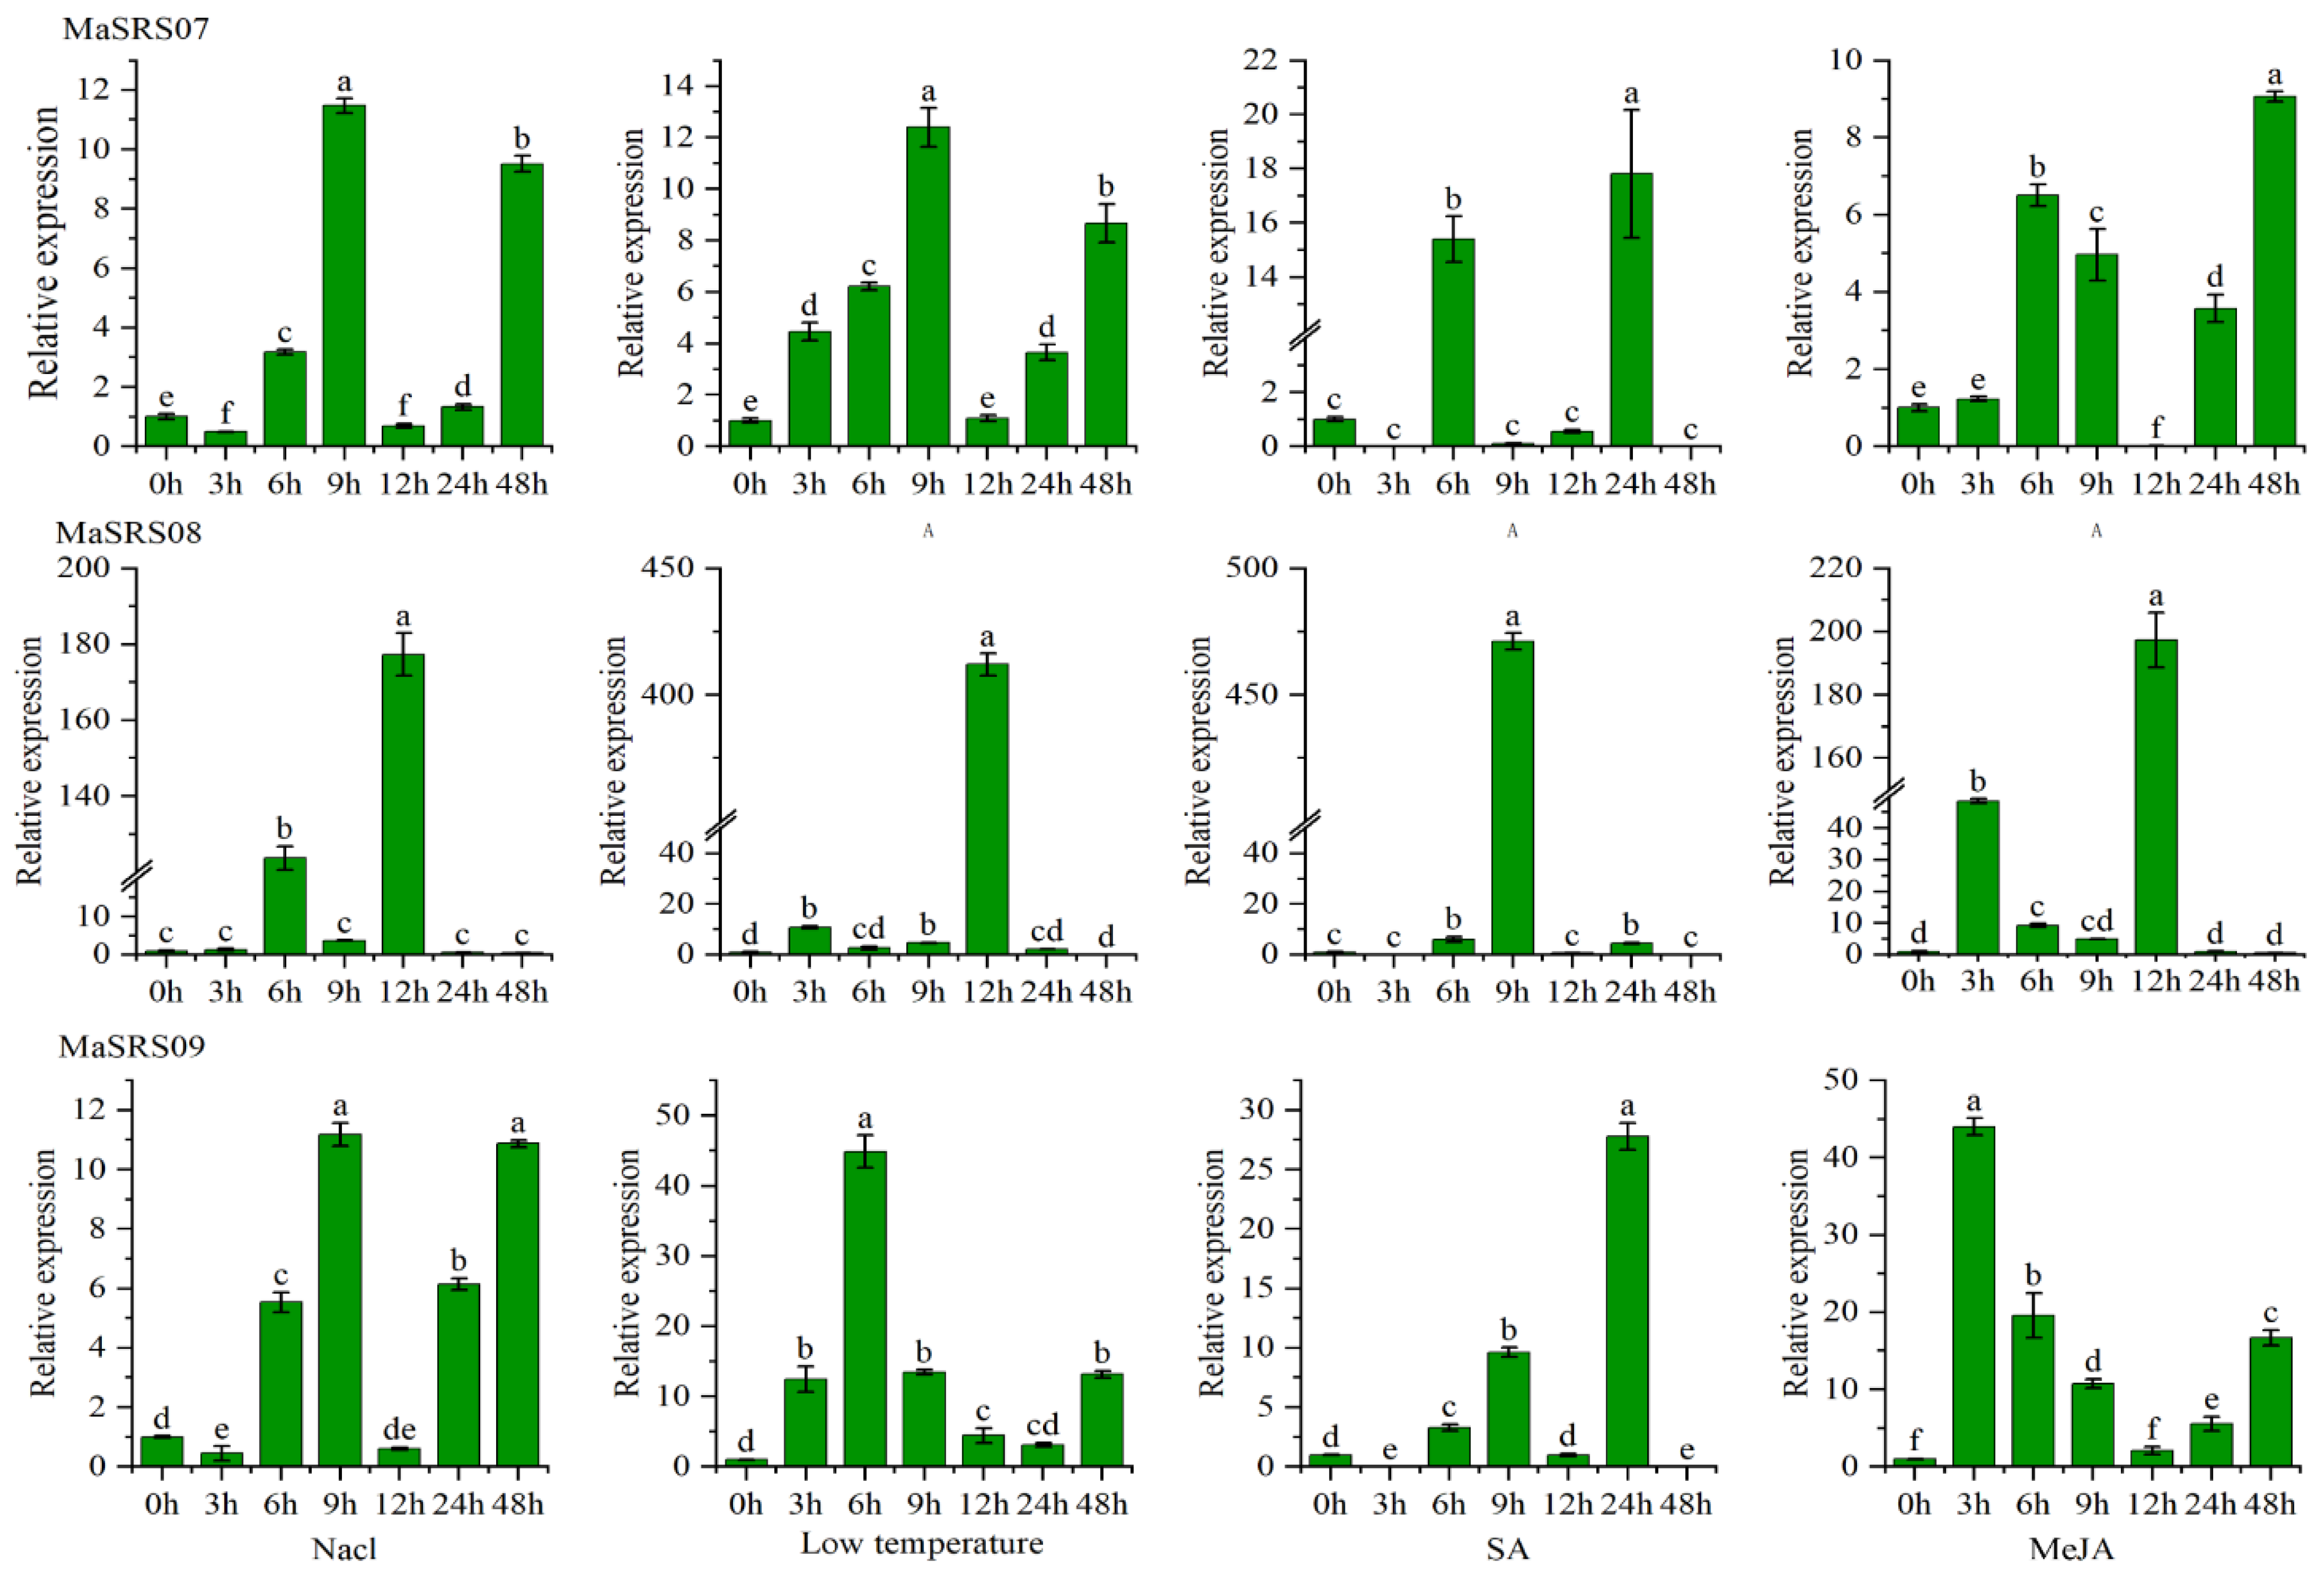
2.6. qRT-PCR Analysis of MaSRSs under Different Biotic and Abiotic Stress

Plant SRS genes play an important role in biotic and abiotic stresses. Therefore, the expression patterns of nine SRS genes in the leaves of M. albus under salinity, low-temperature, SA, and MeJA treatments were investigated in this paper (Supplementary Table S3). The results showed that these genes responded to the four treatments, although the intensity of the response was different. Compared to CK, these genes were up-down-regulated (Figure 7). Among the four treatments, the MaSRS09 was most significantly up-regulated, indicating high expression, especially under the low-temperature treatment. However, MaSRS04 showed a consistent down-regulation pattern within 48 h after the four treatments. MaSRS08 showed a high expression level after 12 h of three treatments (salinity, low-temperature, and MeJA).
Within 3 h after salinity stress, the other eight MaSRS genes were down-regulated, except for MaSRS08. After 9 h, MaSRS01, MaSRS05, MaSRS06, MaSRS07, MaSRS08, and MaSRS09 were up-regulated. After 48 h of treatment, MaSRS05, MaSRS06, MaSRS07, and MaSRS09 were significantly up-regulated. The expression of MaSRS genes at the 6 h and 24 h stress time points were up-regulated and down-regulated, respectively. For example, MaSRS09 was significantly up-regulated at the 6 h and 24 h stress time points. Within 48 h of cold treatment, the expression levels of MaSRS07 and MaSRS09 were significantly up-regulated, whereas the expression levels of MaSRS02 and MaSRS04 were down-regulated. The expression levels of MaSRS05, MaSRS06, MaSRS07, MaSRS08, and MaSRS09 were high during the 9 h treatment. Within the 3 h treatment, the expression of MaSRS02 was not significant, MaSRS04 was significantly down-regulated, and other MaSRSs were significantly up-regulated. Interestingly, the expression of MaSRS06 was highest 3 h after treatment, approximately ten times higher than at other time points. The relative expression levels of MaSRS02, MaSRS03, and MaSRS04 exposed to SA for a prolonged period (within 48 h) were down-regulated. Five MaSRSs (MaSRS05, MaSRS06, MaSRS07, MaSRS08, and MaSRS09) exhibited high expression levels within 24 h, which was consistent with the trend of expression levels within 9 h under cold stress, suggesting that these genes were more sensitive to low temperatures. It is worth noting that MaSRS05, MaSRS07, and MaSRS09 had the highest expression levels within 24 h, which was a dozen times higher than other time periods. The expression level of MaSRS08 was particularly high at 9 h, exceeding 470, several hundred times higher than at other time points. More interestingly, nine MaSRSs were barely expressed at 3 and 48 h. The expression of MaSRS07 and MaSRS09 was higher than that of CK within 48 h after MeJA stress. The expressions of six MaSRSs (MaSRS01MaSRS06) were down-regulated at 9, 12, 24, and 48 h after treatment, and the expression of six MaSRSs (MaSRS01, MaSRS02, MaSRS03, MaSRS06, MaSRS07, and MaSRS09) was up-regulated at 6 h after treatment. It is noteworthy that MaSRS08 and MaSRS09 were highly expressed after 3 h of treatment, and their expression levels were about 20 and 45, respectively. Among them, MaSRS08 had the highest expression level at 12 h, which was a dozen times higher than at other time points.

3. Discussion

In the first half of the 20th century, M. albus was considered the king of green manure and legume forage in the southern and midwestern United States [26], exhibiting the biological characteristics of cold and drought tolerance and adaptation to growth in alkaline soils. Several studies have shown that the SRS family is involved in various complex regulatory processes in growth and development [27,28]. However, the SRS family has been extensively studied in various plants, including A. thaliana [29,30], Z. mays [18], H. vulgare [16], O. sativa subsp. Japonica [31], P. vulgaris [4], M. sativa [1]. However, in M. albus, the SRS family has not yet been reported. Therefore, the current study performed a genome-wide analysis of the MaSRS family.
In this study, nine MaSRS genes were identified and classified into six subfamilies (subfamily I, subfamily II, subfamily III, subfamily IV, subfamily V, and subfamily VI) (Figure 3). The SRS genes are generally rare in plants. Twenty-seven MsSRSs have been identified in alfalfa, classified into seven subfamilies. The number of MsSRS is much higher than that of A. thaliana, Z. mays, S. oleracea, C. quinoa, M. sativa, and M. albus. The main reason may be related to the tetraploid genome and the complex evolution of alfalfa [32]. Studies demonstrated that gene duplication plays a vital role in the expansion of gene families and contributes to the diversification of biological functions [33]. For example, twenty-nine pairs of duplicated genes were found in the MsSRS family, including two tandem repeats and twenty-seven segmental repeats [1]. In this study, segmental duplication gene pairs were located on different chromosomes, and no tandem duplication occurred, indicating that the MaSRS family expansion was dominated by segmental duplication (Figure 2).
The results of subcellular localization showed that all MaSRSs are localized in the nucleus and were mainly involved in regulating gene transcription. The number of amino acids, PI, MW, and instability index of MaSRS family members was different (Table 1). For example, the PI value of MaSRS09 was the largest, and the instability index was the smallest, which was probably closely related to the diversity of MaSRS structure and biological function. We also found that closely related genes in the same subfamily share similar motif structures (Figure 4); for example, MaSRS03 and MaSRS04 contain eight identical motifs and one intron. Therefore, the composition of motifs and exon-intron combinations may affect gene function. Overall, all MaSRS genes contained at least one intron, which was consistent with the results of rice SRS genes research [3]. However, MaSRS comprised different introns and exons, leading to alternative splicing and may show diversified functions. Recently in 2020, an article on maize mentioned that two members of the ZmSRS family had no introns [18]. Based on this, it is speculated that gene expression function may be closely related to gene structure. For example, studies by [34] have shown that introns improved transcription mainly by affecting transcription rate, nuclear output, and transcriptional stability.
To better understand the evolutionary relationship of the MaSRS family, the phylogeny and evolution of SRS genes in M. albus and five other plants were analyzed, and 71 genes were grouped into seven clusters according to evolutionary relationships (Figure 3). This was consistent with the evolutionary grouping of alfalfa by [1]. The closely related MaSRS05 and MaSRS07 belonged to the same group phylogenetically, indicating that the two genes were conserved in the monoploid genome and were stable in evolution. Remarkably, MaSRS06 had one motif and four introns that were sharply different from the other gene structures. Therefore, the presumed gene function is unique. To further confirm, this study analyzed the interaction network of MaSRS proteins concerning the interaction of SRS proteins in the model plant Arabidopsis and found that MaSRS06 has similar functions to AT1G32730 and can directly interact with other SRSs (Supplementary Figure S1.). Unfortunately, the specific biological processes of AT1G32730 remain unclear. Thus, variations in gene structure might result in altered functions of MaSRS06 which needs to be verified by functional characterization by conducting more experiments. The protein-protein interaction network also suggests that YUC4 can activate plant auxin synthesis and directly interacts with Arabidopsis SRS members (AtSRS3, AtSRS6, AtSRS7, AtLRP1, AtSHI, AtSTY1) to promote seedling growth and regulate flower shape [9].
In this study, the secondary structure of the MaSRS protein was analyzed, and the 3D structure was predicted (Figure 6 and Supplementary Table S2). The results showed that all MaSRSs secondary structures are mainly random coils and do not involve the conformation of amino acid residues. It is well known that hydrogen bonds are destroyed during the folding of some amino acids and that the energy contained in the conformation of side chains conflicts with the maximal hydrogen bonds [35]. The 3D structure prediction also showed that the 3D structures of homologous proteins were similar. The 3D gain of information from the evolutionary process. This is consistent with the research findings of [36].
Over time, plants have evolved a variety of ways to adapt to the environment to survive. Gene expression has been the primary way for plants to address biotic and abiotic stresses. However, the expression of genes was regulated by their promoters or Tfs. For example, the cis-acting elements in the MaSRS promoter region could reflect the role of family members in biological and abiotic stress responses (Figure 5). Therefore, it was essential to analyze the cis-acting elements of the promoters to investigate the functions of specific genes [37,38]. These MaSRSs contained different types and numbers of promoter elements, suggesting that each gene might have its unique expression function. For example, except for MaSRS06 and MaSRS09, the other MaSRSs contained the cis-regulatory element ARE, which was necessary for anaerobic induction, indicating that ARE is highly conserved in MaSRS and may regulate stress expression of environmental adaptation genes. Six MaSRS genes contained ABRE, which may be related to salinity stress tolerance in plants [39,40]. The experimental results showed that the combination of ABRE-binding protein OsBZ8 and ABRE elements could mediate the salinity stress tolerance of rice (Oryza sativa Indica) [41]. Therefore, M. albus leaves were subjected to salinity stress, and it was found that nine MaSRSs were expressed at different time points after treatment. The expression levels of MaSRS08 and MaSRS09 were relatively high. Analysis of the SRS promoter region revealed that all MaSRSs had light-responsive elements (Box4, G-box, or Ga-Motif, etc.). The incident light essential factor for plant growth, and the promoter sequences of most members of the gene family contain multiple light-responsive elements. For example, there were numerous light-responsive elements in the promoter regions of CDPK and PYL [32,42]. Studies have also shown that the ZmRXO1 promoter can be regulated by light [43]. In addition, the light response element Box 4 was also found to be regulated by MeJA, ethylene, ABA, and other related hormones [44].
Previous studies have shown that the SRS gene plays an important role in plant organ growth, carpel development, stress, photomorphogenesis, plant hormone response, and induced lateral root formation (Figure 7) [23,45,46]. Lyu and his co-workers found that the specific expression of genes in plant tissues and organelles is closely related to their functions [47]. The q-PCR quantitative results showed that under the four treatments, all MaSRS were expressed to varying degrees in leaves. Notably, most MaSRS genes were significantly up-regulated after 3 h of low-temperature treatment, most genes were down-regulated after 3 h of salinity stress treatment, and most MaSRS genes were down-regulated after 6 h of SA and MeJA treatment. This confirmed that MaSRS could regulate cold and salinity stress and plant growth and development. To a certain extent, this explains that M. albus grows in cold and drought-tolerant environments, which provides a theoretical basis for the cultivation of M. albus in the later stage.

4. Materials and Methods

4.1. Identification of SRS Genes in Melilotus albus

The genome sequence data of M. albus was obtained from Lanzhou University [19]. SRS protein sequences of Arabidopsis thaliana, maize (Zea mays), spinach (Spinacia oleracea), quinoa (Chenopodium quinoa), and alfalfa (Medicago sativa) were downloaded from the PlantTFDB database (http://planttfdb.gao-lab.org/, accessed on 8 March 2022). M. albus SRS gene sequences were identified using BLASTP and Hidden Markov Models (HMM). The conserved domains of the identified SRS proteins were further confirmed using the online databases, i.e., NCBI-CDD (https://www.ncbi.nlm.nih.gov/cdd/, accessed on 3 April 2022), the Pfam (http://pfam.xfam.org, accessed on 3 April 2022), and SMART (http://smart.embl-heidelberg.de/, accessed on 3 April 2022). ExPASy ProtParam tool was used to analyze the physicochemical properties such as molecular weight (MV), theoretical isoelectric point (PI), hydrophilicity (GRAVY), number of amino acids, and stability index of SRS protein in M. albus (https://web.expasy.org/protparam/, accessed on 26 April 2022) [48]. In addition, the Psort-Prediction website was used to determine subcellular localization (http://psort1.hgc.jp/form.html, accessed on 4 May 2022) [49].

4.2. Analysis of Synteny, Gene Duplication, and Phylogenetic

The general feature format file (GFF3) annotation file was used in the TBtools tool to draw the distribution map of SRS family members of M. albus on chromosomes. The MCScanX function in TBtools (Version: 0.6656, Creator: Chengjie Chen, Software source: Guangzhou, Guangdong, China) [50] was used to identify and analyze syntenic blocks of the MaSRS genes. The circos program in TBtools (http://circos.ca, accessed on 6 July 2022) was used to generate synteny analysis and chromosomal location diagrams. Non-synonymous (Ka) and synonymous (Ks) rates of MaSRS gene duplication pairs were calculated with TBtools. The Ks values were used to calculate the divergence time with the following formula: T = Ks/2λ (λ = 6.56 × 10⁻⁹) for M. albus. Multiple sequence alignments of the amino acid sequences of A. thaliana, Z. mays, S. oleracea, C. quinoa, M. sativa, and M. albus were used in the ClustalW tool. Based on the maximum likelihood method (ML) of the MEGA 7.0 software, the phylogenetic tree was constructed [51], using JTT + G as the model using the bootstrap verification parameter to 1000. Finally, the constructed tree file was uploaded to Adobe Illustrator 2021 (AI) to beautify and better display it.

4.3. Analysis of the Conserved Motifs and Gene Structures

The genomic data were imported into GSDS online software (http://gsds.cbi.pku.edu.cn/, accessed on 3 April 2022) in GFF3 annotation file format to analyze the structural features of the genes [52] and map the genetic structure using TBtools [50]. The analysis of the conserved motifs of amino acids was performed using the MEME Suite (Motif-based sequence analysis tools) (MEME 4.11.1; https://meme-suite.org/, accessed on 28 March 2022) online software [52,53], setting the motif number to ten and the other parameters to the default values.

4.4. Analysis of Cis-Acting Elements of MaSRS Genes, MaSRSs Protein-Protein Interaction Networks, and Prediction of Protein 3D Structure

Using the information in the GFF3 annotation of the M. albus genome, 2000 bp sequences upstream of the transcription start site of each SRS gene were extracted using TBtools [50]. Then, cis-acting elements in the promoter region of the SRS gene were predicted using the PlantCARE website (http://bioinformatics.psb.ugent.be/webtools/plantcare/html/, accessed on 22 April 2022) [54]. Search results were collected, filtered, and presented in a graphical format. Using A. thaliana as a template, the SRS protein interaction network (confidence > 0.8) was constructed using the STRING database (http://string-db.org, accessed on 27 April 2022), the software [55]. The secondary structure of the protein was analyzed by the SOPM (https://npsa-prabi.ibcp.fr/cgi-bin/npsa_automat.pl?page=npsa_sopma.html, accessed on 26 April 2022) program [56], and the spatial structure of the protein was 3D modeled using SWISS-MODEL, an online database (https://swissmodel.expasy.org/interactive, accessed on 20 March 2022) [57]. Each gene model was also evaluated by Ramachandran plots to increase its credibility [58].

4.5. Plant Cultivation and Stress Treatments

The M. albus seeds with uniform shapes and full grains were selected. The seed coat was removed from the seeds and sterilized the seeds with 75% alcohol for 3–5 min, and then rinsed with sterile deionized water (4–5 times), and finally transferred to culture dishes with sterile filter paper. These culture dishes were placed in an incubator with a temperature of 24 °C, an illumination period of 16 h, and relative humidity of 55–60%. After the leaves were fully opened, the seedlings were transplanted into the flowerpot for further cultivation. The 4-week-old M. albus plants in the same growth state were subjected to four stress treatments: (1) salicylic acid (SA) stress: plants were given 300 mL water per pot having 200 μmol/L SA concentration (2) Methyl jasmonate (MeJA) stress: plants were given 300 mL water per pot, having 200 μmol/L MeJA concentration; (3) salinity stress: plants were supplied with 300 mL water per pot, having 200 μmol/L NaCl concentration; (4) cold stress: 4 °C treatment. M. albus plants were sampled at 0, 3, 6, 9, 12, 24, and 48 h after induction of low temperature, i.e., 4 °C. The tissues sampled for RT-PCR analysis were the leaves of M. albus on 27 April 2022. Samples were flash frozen in liquid nitrogen and then stored in a freezer at −80 °C for subsequent quantitative experiments.

4.6. RNA Extraction and Real-Time Fluorescence Quantitative PCR Analysis of MaSRS

Total RNA was extracted from leaf samples using the SYBR Green Premix Pro Taq HS Premix Extraction Kit (Accurate Biotechnology, Changsha, Hunan, China), and a Nano-Drop 2000 UV spectrophotometer (Thermo Fisher Scientific, Waltham, MA, USA) was used to determine RNA concentration (Thermo Fisher Scientific, Waltham, MA, USA). Next, we reverse-transcribed the RNA with the M-Mu LV first-strand cDNA synthesis kit to obtain cDNA, and cDNA concentration was measured and diluted to 100 ng/μL, which served as a template for RT -qPCR reaction mixture. The expression of 9 MaSRS genes at the CK and four stress factors were measured by quantitative real-time fluorescence PCR (RT -qPCR). Perl Primer 6 software was used to design specific primers for this study (Supplementary Table S4). PCR amplification steps: denaturation at 95 °C for 10 s, denaturation at 95 °C for 5 s, and 40 cycles at 60 °C for 30 s of continuous denaturation. In addition, the relative expression levels of MaSRS were calculated using the 2−ΔΔCt method [59]. For RT -qPCR, three biological replicates were used for each treatment, and three technical replicates were used for each reaction to eliminate operational errors.

4.7. Statistical Analysis

We used SPSS statistical software for one-way ANOVA to analyze the significance of the relative expression of MaSRS genes under multiple stress treatments. The treatment means were compared using the LSD test at a significance level, i.e., p ≤ 0.05, and graphs were plotted using Origin 2021 software(Version: 9.95, Creator: OriginLab, Software source: Northampton, MA, USA).

5. Conclusions

This study was the first comprehensive identification and analysis of the SRS gene family in M. albus. The nine MaSRS genes are located on six of eight chromosomes and are divided into six subgroups. MaSRS genes of the same subgroup have similar structures and motifs. There are four types of response elements in the promoter region, among which light-responsive elements are the most common. MaSRS06 interacts with other MaSRS and finally interacts with YUC4. This study focused on the expression analysis response of the MaSRS family under the four treatments, and the results showed that all genes were up-regulated or down-regulated to varying degrees under the four treatments. In the future, based on the identification and characteristics of these MaSRS genes, further functional annotation of these genes will help to cultivate stress-tolerant varieties of M. albus.

Supplementary Materials

The following supporting information can be downloaded at: https://www.mdpi.com/article/10.3390/plants11223101/s1, Figure S1: Construction of a MaSRS protein interaction network map based on Arabidopsis homologous protein interaction information; Table S1: The SRS protein sequence information in this study; Table S2: Secondary structure prediction of MaSRS protein; Table S3: The original data of expression of 9 genes by RT-qPCR; Table S4: MaSRS primer design.

Author Contributions

L.N. contributed to conceptualization; X.L. and Y.Y. provided funding acquisition; Y.Y. and X.Z. (Xiaolin Zhu) provided resources; B.M. contributed to writing-original draft preparation; N.u.A. and F.U.H. contributed to writing—review and editing; Y.L., P.B., X.Z. (Xiaoning Zhang) and Z.X. contributed to software; Q.L. and Z.M. helped in the collection of experimental samples. All authors have read and agreed to the published version of the manuscript.

Funding

This research was funded by National Natural Science Foundation of China (31601984), Coordinated Relationship between Land Urbanization and Population Cities (GSAU-ZL-2015-046), Scientific Research Start-up Funds for Openly Recruited Doctors of Gansu Agriculture University (2017RCZX32), Youth Science and Technology Fund of Gansu Province (20JR5RA014).

Institutional Review Board Statement

Not applicable.

Informed Consent Statement

Not applicable.

Data Availability Statement

Not applicable.

Acknowledgments

Not applicable.

Conflicts of Interest

The authors declare no conflict of interest.

References

  1. Yang, Y.; Qi, L.; Nian, L.; Zhu, X.; Yi, X.; Zhang, J.; Qiu, J. Genome-Wide Identification and Expression Analysis of the SRS Gene Family in Medicago sativa. DNA Cell Biol. 2021, 40, 1539–1553. [Google Scholar] [CrossRef] [PubMed]
  2. Zhao, S.P.; Song, X.Y.; Guo, L.L.; Zhang, X.Z.; Zheng, W.J. Genome-Wide Analysis of the Shi-Related Sequence Family and Functional Identification of Gmsrs18 Involving in Drought and Salt Stresses in Soybean. Int. J. Mol. Sci. 2020, 21, 1810. [Google Scholar] [CrossRef] [PubMed] [Green Version]
  3. Yang, J.; Xu, P.; Yu, D. Genome-Wide Identification and Characterization of the SHI-Related Sequence Gene Family in Rice. Evol. Bioinforma. 2020, 16. [Google Scholar] [CrossRef]
  4. Büyük, İ.; Okay, A.; Aras, S. Identification and Characterization of SRS Genes in Phaseolus Vulgaris Genome and Their Responses Under Salt Stress. Biochem. Genet. 2022, 60, 482–503. [Google Scholar] [CrossRef]
  5. Stone, S.L.; Hauksdóttir, H.; Troy, A.; Herschleb, J.; Kraft, E.; Callis, J. Functional Analysis of the RING-Type Ubiquitin Ligase Family of Arabidopsis. Plant Physiol. 2005, 137, 13–30. [Google Scholar] [CrossRef] [Green Version]
  6. Elenbaas, B.; Dobbelstein, M.; Roth, J.; Shenk, T.; Levine, A.J. The MDM2 Oncoprotein Binds Specifically to RNA through Its Ring Finger Domain. Mol. Med. 1996, 2, 439–451. [Google Scholar] [CrossRef] [PubMed] [Green Version]
  7. Fridborg, I.; Kuusk, S.; Robertson, M.; Sundberg, E. The Arabidopsis Protein SHI Represses Gibberellin Responses in Arabidopsis and Barley. Plant Physiol. 2001, 127, 937–948. [Google Scholar] [CrossRef]
  8. Kuusk, S.; Sohlberg, J.J.; Magnus Eklund, D.; Sundberg, E. Functionally Redundant SHI Family Genes Regulate Arabidopsis Gynoecium Development in a Dose-Dependent Manner. Plant J. 2006, 47, 99–111. [Google Scholar] [CrossRef]
  9. Eklund, D.M.; Ståldal, V.; Valsecchi, I.; Cierlik, I.; Eriksson, C.; Hiratsu, K.; Takagi, M.O.; Sundström, J.F.; Thelander, M.; Ezcurra, I.; et al. The Arabidopsis thaliana STYLISH1 protein acts as a transcriptional activator regulating auxin biosynthesis. The Plant Cell 2010, 22, 349–363. [Google Scholar] [CrossRef] [Green Version]
  10. Hossain, M.S.; Shrestha, A.; Zhong, S.; Miri, M.; Austin, R.S.; Sato, S.; Ross, L.; Huebert, T.; Tromas, A.; Torres-Jerez, I.; et al. Lotus Japonicus NF-YA1 Plays an Essential Role during Nodule Differentiation and Targets Members of the SHI/STY Gene Family. Mol. Plant-Microbe Interact. 2016, 29, 950–964. [Google Scholar] [CrossRef]
  11. Singh, S.; Yadav, S.; Singh, A.; Mahima, M.; Singh, A.; Gautam, V.; Sarkar, A.K. Auxin Signaling Modulates LATERAL ROOT PRIMORDIUM1 (LRP1) Expression during Lateral Root Development in Arabidopsis. Plant J. 2020, 101, 87–100. [Google Scholar] [CrossRef] [PubMed]
  12. Baylis, T.; Cierlik, I.; Sundberg, E.; Mattsson, J. SHORT INTERNODES/STYLISH Genes, Regulators of Auxin Biosynthesis, Are Involved in Leaf Vein Development in Arabidopsis thaliana. New Phytol. 2013, 197, 737–750. [Google Scholar] [CrossRef] [PubMed]
  13. Gomariz-Fernández, A.; Sánchez-Gerschon, V.; Fourquin, C.; Ferrándiz, C. The Role of SHI/STY/SRS Genes in Organ Growth and Carpel Development Is Conserved in the Distant Eudicot Species Arabidopsis Thaliana and Nicotiana Benthamiana. Front. Plant Sci. 2017, 8, 814. [Google Scholar] [CrossRef] [Green Version]
  14. Yuan, T.T.; Xu, H.H.; Zhang, Q.; Zhang, L.Y.; Lu, Y.T. The Cop1 Target Shi-Related Sequence5 Directly Activates Photomorphogenesis-Promoting Genes. Plant Cell 2018, 30, 2368–2382. [Google Scholar] [CrossRef] [Green Version]
  15. Yuan, T.T.; Xu, H.H.; Li, J.; Lu, Y.T. Auxin Abolishes SHI-RELATED SEQUENCE5-Mediated Inhibition of Lateral Root Development in Arabidopsis. New Phytol. 2020, 225, 297–309. [Google Scholar] [CrossRef] [PubMed] [Green Version]
  16. Youssef, H.M.; Eggert, K.; Koppolu, R.; Alqudah, A.M.; Poursarebani, N.; Fazeli, A.; Sakuma, S.; Tagiri, A.; Rutten, T.; Govind, G.; et al. VRS2 Regulates Hormone-Mediated Inflorescence Patterning in Barley. Nat. Genet. 2017, 49, 157–161. [Google Scholar] [CrossRef] [PubMed]
  17. Takahisa, Y.; Yuko, Y.; Hiroyuki, K.; Takashi, M.; Udda, L.; Kazuhiro, S.; Masahiki, I.; Stephen, A.J.; Shin, T. A SHORT INTERNODES (SHI) Family Transcription Factor Gene Regulates Awn Elongation and Pistil Morphology in Barley. J. Exp. Bot. 2012, 63, 5223–5232. [Google Scholar]
  18. He, B.; Shi, P.; Lv, Y.; Gao, Z.; Chen, G. Gene Coexpression Network Analysis Reveals the Role of SRS Genes in Senescence Leaf of Maize (Zea Mays L.). J. Genet. 2020, 99, 3. [Google Scholar] [CrossRef]
  19. Wu, F.; Duan, Z.; Xu, P.; Yan, Q.; Meng, M.; Cao, M.; Jones, C.S.; Zong, X.; Zhou, P.; Wang, Y.; et al. Genome and Systems Biology of Melilotus Albus Provides Insights into Coumarins Biosynthesis. Plant Biotechnol. J. 2022, 20, 592–609. [Google Scholar] [CrossRef]
  20. Zhang, J.; Di, H.; Luo, K.; Jahufer, Z.; Wu, F.; Duan, Z.; Stewart, A.; Yan, Z.; Wang, Y. Coumarin Content, Morphological Variation, and Molecular Phylogenetics of Melilotus. Molecules 2018, 23, 810. [Google Scholar] [CrossRef] [Green Version]
  21. Wu, F.; Luo, K.; Yan, Z.; Zhang, D.; Yan, Q.; Zhang, Y.; Yi, X.; Zhang, J. Analysis of MiRNAs and Their Target Genes in Five Melilotus Albus NILs with Different Coumarin Content. Sci. Rep. 2018, 8, 14138. [Google Scholar] [CrossRef] [PubMed]
  22. Zabala, J.M.; Marinoni, L.; Giavedoni, J.A.; Schrauf, G.E. Breeding Strategies in Melilotus Albus Desr., a Salt-Tolerant Forage Legume. Euphytica 2018, 214, 22. [Google Scholar] [CrossRef]
  23. Hong, J.K.; Kim, J.A.; Kim, J.S.; Lee, S.I.; Koo, B.S.; Lee, Y.H. Overexpression of Brassica Rapa SHI-RELATED SEQUENCE Genes Suppresses Growth and Development in Arabidopsis thaliana. Biotechnol. Lett. 2012, 34, 1561–1569. [Google Scholar] [CrossRef] [PubMed]
  24. Chen, S.; Kaeppler, S.M.; Vogel, K.P.; Casler, M.D. Selection Signatures in Four Lignin Genes from Switchgrass Populations Divergently Selected for In Vitro Dry Matter Digestibility. PLoS ONE 2016, 11, e0167005. [Google Scholar] [CrossRef] [Green Version]
  25. Trigueros, M.; Navarrete-Gómez, M.; Sato, S.; Christensen, S.K.; Pelaz, S.; Weigel, D.; Yanofsky, M.F.; Ferrándiza, C. The NGATHA Genes Direct Style Development in the Arabidopsis Gynoecium. Plant Cell 2009, 21, 1394–1409. [Google Scholar] [CrossRef] [Green Version]
  26. Clark, A. Managing Cover Crops Profitably, 3rd ed.; SARE Handbook Series, Book 9; DIANE Publishing: Collingdale, PA, USA, 2007. [Google Scholar]
  27. Sohlberg, J.J.; Myrenås, M.; Kuusk, S.; Lagercrantz, U.; Kowalczyk, M.; Sandberg, G.; Sundberg, E. STY1 Regulates Auxin Homeostasis and Affects Apical-Basal Patterning of the Arabidopsis Gynoecium. Plant J. 2006, 47, 112–123. [Google Scholar] [CrossRef]
  28. Ståldal, V.; Cierlik, I.; Landberg, K.; Myrenås, M.; Sundström, J.F.; Eklund, D.M.; Chen, S.; Baylis, T.; Ljung, K.; Sundberg, E. The Arabidopsis Thaliana Transcriptional Activator STYLISH1 Regulates Genes Affecting Stamen Development, Cell Expansion and Timing of Flowering. Plant Mol. Biol. 2012, 78, 545–559. [Google Scholar] [CrossRef]
  29. Kim, S.G.; Lee, S.; Kim, Y.S.; Yun, D.J.; Woo, J.C.; Park, C.M. Activation Tagging of an Arabidopsis SHI-RELATED SEQUENCE Gene Produces Abnormal Anther Dehiscence and Floral Development. Plant Mol. Biol. 2010, 74, 337–351. [Google Scholar] [CrossRef]
  30. Eklund, D.M.; Thelander, M.; Landberg, K.; Ståldal, V.; Nilsson, A.; Johansson, M.; Valsecchi, I.; Pederson, E.R.A.; Kowalczyk, M.; Ljung, K.; et al. Homologues of the Arabidopsis Thaliana SHI/STY/LRP1 Genes Control Auxin Biosynthesis and Affect Growth and Development in the Moss Physcomitrella Patens. Development 2010, 137, 1275–1284. [Google Scholar] [CrossRef] [Green Version]
  31. Duan, E.; Wang, Y.; Li, X.; Lin, Q.; Zhang, T.; Wang, Y.; Zhou, C.; Zhang, H.; Jiang, L.; Wang, J.; et al. Osshi1 Regulates Plant Architecture through Modulating the Transcriptional Activity of Ipa1 in Rice. Plant Cell 2019, 31, 1026–1042. [Google Scholar] [CrossRef] [Green Version]
  32. Nian, L.; Zhang, X.; Yi, X.; Liu, X.; Ain, N.u.; Yang, Y.; Li, X.; Haider, F.U.; Zhu, X. Genome-Wide Identification of ABA Receptor PYL/RCAR Gene Family and Their Response to Cold Stress in Medicago Sativa L. Physiol. Mol. Biol. Plants 2021, 27, 1979–1995. [Google Scholar] [CrossRef] [PubMed]
  33. Conant, G.C.; Wolfe, K.H. Turning a Hobby into a Job: How Duplicated Genes Find New Functions. Nat. Rev. Genet. 2008, 9, 938–950. [Google Scholar] [CrossRef] [PubMed]
  34. Shaul, O. How Introns Enhance Gene Expression. Int. J. Biochem. Cell Biol. 2017, 91, 145–155. [Google Scholar] [CrossRef] [PubMed]
  35. Hooft, R.W.W.; Sander, C.; Vriend, G. Positioning Hydrogen Atoms by Optimizing Hydrogen-bond Networks in Protein Structures. Proteins Struct. Funct. Genet. 1996, 26, 363–376. [Google Scholar] [CrossRef]
  36. Jin, X.; Yin, X.; Ndayambaza, B.; Zhang, Z.; Min, X.; Lin, X.; Wang, Y.; Liu, W. Genome-Wide Identification and Expression Profiling of the ERF Gene Family in Medicago Sativa L. Under Various Abiotic Stresses. DNA Cell Biol. 2019, 38, 1056–1068. [Google Scholar] [CrossRef] [PubMed]
  37. Wang, Y.; Wang, C.; Rajaofera, M.J.N.; Zhu, L.; Liu, W.; Zheng, F.; Miao, W. WY7 Is a Newly Identified Promoter from the Rubber Powdery Mildew Pathogen That Regulates Exogenous Gene Expression in Both Monocots and Dicots. PLoS ONE 2020, 15, e0233911. [Google Scholar] [CrossRef]
  38. Ma, Y.; Wei, N.; Wang, Q.; Liu, Z.; Liu, W. Genome-Wide Identification and Characterization of the Heavy Metal ATPase (HMA) Gene Family in Medicago Truncatula under Copper Stress. Int. J. Biol. Macromol. 2021, 193, 893–902. [Google Scholar] [CrossRef] [PubMed]
  39. Narusaka, Y.; Nakashima, K.; Shinwari, Z.K.; Sakuma, Y.; Furihata, T.; Abe, H.; Narusaka, M.; Shinozaki, K.; Yamaguchi-Shinozaki, K. Interaction between Two Cis-Acting Elements, ABRE and DRE, in ABA-Dependent Expression of Arabidopsis Rd29A Gene in Response to Dehydration and High-Salinity Stresses. Plant J. 2003, 34, 137–148. [Google Scholar] [CrossRef] [PubMed]
  40. Hobo, T.; Asada, M.; Kowyama, Y.; Hattori, T. ACGT-Containing Abscisic Acid Response Element (ABRE) and Coupling Element 3 (CE3) Are Functionally Equivalent. Plant J. 1999, 19, 679–689. [Google Scholar] [CrossRef]
  41. Mukherjee, K.; Choudhury, A.R.; Gupta, B.; Gupta, S.; Sengupta, D.N. An ABRE-Binding Factor, OSBZ8, Is Highly Expressed in Salt Tolerant Cultivars than in Salt Sensitive Cultivars of Indica Rice. Handb. Environ. Chem. Vol. 5 Water Pollut. 2006, 6, 18. [Google Scholar] [CrossRef] [Green Version]
  42. Dekomah, S.D.; Wang, Y.; Qin, T.; Xu, D.; Sun, C.; Yao, P.; Liu, Y.; Bi, Z.; Bai, J. Identification and Expression Analysis of Calcium-Dependent Protein Kinases Gene Family in Potato Under Drought Stress. Front. Genet. 2022, 13, 874397. [Google Scholar] [CrossRef] [PubMed]
  43. Chen, X.L.; Song, R.T.; Yu, M.Y.; Sui, J.M.; Wang, J.S.; Qiao, L.X. Cloning and Functional Analysis of the Chitinase Gene Promoter in Peanut. Genet. Mol. Res. 2015, 14, 12710–12722. [Google Scholar] [CrossRef] [PubMed]
  44. Chen, S.; Ren, H.; Luo, Y.; Feng, C.; Li, H. Genome-Wide Identification of Wheat (Triticum Aestivum L.) Expansin Genes and Functional Characterization of TaEXPB1A. Environ. Exp. Bot. 2021, 182, 104307. [Google Scholar] [CrossRef]
  45. Schmid, M.; Davison, T.S.; Henz, S.R.; Pape, U.J.; Demar, M.; Vingron, M.; Schölkopf, B.; Weigel, D.; Lohmann, J.U. A Gene Expression Map of Arabidopsis Thaliana Development. Nat. Genet. 2005, 37, 501–506. [Google Scholar] [CrossRef] [PubMed]
  46. Zawaski, C.; Kadmiel, M.; Ma, C.; Gai, Y.; Jiang, X.; Strauss, S.H.; Busov, V.B. SHORT INTERNODES-like Genes Regulate Shoot Growth and Xylem Proliferation in Populus. New Phytol. 2011, 191, 678–691. [Google Scholar] [CrossRef]
  47. Lyu, G.; Li, D.; Li, S. Bioinformatics Analysis of BBX Family Genes and Its Response to UV-B in Arabidopsis thaliana. Plant Signal. Behav. 2020, 15, 1782647. [Google Scholar] [CrossRef]
  48. Gasteiger, E.; Gattiker, A.; Hoogland, C.; Ivanyi, I.; Appel, R.D.; Bairoch, A. ExPASy: The proteomics server for in-depth protein knowledge and analysis. Nucleic Acids Res. 2003, 31, 3784–3788. [Google Scholar] [CrossRef] [Green Version]
  49. Gardy, J.L.; Laird, M.R.; Chen, F.; Rey, S.; Walsh, C.J.; Ester, M.; Brinkman, F.S.L. PSORTb v.2.0: Expanded Prediction of Bacterial Protein Subcellular Localization and Insights Gained from Comparative Proteome Analysis. Bioinformatics 2005, 21, 617–623. [Google Scholar] [CrossRef] [Green Version]
  50. Chen, K.; Li, G.J.; Bressan, R.A.; Song, C.P.; Zhu, J.K.; Zhao, Y. Abscisic Acid Dynamics, Signaling, and Functions in Plants. J. Integr. Plant Biol. 2020, 62, 25–54. [Google Scholar] [CrossRef] [Green Version]
  51. Kumar, S.; Stecher, G.; Tamura, K. MEGA7: Molecular evolutionary genetics analysis version 7.0 for bigger datasets. Mol. Biol. Evol. 2016, 33, 1870–1874. [Google Scholar] [CrossRef] [Green Version]
  52. Ayaz, A.; Saqib, S.; Huang, H.; Zaman, W.; Lü, S.; Zhao, H. Genome-wide comparative analysis of long-chain acyl-CoA synthetases (LACSs) gene family: A focus on identification, evolution and expression profiling related to lipid synthesis. Plant Physiol. Biochem. 2021, 161, 1–11. [Google Scholar] [CrossRef] [PubMed]
  53. Brown, P.; Baxter, L.; Hickman, R.; Beynon, J.; Moore, J.D.; Ott, S. MEME-LaB: Motif Analysis in Clusters. Bioinformatics 2013, 29, 1696–1697. [Google Scholar] [CrossRef] [PubMed] [Green Version]
  54. Lescot, M.; Déhais, P.; Thijs, G.; Marchal, K.; Moreau, Y.; Van De Peer, Y.; Rouzé, P.; Rombauts, S. PlantCARE, a Database of Plant Cis-Acting Regulatory Elements and a Portal to Tools for in Silico Analysis of Promoter Sequences. Nucleic Acids Res. 2002, 30, 325–327. [Google Scholar] [CrossRef] [PubMed]
  55. Szklarczyk, D.; Franceschini, A.; Wyder, S.; Forslund, K.; Heller, D.; Huerta-Cepas, J.; Simonovic, M.; Roth, A.; Santos, A.; Tsafou, K.P.; et al. STRING V10: Protein-Protein Interaction Networks, Integrated over the Tree of Life. Nucleic Acids Res. 2015, 43, D447–D452. [Google Scholar] [CrossRef]
  56. Geourjon, C.; Deléage, G. Sopma: Significant Improvements in Protein Secondary Structure Prediction by Consensus Prediction from Multiple Alignments. Bioinformatics 1995, 11, 681–684. [Google Scholar] [CrossRef]
  57. Schwede, T.; Kopp, J.; Guex, N.; Peitsch, M.C. Peitsch SWISS-MODEL: An Automated Protein Homology-Modeling Server. Nucleic Acids Res. 2003, 31, 3381–3385. [Google Scholar] [CrossRef] [Green Version]
  58. Hooft, R.W.W.; Sander, C.; Vriend, G. Objectively Judging the Quality of a Protein Structure from a Ramachandran Plot. Bioinformatics 1997, 13, 425–430. [Google Scholar] [CrossRef] [Green Version]
  59. Livak, K.J.; Schmittgen, T.D. Analysis of Relative Gene Expression Data Using Real-Time Quantitative PCR and the 2(-Delta Delta C(T)) Method. Methods 2001, 25, 402–408. [Google Scholar] [CrossRef]
Figure 1. Chromosome distribution of MaSRS genes. Note: chromosome number is indicated at the top of each bar. Chromosomal distances are indicated in Mb.
Plants 11 03101 g001
Figure 2. Gene density and synteny analysis of MaSRS genes in M. albus. Note: the eight chromosomes are shown as green partial circles at the outermost of the large circle, and the gene IDs are shown at the top of each bar. The middle and inner bars are the gene densities as a heatmap and a linear plot, respectively. The background gray lines represent all syntenic blocks of the M. albus genome, and the black lines represent duplicated MaSRS genes. The data bars color transition from blue to red which indicates that the gene distribution is denser.
Plants 11 03101 g002
Figure 3. Phylogenetic tree comprising SRS genes from quinoa (Chenopodium quinoa), Arabidopsis (Arabidopsis thaliana), maize (Zea mays), white sweet clover (Melilotus albus), spinach (Spinacia oleracea), and alfalfa (Medicago sativa). Note: the phylogenetic tree was constructed using MEGA 7.0 with the maximum-likelihood method with 1000 bootstrap replicates. The tree was classified into seven subgroups, designated group1 to group7. The CqSRS, AtSRS, ZmSRS, MaSRS, SoSRS, and MsSRS proteins were labeled by purple rhombus, red, white rhombus, pink squares, red circles, red-white circles, and yellow triangles, respectively.
Plants 11 03101 g003
Figure 4. Gene structure and conserved protein domains of SRS genes in white sweet clover (Melilotus albus) showing exons, introns, and motif sequence organization. (A) The unrooted phylogenetic tree of the MaSRS family was constructed with 1000 bootstrap replicates, and all MaSRS members were classified into six subfamilies. (B) Distribution of conserved MaSRS domains. (C) Intron exon structure of MaSRS genes. (D) Ten conserved motifs in MaSRS proteins.
Plants 11 03101 g004
Figure 5. Heat map expression in the promoter region of each MaSRS gene and analysis of the number of cis-acting elements containing the stress response.
Plants 11 03101 g005
Figure 6. 3D structure prediction of SRS protein in white sweet clover (Melilotus albus).
Plants 11 03101 g006
Figure 7. Expression levels of nine SRS genes in leaves of white sweet clover (Melilotus albus) under salinity, low temperature, salicylic acid (SA) and methyl jasmonate (MeJA) treatments. Note: data represents the means of three independent replicates ± standard deviation (SD). Small letters above the column indicate significant differences in each processing period (a = 0.05, LSD). LSD, least significant difference.
Plants 11 03101 g007aPlants 11 03101 g007b
Table 1. Details of the SRS gene family members identified in M. albus.
Gene IDGene NameProtein
Length (aa)
Molecular Weight (kDa)Isoelectric
Point (PI)
GRAVYInstability IndexSubcellular Localization
Malbus0105973.1MaSRS0133936.697907.63−0.84560.61Nucleus
Malbus0200518.1MaSRS0227329.961458.53−0.56259.56Nucleus
Malbus0205193.1MaSRS0333236.182197.24−0.69648.69Nucleus
Malbus0501767.1MaSRS0432435.595677.55−0.65356.92Nucleus
Malbus0503375.1MaSRS0533936.947446.70−0.75061.44Nucleus
Malbus0503792.1MaSRS0636840.826625.91−0.80448.56Nucleus.
Malbus0601083.1MaSRS0732334.954335.79−0.57655.77Nucleus
Malbus0702600.1MaSRS0819722.522118.70−0.95159.98Nucleus
Malbus0800677.1MaSRS0935337.352178.79−0.60447.07Nucleus
Table 2. Duplicated MaSRS genes in M. albus.
Gene_1Gene_2KaKsKa_KsDuplication TypeT (Mya.)
MaSRS01MaSRS020.282476170.9235729670.305851492Segmental102.6192185
MaSRS01MaSRS050.4128375641.2990599790.317797153Segmental144.3399977
MaSRS02MaSRS050.3723746391.2802592940.290858767Segmental142.2510326
MaSRS02MaSRS080.4995057121.9170125540.260564654Segmental213.0013949
MaSRS03MaSRS040.2240391690.7187418070.311710223Segmental79.8602008
MaSRS05MaSRS070.2774131961.0613276350.261383183Segmental117.9252928
MaSRS05MaSRS080.5802042022.0425281260.284061793Segmental226.9475696
MaSRS07MaSRS080.4492557473.2457138350.138415082Segmental360.6348705
Note: T = Ks/2λ; where λ = 4.5 × 10⁻⁹.
Publisher’s Note: MDPI stays neutral with regard to jurisdictional claims in published maps and institutional affiliations.

