Article

Leaf Eco-Physiological Profile and Berries Technological Traits on Potted Vitis vinifera L. cv Pinot Noir Subordinated to Zeolite Treatments under Drought Stress

by
Eleonora Cataldo
*,
Maddalena Fucile
and
Giovan Battista Mattii
Department of Agriculture, Food, Environment and Forestry (DAGRI), University of Florence, 50019 Sesto Fiorentino, FI, Italy
*
Author to whom correspondence should be addressed.
Plants 2022, 11(13), 1735; https://doi.org/10.3390/plants11131735
Submission received: 10 June 2022 / Revised: 28 June 2022 / Accepted: 28 June 2022 / Published: 29 June 2022
(This article belongs to the Section Horticultural Science and Ornamental Plants)

Abstract

:
In Mediterranean areas, extreme weather conditions such as high diurnal temperatures during the growing season could tweak vine physiology and metabolism, affecting grapes’ quality. Moreover, uncertainty in spatial and temporal distribution precipitation is an issue for the water resources of the vineyards, forcing the winemakers to continuously face an increasing water demand in recent decades, which has led them to non-sustainable choices for ambient (i.e., irrigation solutions). The aspiration of this experiment was to explore the effects of zeolite treatments (clinoptilolite type) on Vitis vinifera L. (potted vines) ecophysiology and berry metabolism under two water regimes. The plants were subordinated to two different predawn water potential regimes (0 ≤ ΨPD ≤ −0.4, WWCtrl and −0.4 ≤ ΨPD ≤ −0.9, WSCtrl), both associated with zeolite treatments (WWt and WSt). Gas exchanges, predawn and midday stem water potential, chlorophyll fluorescence, temperature, and relative water content were overseen on leaves at veraison, maturation, and harvest. Technological analyses were performed on the berries. Moreover, data were analyzed with principal component analysis and Pearson’s correlations. This experiment supplies new evidence that zeolite applications could impact both physiological profiles (higher photosynthesis and stomatal conductance) as well as berry skin metabolism (sugar and size) of vines, giving a better skill to counteract low water availability during the season and maintaining a better hydraulic conductivity.

1. Introduction

The concentration of greenhouse gases (GHGs) in the atmosphere (such as carbon dioxide (CO2), nitrous oxide (N2O), and methane (CH4)) has rapidly increased in the last century mainly due to the continuous and copious reversal in the atmosphere of combustion products provided by energy systems that employ, especially, fossil fuels (methane, coal, and oil) [1]. Agricultural ecosystems are important sinks and sources of GHGs by producing and consuming them in biological processes (such as nitrification, denitrification, net photosynthesis, respiration, decomposition, methanogenesis, and CH4 oxidation) [2]. A direct consequence of this phenomenon is the growth of the planet’s average temperature [3].
The Intergovernmental Panel on Climate Change (IPCC) is currently in its Sixth Assessment Report (AR6). The results of the research group show that in the coming decades an increase in climate change is expected in all regions of the world in multiple ways [4]. The report’s analysis unveils that at 1.5 °C of global warming, it is forecasting a swell in the number of heatwaves, extended hot seasons, and fleeting chilly seasons. While at 2.0 °C global warming, the warm–extreme temperatures would climb to critical tolerance thresholds for agriculture more often [5]. However, the temperatures are not the only component at play. Climate change is driving many other alterations in different regions, and all will intensify with further warming. These embody modifications in annual rainfall rates, winds, snow, coastal districts, and oceans level [6].
History showed that wine grape growing regions thrived when the climate was most conductive in anthropic activity and that the unpredictable shifts occurred owing to climate vicissitudes, making production and quality more taxing [7,8,9,10]. In viticulture, climate represents a terroir component having a deep effect on the capacity of a region or territory to trigger excellent berries and consequently wine [11,12]. Sundry studies identify changes in grapevine growth characteristics and grapes quality as an effect of climate warming and of the frequency/intensity increase in extreme meteorological events (droughts, hail, high temperatures, tropical nights, and flooding) [13,14,15,16,17,18].
Indeed, higher diurnal temperatures sway the plant’s ecophysiology and phenology by shifting the phenological stages to earlier times, including the ripening phase shifting to warmer periods that affect the grape composition, by enhancing sugar content, diminishing total acidity, and unbalancing the aroma compounds [19,20,21].
Moreover, uncertainty in spatial and temporal precipitation distribution is a notable issue for the water resources of the vineyards, forcing the winemakers to continuously face an increasing water demand in recent decades, which has led to an increase in the gap between supply and demand for water. Strengthening this split inevitably led to a serious consideration of the basics of water resource planning by adopting appropriate management strategies such as emergency irrigation [22,23].
It was shown that the water deficit induced lipid peroxidation, chlorophyll bleaching, and molecular antioxidants loss (i.e., ascorbate, glutathione, α-tocopherol, and carotenoids) by decreasing the activities of active oxygen-processing enzymes, such as ascorbate peroxidase (APOX), superoxide dismutase (SOD), catalase (CAT), and nonspecific peroxidase (POX) [24,25,26,27,28]. In addition to the stomatal limitation of photosynthesis under water stress, non-stomatal effects occur under severe stress [29,30,31]; extreme environmental conditions, above 43 °C temperatures, can damage the photosynthetic machinery (photosystem II (PSII)) reversibly or irreversibly [32,33]. The plant’s responses under water deficit stress and high temperatures occur from the leaf level to the whole-vine level, including carbon assimilation and the allocation of photoassimilates (e.g., leaf proline accumulation, for reducing cell acidity and the release of ammonia toxicity, the presence of several reactive oxygen species as mediators of signal transduction, a high hydrogen peroxide content, and 3-hexenal and (E)-2-hexenal) [34,35].
Although putting concrete numbers on this affirmation is extremely difficult, many studies argue that irrigation is not a sustainable and resilient solution, with a view to expanding the areas planted with vineyards [36,37].
The resilience-broad concept, defined among authors in several different ways, forks out a sovereign framework for examining critical ecosystem transitions in response to environmental change [38,39]. Here, we focus on ecological resilience, pioneered by Holling (1973) [40] and defined as the skill of “a system to experience shocks while retaining essentially the same structure, function, feedbacks, and therefore identity” [41]. In this definition, resilience is calculated as the perturbation amount (such as climate variables metamorphosis) that a system can absorb before reaching a tipping pinnacle or margin beyond which it transitions into an alternative condition causing an undesirable locked state (e.g., hysteretic system) [42,43].
The logical solution is a detailed mechanistic and physiologic understanding of the problem in order to better design and target vineyard management approaches [44] for the development of new solutions against drought with the aim of corroborating the vineyard ecosystem and increasing its resilience over time.
This increasing demand for vineyard protection against environmental adversity requires an increase in the production of materials to be used in natural-based viticulture such as zeolites [45]. As non-toxic, ecologically worthwhile, and bearable materials, the natural zeolites, owing to their characteristics (structural, sorption, and ion exchange properties) are well suited for agricultural employees, both animal and plant production [46].
Zeolites (from the Greek words, ζέω, “boil” and λίθος, “stone” [47]) are alumino-silicate minerals that have a molecular sieve action owing to their framework (open channel network) [48]; these minerals are constituted by TO4 tetrahedra linked with oxygen atoms sharing the negative charge created by the presence of AlO2- and SiO2- balanced by cations (i.e., Na+, K+, Rb+, Cs+, Mg2+, and Ca2+) that neutralize the charge deficiency [49]. Due to their high adsorption capacities in the dehydrated state and the high ion-exchange capacity, zeolites can help in the absorption and retention of plant nutrients, herbicides, supplemented micronutrients, fungicides, fertilizer, pesticides, and water [50,51]. Owing to porous and capillary suction properties, zeolite forwards soil water retention and infiltration and operates as a natural wetting element [52,53].
For these reasons, the proposals of this project were to test if zeolite treatments were able to positively sway grapevine ecophysiology by promoting a higher tolerance to drought in controlled conditions, and to investigate the effect on technological berry parameters, analyzing grape development.
In order to achieve these goals, the comparison between grapevines treated with zeolite (clinoptilolite type) and non-treated ones was set up on Pinot noir cv. potted grapevines (Vitis vinifera L.), both subordinated to two different irrigation regimes.

2. Results

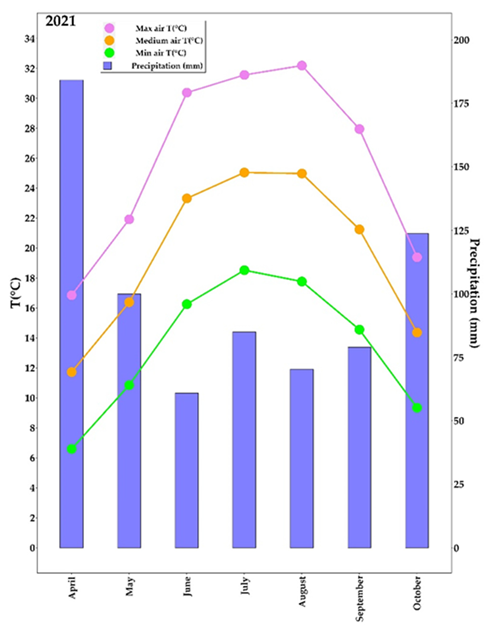
2.1. Meteorological Parameters

The total average means, maximum, and minimum air temperatures, recorded from bud break to leaf fall (April–October), were 19.58 °C, 25.75 °C, and 13.41 °C, respectively (Figure 1).
The two hottest months of this period were July and August (maximum temperatures were always above 35 °C in the last seven days of July and in the middle eleven days of August). The hottest days were the 7th of July (Tmax = 35.6 °C), the 9th of August (Tmax = 35.8 °C), the 10th of August (Tmax = 36.0 °C), the 11th of August (Tmax = 36.8 °C), and the 12th of August (Tmax = 39.3 °C) when maximum and minimum air temperatures were higher than the corresponding monthly averages.

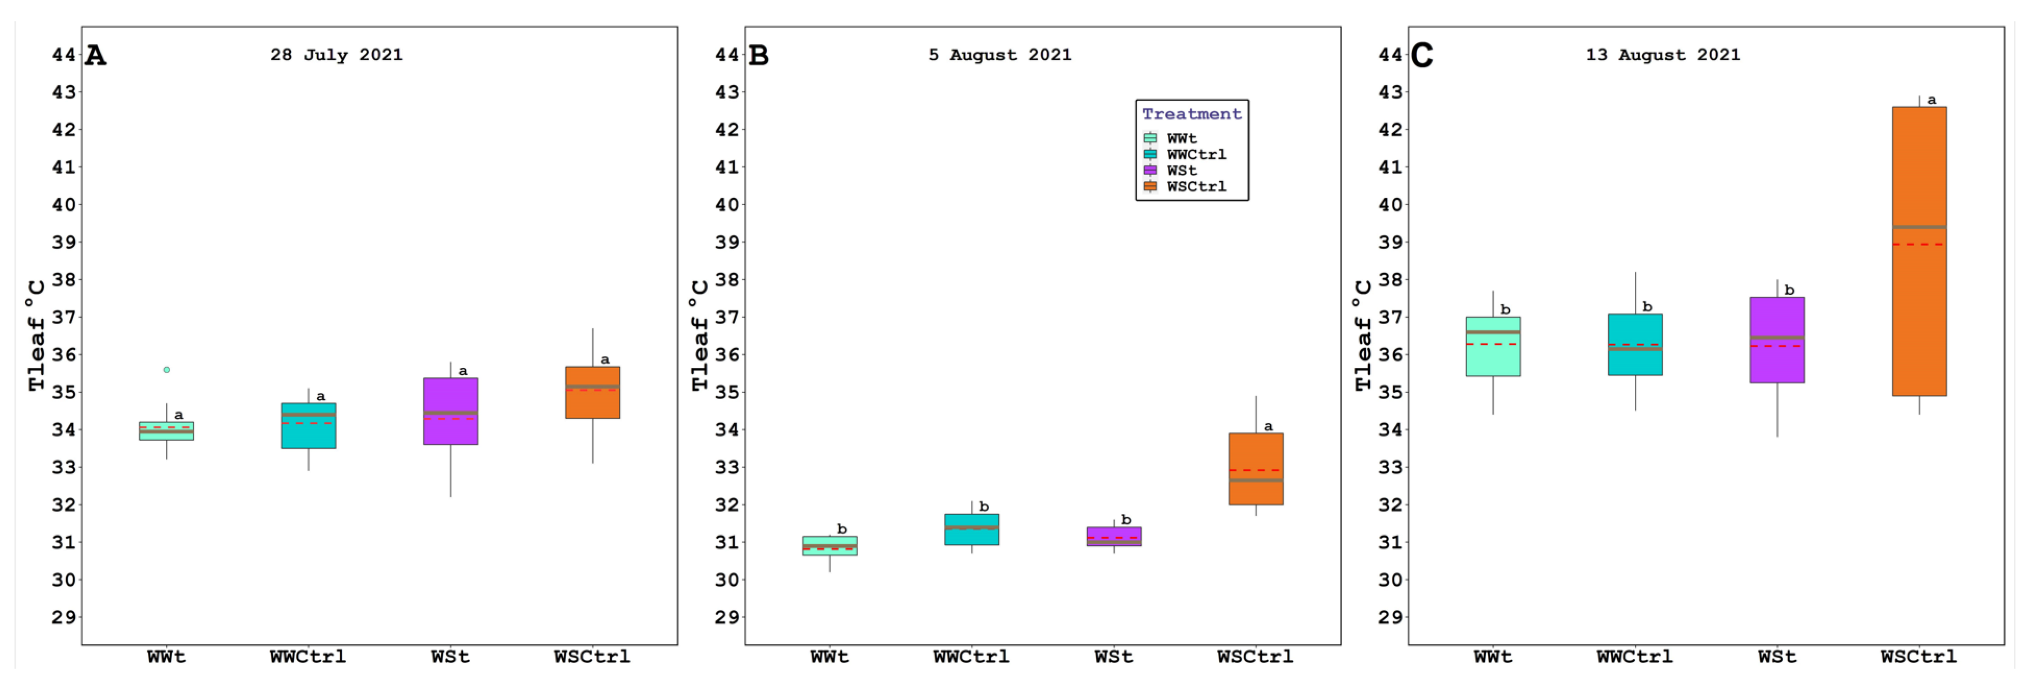
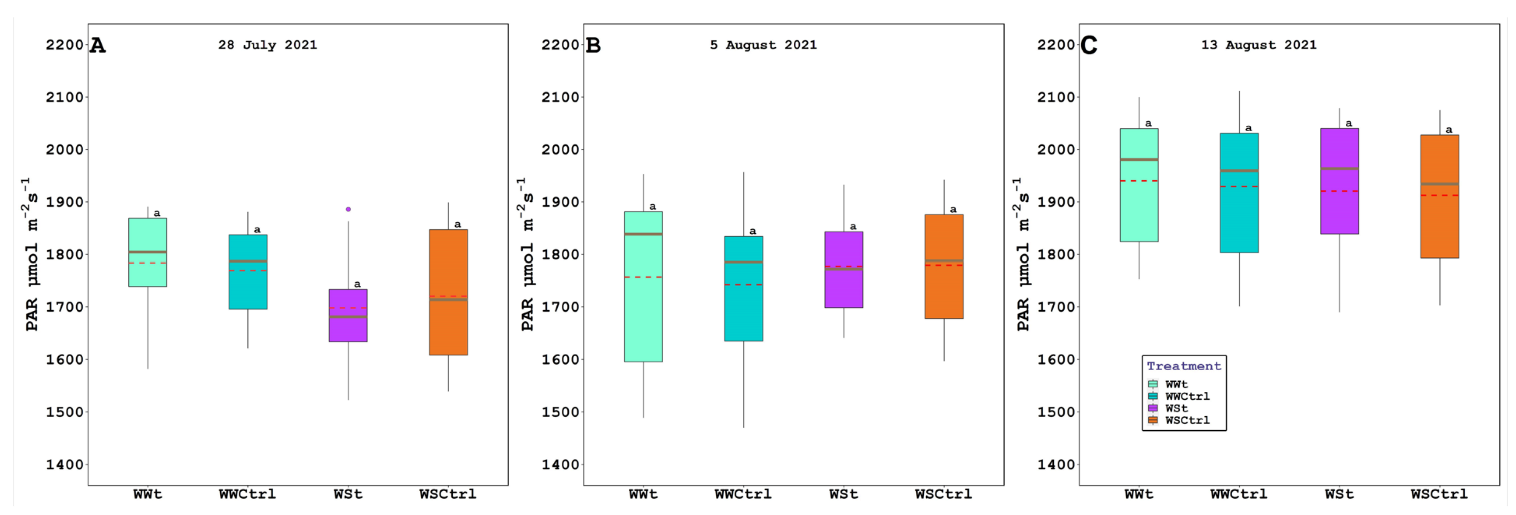
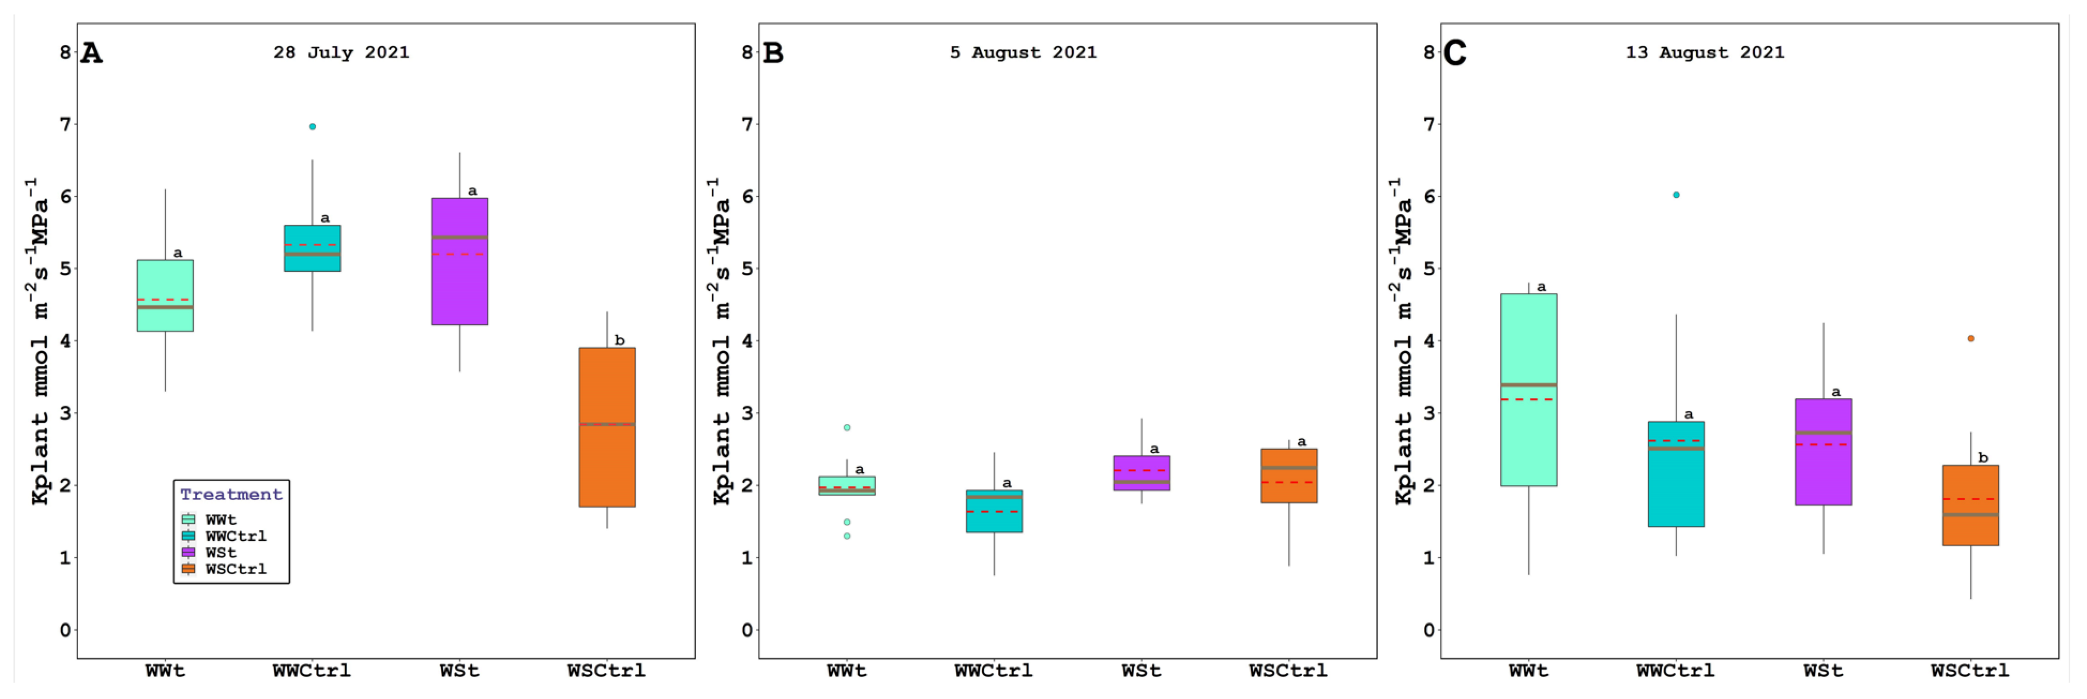
2.2. Leaf Gas Exchange, Chlorophyll Fluorescence, Water Potential (Leaf, Stem, and Pre-Dawn), Relative Water Content, Plant Hydraulic Conductance, Intercepted Photosynthetically Active Radiation, and Leaf Temperature

At the level of photosynthetically active radiation (PAR) during all measurements, no significant difference was found (Figure 2).
Leaf gas exchange, chlorophyll fluorescence, water potential (leaf, stem, and pre-dawn), relative water content, and plant hydraulic conductance are presented below (Figure 3, Figure 4 and Figure 5; Table 1 and Table 2).
Lower Pn and gs values were observed in WSCtrl compared to the other treatments. In general, no difference was found between WWt, WWCtrl, and WSt for these parameters.
On August 5 and August 13, WSCtrl plants exhibited significantly higher leaf temperature values than irrigated and/or treated plants, while WUE was largely unaffected by zeolite treatments. At the same sampling time, the water-stressed vines maintained lower E levels than the other treatments.
ΨPD and Ψstem were largely influenced by zeolite treatments and irrigation. Under water stress conditions, WSt vines showed higher ΨPD and Ψstem values than WSCtrl. Furthermore, the RWC was significantly higher in WWt, WWCtrl, and WSt than in the WSCtrl plants.
Fv/Fm showed significant changes due to treatment only on 5 August 2021 (the WSCtrl treatment showed significantly lower values than the other treatments).

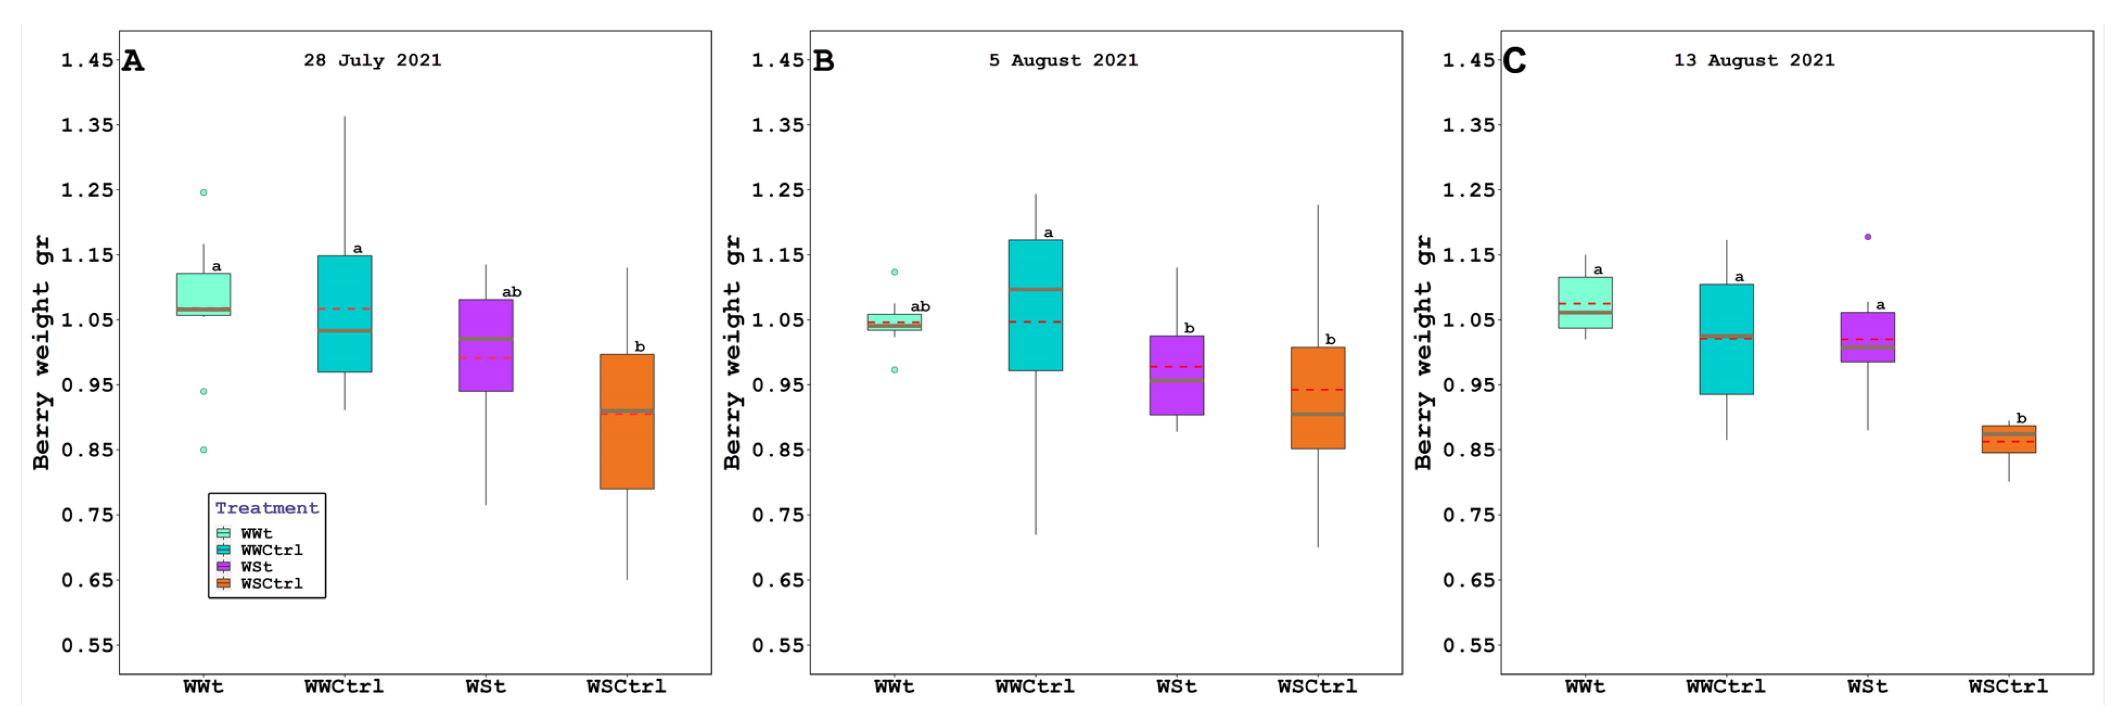
2.3. Grape Composition

The irrigation regime and zeolite treatment induced significant differences (p ≤ 0.05) in berry weight, sugar content, and titratable acidity (Figure 6 and Table 3).
At harvest, the berry weight was −19.62%, −15.68%, and −15.68% lower in WSCtrl than in WWt, WWCtrl, and WSt vines, respectively.
At harvest, the sugar content was +4.09%, +10.26%, and +0.55% higher in WSCtrl than in WWt, WWCtrl, and WSt vines, respectively.
Zeolite treatments did not induce significant effects on the pH parameter in both water regimes.

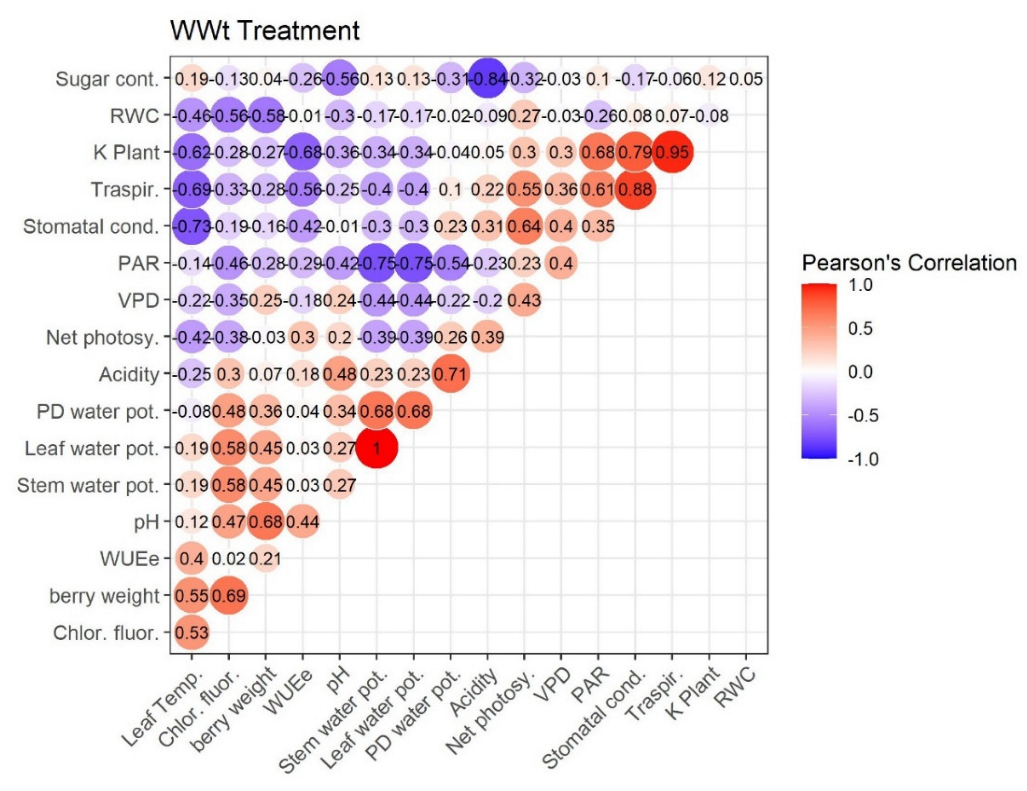
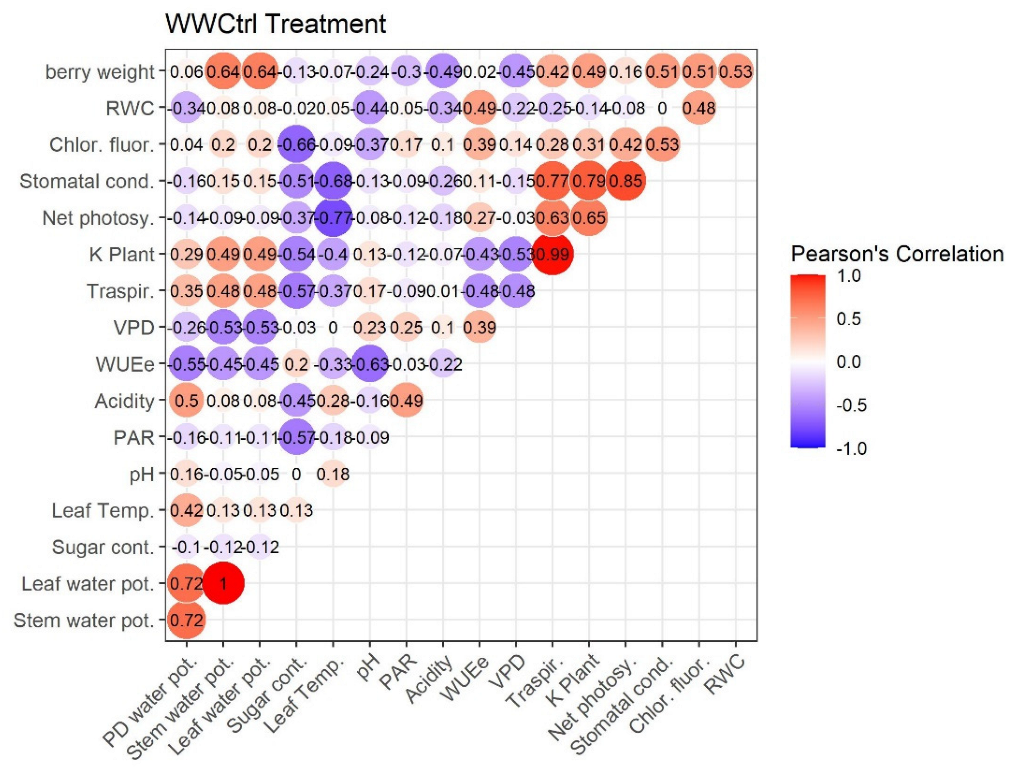
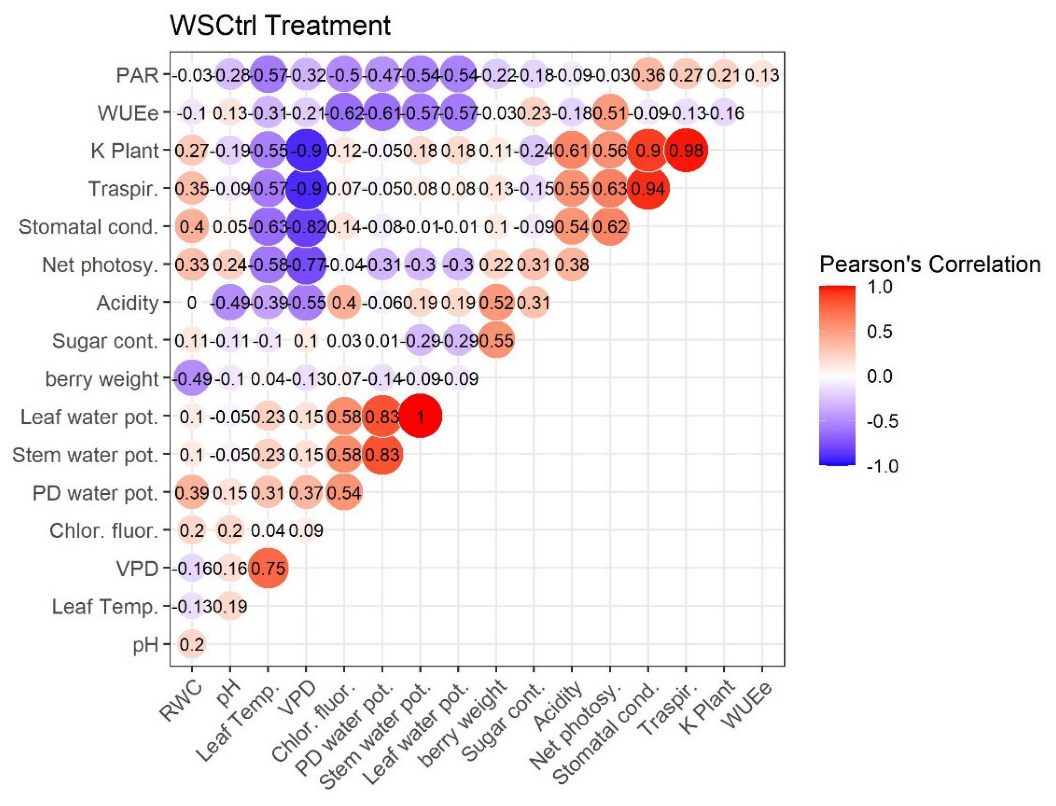
2.4. Pearson’s Correlation

Figure 7, Figure 8, Figure 9 and Figure 10 represent Pearson’s correlations for each treatment (WWt, WWCtrl, WSt, and WSCtrl).
In general, in all treatments, significant positive correlations were identified between the following character pairs: Kplant–Traspir, PD water pot–Stem water pot, PD water pot–Leaf water pot, and Traspir–gs. Moreover, a (very close) negative correlation was identified between Sugar–Acidity and Net photosy–Leaf temp.

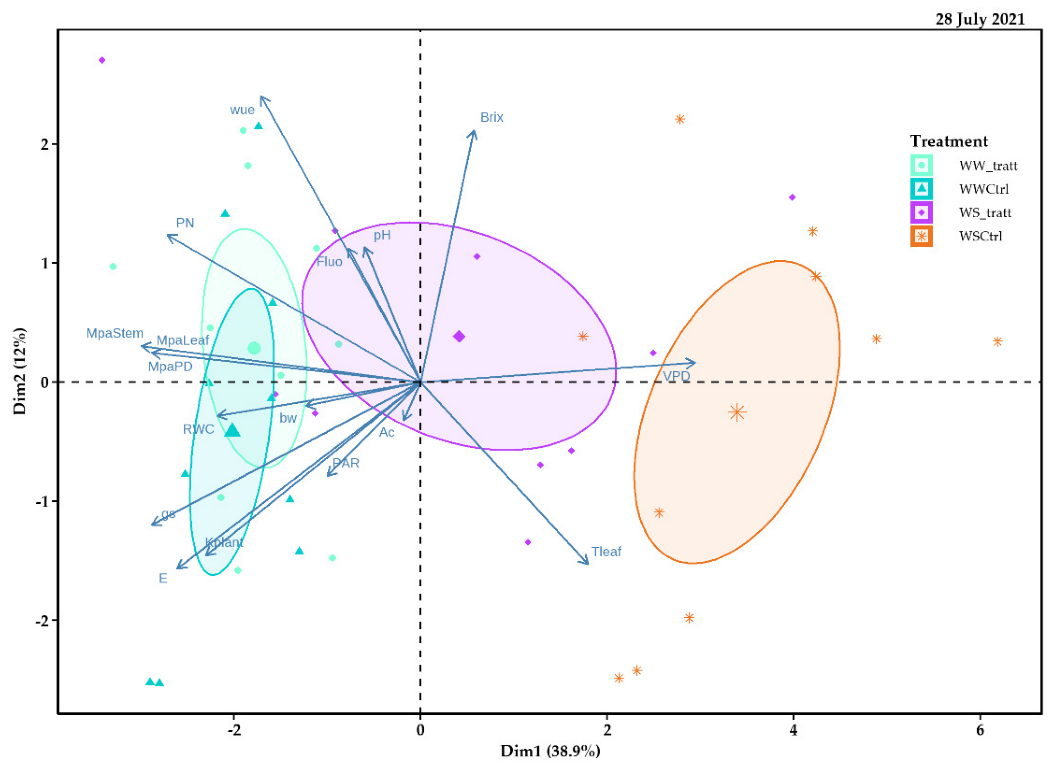
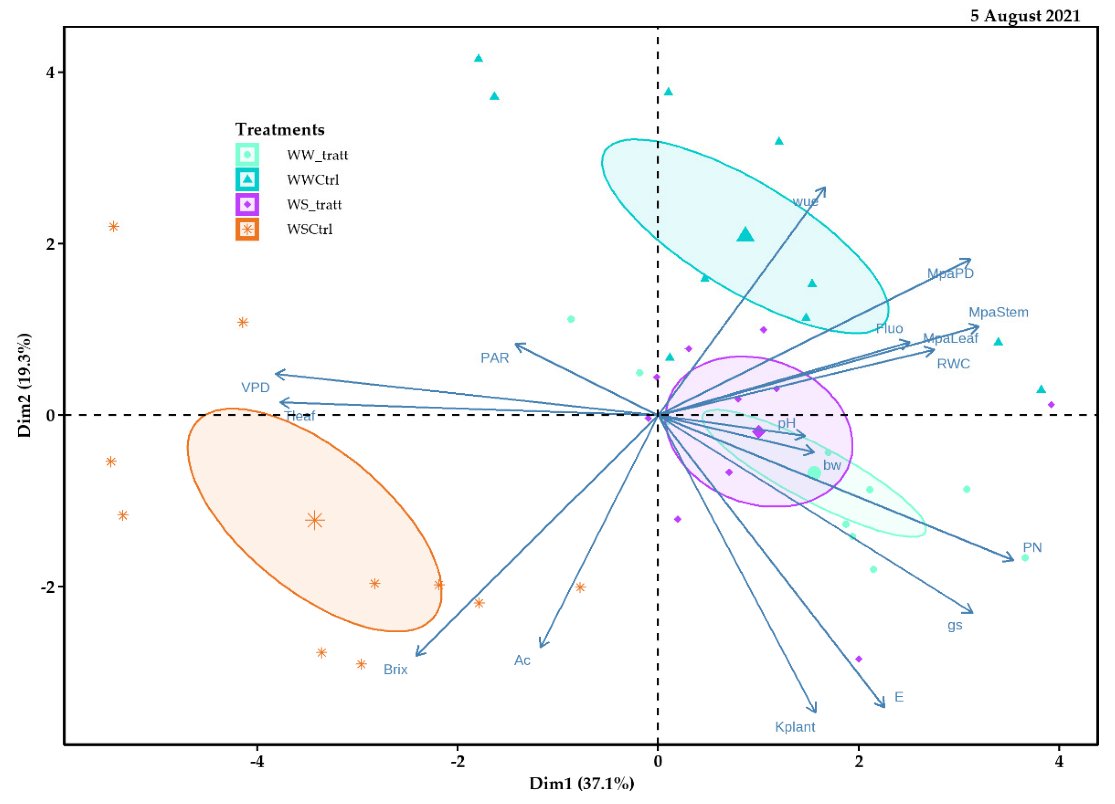
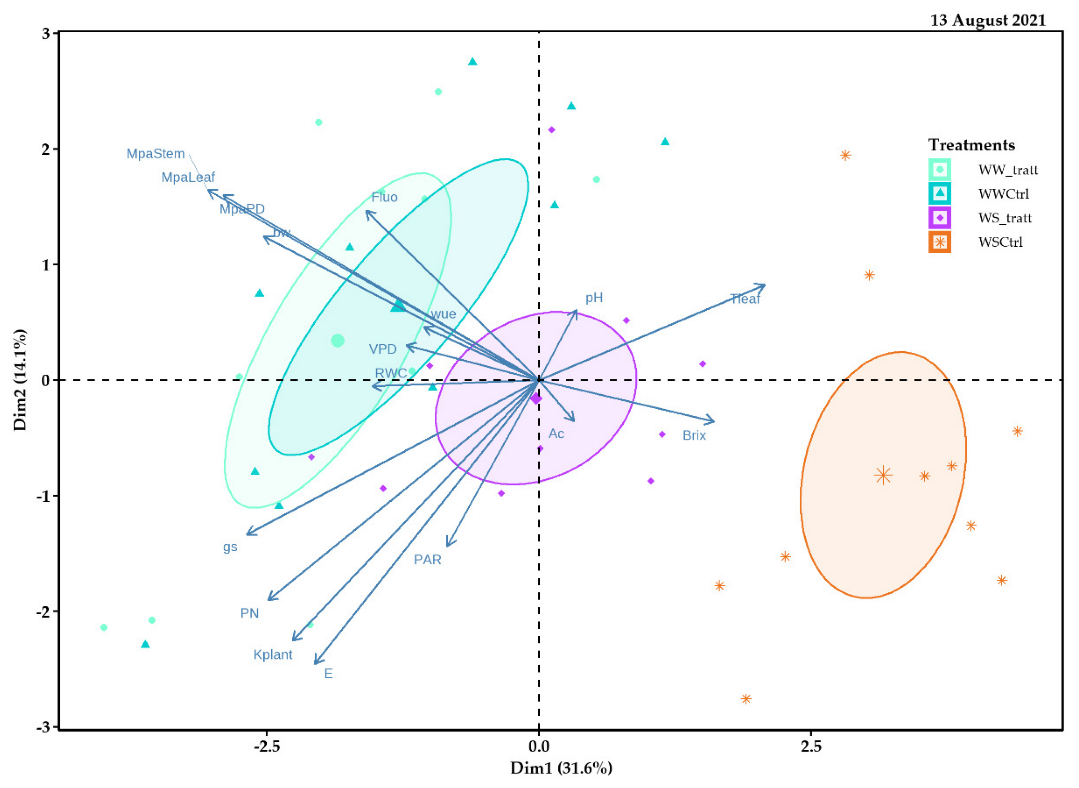
2.5. Principal Component Analysis (PCA)

Principal component (PC) 1 (Dim1) of the 28 July 2021 explained 38.9% of the data variability and allowed for visualizing different treatment behaviors (delimited by different colored ellipses) in comparison, carried out based on the response variables. The WSCtrl treatment was to the right of the spatial distribution and positively related to a production variable (i.e., sugar content (°Brix)), VPD, and Tleaf, and negatively related to ecophysiological variables such as PN, E, PAR, and stomatal conductance (gs). Instead, principal component 2 (Dim2) explained 12.0% of the data variability (Figure 11).
Principal component 1 (Dim1) of the 5 August 2021 explained 37.1% of the data variability and allowed for visualizing different treatment behaviors (delimited by different colored ellipses) in comparison, carried out based on the response variables. The WWt and WSt treatments were similarly distributed to the right of the spatial distribution. These treatments were negatively related to production variables such as sugar content (°Brix) and acidity (Ac), and positively related to water potential parameters such as MPaPD, MPaLeaf, and MPaStem. Instead, principal component 2 (Dim2) explained 19.3% of the data variability (Figure 12).
Principal component 1 (Dim1) of the 13 August 2021 explained 31.6% of the data variability and allowed for visualizing different treatment behaviors (delimited by different colored ellipses) in comparison, carried out based on the response variables. The WWt and WWCtrl treatments were similarly distributed to the left of the spatial distribution; they were negatively related to ecophysiological variables such as PN, gs, E, and KPlant, and positively related to technological parameters such as °Brix, pH, and Ac. While the WSCtrl treatment was positioned to the right of the spatial distribution. Instead, principal component 2 (Dim2) explained 14.1% of the data variability (Figure 13).

3. Discussion

Important alterations in ecophysiological reactions are regularly noted in grapevines under different statuses of water stress, such as with a severe limitation in vine water uptake, a drop-in the leaf stomatal conductance (e.g., on 13 August 2021 WSCtrl recorded 54.70 mmol m−2s−1), and in the photosynthetic rate (e.g., on 13 August 2021 WSCtrl recorded 6.43 µmol m−2s−1) [54,55,56], which often influence berry sugar accumulation and yield [57]. Given the absence of works with applications of zeolites to the soil in the vineyard, the possible changes in ecophysiological responses have not been found in grapevines under soil zeolite treatments yet.
In our study, as expected, net photosynthesis (PN), stomatal conductance (gs), predawn water potential (ΨPD), stem water potential (Ψstem), and relative water content (RWC) were significantly weakened by drought in WSCtrl grapevines with respect to WWCtrl, WWt, and WSt ones. Regarding the net photosynthesis on a single leaf, the zeolite treatment influenced all the sampling dates in the water potential (pre-dawn and stem) differences due to the treatment observed on 5 and 13 August, while in the RWC, the differences were found on 5 August. Probably, the stressed-treated vines (WSt) improved their performance due to zeolite properties by enhancing the nutrient use efficiency, heightening the phosphorus (P) availability from phosphate rocks, and the utilization of ammonium nitrogen (NH4+–N) and nitrate nitrogen (NO3N), reducing losses by the leaching of exchangeable cations, in particular K+, and functioning also as a slow-release fertilizer [49,58] (e.g., positive effects on lettuce [59] and tomato [60]). In our study, maybe by increasing the soil water holding capacity [61], zeolite application increased the water use efficiency (WUE) (i.e., on 28 July 2021 WWt = 3.21 µmol mmol−1, WSt = 3.00 µmol mmol−1, WWCtrl = 2.67 µmol mmol−1, and WSCtrl = 1.64 µmol mmol−1).
Owing to the zeolitic skill to retain water [62,63], vines treated with clinoptilolite (WWt and WSt) evidenced significantly inferior leaf temperatures (TLeaf) than WSCtrl plants. The following diminutions were registered during the season: −2.91% WWt and −2.21% WSt on July 28th; −6.81% WWt and −5.78% WSt on August 5th; and −7.33% WWt and −7.47% WSt on August 13th. Here we hypothesize that the application in the pot made the roots more insulated and humid in order to isolate the leaves from photo-oxidative damage [64] (see also the improved Fv/Fm ratio of irrigated and treated plants compared to stressed ones). It is hypothesized that the balancing of this parameter allowed the reduction of stress, in turn improving the stomatal conductance parameter (as emerges from gs/Tleaf Pearson’s Correlation: 0.73 WWt, 0.68 WWCtrl, 0.77 WSt, and 0.63 WSt). In addition, it is well known that transpiration serves as a heat dissipation mechanism in plants. Therefore, the significant increase in Tleaf in the WSCtrl treatment compared with the other treatments may be related to the significant reduction in leaf transpiration observed in the WSCtrl treatment (as emerges from gs/E Pearson’s Correlation: 0.88 WWt, 0.77 WWCtrl, 0.38 WSt, and 0.94 WSt).
In our study, the water (WWCtrl), the synergy of water/zeolite (WWt), and only zeolite application (WSt) positively influenced water stress. In fact, by improving the physical and chemical properties of the soil, (infiltration rate, saturated hydraulic conductivity, and water holding capacity [65]), many studies on other species showed that water deficit stress can be mitigated by soil applications of zeolite such as in Phaseolus vulgaris L. [66], Salvia officinalis L. [67], Dracocephalum moldavica L. [68], Brassica napus L. [69], and Helianthus annuus L. [70]. The effectiveness of zeolite treatment on vine ecophysiology could be also discerned at the first stage (28 July 2021) under water stress conditions, since treated vines maintained higher water potentials (ΨPD, Ψstem) than in WSCtrl vines and at the third stage (13 August 2021) where the high air temperature (38.5 °C) induced a strong decrease in RWC; however, this dwindle was more evident in nontreated grapevines (confirming the hypothesis of a positive effect of zeolite in preventing excessive leaf dehydration [71]). However, the effect of zeolite under water deficit conditions maintaining higher water potentials than in the WSCtrl treatment was more evident in the second and third stages (5 and 13 August).
The treatment’s effect on potted grapevine water status continued and was amplificated with water stress evolution. Indeed, on 13 August 2021, WSt vines revealed a better Kplant than WSCtrl plants. The allowance of a satisfactory Kplant could have countenanced WSt leaf to avoid stomatal closure and an excessive constraint in carbon gain [72]. Moreover, since the Kplant fall-off is correlated not only to transpiration (i.e., Kplant/E Pearson’s Correlation: 0.95 WWt, 0.99 WWCtrl, 0.94 WSt, 0.98 WSt) but also to a hydraulic dysfunction, our conclusions lead us to believe that WSt leaves are less susceptible to conduit embolism and hence collapse [73] (important in anisohydric Pinot noir cv., more unguarded to hydraulic breakdown [74]).
Stressed and untreated vines (WSCtrl) showed significantly more negative water potentials (Ψ) than WWt and WSt plants. In predawn water potential during the season, the following decreases were recorded for WS treatment, respectively: −70.32% and −14.28% on July 28th; −45.74% and −31.91% on August 5th; and −63.63% and −30.30% on August 13th.
Finally, treatments significantly affected sugar accumulation and berry weight.
This result is not in agreement with the results observed by Salvi et al. (2020) [75] on Pinot noir cv. in pot conditions, where the authors did not find differences in sugar maybe for restricted carbohydrates reserves stored in grapevine roots. In particular, it can be seen that in the last survey at harvest (13 August 2021) the WSt treatment retains the same sugar level as WSCtrl but has a significantly higher weight of the berry (WSCtrl = 0.86 gr vs. WSt = 1.03 gr). As regards the concentration of sugar at harvest, there is a greater Brix degree in the WWt treatment (19.30 °Brix) compared to the corresponding WWCtrl (18.22 °Brix) not due to the concentration effect (same weight of the berry). Whereas, pH parameter was not affected by treatments. It is assumed that the increase in the berry weight in plants treated with zeolites is attributable to the zeolitic properties of corroborating the water performance of the plant (more hydrated berries) [62]. As regards the tendency of the increase in sugar in WWt plants compared to WWCtrl, an interaction of the zeolite in the metabolic pathways of sugar accumulation is supposed. It is therefore believed that further investigations should be made above all an investigation activity of sugars accumulated in the vacuoles, studying the activity of sucrose-metabolizing enzymes, sucrose transporters, and monosaccharide transporters.
However, there are a few precautions (experiment done in pots) to be taken for extrapolating the results to vines under field conditions such as for example, an in-depth study of the orography of the territory, multi-year pluviometric analysis, and complete soil analyses, in order to better evaluate the feasibility of applying the mineral.

4. Materials and Methods

4.1. Location, Meteorological Parameters, and Experiment Design

This experiment was carried out during the 2021 growing season on Pinot noir (Entav 115 clone) 12-year-old homogeneous potted grapevines (shoot length average after topping 95.0 cm, leaves per vine average number 105.0; ten buds per vine; average canopy leaf area/vine 1.17 m2) (Vitis vinifera L.). Vines were grafted onto 1103 Paulsen V. berlandieri × V. rupestris rootstock, trained on a vertical shoot positioned trellis, with spur cordon pruning, and grown outdoor in Arezzo, Italy (Lat. 43°27′47″ N 11°52′41″ E; 296 m a.s.l.).
Daily values of mean/minimum/maximum air temperatures (°C) and mean/minimum/maximum humidity (%) values were recorded from April to October using a nearby meteorological station (Bresser WeatherCenter 7002500, Rhede, Germany).
Pots had a holding capacity of 80 L; they were filled with clay-loam soil (clay 39%; silt 34%; and sand 27%), with a volumetric soil water content (SWC) of ∼35.0% at field capacity. During February/March, every year, each pot was fertilized with 50 g of Nitrophoska controlled-release fertilizer (15N–9P–15K) (Eurochem Agro, MB, Italy). To escape an overmuch soil over warming that can negatively impact roots, and preserve a reliable temperature, all pots were sheltered by a white painting.
From the beginning of July until harvest, 20 plants were maintained at 90% of maximum water availability (WWCtrl, well-watered grapevines), 10 of which were treated with zeolite (0 ≤ ΨPD ≤ −0.4), while the other 20 vines were subjected to a water deficit at 40% of maximum water availability (WSCtrl, water-stressed), 10 of which were treated with zeolite (−0.4 ≤ ΨPD ≤ −0.9) [75,76]. During water restriction, the plant container’s surface was curtained with aluminum foils to impede rainfall intervention and to downsize evaporation. The contributed water per pot was calculated by monitoring every day the soil moisture (volumetric content) by time-domain reflectometry (Soil Moisture Equipment Corporation, CA, USA) with 30 cm long electrodes located in the pots. Water was supplied at 2-day intervals with drip irrigation emitters.
The zeolite application (clinoptilolite 80%, granulometry 0.2–2.5 mm; Zeocel, DND Biotech srl, PI, Italy) took place on February 8, 2021, at a dose of 1.0 kg per pot [77,78].
At three different stages, on 10 vines per treatment, eco-physiological measurements and berries samplings were conducted: Time1 (full-veraison, Eichorn and Lorenz (E-L) stage 35; 28 July 2021), Time2 (maturation; E-L stage 37; 5 August 2021), and Time3 (harvest; E-L stage 38; 13 August 2021) [79].

4.2. Leaf Gas Exchange, Chlorophyll Fluorescence, Water Potential (Leaf, Stem, and Pre-Dawn), Relative Water Content, Plant Hydraulic Conductance, Intercepted Photosynthetically Active Radiation, and Leaf Temperature

At Time1 (full-veraison; 28 July 2021), Time2 (maturation; 5 August 2021), and Time3 (harvest; 13 August 2021), net photosynthesis (Pn), leaf temperature (LTemp), transpiration rate (E), stomatal conductance (gs), vapor pressure deficit (VPD), and photosynthetically active radiation (PAR) were measured on 10 fully developed and healthy leaves per treatment (one each grapevine/10 replicates) adopting Ciras 3 (ambient light and 400ppm CO2 [80]), a portable infrared gas analyzer (PP Systems, MA, USA). Extrinsic water use efficiency (WUEe) was calculated as follows: Pn and E ratio [81].
On the same leaves chosen for gas exchanges at Time1, Time2, and Time3, Chlorophyll Fluorescence (Fv/Fm; [82]) as the maximum quantum yield of photosystem II (PSII) photochemistry was registered with Handy-PEA®, a portable fluorometer (Hansatech Instruments, UK).
Moreover, at the same three different stages (full-veraison, maturation, and harvest), leaf predawn (ΨPD; between 03.30–04.30 a.m. on 10 fully expanded leaves per treatment) and stem midday (Ψstem; at noon o’clock on the same leaves used for leaf gas exchange measurements; leaves over 60-min dark-adapted) water potentials were estimated [83] with a model 600 pressure chamber (PMS Instrument Co., Albany, OR, USA). While in accordance to Williams and Araujo (2002) [84], leaf midday (Ψleaf) water potential was calculated as follows (r2 = 0.92):
Ψleaf = −0.37 + 0.91 × Ψstem
Likewise, the whole-plant hydraulic conductance (Kplant) was obtained by the equation:
Kplant = E/(ΨPD − Ψleaf)
As the association between the plant water depletion by transpiration (E) and the water potential dwindle from roots to leaves [85,86,87].
Finally, according to Bertamini et al., (2006) [88], 10 different leaves per treatment were used to reckon their relative water content (RWC), as follows:
RWC = ((FM − DM)/(TM − DM)) × 100
where FM denotes fresh mass (leaf immediately weighed), TM denotes turgid mass (leaf reweighed placed overnight in the dark in a 25cm3 beaker filled with water), and DM denotes dry masses (leaf reweighed after 24 h drying at 80 °C in drying oven). The instruments used for such measurements were a dryer (Argolab TCN 30 model, MI, Italy) and a precision digital scale (FR-320 model, Gram Group Weighing Systems, Barcelona, Spain).

4.3. Technological Parameters of Berries

At Time1 (full-veraison; 28 July 2021), Time2 (maturation; 5 August 2021), and Time3 (harvest; 13 August 2021), 40 berries/vine sample (for repetition) was gathered from the clusters of 10 vines (10 repetitions/treatment), weighed (FR-320 model digital scale, Gram Group Weighing Systems, Barcelona, Spain), and juiced.
With a refractometer (RF40-ND model, FLIR Extech, Munich, Germany), total sugars (°Brix) were determined. Titratable acidity (TA; gL−1 tartaric acid) was measured on a 10 mL sample by manual glass burette, titrating with 0.1 M NaOH to a pH 7.0 endpoint using a portable pH meter (Hanna instrument, RI, USA) [78].

4.4. Statistical Analysis

To compare zeolite treatment effects in disparate irrigation programs and factors interactions, all data were exposed to a two-way analysis of variance (p ≤ 0.05) and Tukey HSD test using R version 4.1.2. (Development for R, MA, USA). The two irrigation regimes well-watered and water stress (WWCtrl-WSCtrl) were combined with zeolite treatments and supposed as fixed factors. The data are presented as the mean ± standard deviation (sd). After running preliminary Shapiro–Wilk’s (p ≤ 0.05) [89] and Levene’s (p ≤ 0.05) [90] tests to verify the normal distribution and the homogeneity of variance of each dataset, Pearson’s linear correlation index r (p < 0.05) was verified to determine the strength and direction of a linear relationship between two continuous variables [91,92].
Besides, a technique for monitoring and diagnosing processes with a large and multivariate dataset, consisting of many variables with strong correlations, was elaborated (Principal component analysis, PCA) [93,94,95].
Graphic representations were executed by integrated development environment (IDE) RStudio software version 4.1.2. (Development for R, MA, USA) [96].

5. Conclusions

Maximizing fertilizer and water use efficiency in order to decrease the environmental impact of agriculture, zeolite utilization is the key to upscaling plant water holding capacity that encourages the minimizing of vine irrigation, because water is well retained within the zeolite’s structure. This experiment supplies new evidence that zeolite applications could impact both the physiological profiles and berry skin metabolism (sugar and size) of vines, giving a better skill to counteract low water availability during the season. However, it is therefore believed that further investigations should be made, above all an investigation into the activity of sugars accumulated in the vacuole (activity of sucrose-metabolizing enzymes, sucrose transporters, and monosaccharide transporters).

Author Contributions

Conceptualization, E.C. and G.B.M.; methodology, E.C. and G.B.M.; software, E.C.; formal analysis, E.C.; field investigation, E.C. and M.F.; data curation, E.C.; writing—original draft preparation, E.C.; writing—review and editing, E.C.; supervision, G.B.M. All authors have read and agreed to the published version of the manuscript.

Funding

This research received no external funding.

Data Availability Statement

Not applicable.

Conflicts of Interest

The authors declare no conflict of interest.

References

  1. Nicoletti, G.; Arcuri, N.; Nicoletti, G.; Bruno, R. A technical and environmental comparison between hydrogen and some fossil fuels. Energy Convers. Manag. 2015, 89, 205–213. [Google Scholar] [CrossRef]
  2. Dijkstra, F.A.; Prior, S.A.; Runion, G.B.; Torbert, H.A.; Tian, H.; Lu, C.; Venterea, R.T. Effects of elevated carbon dioxide and increased temperature on methane and nitrous oxide fluxes: Evidence from field experiments. Front. Ecol. Environ. 2012, 10, 520–527. [Google Scholar] [CrossRef]
  3. Hu, X.; Xie, J.; Cai, W.; Wang, R.; Davarpanah, A. Thermodynamic effects of cycling carbon dioxide injectivity in shale reservoirs. J. Pet. Sci. Eng. 2020, 195, 107717. [Google Scholar] [CrossRef]
  4. Singh, R.K.; Arrighi, J.; de Perez, E.C.; Warrick, O.; Suarez, P.; Koelle, B.; Jjemba, E.; van Aalst, M.K.; Roberts, D.C.; Pörtner, H.O.; et al. International conference on climate risk management, inputs for the intergovernmental panel on climate change’s sixth assessment report. Clim. Dev. 2019, 11, 655–658. [Google Scholar] [CrossRef]
  5. Liu, Y.; Tang, L.; Qiu, X.; Liu, B.; Chang, X.; Liu, L.; Zhang, L.; Cao, W.; Zhu, Y. Impacts of 1.5 and 2.0 °C global warming on rice production across China. Agric. For. Meteorol. 2020, 284, 107900. [Google Scholar] [CrossRef]
  6. Mammola, S.; Piano, E.; Cardoso, P.; Vernon, P.; Domínguez-Villar, D.; Culver, D.C.; Pipan, T.; Isaia, M. Climate change going deep: The effects of global climatic alterations on cave ecosystems. Anthr. Rev. 2019, 6, 98–116. [Google Scholar] [CrossRef]
  7. Jones, G.V.; White, M.A.; Cooper, O.R.; Storchmann, K. Climate change and global wine quality. Clim. Chang. 2005, 73, 319–343. [Google Scholar] [CrossRef]
  8. Rayne, S.; Forest, K. Rapidly changing climatic conditions for wine grape growing in the Okanagan Valley region of British Columbia, Canada. Sci. Total Environ. 2016, 556, 169–178. [Google Scholar] [CrossRef]
  9. Cardell, M.F.; Amengual, A.; Romero, R. Future effects of climate change on the suitability of wine grape production across Europe. Reg. Environ. Chang. 2019, 19, 2299–2310. [Google Scholar] [CrossRef]
  10. Gbejewoh, O.; Keesstra, S.; Blancquaert, E. The 3Ps (profit, planet, and people) of sustainability amidst climate change: A South African grape and wine perspective. Sustainability 2021, 13, 2910. [Google Scholar] [CrossRef]
  11. Bonfante, A.; Monaco, E.; Langella, G.; Mercogliano, P.; Bucchignani, E.; Manna, P.; Terribile, F. A dynamic viticultural zoning to explore the resilience of terroir concept under climate change. Sci. Total Environ. 2018, 624, 294–308. [Google Scholar] [CrossRef]
  12. Jones, G.V. The climate component of terroir. Elem. Int. Mag. Mineral. Geochem. Petrol. 2018, 14, 167–172. [Google Scholar] [CrossRef]
  13. de Oliveira, J.B.; Egipto, R.; Laureano, O.; de Castro, R.; Pereira, G.E.; Ricardo-da-Silva, J.M. Climate effects on physicochemical composition of Syrah grapes at low and high altitude sites from tropical grown regions of Brazil. Food Res. Int. 2019, 121, 870–879. [Google Scholar] [CrossRef]
  14. Cabré, F.; Nuñez, M. Impacts of climate change on viticulture in Argentina. Reg. Environ. Chang. 2020, 20, 1–12. [Google Scholar] [CrossRef]
  15. Xyrafis, E.G.; Fraga, H.; Nakas, C.T.; Koundouras, S. A study on the effects of climate change on viticulture on Santorini Island. OENO One 2022, 56, 259–273. [Google Scholar] [CrossRef]
  16. Santos, J.A.; Fraga, H.; Malheiro, A.C.; Moutinho-Pereira, J.; Dinis, L.T.; Correia, C.; Moriondo, M.; Leolini, L.; Dibari, C.; Costafreda-Aumedes, S.; et al. A review of the potential climate change impacts and adaptation options for European viticulture. Appl. Sci. 2020, 10, 3092. [Google Scholar] [CrossRef]
  17. Gutiérrez-Gamboa, G.; Pszczólkowski, P.; Cañón, P.; Taquichiri, M.; Peñarrieta, J.M. UV-B Radiation as a Factor that Deserves Further Research in Bolivian Viticulture: A Review. S. Afr. J. Enol. Vitic. 2021, 42, 201–212. [Google Scholar] [CrossRef]
  18. Nimac, I.; Herceg-Bulić, I.; Cindrić Kalin, K.; Perčec Tadić, M. Changes in extreme air temperatures in the mid-sized European city situated on southern base of a mountain (Zagreb, Croatia). Theor. Appl. Climatol. 2021, 146, 429–441. [Google Scholar] [CrossRef]
  19. Salazar-Parra, C.; Aranjuelo, I.; Pascual, I.; Aguirreolea, J.; Sánchez-Díaz, M.; Irigoyen, J.J.; Araus, J.L.; Morales, F. Is vegetative area, photosynthesis, or grape C uploading involved in the climate change-related grape sugar/anthocyanin decoupling in Tempranillo? Photosynth. Res. 2018, 138, 115–128. [Google Scholar] [CrossRef]
  20. Candar, S.; Bahar, E.; Korkutal, I. Impacts of Leaf Area on the Physiological Activity and Berry Maturation of Merlot (Vitis vinifera L.). Appl. Ecol. Environ. Res. 2020, 18, 1523–1538. [Google Scholar] [CrossRef]
  21. Droulia, F.; Charalampopoulos, I. A Review on the Observed Climate Change in Europe and Its Impacts on Viticulture. Atmosphere 2022, 13, 837. [Google Scholar] [CrossRef]
  22. Gohari, A.; Mirchi, A.; Madani, K. System dynamics evaluation of climate change adaptation strategies for water resources management in central Iran. Water Resour. Manag. 2017, 31, 1413–1434. [Google Scholar] [CrossRef] [Green Version]
  23. Ostad-Ali-Askari, K.; Ghorbanizadeh Kharazi, H.; Shayannejad, M.; Zareian, M.J. Effect of climate change on precipitation patterns in an arid region using GCM models: Case study of Isfahan-Borkhar Plain. Nat. Hazards Rev. 2020, 21, 04020006. [Google Scholar] [CrossRef]
  24. Boo, Y.C.; Jung, J. Water deficit—induced oxidative stress and antioxidative defenses in rice plants. J. Plant Physiol. 1999, 155, 255–261. [Google Scholar]
  25. Guo, Y.Y.; Yu, H.Y.; Yang, M.M.; Kong, D.S.; Zhang, Y.J. Effect of drought stress on lipid peroxidation, osmotic adjustment and antioxidant enzyme activity of leaves and roots of Lycium ruthenicum Murr. seedling. Russ. J. Plant Physiol. 2018, 65, 244–250. [Google Scholar] [CrossRef]
  26. Khaleghi, A.; Naderi, R.; Brunetti, C.; Maserti, B.E.; Salami, S.A.; Babalar, M. Morphological, physiochemical and antioxidant responses of Maclura pomifera to drought stress. Sci. Rep. 2019, 9, 19250. [Google Scholar] [CrossRef]
  27. Sadiq, M.; Akram, N.A.; Ashraf, M.; Al-Qurainy, F.; Ahmad, P. Alpha-tocopherol-induced regulation of growth and metabolism in plants under non-stress and stress conditions. J. Plant Growth Regul. 2019, 38, 1325–1340. [Google Scholar] [CrossRef]
  28. Sun, Y.; Wang, C.; Chen, H.Y.; Ruan, H. Response of plants to water stress: A meta-analysis. Front. Plant Sci. 2020, 11, 978. [Google Scholar] [CrossRef]
  29. Galmés, J.; Medrano, H.; Flexas, J. Photosynthetic limitations in response to water stress and recovery in Mediterranean plants with different growth forms. New Phytol. 2007, 175, 81–93. [Google Scholar] [CrossRef]
  30. Pilon, C.; Snider, J.L.; Sobolev, V.; Chastain, D.R.; Sorensen, R.B.; Meeks, C.D.; Massa, A.N.; Walk, T.; Singh, B.; Earl, H.J. Assessing stomatal and non-stomatal limitations to carbon assimilation under progressive drought in peanut (Arachis hypogaea L.). J. Plant Physiol. 2018, 231, 124–134. [Google Scholar] [CrossRef]
  31. Jumrani, K.; Bhatia, V.S. Interactive effect of temperature and water stress on physiological and biochemical processes in soybean. Physiol. Mol. Biol. Plants 2019, 25, 667–681. [Google Scholar] [CrossRef]
  32. Galat Giorgi, E.; Sadras, V.O.; Keller, M.; Perez Peña, J. Interactive effects of high temperature and water deficit on Malbec grapevines. Aust. J. Grape Wine Res. 2019, 25, 345–356. [Google Scholar] [CrossRef]
  33. Li, D.; Wang, M.; Zhang, T.; Chen, X.; Li, C.; Liu, Y.; Brestic, M.; Chen, T.H.H.; Yang, X. Glycinebetaine mitigated the photoinhibition of photosystem II at high temperature in transgenic tomato plants. Photosynth. Res. 2021, 147, 301–315. [Google Scholar] [CrossRef]
  34. Ju, Y.L.; Yue, X.F.; Zhao, X.F.; Zhao, H.; Fang, Y.L. Physiological, micro-morphological and metabolomic analysis of grapevine (Vitis vinifera L.) leaf of plants under water stress. Plant Physiol. Biochem. 2018, 130, 501–510. [Google Scholar] [CrossRef]
  35. Tombesi, S.; Frioni, T.; Grisafi, F.; Sabbatini, P.; Poni, S.; Palliotti, A. The Decrease of Leaf Dark Respiration during Water Stress Is Related to Leaf Non-Structural Carbohydrate Pool in Vitis vinifera L. Plants 2021, 11, 36. [Google Scholar] [CrossRef]
  36. Hannah, L.; Roehrdanz, P.R.; Ikegami, M.; Shepard, A.V.; Shaw, M.R.; Tabor, G.; Zhi, L.; Marquet, P.A.; Hijmans, R.J. Climate change, wine, and conservation. Proc. Natl. Acad. Sci. USA 2013, 110, 6907–6912. [Google Scholar] [CrossRef] [Green Version]
  37. Gambetta, G.A.; Herrera, J.C.; Dayer, S.; Feng, Q.; Hochberg, U.; Castellarin, S.D. The physiology of drought stress in grapevine: Towards an integrative definition of drought tolerance. J. Exp. Bot. 2020, 71, 4658–4676. [Google Scholar] [CrossRef]
  38. Ratajczak, Z.; Carpenter, S.R.; Ives, A.R.; Kucharik, C.J.; Ramiadantsoa, T.; Stegner, M.A.; Williams, J.W.; Zhang, J.; Turner, M.G. Abrupt change in ecological systems: Inference and diagnosis. Trends Ecol. Evol. 2018, 33, 513–526. [Google Scholar] [CrossRef]
  39. Powell, E.B.; Krause, J.R.; Martin, R.M.; Nikinmaa, L.; Lindner, M.; Cantarello, E.; Jump, A.S.; Seidl, R.; Winkel, G.; Muys, B. Reviewing the Use of Resilience Concepts in Forest Sciences. Curr. For. Rep. 2020, 6, 61–80. [Google Scholar]
  40. Holling, C.S. Resilience and stability of ecological systems. Annu. Rev. Ecol. Evol. Syst. 1973, 4, 1–23. [Google Scholar] [CrossRef] [Green Version]
  41. Walker, A.P.; De Kauwe, M.G.; Medlyn, B.E.; Zaehle, S.; Iversen, C.M.; Asao, S.; Guenet, B.; Harper, A.; Hickler, T.; Hungate, B.A. Decadal biomass increment in early secondary succession woody ecosystems is increased by CO2 enrichment. Nat. Commun. 2019, 10, 454. [Google Scholar] [CrossRef] [PubMed]
  42. Albrich, K.; Rammer, W.; Seidl, R. Climate change causes critical transitions and irreversible alterations of mountain forests. Glob. Chang. Biol. 2020, 26, 4013–4027. [Google Scholar] [CrossRef] [PubMed]
  43. Jeltsch-Thömmes, A.; Stocker, T.F.; Joos, F. Hysteresis of the Earth system under positive and negative CO2 emissions. Environ. Res. Lett. 2020, 15, 124026. [Google Scholar] [CrossRef]
  44. Bramley, R.G.V. Precision Viticulture: Managing vineyard variability for improved quality outcomes. In Managing Wine Quality; Volume One: Viticulture and Wine Quality Woodhead Publishing Series in Food Science, Technology and Nutrition; Woodhead Publishing: Thorston, UK, 2022; pp. 541–586. [Google Scholar]
  45. Rehakova, M.; Čuvanová, S.; Dzivak, M.; Rimár, J.; Gaval’Ova, Z. Agricultural and agrochemical uses of natural zeolite of the clinoptilolite type. Curr. Opin. Solid State Mater. Sci. 2004, 8, 397–404. [Google Scholar] [CrossRef]
  46. Zanin, E.; Scapinello, J.; de Oliveira, M.; Rambo, C.L.; Franscescon, F.; Freitas, L.; de Mello, J.M.; Fiori, M.A.; Oliveira, J.V.; Dal Magro, J. Adsorption of heavy metals from wastewater graphic industry using clinoptilolite zeolite as adsorbent. Process Saf. Environ. Prot. 2017, 105, 194–200. [Google Scholar] [CrossRef]
  47. Mastinu, A.; Kumar, A.; Maccarinelli, G.; Bonini, S.A.; Premoli, M.; Aria, F.; Gianoncelli, A.; Memo, M. Zeolite clinoptilolite: Therapeutic virtues of an ancient mineral. Molecules 2019, 24, 1517. [Google Scholar] [CrossRef] [Green Version]
  48. Wambu, E.W.; Attahiru, S.; Shiundu, P.M.; Wabomba, J. Removal of heavy-metals from wastewater using a hydrous Alumino-silicate mineral from Kenya. Bull. Chem. Soc. Ethiop. 2018, 32, 39–51. [Google Scholar] [CrossRef] [Green Version]
  49. Jakkula, V.S.; Wani, S.P. Zeolites: Potential soil amendments for improving nutrient and water use efficiency and agriculture productivity. Sci. Rev. Chem. Commun. 2018, 8, 1–15. [Google Scholar]
  50. Yuvaraj, M.; Subramanian, K.S. Development of slow release Zn fertilizer using nano-zeolite as carrier. J. Plant Nutr. 2018, 41, 311–320. [Google Scholar] [CrossRef]
  51. Tasić, Ž.Z.; Bogdanović, G.D.; Antonijević, M.M. Application of natural zeolite in wastewater treatment: A review. J. Min. Metall. A Min. 2019, 55, 67–79. [Google Scholar] [CrossRef]
  52. Kowalczyk, P.; Sprynskyy, M.; Terzyk, A.P.; Lebedynets, M.; Namieśnik, J.; Buszewski, B. Porous structure of natural and modified clinoptilolites. J. Colloid Interface Sci. 2006, 297, 77–85. [Google Scholar] [CrossRef] [PubMed]
  53. Zheng, X.; Zhang, J.; Ding, X.; Chu, H.; Zhang, J. Frost resistance of internal curing concrete with calcined natural zeolite particles. Constr. Build. Mater. 2021, 288, 123062. [Google Scholar] [CrossRef]
  54. Lavoie-Lamoureux, A.; Sacco, D.; Risse, P.A.; Lovisolo, C. Factors influencing stomatal conductance in response to water availability in grapevine: A meta-analysis. Physiol. Plant 2017, 159, 468–482. [Google Scholar] [CrossRef] [PubMed]
  55. Oddo, E.; Abbate, L.; Inzerillo, S.; Carimi, F.; Motisi, A.; Sajeva, M.; Nardini, A. Water relations of two Sicilian grapevine cultivars in response to potassium availability and drought stress. Plant Physiol. Biochem. 2020, 148, 282–290. [Google Scholar] [CrossRef]
  56. Ru, C.; Hu, X.; Wang, W.; Ran, H.; Song, T.; Guo, Y. Evaluation of the crop water stress index as an indicator for the diagnosis of grapevine water deficiency in greenhouses. Horticulturae 2020, 6, 86. [Google Scholar] [CrossRef]
  57. Degu, A.; Hochberg, U.; Wong, D.C.; Alberti, G.; Lazarovitch, N.; Peterlunger, E.; Castellarin, S.D.; Herrera, J.C.; Fait, A. Swift metabolite changes and leaf shedding are milestones in the acclimation process of grapevine under prolonged water stress. BMC Plant Biol. 2019, 19, 69. [Google Scholar] [CrossRef]
  58. de Campos Bernardi, A.C.; Oliviera, P.P.A.; de Melo Monte, M.B.; Souza-Barros, F. Brazilian sedimentary zeolite use in agriculture. Microporous Mesoporous Mater. 2013, 167, 16–21. [Google Scholar] [CrossRef] [Green Version]
  59. Gül, A.; Eroğul, D.; Ongun, A.R. Comparison of the use of zeolite and perlite as substrate for crisp-head lettuce. Sci. Hortic. 2005, 106, 464–471. [Google Scholar] [CrossRef]
  60. Valente, S.; Burriesci, N.; Cavallaro, S.; Galvagno, S.; Zipelli, C. Utilization of zeolites as soil conditioner in tomato-growing. Zeolites 1982, 2, 271–274. [Google Scholar] [CrossRef]
  61. Xiubin, H.; Zhanbin, H. Zeolite application for enhancing water infiltration and retention in loess soil. Resour. Conserv. Recycl. 2001, 34, 45–52. [Google Scholar] [CrossRef]
  62. Domenico, P. Comparison between sterilized zeolite and natural zeolite in the Cactus Pear (Opuntia Ficus-Indica L. Mill.) growing. GSC Adv. Res. Rev. 2020, 5, 007–014. [Google Scholar] [CrossRef]
  63. De Smedt, C.; Someus, E.; Spanoghe, P. Potential and actual uses of zeolites in crop protection. Pest Manag. Sci. 2015, 71, 1355–1367. [Google Scholar] [CrossRef] [PubMed]
  64. Waraich, E.A.; Ahmad, R.; Halim, A.; Aziz, T. Alleviation of temperature stress by nutrient management in crop plants: A review. J. Soil Sci. Plant Nutr. 2012, 12, 221–244. [Google Scholar] [CrossRef] [Green Version]
  65. Nakhli, S.A.A.; Delkash, M.; Bakhshayesh, B.E.; Kazemian, H. Application of zeolites for sustainable agriculture: A review on water and nutrient retention. Water Air Soil Pollut. 2017, 228, 464. [Google Scholar] [CrossRef]
  66. Ozbahce, A.; Tari, A.F.; Gönülal, E.; Simsekli, N.; Padem, H. The effect of zeolite applications on yield components and nutrient uptake of common bean under water stress. Arch. Agron. Soil Sci. 2015, 61, 615–626. [Google Scholar] [CrossRef]
  67. Mahmoud, A.W.M.; Swaefy, H.M. Comparison between commercial and nano NPK in presence of nano zeolite on sage plant yield and its components under water stress. Agriculture 2020, 66, 24–39. [Google Scholar] [CrossRef]
  68. Gholizadeh, A.; Mohd Soom, M.A.; Abdul Rahim, A.; Saberioon, M.M. Water stress and natural zeolite impacts on phisiomorphological characteristics of moldavian balm (Dracocephalum moldavica L.). Aust. J. Basic Appl. Sci. 2010, 4, 5184–5190. [Google Scholar]
  69. Valadabadi, S.A.; Shiranirad, A.H.; Farahani, H.A. Ecophysiological influences of zeolite and selenium on water deficit stress tolerance in different rapeseed cultivars. J. Ecol. Nat. Environ. 2013, 2, 154–159. [Google Scholar]
  70. Baghbani-Arani, A.; Jami, M.G.; Namdari, A.; Karami Borz-Abad, R. Influence of irrigation regimes, zeolite, inorganic and organic manures on water use efficiency, soil fertility and yield of sunflower in a sandy soil. Commun. Soil Sci. Plant Anal. 2020, 51, 711–725. [Google Scholar] [CrossRef]
  71. Baninasab, B. Effects of the application of natural zeolite on the growth and nutrient status of radish (Raphanus sativus L.). J. Hortic. Sci. Biotechnol. 2009, 84, 13–16. [Google Scholar] [CrossRef]
  72. Flexas, J.; Scoffoni, C.; Gago, J.; Sack, L. Leaf mesophyll conductance and leaf hydraulic conductance: An introduction to their measurement and coordination. J. Exp. Bot. 2013, 64, 3965–3981. [Google Scholar] [CrossRef] [PubMed]
  73. Johnson, D.M.; Woodruff, D.R.; McCulloh, K.A.; Meinzer, F.C. Leaf hydraulic conductance, measured in situ, declines and recovers daily: Leaf hydraulics, water potential and stomatal conductance in four temperate and three tropical tree species. Tree Physiol. 2009, 29, 879–887. [Google Scholar] [CrossRef] [PubMed]
  74. Martínez-Vilalta, J.; Garcia-Forner, N. Water potential regulation, stomatal behaviour and hydraulic transport under drought: Deconstructing the iso/anisohydric concept. Plant Cell Environ. 2017, 40, 962–976. [Google Scholar] [CrossRef] [PubMed] [Green Version]
  75. Salvi, L.; Brunetti, C.; Cataldo, E.; Storchi, P.; Mattii, G.B. Eco-physiological traits and phenylpropanoid profiling on potted Vitis vinifera L. cv Pinot noir subjected to Ascophyllum nodosum treatments under post-veraison low water availability. Appl. Sci. 2020, 10, 4473. [Google Scholar] [CrossRef]
  76. Cataldo, E.; Salvi, L.; Mattii, G.B. Effects of irrigation on ecophysiology, sugar content and thiol precursors (3-S-cysteinylhexan-1-ol and 3-S-glutathionylhexan-1-ol) on Vitis vinifera cv. Sauvignon Blanc. Plant Physiol. Biochem. 2021, 164, 247–259. [Google Scholar] [CrossRef] [PubMed]
  77. Janoš, P.; Vávrová, J.; Herzogová, L.; Pilařová, V. Effects of inorganic and organic amendments on the mobility (leachability) of heavy metals in contaminated soil: A sequential extraction study. Geoderma 2010, 159, 335–341. [Google Scholar] [CrossRef]
  78. Cataldo, E.C.; Salvi, L.S.; Paoli, F.P.; Fucile, M.F.; Masciandaro, G.M.; Manzi, D.M.; Masini, C.M.M.; Mattii, G.B.M. Effects of natural clinoptilolite on physiology, water stress, sugar, and anthocyanin content in Sanforte (Vitis vinifera L.) young vineyard. J. Agric. Sci. 2021, 159, 488–499. [Google Scholar] [CrossRef]
  79. Lorenz, D.H.; Eichhorn, K.W.; Bleiholder, H.; Klose, R.; Meier, U.; Weber, E. Growth Stages of the Grapevine: Phenological growth stages of the grapevine (Vitis vinifera L. ssp. vinifera)—Codes and descriptions according to the extended BBCH scale. Aust. J. Grape Wine Res. 1995, 1, 100–103. [Google Scholar] [CrossRef]
  80. Ghaffari, S.; Reynard, J.S.; Rienth, M. Single berry reconstitution prior to RNA-sequencing reveals novel insights into transcriptomic remodeling by leafroll virus infections in grapevines. Sci. Rep. 2020, 10, 12905. [Google Scholar] [CrossRef]
  81. Poni, S.; Bernizzoni, F.; Civardi, S.; Gatti, M.; Porro, D.; Camin, F. Performance and water-use efficiency (single-leaf vs. whole-canopy) of well-watered and half-stressed split-root Lambrusco grapevines grown in Po Valley (Italy). Agric. Ecosyst. Environ. 2009, 129, 97–106. [Google Scholar] [CrossRef]
  82. Maxwell, K.; Johnson, G.N. Chlorophyll fluorescence—A practical guide. J. Exp. Bot. 2000, 51, 659–668. [Google Scholar] [CrossRef] [PubMed]
  83. Zuecco, G.; Amin, A.; Frentress, J.; Engel, M.; Marchina, C.; Anfodillo, T.; Borga, M.; Carraro, V.; Scandellari, F.; Tagliavini, M.; et al. A Comparative Study of Plant Water Extraction Methods for Isotopic Analyses: Scholander-Type Pressure Chamber vs. Cryogenic Vacuum Distillation. Hydrol. Earth Syst. Sci. Discuss 2020, 1–23. Available online: https://hess.copernicus.org/preprints/hess-2020-446/ (accessed on 9 June 2022).
  84. Williams, L.E.; Araujo, F.J. Correlations among predawn leaf, midday leaf, and midday stem water potential and their correlations with other measures of soil and plant water status in Vitis vinifera. J. Am. Soc. Hortic. Sci. 2002, 127, 448–454. [Google Scholar] [CrossRef] [Green Version]
  85. Bravdo, B.; Hepner, Y.; Loinger, C.; Cohen, S.; Tabacman, H. Effect of irrigation and crop level on growth, yield and wine quality of Cabernet Sauvignon. Am. J. Enol. Vitic. 1985, 36, 132–139. [Google Scholar]
  86. Lovisolo, C.; Hartung, W.; Schubert, A. Whole-plant hydraulic conductance and root-to-shoot flow of abscisic acid are independently affected by water stress in grapevines. Funct. Plant Biol. 2002, 29, 1349–1356. [Google Scholar] [CrossRef]
  87. Lovisolo, C.; Perrone, I.; Carra, A.; Ferrandino, A.; Flexas, J.; Medrano, H.; Schubert, A. Drought-induced changes in development and function of grapevine (Vitis spp.) organs and in their hydraulic and non-hydraulic interactions at the whole-plant level: A physiological and molecular update. Funct. Plant Biol. 2010, 37, 98–116. [Google Scholar] [CrossRef]
  88. Bertamini, M.; Zulini, L.; Muthuchelian, K.; Nedunchezhian, N. Effect of water deficit on photosynthetic and other physiological responses in grapevine (Vitis vinifera L. cv. Riesling) plants. Photosynthetica 2006, 44, 151–154. [Google Scholar] [CrossRef]
  89. Razali, N.M.; Wah, Y.B. Power comparisons of Shapiro-Wilk, Kolmogorov-Smirnov, lilliefors and Anderson-darling tests. J. Stat. Modeling Anal. 2011, 2, 21–33. [Google Scholar]
  90. Gastwirth, J.L.; Gel, Y.R.; Miao, W. The impact of Levene’s test of equality of variances on statistical theory and practice. Stat. Sci. 2009, 24, 343–360. [Google Scholar] [CrossRef] [Green Version]
  91. Akoglu, H. User’s guide to correlation coefficients. Turk. J. Emerg. Med. 2018, 18, 91–93. [Google Scholar] [CrossRef]
  92. Felföldi, Z.; Ranga, F.; Roman, I.A.; Sestras, A.F.; Vodnar, D.C.; Prohens, J.; Sestras, R.E. Analysis of Physico-Chemical and Organoleptic Fruit Parameters Relevant for Tomato Quality. Agronomy 2022, 12, 1232. [Google Scholar] [CrossRef]
  93. Ringnér, M. What is principal component analysis? Nat. Biotechnol. 2008, 26, 303–304. [Google Scholar] [CrossRef] [PubMed]
  94. Granato, D.; Santos, J.S.; Escher, G.B.; Ferreira, B.L.; Maggio, R.M. Use of principal component analysis (PCA) and hierarchical cluster analysis (HCA) for multivariate association between bioactive compounds and functional properties in foods: A critical perspective. Trends Food Sci. Technol. 2018, 72, 83–90. [Google Scholar] [CrossRef]
  95. Tassinari, A.; Stefanello, L.O.; Schwalbert, R.A.; Vitto, B.B.; Kulmann, M.S.D.S.; Santos, J.P.J.; Arruda, W.S.; Schwalbert, R.; Tiecher, T.L.; Ceretta, C.A.; et al. Nitrogen Critical Level in Leaves in ‘Chardonnay’and ‘Pinot Noir’Grapevines to Adequate Yield and Quality Must. Agronomy 2022, 12, 1132. [Google Scholar] [CrossRef]
  96. Horton, N.J.; Kleinman, K. Using R and RStudio for Data Management, Statistical Analysis, and Graphics; CRC Press: Boca Raton, FL, USA, 2015. [Google Scholar]
Figure 1. Meteorological parameters of the experiment location. Monthly averages of mean, maximum, and minimum air temperature (°C) and precipitation (mm) were measured from April to October.
Plants 11 01735 g001
Figure 2. Photosynthetically active radiation (PAR; µmol m2s1) in Vitis vinifera (Pinot Noir cv.) treated with Zeolite (t) and untreated plants (Ctrl), under two irrigation regimes (WW, well-watered; WS, water-stressed); (A). 28 July 2021, (B). 5 August 2021, and (C). 13 August 2021. The box bounds show the 25 and 75 percentiles, and the error bars the 90 and 10 percentiles. The black continuous and red discontinuous lines inside the boxes represent medians and means, respectively. Outliers are represented as color dots. Average values with the same letter in each figure indicate no significant differences between plots (p < 0.05).
Plants 11 01735 g002
Figure 3. Leaf temperature (Tleaf; °C) in Vitis vinifera (Pinot Noir cv.) treated with Zeolite (t) and untreated plants (Ctrl), under two irrigation regimes (WW, well-watered; WS, water-stressed); (A). 28 July 2021, (B). 5 August 2021, and (C). 13 August 2021. The box bounds show the 25 and 75 percentiles, and the error bars the 90 and 10 percentiles. The black continuous and red discontinuous lines inside the boxes represent medians and means, respectively. Outliers are represented as color dots. Average values with the same letter in each figure indicate no significant differences between plots (p < 0.05).
Plants 11 01735 g003
Figure 4. Net photosynthesis (PN; µmol m2s1) in Vitis vinifera (Pinot Noir cv.) treated with Zeolite (t) and untreated plants (Ctrl), under two irrigation regimes (WW, well-watered; WS, water-stressed); (A). 28 July 2021, (B). 5 August 2021, and (C). 13 August 2021. The box bounds show the 25 and 75 percentiles, and the error bars the 90 and 10 percentiles. The black continuous and red discontinuous lines inside the boxes represent medians and means, respectively. Outliers are represented as color dots. Average values with the same letter in each figure indicate no significant differences between plots (p < 0.05).
Plants 11 01735 g004
Figure 5. Plant hydraulic conductivity (Kplant; mmol m2s1 MPa1) in Vitis vinifera treated with Zeolite (t) and untreated plants (Ctrl), under two irrigation regimes (WW, well-watered; WS, water-stressed); (A). 28 July 2021, (B). 5 August 2021, and (C). 13 August 2021. The box bounds show the 25 and 75 percentiles, and the error bars the 90 and 10 percentiles. The black continuous and red discontinuous lines inside the boxes represent medians and means, respectively. Outliers are represented as color dots. Average values with the same letter in each figure indicate no significant differences between plots (p < 0.05).
Plants 11 01735 g005
Figure 6. Berry weight (bw; gr) in Vitis vinifera (Pinot Noir cv.) treated with Zeolite (t) and untreated plants (Ctrl), under two irrigation regimes (WW, well-watered; WS, water-stressed); (A). 28 July 2021, (B). 5 August 2021, and (C). 13 August 2021. The box bounds show the 25 and 75 percentiles, and the error bars the 90 and 10 percentiles. The black continuous and red discontinuous lines inside the boxes represent medians and means, respectively. Outliers are represented as color dots. Average values with the same letter in each figure indicate no significant differences between plots (p < 0.05).
Plants 11 01735 g006
Figure 7. Pearson’s Correlation. WWt Treatment (Well-watered + Zeolite). Ecophysiological and technological correlations between the pairs of traits were analyzed. Correlations were calculated from the mean values of each of the four treatments characterized. Positive correlations are displayed in red and negative correlations in violet. The color intensity and the size of the circle are proportional to the correlation coefficients. The grey background boxes illustrate the significant values at the level of p < 0.05 (two-tailed).
Plants 11 01735 g007
Figure 8. Pearson’s Correlation. WWCtrl Treatment (Well-watered). Ecophysiological and technological correlations between the pairs of traits were analyzed. Correlations were calculated from the mean values of each of the four treatments characterized. Positive correlations are displayed in red and negative correlations in violet. The color intensity and the size of the circle are proportional to the correlation coefficients. The grey background boxes illustrate the significant values at the level of p < 0.05 (two-tailed).
Plants 11 01735 g008
Figure 9. Pearson’s Correlation. WSt Treatment (Water stress + Zeolite). Ecophysiological and technological correlations between the pairs of traits were analyzed. Correlations were calculated from the mean values of each of the four treatments characterized. Positive correlations are displayed in red and negative correlations in violet. The color intensity and the size of the circle are proportional to the correlation coefficients. The grey background boxes illustrate the significant values at the level of p < 0.05 (two-tailed).
Plants 11 01735 g009
Figure 10. Pearson’s Correlation. WSCtrl Treatment (Water stress). Ecophysiological and technological correlations between the pairs of traits were analyzed. Correlations were calculated from the mean values of each of the four treatments characterized. Positive correlations are displayed in red and negative correlations in violet. The color intensity and the size of the circle are proportional to the correlation coefficients. The grey background boxes illustrate the significant values at the level of p < 0.05 (two-tailed).
Plants 11 01735 g010
Figure 11. Relationship between principal component 1 (Dim1) and principal component 2 (Dim2) for response variables analyzed in field experiments with Pinot Noir cultivar subjected to different treatments (WWt, WWCtrl, WSt, and WSCtrl) during the 2021 season (28 July 2021).
Plants 11 01735 g011
Figure 12. Relationship between principal component 1 (Dim1) and principal component 2 (Dim2) for response variables analyzed in field experiments with Pinot Noir cultivar subjected to different treatments (WWt, WW, WSt, and WS) during the 2021 season (5 August 2021).
Plants 11 01735 g012
Figure 13. Relationship between principal component 1 (Dim1) and principal component 2 (Dim2) for response variables analyzed in field experiments with Pinot Noir cultivar subjected to different treatments (WWt, WWCtrl, WSt, and WSCtrl) during the 2021 season (13 August 2021).
Plants 11 01735 g013
Table 1. Two-way ANOVA (p < 0.05) for eco-physiology parameters in Vitis vinifera (Pinot Noir cv.) treated with Zeolite (t) and untreated plants (Ctrl), under two irrigation regimes (WW, well-watered; WS, water-stressed). Values are the mean of the data of each parameter, considering treatments (zeolite and Ctrl) and irrigation regime (Irrig. Regime) as factors. In the last 3 rows is indicated the significance. Other abbreviations: stomatal conductance (gs), transpiration (E), water use efficiency (WUE), fluorescence of chlorophyll (Fluo), and vapor pressure deficit (VPD). The same letter pictured on different treatments indicates no significant difference among them (mean ± SE, n = 10).
ParametergsEWUEeFluoVPD
Unitmmol m−2 s−1mmol m−2 s−1µmol mmol−1Fv/FmkPa
28 July 2021
Treatments:
WWt174.70 ± 55.39 a4.62 ± 1.07 a3.21 ± 1.16 a0.77 ± 0.04 a3.17 ± 0.23 b
WSt145.40 ± 39.00 a4.57 ± 1.17 a3.00 ± 1.10 a0.76 ± 0.05 a3.50 ± 0.49 ab
Irrigation regime:
WWCtrl189.60 ± 57.25 a5.34 ± 1.49 a2.67 ± 0.95 ab0.78 ± 0.03 a3.11 ± 0.45 b
WSCtrl82.60 ± 14.29 b2.82 ± 0.29 b1.64 ± 0.35 b0.75 ± 0.03 a3.76 ± 0.17 a
Significance:
Treatments0.0970.1120.0031.0000.391
Irrigation regime0.0000.0000.0440.1310.000
Treat. × Irr. regime0.0090.0000.1780.4450.174
5 August 2021
Treatments:
WWt89.20 ± 22.42 a2.28 ± 0.44 a3.86 ± 0.53 b0.77 ± 0.03 a2.66 ± 0.21 c
WSt69.90 ± 56.28 ab1.85 ± 1.37 ab4.75 ± 0.68 a0.76 ± 0.05 a2.81 ± 1.22 bc
Irrigation regime:
WWCtrl61.00 ± 18.10 b1.61 ± 0.32 b4.80 ± 0.87 a0.76 ± 0.06 a2.92 ± 0.35 b
WSCtrl54.70 ± 52.66 b1.81 ± 1.56 ab3.63 ± 1.80 b0.69 ± 0.04 b3.30 ± 1.02 a
Significance:
Treatments0.0000.0070.6390.0100.000
Irrigation regime0.0380.3760.4220.0070.000
Treat. × Irr. regime0.2810.0150.0000.0900.098
13 August 2021
Treatments:
WWt115.00 ± 74.64 a3.14 ± 1.35 a2.91 ± 1.31 a0.77 ± 0.01 ab4.80 ± 1.00 a
WSt109.42 ± 23.12 a2.27 ± 0.99 a3.71 ± 0.48 a0.76 ± 0.10 ab3.54 ± 0.35 b
Irrigation regime:
WWCtrl112.30 ± 54.33 a2.32 ± 0.84 a3.72 ± 1.83 a0.79 ± 0.09 a5.04 ± 0.88 a
WSCtrl47.30 ± 21.36 a1.99 ± 0.95 a2.26 ± 0.73 a0.69 ± 0.10 b3.98 ± 0.31 b
Significance:
Treatments0.0780.1870.4980.3470.209
Irrigation regime0.0560.1500.4840.0240.000
Treat. × Irr. regime0.1050.5220.0200.0350.711
Table 2. Two-way ANOVA (p < 0.05) for eco-physiology parameters in Vitis vinifera (Pinot Noir cv.) treated with Zeolite (t) and untreated plants (Ctrl), under two irrigation regimes (WW, well-watered; WS, water-stressed). Values are the mean of the data of each parameter, considering treatments (Zeolite and Ctrl) and irrigation regime (Irrig. Regime) as factors. In the last 3 rows is indicated the significance. Other abbreviations: pre-dawn water potential (ΨPD), leaf water potential (Ψleaf), stem water potential (Ψstem), and relative water content (RWC). The same letter pictured on different treatments indicates no significant difference among them (mean ± SE, n = 10).
ParameterΨPDΨleafΨstemRWC
UnitMPaMPaMPa%
28 July 2021
Treatments:
WWt−0.27 ± 0.12 a−1.28 ± 0.10 a−1.00 ± 0.11 a90.99 ± 1.76 a
WSt−1.42 ± 0.22 b−1.66 ± 0.14 b−1.42 ± 0.16 a88.49 ± 3.23 ab
Irrigation regime:
WWCtrl−0.28 ± 0.34 a−1.28 ± 0.30 a−1.00 ± 0.33 a90.32 ± 3.16 ab
WSCtrl−0.91 ± 0.13 b−1.90 ± 0.11 c−1.69 ± 0.12 b87.32 ± 12.36 b
Significance:
Treatments0.3440.0700.0700.319
Irrigation regime0.0000.0000.0000.004
Treat. × Irr. regime0.4370.0700.0700.789
5 August 2021
Treatments:
WWt−0.51 ± 0.12 a−1.69 ± 0.15 a−1.45 ± 0.17 b87.59 ± 4.70 a
WSt−0.64 ± 0.22 a−1.49 ± 0.17 a−1.23 ± 0.19 a82.25 ± 19.86 ab
Irrigation regime:
WWCtrl−0.54 ± 0.21 a−1.57 ± 0.21 a−1.32 ± 0.24 a82.97 ± 5.97 ab
WSCtrl−0.94 ± 0.15 b−1.85 ± 0.15 b−1.63 ± 0.16 c66.70 ± 10.08 c
Significance:
Treatments0.0000.050.0050.000
Irrigation regime0.0000.3290.3290.000
Treat. × Irr. regime0.0010.0000.0000.057
13 August 2021
Treatments:
WWt−0.36 ± 0.17 a−1.32 ± 0.16 a−1.05 ± 0.17 a34.55 ± 8.22 a
WSt−0.69 ± 0.13 b−1.59 ± 0.11 b−1.35 ± 0.12 b28.74 ± 5.71 a
Irrigation regime:
WWCtrl−0.49 ± 0.21 a−1.38 ± 0.31 a−1.12 ± 0.34 a29.96 ± 6.59 a
WSCtrl−0.99 ± 0.18 c−2.14 ± 0.18 c−1.94 ± 0.20 c26.09 ± 5.81 a
Significance:
Treatments0.0000.0000.0000.144
Irrigation regime0.0000.0000.0000.069
Treat. × Irr. regime0.1350.0000.0000.662
Table 3. Two-way ANOVA (p < 0.05) for technological parameters in Vitis vinifera (Pinot Noir cv.) treated with Zeolite (t) and untreated plants (Ctrl), under two irrigation regimes (WW, well-watered; WS, water-stressed). Values are the mean of the data of each parameter, considering treatments (zeolite and ctrl) and irrigation regime (Irrig. Regime) as factors. In the last 3 rows is indicated the significance. The same letter pictured on different treatments indicates no significant difference among them (mean ± SE, n = 10).
ParameterSugar ContentAciditypH
Unit°Brixg L−1 tartaric ac.pH
28 July 2021
Treatments:
WWt15.93 ± 0.80 b13.56 ± 1.35 a3.12 ± 0.04 a
WSt16.73 ± 0.77 a13.13 ± 1.30 a3.08 ± 0.10 a
Irrigation regime:
WWCtrl15.73 ± 0.30 b13.56 ± 1.34 a3.13 ± 0.04 a
WSCtrl16.00 ± 0.52 ab13.43 ± 1.09 a3.10 ± 0.08 a
Significance:
Treatments0.0240.7360.466
Irrigation regime0.0100.5260.053
Treat. × Irr. regime0.1870.7360.916
5 August 2021
Treatments:
WWt16.86 ± 0.67 c12.43 ± 1.84 b3.21 ± 0.32 a
WSt17.20 ± 1.11 b14.26 ± 3.57 a3.13 ± 0.59 a
Irrigation regime:
WWCtrl16.06 ± 0.52 c10.36 ± 0.88 c3.17 ± 0.09 a
WSCtrl17.90 ± 1.71 a13.73 ± 0.23 a3.00 ± 0.07 a
Significance:
Treatments0.6650.0000.386
Irrigation regime0.0000.0000.215
Treat. × Irr. regime0.0000.0020.669
13 August 2021
Treatments:
WWt19.30 ± 0.86 a5.36 ± 0.25 b3.47 ± 0.05 a
WSt19.98 ± 1.54 a5.93 ± 0.48 a3.47 ± 0.07 a
Irrigation regime:
WWCtrl18.22 ± 1.32 b5.76 ± 0.35 ab3.52 ± 0.08 a
WSCtrl20.09 ± 1.42 a5.56 ± 0.46 b3.50 ± 0.06 a
Significance:
Treatments0.2680.8540.092
Irrigation regime0.0050.0490.709
Treat. × Irr. regime0.1780.0000.602
Publisher’s Note: MDPI stays neutral with regard to jurisdictional claims in published maps and institutional affiliations.

