
Long-Term Impact of Phosphorous Fertilization on Yield and Alternate Bearing in Intensive Irrigated Olive Cultivation

 ,
, 

Abstract
:1. Introduction
2. Results
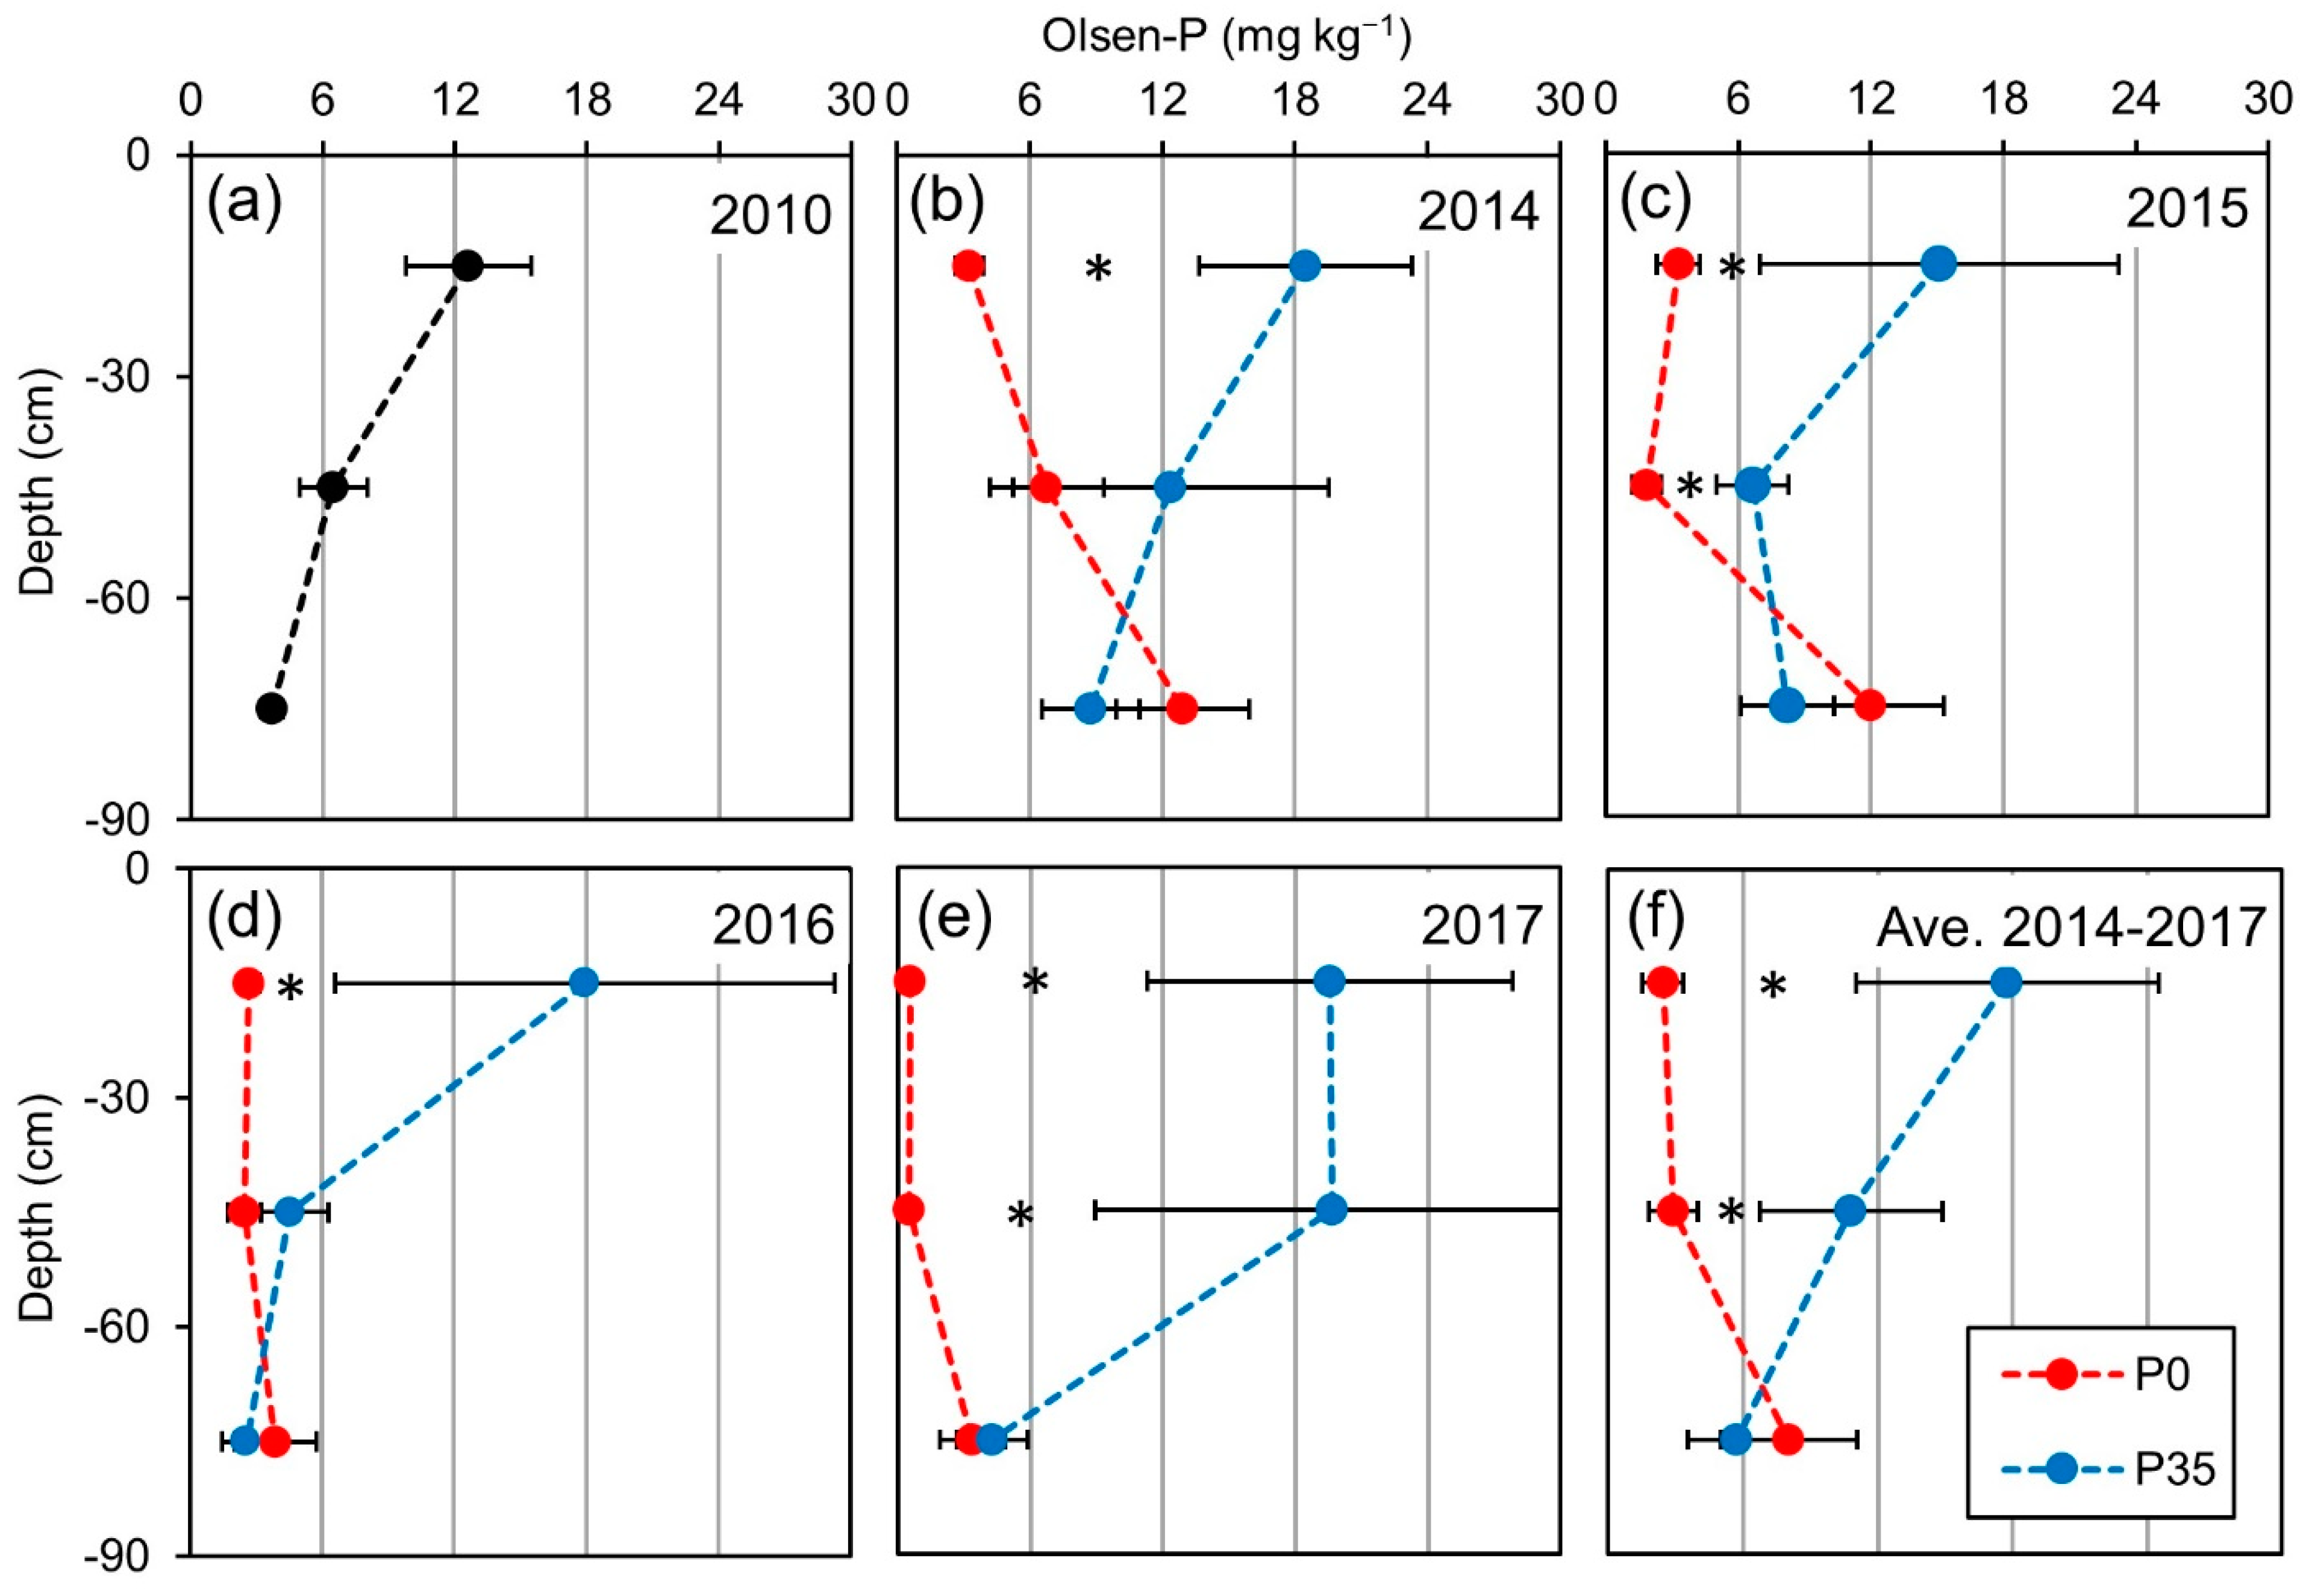
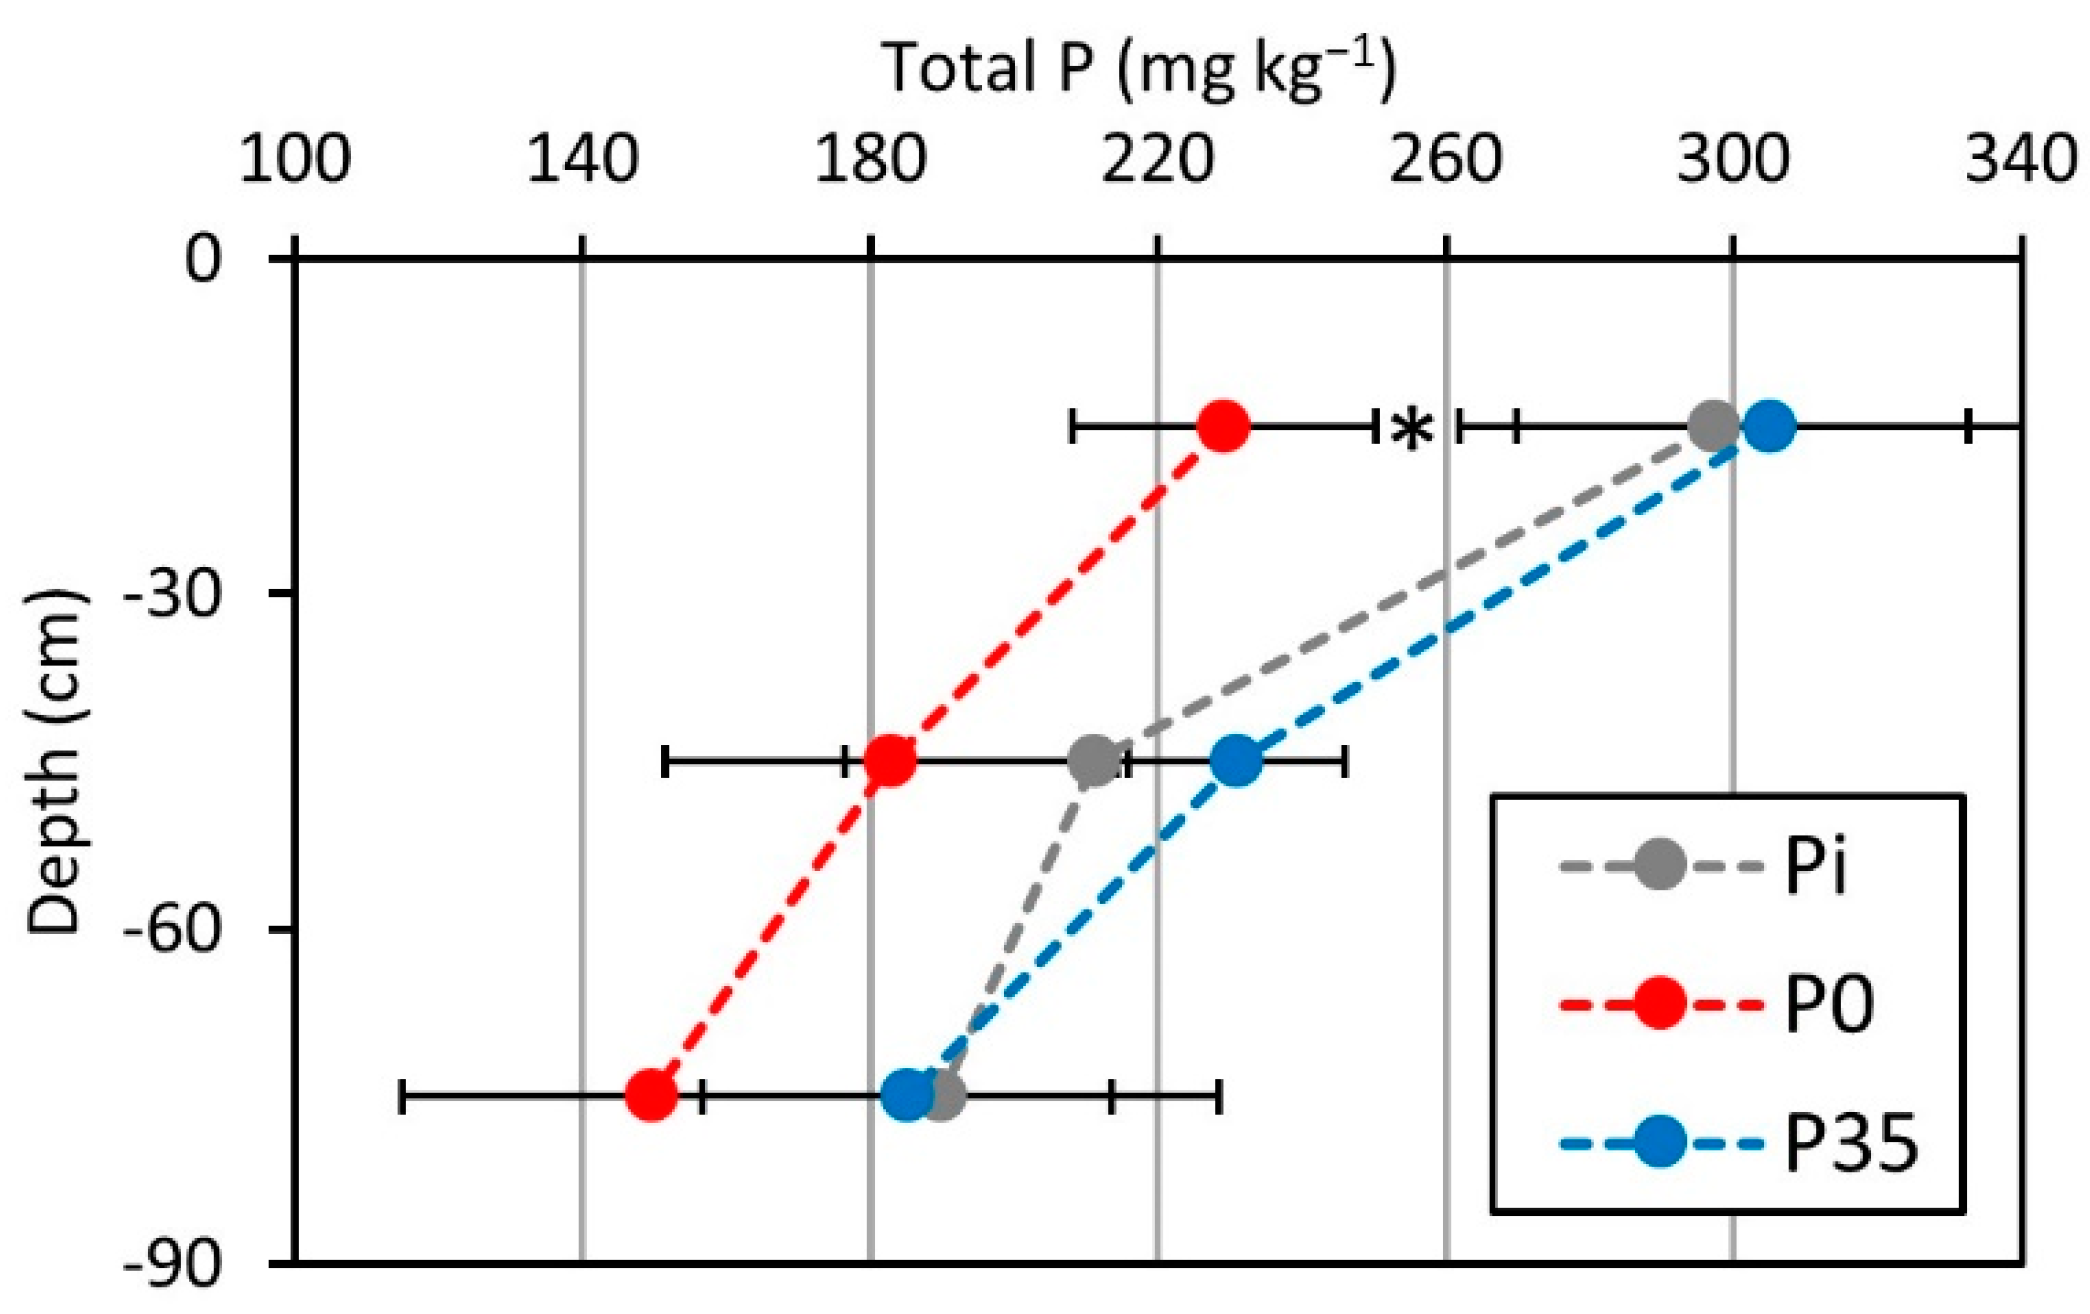
2.1. Soil P Content
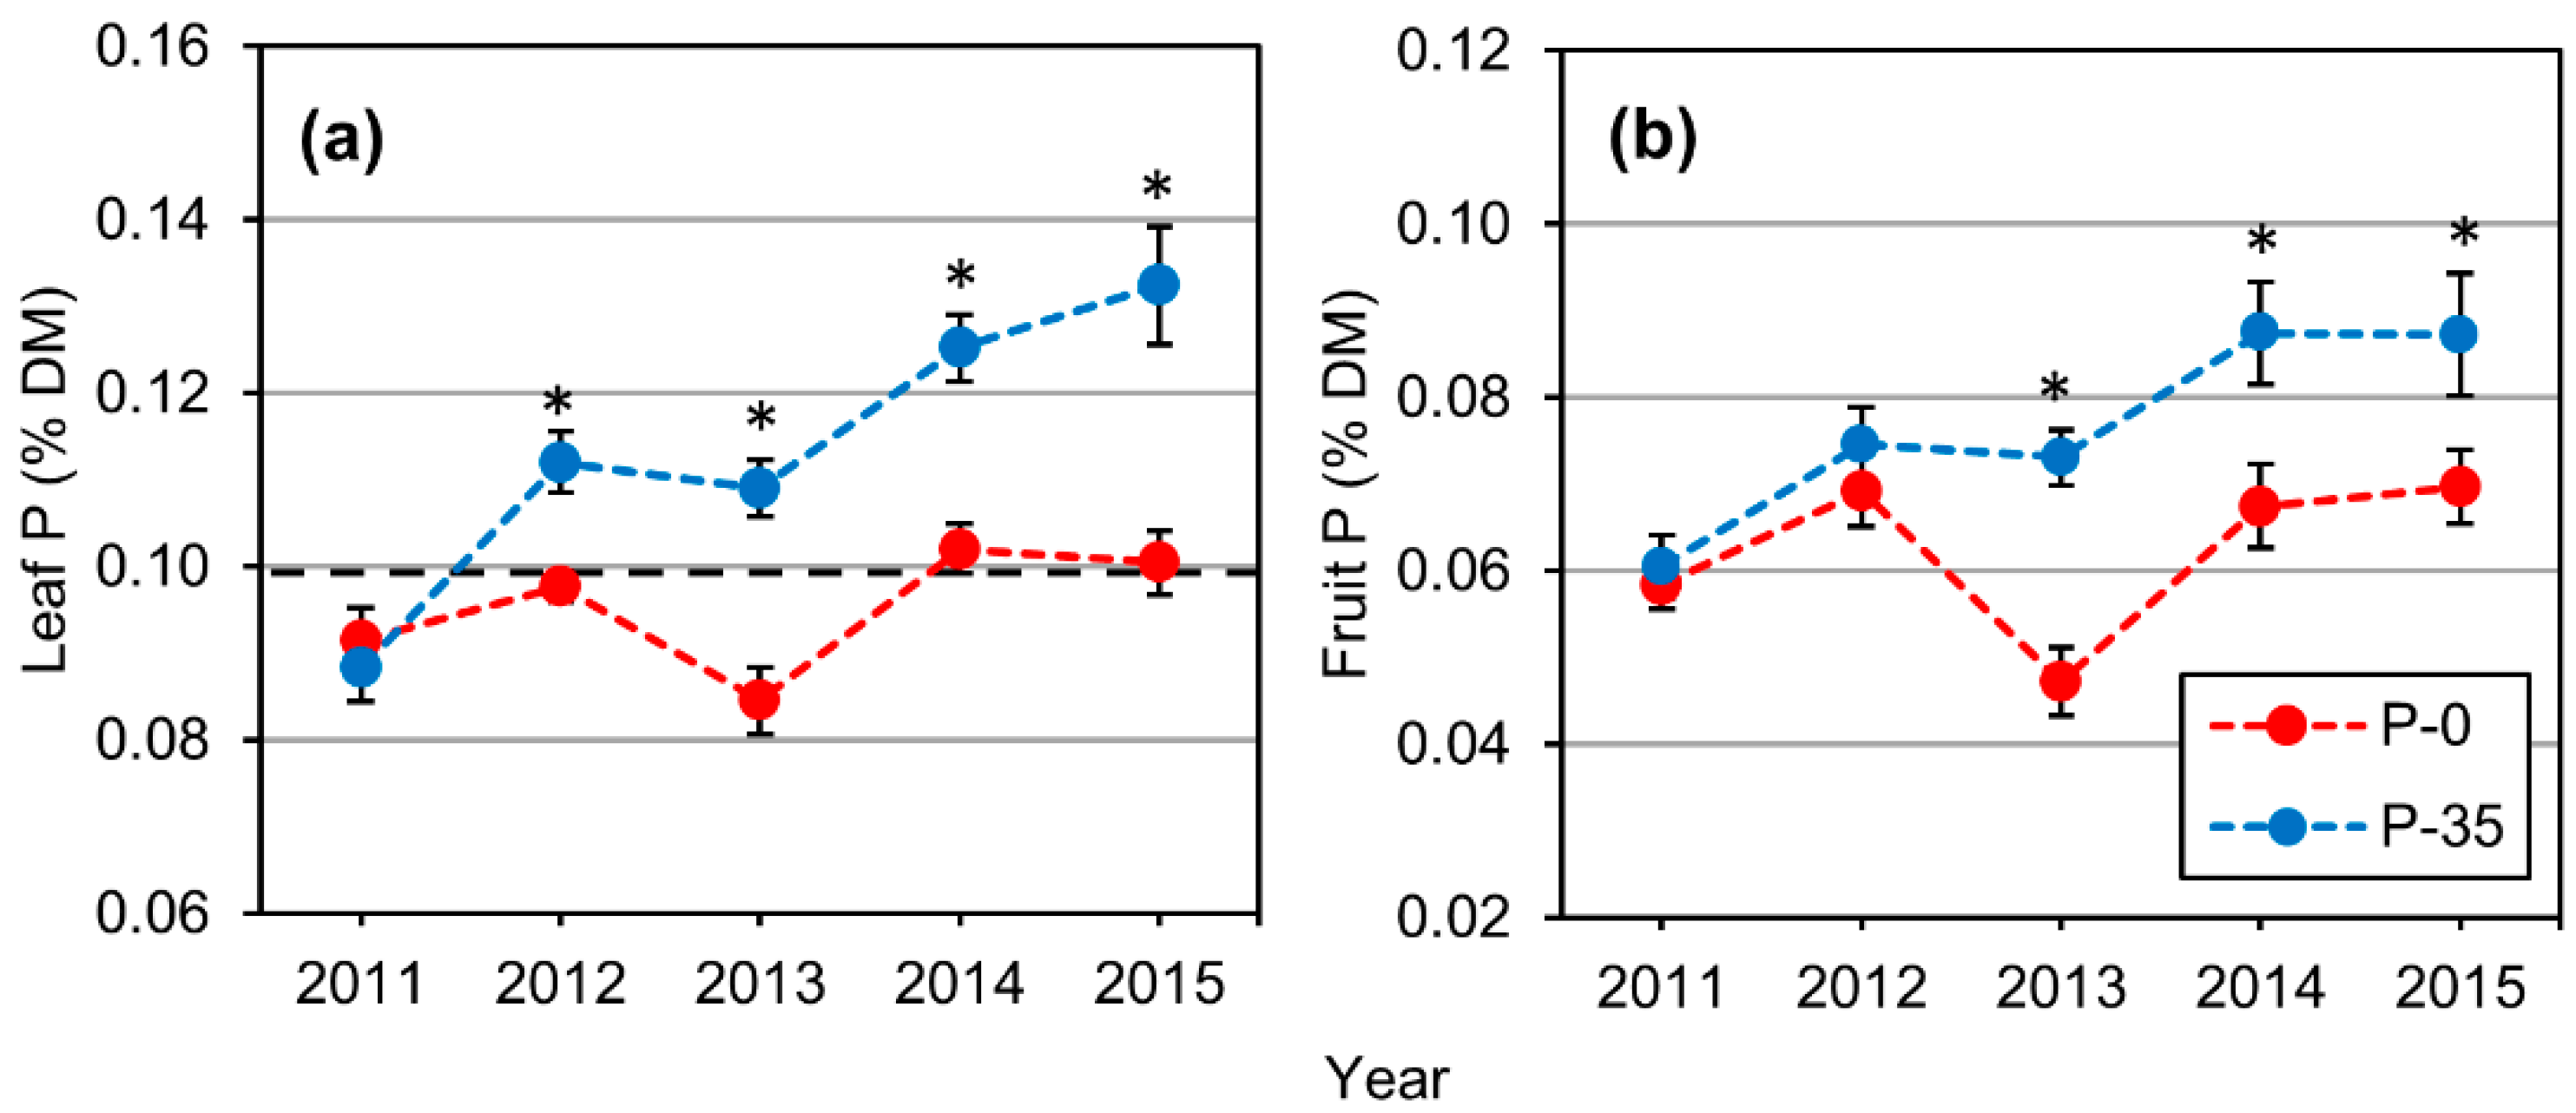
2.2. Leaf and Fruit Macronutrient Content
2.3. Vegetative Growth
2.4. Flowering and Fruit Set
2.5. Yields
2.6. Alternate Bearing
3. Discussion
3.1. Soil P Content
3.2. Leaf P Content and Thresholds
3.3. Vegetative and Reproductive Growth
3.4. Yields
3.5. Alternate Bearing
4. Materials and Methods
4.1. Experimental Site
4.2. Experimental Design
4.3. Measurements
4.3.1. Soil Analysis
4.3.2. Leaf and Fruit Macronutrient Content
4.3.3. Vegetative Growth
4.3.4. Flowering and Fruit Set
4.3.5. Yields
4.4. Data Analysis
5. Conclusions
Supplementary Materials
Author Contributions
Funding
Data Availability Statement
Acknowledgments
Conflicts of Interest
References
- Kirkby, E. Introduction, definition and classification of nutrients. In Marschner’s Mineral Nutrition of Higher Plants, 3rd ed.; Academic Press: London, UK, 2012; pp. 3–5. ISBN 9780123849052. [Google Scholar]
- Hawkesford, M.; Horst, W.; Kichey, T.; Lambers, H.; Schjoerring, J.; Møller, I.S.; White, P. Functions of macronutrients. In Marschner’s Mineral Nutrition of Higher Plants, 3rd ed.; Academic Press: London, UK, 2012; pp. 135–189. [Google Scholar]
- Shen, J.; Yuan, L.; Zhang, J.; Li, H.; Bai, Z.; Chen, X.; Zhang, W.; Zhang, F. Phosphorus dynamics: From soil to plant. Plant Physiol. 2011, 156, 997–1005. [Google Scholar] [CrossRef] [Green Version]
- Hinsinger, P. Bioavailability of soil inorganic P in the rhizosphere as affected by root-induced chemical changes: A review. Plant Soil 2001, 237, 173–195. [Google Scholar] [CrossRef]
- Stewart, J.W.B.; Tiessen, H. Dynamics of soil organic phosphorus. Biogeochemistry 1987, 4, 41–60. [Google Scholar] [CrossRef]
- Tarafdar, J.C.; Claassen, N. Organic phosphorus compounds as a phosphorus source for higher plants through the activity of phosphatases produced by plant roots and microorganisms. Biol. Fertil. Soils 1988, 5, 308–312. [Google Scholar] [CrossRef]
- Vance, C.P.; Uhde-Stone, C.; Allan, D.L. Phosphorus acquisition and use: Critical adaptations by plants for securing a nonrenewable resource. New Phytol. 2003, 157, 423–447. [Google Scholar] [CrossRef] [PubMed] [Green Version]
- MacDonald, G.K.; Bennett, E.M.; Potter, P.A.; Ramankutty, N. Agronomic phosphorus imbalances across the world’s croplands. Proc. Natl. Acad. Sci. USA 2011, 108, 3086–3091. [Google Scholar] [CrossRef] [PubMed] [Green Version]
- Wang, Y.; Zhang, Y. Soil-phosphorus distribution and availability as affected by greenhouse subsurface irrigation. J. Plant Nutr. Soil Sci. 2010, 173, 345–352. [Google Scholar] [CrossRef]
- Bar-Yosef, B. Advances in fertigation. Adv. Agron. 1999, 65, 1–77. [Google Scholar]
- Wang, Z.; Li, J.; Li, Y.; Hao, F. Effects of phosphorus fertigation on distribution of Olsen-P in soil and yield of maize. Paiguan Jixie Gongcheng Xuebao/J. Drain. Irrig. Mach. Eng. 2018, 36, 1023–1028. [Google Scholar]
- Sathya, S.; Pitchai, G.; Indirani, R.; Kannathasan, M. Effect of fertigation on availability of nutrients (N, P & K) in soil—A review. Agric. Rev. 2008, 29, 214–219. [Google Scholar]
- Ben-Gal, A.; Dudley, L.M. Phosphorus availability under continuous point source irrigation. Soil Sci. Soc. Am. J. 2003, 67, 1449–1456. [Google Scholar] [CrossRef]
- Assouline, S.; Möller, M.; Cohen, S.; Ben-Hur, M.; Grava, A.; Narkis, K.; Silber, A. Soil-Plant System Response to Pulsed Drip Irrigation and Salinity. Soil Sci. Soc. Am. J. 2006, 70, 1556–1568. [Google Scholar] [CrossRef]
- Silber, A.; Xu, G.; Levkovitch, I.; Soriano, S.; Bilu, A.; Wallach, R. High irrigation frequency: The effects on uptake of nutrients, water and plant growth. Plant Soil 2003, 253, 467–477. [Google Scholar] [CrossRef]
- Therios, I. Olives (Crop Production Science in Horticulture); CAB International: Oxfordshire, UK, 2009; ISBN 9781845934583. [Google Scholar]
- Erel, R.; Yermiyhu, Y.; Ben-Gal, A.; Dag, A. Olive fertilization under intensive cultivation management. In Proceedings of the VIII International Symposium on Mineral Nutrition of Fruit Crops, Bolzano, Italy, 27–30 June 2017; pp. 207–224. [Google Scholar]
- Fernández-Escobar, R. Fertilization. In Production Techniques in olive Growing; International Olive Council: Madrid, Spain, 2007; pp. 145–168. ISBN 9788493166366. [Google Scholar]
- Zipori, I.; Erel, R.; Yermiyahu, U.; Ben-gal, A.; Dag, A. Sustainable management of olive orchard nutrition: A review. Agriculture 2020, 10, 11. [Google Scholar] [CrossRef] [Green Version]
- Jiménez-Moreno, M.J.; Fernández-Escobar, R. Response of young olive plants (Olea europaea) to phosphorus application. HortScience 2016, 51, 1167–1170. [Google Scholar] [CrossRef]
- Estaún, V.; Camprubí, A.; Calvet, C.; Pinochet, J. Nursery and field response of olive trees inoculated with two arbuscular mycorrhizal fungi, Glomus intraradices and Glomus mosseae. J. Am. Soc. Hortic. Sci. 2003, 128, 767–775. [Google Scholar] [CrossRef] [Green Version]
- Dag, A.; Yermiyahu, U.; Ben-Gal, A.; Zipori, I.; Kapulnik, Y. Nursery and post-transplant field response of olive trees to arbuscular mycorrhizal fungi in an arid region. Crop Pasture Sci. 2009, 60, 427–433. [Google Scholar] [CrossRef]
- López-Villalta, L.C.; Muñoz-Cobo, M.P. Production techniques. In World Olive Encyclopedia; International Olive Oil Council: Madrid, Spain, 1996; pp. 145–190. [Google Scholar]
- Freeman, M.; Uriu, K.; Hartmann, H.T. Diagnosing and correcting nutrient problems. In Olive Production Manual; University of California: Oakland, CA, USA, 2005; Volume 2, pp. 83–100. [Google Scholar]
- Jiménez-Moreno, M.J.; Fernández-Escobar, R. Influence of nutritional status of phosphorus on flowering in the olive (Olea europaea L.). Sci. Hortic. 2017, 223, 1–4. [Google Scholar] [CrossRef]
- Ferreira, I.Q.; Rodrigues, M.Â.; Moutinho-Pereira, J.M.; Correia, C.M.; Arrobas, M. Olive tree response to applied phosphorus in field and pot experiments. Sci. Hortic. 2018, 234, 236–244. [Google Scholar] [CrossRef] [Green Version]
- Centeno, A.; Gómez Del Campo, M. Response of mature olive trees with adequate leaf nutrient status to additional nitrogen, phosphorus, and potassium fertilization. Acta Hortic. 2011, 888, 277–280. [Google Scholar] [CrossRef]
- Centeno, A.; García, J.M.; Gómez-del-campo, M. Vegetative, productive and oil quality responses of ‘Arbequina’ and ‘Picual’ olive trees to foliar P and K application. Grasas Y Aceites 2020, 71, 1–13. [Google Scholar] [CrossRef]
- European Commission Economic Analysis of the olive Sector. 2012. Available online: https://www.oliveoilmarket.eu/economic-analysis-of-the-olive-sector-european-commission/ (accessed on 23 July 2021).
- Vossen, P. Olive oil: History, production, and characteristics of the world’s classic oils. HortScience 2007, 42, 1093–1100. [Google Scholar] [CrossRef] [Green Version]
- Zipori, I.; Yermiyahu, U.; Erel, R.; Presnov, E.; Faingold, I.; Ben-Gal, A.; Dag, A. The influence of irrigation level on olive tree nutritional status. Irrig. Sci. 2015, 33, 277–287. [Google Scholar] [CrossRef]
- Erel, R.; Dag, A.; Ben-gal, A.; Schwartz, A.; Yermiyahu, U. Flowering and fruit set of olive trees in response to nitrogen, phosphorus, and potassium. J. Am. Soc. Hortic. Sci. 2008, 133, 639–647. [Google Scholar] [CrossRef]
- Erel, R.; Yermiyahu, U.; Van Opstal, J.; Ben-Gal, A.; Schwartz, A.; Dag, A. The importance of olive (Olea europaea L.) tree nutritional status on its productivity. Sci. Hortic. 2013, 159, 8–18. [Google Scholar] [CrossRef]
- Erel, R.; Yermiyahu, U.; Yasuor, H.; Chamus, D.C.; Schwartz, A.; Ben-Gal, A.; Dag, A. Phosphorous nutritional level, carbohydrate reserves and flower quality in olives. PLoS ONE 2016, 11, e0167591. [Google Scholar] [CrossRef] [Green Version]
- Chatzistathis, T.; Monokrousos, N.; Psoma, P.; Tziachris, P.; Metaxa, I.; Strikos, G.; Papadopoulos, F.H.; Papadopoulos, A.H. How fully productive olive trees (Olea europaea L., cv. ’Chondrolia Chalkidikis’) manage to over-satisfy their P nutritional needs under low Olsen P availability in soils? Sci. Hortic. 2020, 265, 109251. [Google Scholar] [CrossRef]
- Ben-Gal, A.; Yermiyahu, U.; Zipori, I.; Presnov, E.; Hanoch, E.; Dag, A. The influence of bearing cycles on olive oil quality response to irrigation. Irrig. Sci. 2011, 29, 253–263. [Google Scholar] [CrossRef]
- Haberman, A.; Dag, A.; Shtern, N.; Zipori, I.; Erel, R.; Ben-Gal, A.; Yermiyahu, U. Long-term Impact of potassium fertilization on soil and productivity in intensive olive cultivation. Agronomy 2019, 9, 525. [Google Scholar] [CrossRef] [Green Version]
- Haberman, A.; Dag, A.; Shtern, N.; Zipori, I.; Erel, R.; Ben-Gal, A.; Yermiyahu, U. Significance of proper nitrogen fertilization for olive productivity in intensive cultivation. Sci. Hortic. 2019, 246, 710–717. [Google Scholar] [CrossRef]
- Lavee, S. Biennial bearing in olive (Olea europaea). Ann. Ser His Nat. 2007, 17, 101–112. [Google Scholar]
- Olsen, S.R.; Cole, C.V.; Watanabe, F.S.; Dean, L.A. Estimation of Available Phosphorus in Soils by Extraction with Sodium Bicarbonate; US Department of Agriculture Circular: Washington, DC, USA, 1954.
- Recena, R.; Torrent, J.; del Campillo, M.C.; Delgado, A. Accuracy of Olsen P to assess plant P uptake in relation to soil properties and P forms. Agron. Sustain. Dev. 2015, 35, 1571–1579. [Google Scholar] [CrossRef]
- Delgado, A.; del Campillo, M.D.C.; Torrent, J. Limitations of the Olsen method to assess plant-available phosphorus in reclaimed marsh soils. Soil Use Manag. 2010, 26, 133–140. [Google Scholar] [CrossRef]
- Kulhánek, M.; Balík, J.; Černý, J.; Nedvěd, V.; Kotková, B. The influence of different intensities of phosphorus fertilizing on available phosphorus contents in soils and uptake by plants. Plant Soil Environ. 2007, 53, 382–387. [Google Scholar] [CrossRef] [Green Version]
- Duarte, F.; Jones, N.; Fleskens, L. Traditional olive orchards on sloping land: Sustainability or abandonment? J. Environ. Manag. 2008, 89, 86–98. [Google Scholar] [CrossRef]
- Romanyà, J.; Rovira, P. An appraisal of soil organic C content in Mediterranean agricultural soils. Soil Use Manag. 2011, 27, 321–332. [Google Scholar] [CrossRef]
- Lynch, J.P. Root phenes for enhanced soil exploration and phosphorus acquisition: Tools for future crops. Plant Physiol. 2011, 156, 1041–1049. [Google Scholar] [CrossRef] [PubMed] [Green Version]
- Lynch, J.P.; Ho, M.D. Rhizoeconomics: Carbon costs of phosphorus acquisition. Plant Soil 2005, 269, 45–56. [Google Scholar] [CrossRef]
- Stephenson, A.G.; Bertin, R.I. Male competition, female choice, and sexual selection in plants. Pollinat. Biol. 1983, 109, 149. [Google Scholar]
- Rosati, A.; Caporali, S.; Paoletti, A.; Famiani, F. Pistil abortion is related to ovary mass in olive (Olea europaea L.). Sci. Hortic. 2011, 127, 515–519. [Google Scholar] [CrossRef]
- Spalik, K. On evolution of andromonoecy and “overproduction” of flowers: A resource allocation model. Biol. J. Linn. Soc. 1991, 42, 325–336. [Google Scholar] [CrossRef]
- Uriu, K. Pistil abortion of the olive: Experiments with Mission olives indicate loss of leaves may be one cause of poor flower development. Calif. Agric. 1956, 10, 13–14. [Google Scholar]
- Reale, L.; Sgromo, C.; Ederli, L.; Pasqualini, S.; Orlandi, F.; Fornaciari, M.; Ferranti, F.; Romano, B. Morphological and cytological development and starch accumulation in hermaphrodite and staminate flowers of olive (Olea europaea L.). Sex. Plant Reprod. 2009, 22, 109–119. [Google Scholar] [CrossRef] [PubMed]
- Lazare, S.; Lyu, Y.; Yermiyahu, U.; Heler, Y.; Kalyan, G.; Dag, A. The effect of macronutrient availability on pomegranate reproductive development. Plants 2020, 9, 963. [Google Scholar] [CrossRef]
- Cuevas, J.; Polito, V.S. The role of staminate flowers in the breeding system of Olea europaea (Oleaceae): An andromonoecious, wind-pollinated taxon. Ann. Bot. 2004, 93, 547–553. [Google Scholar] [CrossRef] [Green Version]
- Erel, R.; Kerem, Z.; Ben-Gal, A.; Dag, A.; Schwartz, A.; Zipori, I.; Basheer, L.; Yermiyahu, U. Olive (Olea europaea L.) tree nitrogen status is a key factor for olive oil quality. J. Agric. Food Chem. 2013, 61, 11261–11272. [Google Scholar] [CrossRef] [PubMed]
- Malik, A.; Waheed, A.; Qadir, G.; Asghar, R. Interactive effects of irrigation and phosphorus on green gram (Vigna radiata L.). Pak. J. Bot. 2006, 38, 1119–1126. [Google Scholar]
- Zipori, I.; Dag, A.; Laor, Y.; Levy, G.J.; Eizenberg, H.; Yermiyahu, U.; Medina, S.; Saadi, I.; Krasnovski, A.; Raviv, M. Potential nutritional value of olive-mill wastewater applied to irrigated olive (Olea europaea L.) orchard in a semi-arid environment over 5 years. Sci. Hortic. 2018, 241, 218–224. [Google Scholar] [CrossRef]
- International Olive Council Market Newsletter No 139. 2019. Available online: https://www.internationaloliveoil.org/1410-newsletter-139/ (accessed on 23 July 2021).
- Haberman, A.; Bakhshian, O.; Cerezo-Medina, S.; Paltiel, J.; Adler, C.; Ben-Ari, G.; Mercado, J.A.; Pliego-Alfaro, F.; Lavee, S.; Samach, A. A possible role for flowering locus T-encoding genes in interpreting environmental and internal cues affecting olive (Olea europaea L.) flower induction. Plant. Cell Environ. 2017, 40, 1263–1280. [Google Scholar] [CrossRef]
- Dag, A.; Bustan, A.; Avni, A.; Zipori, I.; Lavee, S.; Riov, J. Timing of fruit removal affects concurrent vegetative growth and subsequent return bloom and yield in olive (Olea europaea L.). Sci. Hortic. 2010, 123, 469–472. [Google Scholar] [CrossRef]
- Bustan, A.; Avni, A.; Yermiyahu, U.; Ben-Gal, A.; Riov, J.; Erel, R.; Zipori, I.; Dag, A. Interactions between fruit load and macroelement concentrations in fertigated olive (Olea europaea L.) trees under arid saline conditions. Sci. Hortic. 2013, 152, 44–55. [Google Scholar] [CrossRef]
- Lavee, S.; Haskal, A.; Wodner, M. Barnea’ a new olive cultivar from first breeding generation. Olea 1986, 17, 95–99. [Google Scholar]
- Wiesman, Z.; Itzhak, D.; Ben Dom, N. Optimization of saline water level for sustainable Barnea olive and oil production in desert conditions. Sci. Hortic. 2004, 100, 257–266. [Google Scholar] [CrossRef]
- Tan, J.; Ben-Gal, A.; Shtein, I.; Bustan, A.; Dag, A.; Erel, R. Root structural plasticity enhances salt tolerance in mature olives. Environ. Exp. Bot. 2020, 179, 104224. [Google Scholar] [CrossRef]
- Allen, R.G.; Pereira, L.S.; Raes, D.; Smith, M. Crop evapotranspiration-Guidelines for computing crop water requirements-FAO Irrigation and drainage paper 56. Fao Rome 1998, 300, D05109. [Google Scholar]
- Erel, R.; Eppel, A.; Yermiyahu, U.; Ben-Gal, A.; Levy, G.; Zipori, I.; Schaumann, G.E.; Mayer, O.; Dag, A. Long-term irrigation with reclaimed wastewater: Implications on nutrient management, soil chemistry and olive (Olea europaea L.) performance. Agric. Water Manag. 2019, 213, 324–335. [Google Scholar] [CrossRef]
- Snell, F.D.; Snell, C.T. Colorimetric Methods of Analysis; LWW: Philadelphia, PA, USA, 1955; Volume 79, ISBN 0038-075X. [Google Scholar]
- Zipori, I.; Bustan, A.; Kerem, Z.; Dag, A. Olive paste oil content on a dry weight basis (OPDW): An indicator for optimal harvesting time in modern olive orchards. Grasas Y Aceites 2016, 67, 137. [Google Scholar]
- Monselise, S.P.; Goldschmidt, E.E. Alternate bearing in fruit trees. Hortic. Rev. (Am. Soc. Hortic. Sci.) 1982, 4, 128–173. [Google Scholar]


| P Fertilization | Trunk Circumference Increase | Pruning Weight | Flowering Intensity | Inflorescences Initiation a |
|---|---|---|---|---|
| 2011–2017 | 2012–2015 | 2014–2017 | 2014–2015 | |
| (kg ha−1 season−1) | (%) | (kg tree−1 season−1) | (index) | (%) |
| 0 | 69.5 ± 3.0 a | 31.1 ± 1.9 a | 3.05 ± 0.07 b | 36.3 ± 2.4 b |
| 35 b | 74.3 ± 2.8 a | 34.0 ± 2.5 a | 3.34 ± 0.11 a | 44.5 ± 3.2 a |
| P Fertilization | Flowers in an Inflorescence | Perfect Flowers | Pistil Weight | Fruit Set |
|---|---|---|---|---|
| (kg ha−1 season−1) | (No.) | (%) | (mg) | (%) |
| 0 | 16.1 ± 0.3 a | 46.9 ± 3.6 b | 0.72 ± 0.02 a | 4.5 ± 0.4 b |
| 35 a | 16.2 ± 0.5 a | 56.5 ± 3.3 a | 0.79 ± 0.04 a | 6.7 ± 0.6 a |
| P Fertilization | Single Fruit Weight | Oil Content | Fruit per Tree | Fruit Yield | Oil Yield |
|---|---|---|---|---|---|
| 2013–2016 | 2013–2016 | 2013–2016 | 2013–2016 | 2013–2016 | |
| (kg ha−1 season−1) | (g) | (%) | (No. tree−1 season−1) | (kg tree−1 season−1) | (kg tree−1 season−1) |
| 0 | 2.66 ± 0.11 a | 19.2 ± 0.5 a | 14,153 ± 825 b | 27.2 ± 1.1 b | 4.6 ± 0.2 b |
| 35 a | 2.42 ± 0.09 a | 19.6 ± 0.6 a | 19,813 ± 1141 a | 34.0 ± 1.6 a | 5.6 ± 0.4 a |
| P Fertilization | On-Year Fruit Yield a | Flowering Intensity Following an On-Year b | Alternate Bearing Intensity c |
|---|---|---|---|
| (kg ha−1 season−1) | (kg tree−1) | (index) | (index) |
| 0 | 44.3 ± 2.0 a | 1.6 ± 0.30 b | 0.78 ± 0.07 a |
| 35 | 41.8 ± 2.1 a | 3.0 ± 0.25 a | 0.59 ± 0.09 b |
Publisher’s Note: MDPI stays neutral with regard to jurisdictional claims in published maps and institutional affiliations. |
© 2021 by the authors. Licensee MDPI, Basel, Switzerland. This article is an open access article distributed under the terms and conditions of the Creative Commons Attribution (CC BY) license (https://creativecommons.org/licenses/by/4.0/).
Share and Cite
Haberman, A.; Dag, A.; Erel, R.; Zipori, I.; Shtern, N.; Ben-Gal, A.; Yermiyahu, U. Long-Term Impact of Phosphorous Fertilization on Yield and Alternate Bearing in Intensive Irrigated Olive Cultivation. Plants 2021, 10, 1821. https://doi.org/10.3390/plants10091821
Haberman A, Dag A, Erel R, Zipori I, Shtern N, Ben-Gal A, Yermiyahu U. Long-Term Impact of Phosphorous Fertilization on Yield and Alternate Bearing in Intensive Irrigated Olive Cultivation. Plants. 2021; 10(9):1821. https://doi.org/10.3390/plants10091821
Chicago/Turabian StyleHaberman, Amnon, Arnon Dag, Ran Erel, Isaac Zipori, Nerya Shtern, Alon Ben-Gal, and Uri Yermiyahu. 2021. "Long-Term Impact of Phosphorous Fertilization on Yield and Alternate Bearing in Intensive Irrigated Olive Cultivation" Plants 10, no. 9: 1821. https://doi.org/10.3390/plants10091821
APA StyleHaberman, A., Dag, A., Erel, R., Zipori, I., Shtern, N., Ben-Gal, A., & Yermiyahu, U. (2021). Long-Term Impact of Phosphorous Fertilization on Yield and Alternate Bearing in Intensive Irrigated Olive Cultivation. Plants, 10(9), 1821. https://doi.org/10.3390/plants10091821