
Patterns of Genetic Variation in a Soybean Germplasm Collection as Characterized with Genotyping-by-Sequencing

 ,
,  ,
,  ,
,
Abstract
:1. Introduction
2. Materials and Methods
2.1. Soybean Germplasm and DNA Extraction
2.2. Genotyping-by-Sequencing
2.3. Bioinformatics Analysis
2.4. Genetic Diversity Analysis
2.5. Identifying Distinct and Redundant Germplasm
3. Results
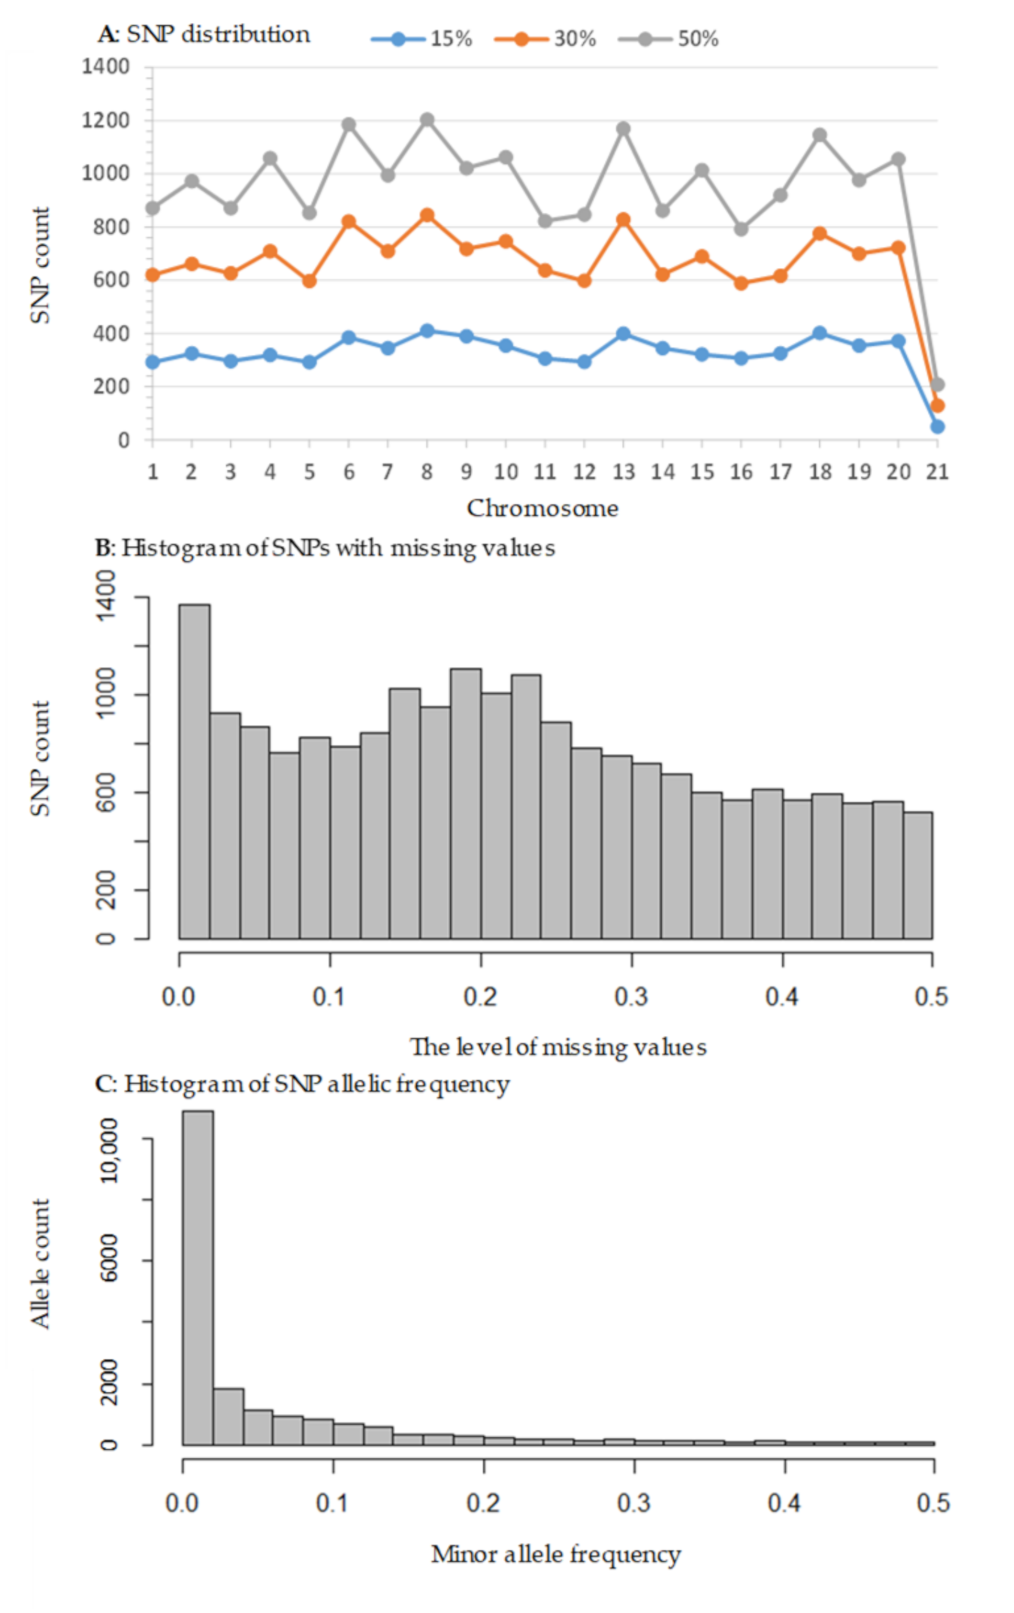
3.1. SNP Discovery
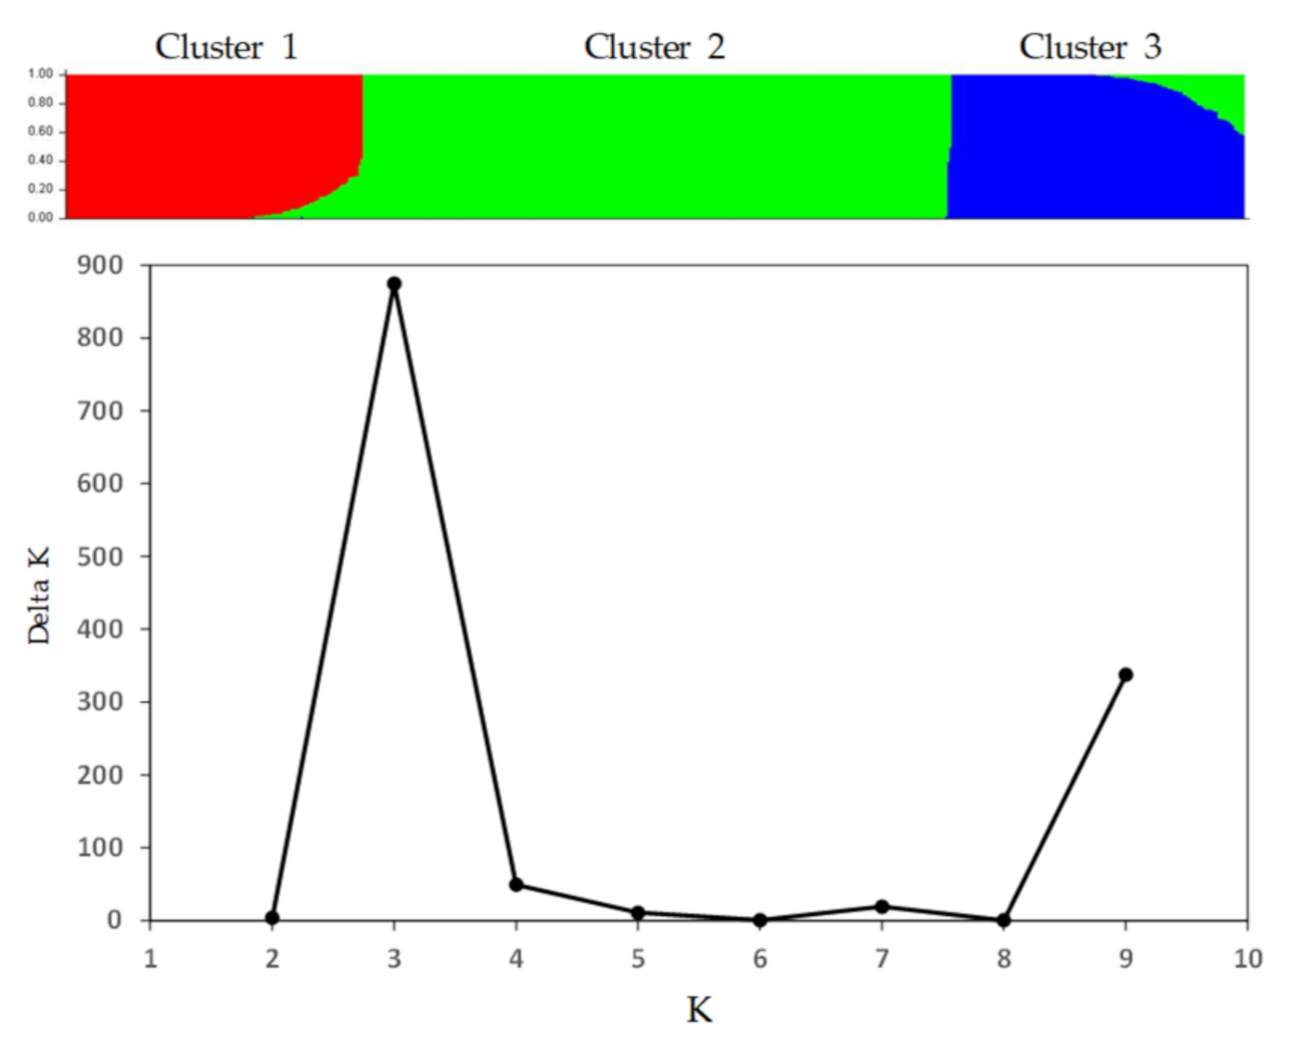
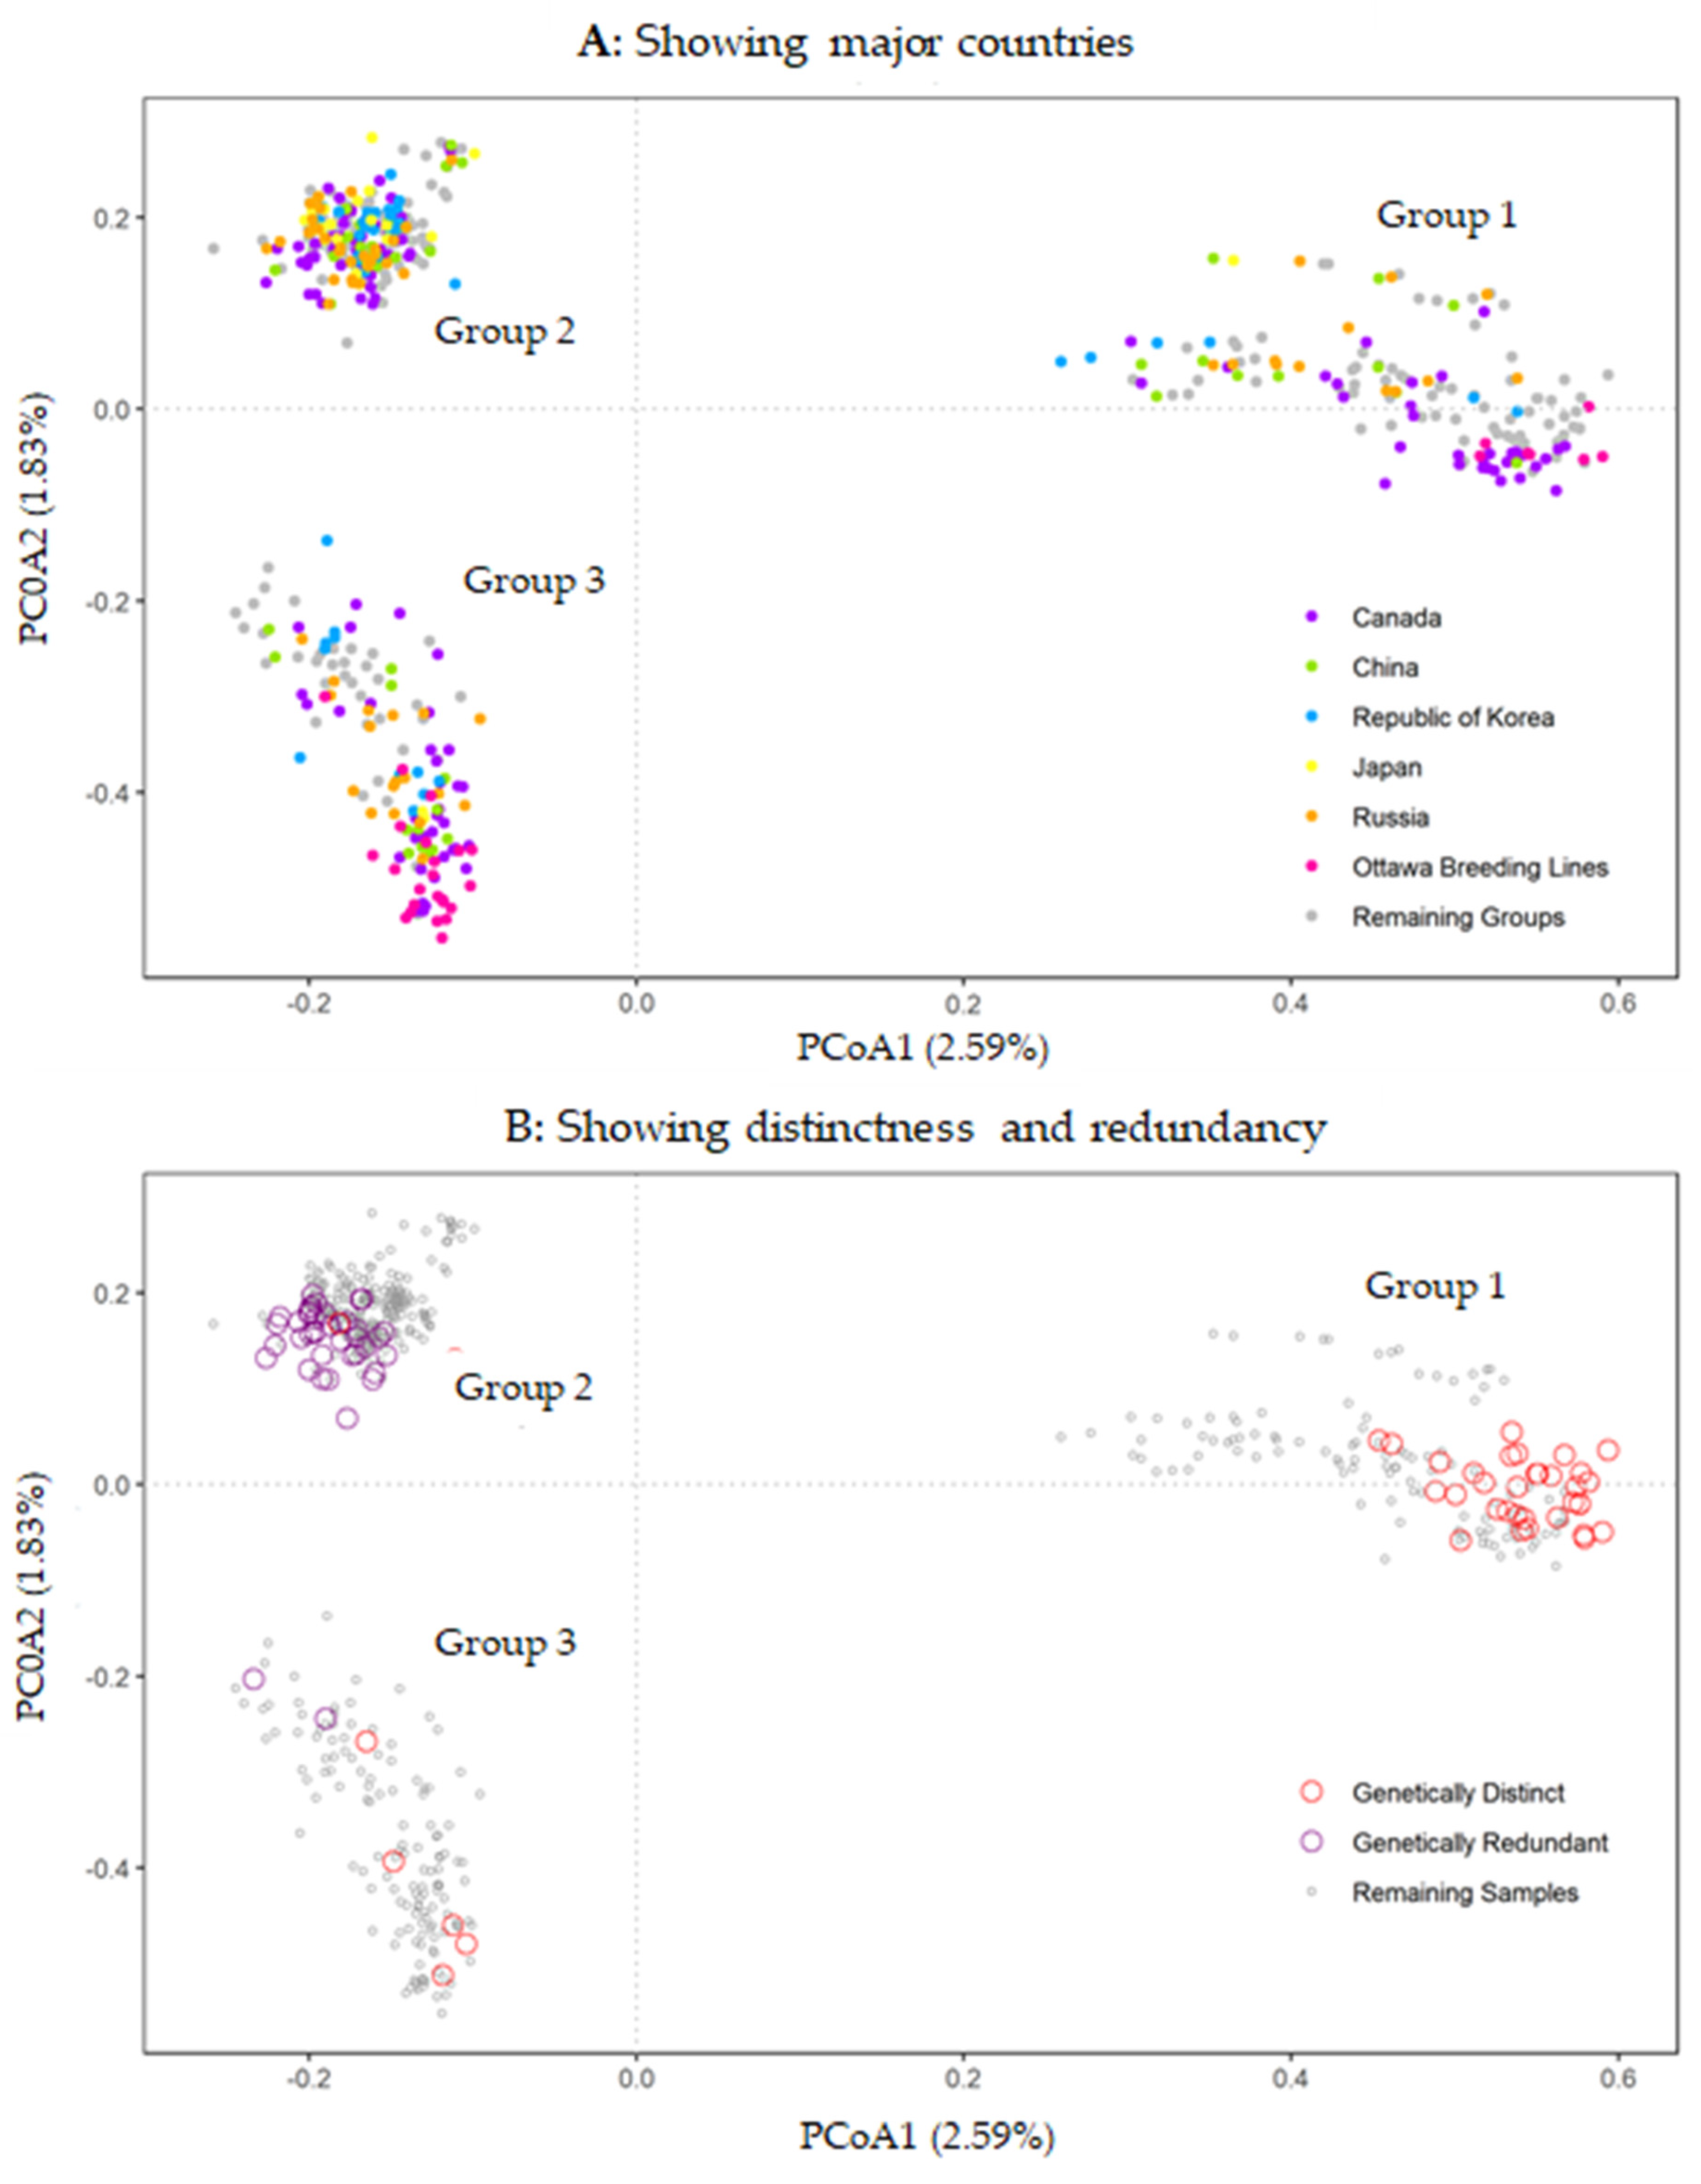
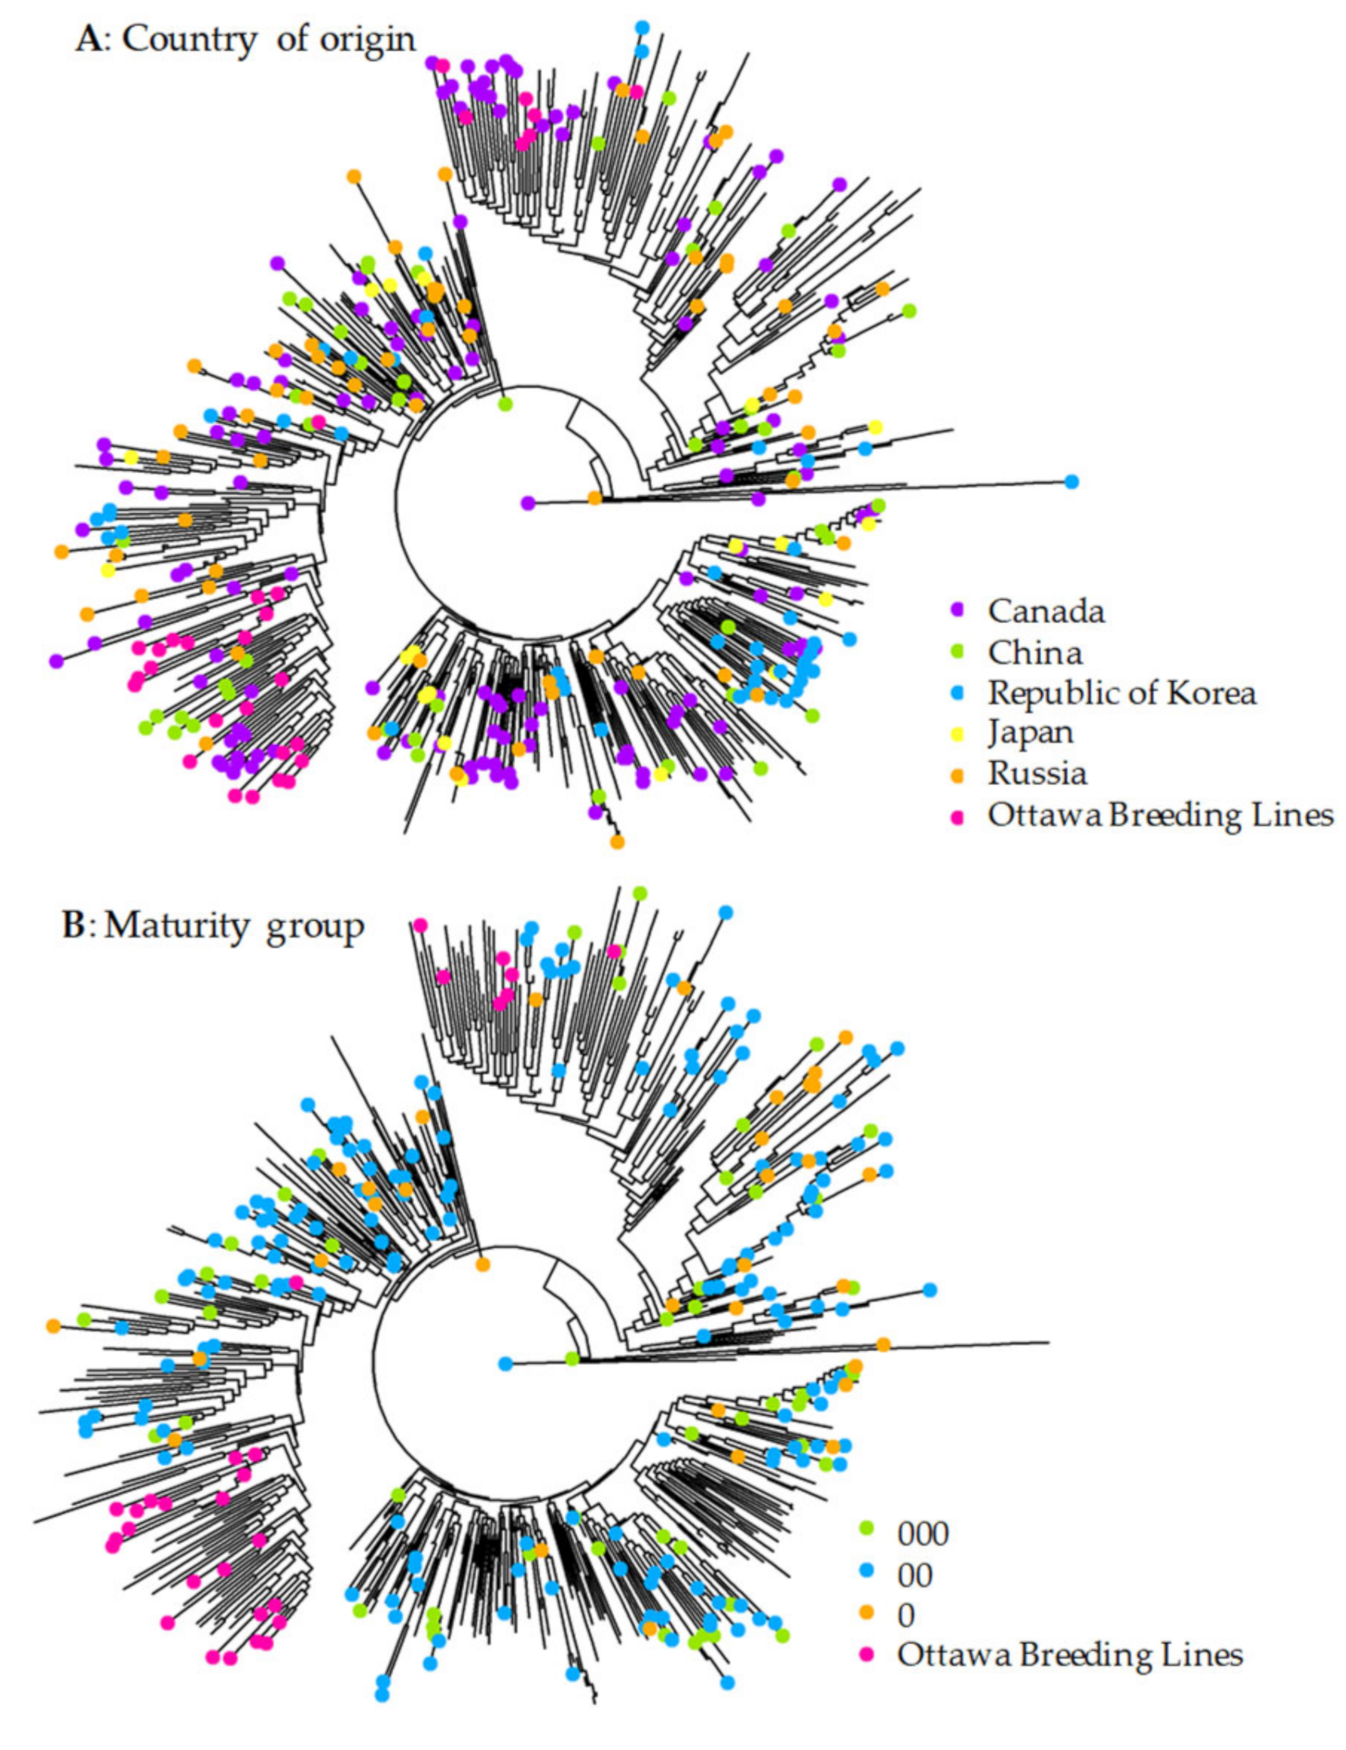
3.2. Patterns of Genetic Variability
3.3. Genetic Distinctness and Redundancy
4. Discussion
5. Conclusions
Supplementary Materials
Author Contributions
Funding
Institutional Review Board Statement
Informed Consent Statement
Data Availability Statement
Acknowledgments
Conflicts of Interest
References
- McCouch, S.R.; McNally, K.L.; Wang, W.; Sackville, H.R. Genomics of gene banks: A case study in rice. Am. J. Bot. 2012, 99, 407–423. [Google Scholar] [CrossRef] [Green Version]
- Li, J.Y.; Wang, J.; Zeigler, R.S. The 3000 rice genomes project: New opportunities and challenges for future rice research. GigaScience 2014, 3, 8. [Google Scholar] [CrossRef] [Green Version]
- Milner, S.G.; Jost, M.; Taketa, S.; Mazón, E.R.; Himmelbach, A.; Oppermann, M.; Weise, S.; Knüpffer, H.; Basterrechea, M.; König, P.; et al. Genebank genomics reveals the diversity of a global barley collection. Nat. Genet. 2019, 51, 319–326. [Google Scholar] [CrossRef] [Green Version]
- Sansaloni, C.; Franco, J.; Santos, B.; Percival-Alwyn, L.; Singh, S.; Petroli, C.; Campos, J.; Dreher, K.; Payne, T.; Marshall, D.; et al. Diversity analysis of 80,000 wheat accessions reveals consequences and opportunities of selection footprints. Nat. Commun. 2020, 11, 4572. [Google Scholar] [CrossRef]
- McCouch, S.; Navabi, Z.K.; Abberton, M.; Anglin, N.L.; Barbieri, R.L.; Baum, M.; Bett, K.; Booker, H.; Brown, G.L.; Bryan, G.J.; et al. Mobilizing crop biodiversity. Mol. Plant 2020, 13, 1341–1344. [Google Scholar] [CrossRef]
- Jeong, N.; Kim, K.-S.; Jeong, S.; Kim, J.-Y.; Park, S.-K.; Lee, J.S.; Jeong, S.-C.; Kang, S.-T.; Ha, B.-K.; Kim, D.-Y.; et al. Korean soybean core collection: Genotypic and phenotypic diversity population structure and genome-wide association study. PLoS ONE 2019, 14, e0224074. [Google Scholar] [CrossRef]
- Ellis, D.; Chavez, O.; Coombs, J.; Soto, J.; Gomez, R.; Douches, D.; Panta, A.; Silvestre, R.; Anglin, N.L. Genetic identity in genebanks: Application of the SolCAP 12K SNP array in fingerprinting and diversity analysis in the global in trust potato collection. Genome 2018, 61, 523–537. [Google Scholar] [CrossRef] [Green Version]
- Singh, N.; Wu, S.; Raupp, W.J.; Sehgal, S.; Arora, S.; Tiwari, V.; Vikram, P.; Singh, S.; Chhuneja, P.; Gill, B.S.; et al. Efficient curation of genebanks using next generation sequencing reveals substantial duplication of germplasm accessions. Sci. Rep. 2019, 9, 650. [Google Scholar] [CrossRef] [Green Version]
- Mascher, M.; Schreiber, M.; Scholz, U.; Graner, A.; Reif, J.C.; Stein, N. Genebank genomics bridges the gap between the conservation of crop diversity and plant breeding. Nat. Genet. 2019, 51, 1076–1081. [Google Scholar] [CrossRef]
- Song, Q.; Hyten, D.L.; Jia, G.; Quigley, C.V.; Fickus, E.W.; Nelson, R.L.; Cregan, P.B. Fingerprinting soybean germplasm and its utility in genomic research. G3 Bethesda 2015, 5, 1999–2006. [Google Scholar] [CrossRef] [Green Version]
- Wang, L.; Guan, Y.; Guan, R.; Li, Y.; Ma, Y.; Dong, Z.; Liu, X.; Zhang, H.; Zhang, Y.; Liu, Z.; et al. Establishment of Chinese soybean Glycine max core collections with agronomic traits and SSR markers. Euphytica 2006, 151, 215–223. [Google Scholar] [CrossRef]
- Cho, G.-T.; Yoon, M.-S.; Lee, J.-R.; Baek, H.-J.; Kang, J.-H.; Kim, T.-S.; Paek, N.-C. Development of a core set of Korean soybean landraces [Glycine max (L.) Merr.]. J. Crop. Sci. Biotechnol. 2008, 11, 157–162. [Google Scholar]
- Oliveira, M.F.; Nelson, R.L.; Geraldi, I.O.; Cruz, C.D.; de Toledo, J.F.F. Establishing a soybean germplasm core collection. Field Crops Res. 2010, 119, 227–289. [Google Scholar] [CrossRef]
- Kaga, A.; Shimizu, T.; Watanabe, S.; Tsubokura, Y.; Katayose, Y.; Harada, K.; Vaughan, D.A.; Tomooka, N. Evaluation of soybean germplasm conserved in NIAS Genebank and development of mini core collections. Breed. Sci. 2012, 61, 566–592. [Google Scholar] [CrossRef] [Green Version]
- Priolli, R.H.G.; Wysmierski, P.T.; da Cunha, C.P.; Pinheiro, J.B.; Vello, N.A. Genetic structure and a selected core set of Brazilian soybean cultivars. Genet. Mol. Biol. 2013, 36, 382–390. [Google Scholar] [CrossRef] [Green Version]
- Moellers, T.C.; Singh, A.; Zhang, J.; Brungardt, J.; Kabbage, M.; Mueller, D.S.; Grau, C.R.; Ranjan, A.; Smith, D.L.; Chowda-Reddy, R.V.; et al. Main and epistatic loci studies in soybean for Sclerotinia sclerotiorum resistance reveal multiple modes of resistance in multi-environments. Sci. Rep. 2017, 7, 3554. [Google Scholar] [CrossRef] [Green Version]
- FAO. The Second Report on the State of the World’s Plant. Genetic Resources for Food and Agriculture; FAO Commission on Genetic Resources for Food and Agriculture Assessments; FAO: Rome, Italy, 2010. [Google Scholar]
- Gouda, A.C.; Ndjiondjop, M.N.; Djedatin, G.L.; Warburton, M.L.; Goungoulou, A.; Kpeki, S.B.; N’Diaye, A.; Semagn, K. Comparisons of sampling methods for assessing intra- and inter-accession genetic diversity in three rice species using genotyping by sequencing. Sci. Rep. 2020, 10, 13995. [Google Scholar] [CrossRef]
- Bernard, R.L.; Cremeens, C.R.; Cooper, R.L.; Collins, F.I.; Krober, O.A.; Athow, K.L.; Laviolette, F.A.; Coble, C.J.; Nelson, R.L. Evaluation of the USDA Soybean Germplasm Collection: Maturity Groups 000-IV (PC 01.547-PI 266.807); Technical Bulletin No. 1844; U.S. Department of Agriculture: Washington, DC, USA, 1998; p. 178.
- Peterson, G.W.; Dong, Y.; Horbach, C.; Fu, Y.-B. Genotyping-by-sequencing for plant genetic diversity analysis: A lab guide for SNP genotyping. Diversity 2014, 6, 665–680. [Google Scholar] [CrossRef]
- Elshire, R.J.; Glaubitz, J.C.; Sun, Q.; Poland, J.A.; Kawamoto, K.; Buckler, E.S.; Mitchell, S.E. A robust, simple genotyping-by sequencing (GBS) approach for high diversity species. PLoS ONE 2011, 6, e19379. [Google Scholar] [CrossRef] [Green Version]
- Peterson, B.K.; Weber, J.N.; Kay, E.H.; Fisher, H.S.; Hoekstra, H.E. Double digest RADseq: An inexpensive method for de novo SNP discovery and genotyping in model and non-model species. PLoS ONE 2012, 7, e37135. [Google Scholar] [CrossRef] [Green Version]
- Andrews, S. FastQC: A Quality Control Tool for High Throughput Sequence Data. 2010. Available online: http://www.bioinformatics.babraham.ac.uk/projects/fastqc (accessed on 1 August 2021).
- Bolger, A.M.; Lohse, M.; Usadel, B. Trimmomatic: A flexible trimmer for Illumina sequence data. Bioinformatics 2014, 30, 2114–2120. [Google Scholar] [CrossRef] [Green Version]
- Schmutz, J.; Cannon, S.B.; Schlueter, J.; Ma, J.; Mitros, T.; Nelson, W.; Hyten, D.L.; Song, Q.; Thelen, J.J.; Cheng, J.; et al. Genome sequence of the palaeopolyploid soybean. Nature 2010, 463, 178–183, Erratum in 2010, 465, 120. [Google Scholar] [CrossRef] [Green Version]
- Song, Q.; Jenkins, J.; Jia, G.; Hyten, D.L.; Pantalone, V.; Jackson, S.A.; Schmutz, J.; Cregan, P.B. Construction of high resolution genetic linkage maps to improve the soybean genome sequence assembly Glyma1.01. BMC Genom. 2016, 17, 33. [Google Scholar] [CrossRef] [Green Version]
- Langmead, B.; Salzberg, S.L. Fast gapped-read alignment with Bowtie 2. Nat. Methods 2012, 9, 357–359. [Google Scholar] [CrossRef] [Green Version]
- Li, H.; Handsaker, B.; Wysoker, A.; Fennell, T.; Ruan, J.; Homer, N.; Marth, G.; Abecasis, G.; Durbin, R.; 1000 Genome Project Data Processing Subgroup. The Sequence Alignment/Map format and SAMtools. Bioinformatics 2009, 25, 2078–2079. [Google Scholar] [CrossRef] [Green Version]
- Pritchard, J.K.; Stephens, M.; Donnelly, P. Inference of population structure using multilocus genotype data. Genetics 2000, 155, 945–959. [Google Scholar] [CrossRef]
- Evanno, G.; Regnaut, S.; Goudet, J. Detecting the number of clusters of individuals using the software STRUCTURE: A simulation study. Mol. Ecol. 2005, 14, 2611–2620. [Google Scholar] [CrossRef] [Green Version]
- Yang, M.-H.; Fu, Y.-B. AveDissR: An R function for assessing genetic distinctness and genetic redundancy. Appl. Plant Sci. 2017, 5, 1700018. [Google Scholar] [CrossRef] [PubMed] [Green Version]
- R Development Core Team. R: A Language and Environment for Statistical Computing; R Foundation for Statistical Computing: Vienna, Austria, 1998; ISBN 3-900051-07-0. Available online: http://www.R-project.org (accessed on 1 August 2021).
- Swofford, D.L. PAUP *: Phylogenetic Analysis Using Parsimony (* and other Methods), Version 4; Sinauer Associates: Sunderland, MA, USA, 1998. [Google Scholar]
- Tamura, K.; Peterson, D.; Peterson, N.; Stecher, G.; Nei, M.; Kumar, S. MEGA5: Molecular Evolutionary Genetics Analysis Using Maximum Likelihood, Evolutionary Distance, and Maximum Parsimony Methods. Mol. Biol. Evol. 2011, 28, 2731–2739. [Google Scholar] [CrossRef] [PubMed] [Green Version]
- Excoffier, L.; Laval, G.; Schneider, S. Arlequin (Version 3.0): An integrated software package for population genetics data analysis. Evol. Bioinform. 2007, 1, 47–50. [Google Scholar] [CrossRef] [Green Version]
- Fu, Y.-B. Redundancy and distinctness in flax germplasm as revealed by RAPD dissimilarity. Plant Gen. Res. 2006, 4, 117–124. [Google Scholar] [CrossRef]
- Sokal, R.R.; Michener, C.D. A Statistical Method for Evaluating Systematic Relationships. University of Kansas Technical Bulletin; University of Kansas: Lawrence, KS, USA, 1958. [Google Scholar]
- Hymowitz, T.; Kaizuma, N. Soybean seed protein electrophoresis profiles from 15 Asian countries or regions: Hypotheses on paths of dissemination of soybeans from China. Econ. Bot. 1981, 35, 10–23. [Google Scholar] [CrossRef]
- Beversdorf, W.D.; Buzzell, R.I.; Ablett, G.R.; Voldeng, H.D. Soybean. In Harvest of Gold: The History of Field Crop Breeding in Canada; Slinkard, A.E., Knott, D.R., Eds.; University Extension Press, University of Saskatchewan: Saskatoon, SK, Canada, 1995; pp. 153–166. [Google Scholar]
- Voldeng, H.D.; Cober, E.R.; Hume, D.J.; Gillard, C.; Morrison, M.J. Fifty-eight years of genetic improvement of short-season soybean cultivars in Canada. Crop. Sci. 1997, 37, 428–431. [Google Scholar] [CrossRef]
- Bruce, R.W.; Torkamaneh, D.; Grainger, C.; Belzile, F.; Eskandari, M.; Rajcan, I. Genome-wide genetic diversity is maintained through decades of soybean breeding in Canada. Theor. Appl. Genet. 2019, 132, 3089–3100. [Google Scholar] [CrossRef]
- Mihelich, N.T.; Mulkey, S.E.; Stec, A.O.; Stupar, R.M. Characterization of genetic heterogeneity within accessions in the USDA soybean germplasm collection. Plant Genome 2020, 13, e20000. [Google Scholar] [CrossRef] [PubMed] [Green Version]
- Ahrent, D.K.; Caviness, C.E. Natural cross pollination of twelve soybean cultivars in Arkansas. Crop. Sci. 1994, 34, 376–378. [Google Scholar] [CrossRef]
- Ray, J.D.; Kilen, T.C.; Abel, C.A.; Paris, R.L. Soybean natural cross-pollination rates under field conditions. Environ. Biosaf. Res. 2003, 2, 133–138. [Google Scholar] [CrossRef] [PubMed]
- Fu, Y.-B. Genetic diversity analysis of highly incomplete SNP genotype data with imputations: An empirical assessment. G3 Bethesda 2014, 4, 891–900. [Google Scholar] [CrossRef] [PubMed] [Green Version]
- Diederichsen, A.; Kusters, P.M.; Kessler, D.; Bainas, Z.; Gugel, R.K. Assembling a core collection from the flax world collection maintained by Plant Gene Resources of Canada. Genet. Resour. Crop. Evol. 2013, 60, 1479–1485. [Google Scholar] [CrossRef]


| Total | PCoA-Group | Average Pairwise Dissimilarity | |||||
|---|---|---|---|---|---|---|---|
| Group | Label | Count | 1 | 2 | 3 | Highest 40 | Lowest 40 |
| Country of origin | |||||||
| Canada | 1 | 130 | 32 | 60 | 38 | 3 | 15 |
| Russian Federation | 2 | 61 | 13 | 30 | 18 | 2 | 6 |
| China | 3 | 46 | 11 | 22 | 13 | 0 | 3 |
| Sweden | 4 | 46 | 9 | 29 | 8 | 3 | 2 |
| Korea, Republic Of | 5 | 44 | 6 | 27 | 11 | 3 | 3 |
| Germany | 6 | 38 | 17 | 16 | 5 | 8 | 2 |
| France | 7 | 26 | 10 | 14 | 2 | 2 | 0 |
| Japan | 8 | 19 | 1 | 16 | 2 | 0 | 0 |
| Hungary | 9 | 16 | 6 | 10 | 0 | 1 | 0 |
| Poland | 10 | 23 | 3 | 14 | 6 | 1 | 4 |
| Unknown | 11 | 22 | 5 | 12 | 5 | 2 | 1 |
| Romania | 12 | 11 | 5 | 5 | 1 | 2 | 1 |
| Netherlands | 13 | 14 | 3 | 10 | 1 | 0 | 0 |
| Belgium | 14 | 9 | 3 | 2 | 4 | 1 | 0 |
| United States | 15 | 5 | 0 | 4 | 1 | 1 | 1 |
| Switzerland | 16 | 4 | 1 | 3 | 0 | 1 | 1 |
| Ukraine | 17 | 4 | 0 | 3 | 1 | 0 | 0 |
| United Kingdom | 18 | 4 | 1 | 1 | 2 | 0 | 0 |
| Yugoslavia | 19 | 4 | 1 | 1 | 2 | 0 | 0 |
| Austria | 20 | 3 | 2 | 1 | 0 | 2 | 1 |
| Bulgaria | 21 | 3 | 2 | 1 | 0 | 1 | 0 |
| Italy | 22 | 2 | 2 | 0 | 0 | 1 | 0 |
| Czech Republic | 23 | 1 | 0 | 1 | 0 | 0 | 0 |
| Serbia | 23 | 1 | 1 | 0 | 0 | 1 | 0 |
| Lithuania | 23 | 1 | 1 | 0 | 0 | 0 | 0 |
| Moldova | 23 | 1 | 0 | 1 | 0 | 0 | 0 |
| Norway | 23 | 1 | 0 | 1 | 0 | 0 | 0 |
| Portugal | 23 | 1 | 1 | 0 | 0 | 0 | 0 |
| Slovakia | 23 | 1 | 1 | 0 | 0 | 0 | 0 |
| Ottawa Breeding Lines | 24 | 30 | 7 | 0 | 23 | 5 | 0 |
| Total | 24 | 571 | 144 | 284 | 143 | 40 | 40 |
| Maturity group | |||||||
| 000 | 1 | 51 | 13 | 25 | 13 | 4 | 2 |
| 00 | 2 | 159 | 46 | 77 | 36 | 7 | 14 |
| 0 | 3 | 33 | 14 | 15 | 4 | 3 | 4 |
| Ottawa Breeding Lines | 4 | 30 | 7 | 0 | 23 | 5 | 0 |
| Unknown | 5 | 298 | 64 | 167 | 67 | 21 | 20 |
| Model/Source | df | Sum of Squares | Variance Component | Percent of Variation | p-Value |
|---|---|---|---|---|---|
| Country and region | |||||
| Among countries | 23 | 75539.69 | 57.42 | 7.45 | <0.00001 |
| Within countries | 1118 | 797242.03 | 713.1 | 92.55 | |
| Maturity group | |||||
| Among groups | 4 | 34431.26 | 43.34 | 5.55 | <0.00001 |
| Within groups | 1137 | 838350.46 | 737.34 | 94.45 | |
| Three groups inferred by PCoA | |||||
| Among groups | 2 | 217898.37 | 303.04 | 34.52 | <0.00001 |
| Within groups | 1139 | 654883.36 | 574.96 | 65.48 |
| Genetic Distinctness | Origin | CG | MG | PG | APD | Genetic Redundancy | Origin | CG | MG | PG | APD | ||
|---|---|---|---|---|---|---|---|---|---|---|---|---|---|
| Sample | Description | Sample | Description | ||||||||||
| CN32352 | No. 854 | KOR | 5 | 5 | 2 | 0.2522 | CN52636 | CH20731 | UNK | 11 | 5 | 2 | 0.0986 |
| CN107502 | B 10 | DEU | 6 | 3 | 3 | 0.1960 | CN115251 | SWE | 4 | 5 | 2 | 0.0997 | |
| CN107476 | J-40 | HUN | 9 | 2 | 1 | 0.1786 | CN33265 | OX719 | CAN | 1 | 5 | 2 | 0.0998 |
| CN107514 | N 19 | FRA | 7 | 2 | 1 | 0.1775 | CN107577 | Shika No. 4 | CAN | 1 | 2 | 2 | 0.0998 |
| CN107495 | Strain No. 196 | DEU | 6 | 2 | 1 | 0.1767 | CN107575 | Honshu No. 4 | CHN | 3 | 3 | 2 | 0.0999 |
| CN107498 | Strain No. 142 | DEU | 6 | 1 | 1 | 0.1750 | CN115253 | USA | 15 | 5 | 2 | 0.1002 | |
| CN29751 | Jin Nung No. 5 | ROM | 12 | 5 | 1 | 0.1716 | CN36334 | Rekord Severnyj | RUS | 2 | 5 | 2 | 0.1008 |
| CN35339 | KAS351-4 | KOR | 5 | 5 | 1 | 0.1710 | CN115258 | POL | 10 | 5 | 2 | 0.1017 | |
| CN45107 | WIR 5683 | USA | 15 | 5 | 2 | 0.1706 | CN107579 | (F59-244) | CAN | 1 | 2 | 2 | 0.1024 |
| CN39084 | X698-5-1 | CAN | 1 | 5 | 3 | 0.1699 | CN33911 | Hei Nung No. 26 | KOR | 5 | 5 | 2 | 0.1025 |
| CN107522 | 738-3 | SWE | 4 | 2 | 1 | 0.1694 | CN107571 | Mandurska 2 | CAN | 1 | 3 | 2 | 0.1032 |
| CN52877 | No. 536 | UNK | 11 | 5 | 1 | 0.1693 | CN33253 | Morsoy | CHE | 16 | 5 | 2 | 0.1034 |
| CN107496 | Strain No. 184 | DEU | 6 | 2 | 1 | 0.1685 | CN107555 | Amurszkaja 41 | RUS | 2 | 3 | 2 | 0.1035 |
| CN32766 | No. 601 | DEU | 6 | 5 | 1 | 0.1680 | CN107566 | Record North | CAN | 1 | 2 | 2 | 0.1040 |
| CN107497 | Strain No. 134 | DEU | 6 | 1 | 1 | 0.1672 | CN107581 | (Iregy soja) | CAN | 1 | 2 | 2 | 0.1042 |
| CN39075 | X691-3-1 | UNK | 11 | 5 | 1 | 0.1664 | CN35918 | Saliut 216 | RUS | 2 | 5 | 2 | 0.1045 |
| CN32662 | No. 547 | AUT | 20 | 5 | 1 | 0.1660 | CN107588 | PI 358321c | CAN | 1 | 2 | 2 | 0.1046 |
| CN107839 | Szaljut | CHE | 16 | 3 | 1 | 0.1658 | CN107855 | 754-5 | AUT | 20 | 2 | 2 | 0.1047 |
| CN32416 | No. 1038 | AUT | 20 | 5 | 1 | 0.1655 | CN107813 | 698-3-5 | SWE | 4 | 2 | 2 | 0.1047 |
| CN35364 | KAS629-1 | KOR | 5 | 5 | 1 | 0.1638 | CN33248 | Harosoy 63 | CAN | 1 | 5 | 2 | 0.1047 |
| CN107662 | Ainushyi 262 | RUS | 2 | 5 | 3 | 0.1619 | CN107538 | 766-2 | POL | 10 | 2 | 3 | 0.1049 |
| CN30642 | ISZ 10 | DEU | 6 | 5 | 1 | 0.1612 | CN107425 | Accord | CAN | 1 | 5 | 2 | 0.1052 |
| CN32320 | No. 940 | ITA | 22 | 5 | 1 | 0.1608 | CN33255 | Vansoy | CAN | 1 | 5 | 2 | 0.1054 |
| QGC10N | QGC10N | OBL | 24 | 4 | 3 | 0.1605 | CN107572 | Urozsajnaja | CAN | 1 | 3 | 2 | 0.1054 |
| CN107518 | Halton | FRA | 7 | 2 | 1 | 0.1603 | CN107614 | Hercumft | DEU | 6 | 1 | 2 | 0.1054 |
| Canatto | Canatto | OBL | 24 | 4 | 1 | 0.1600 | CN45090 | 150 | ROM | 12 | 5 | 2 | 0.1056 |
| CN35313 | KAS134-2 | SRB | 23 | 5 | 1 | 0.1598 | CN36218 | Hei 3-18 | CHN | 3 | 5 | 2 | 0.1061 |
| CN39077 | X691-12-1 | CAN | 1 | 5 | 3 | 0.1597 | CN107585 | PI 358320 | CAN | 1 | 2 | 2 | 0.1062 |
| AACUmami | AAC Umami | OBL | 24 | 4 | 1 | 0.1591 | CN107580 | Iregy soja | CAN | 1 | 2 | 2 | 0.1062 |
| CN107523 | 738-4 | SWE | 4 | 1 | 1 | 0.1590 | CN107421 | RCAT Bobcat | CAN | 1 | 5 | 2 | 0.1063 |
| CN107838 | Pannonia 10 | BEL | 14 | 3 | 1 | 0.1588 | CN29792 | Feng Shou No. 12 | RUS | 2 | 5 | 2 | 0.1064 |
| CN107527 | 748-7 | SWE | 4 | 1 | 1 | 0.1588 | CN33273 | Beechwood | KOR | 5 | 5 | 2 | 0.1065 |
| Nattosan | Nattosan | OBL | 24 | 4 | 1 | 0.1585 | CN39173 | X879-17-B | POL | 10 | 5 | 2 | 0.1065 |
| CN32394 | PGR 3866 | POL | 10 | 5 | 1 | 0.1585 | CN107422 | Mario | CAN | 1 | 5 | 2 | 0.1067 |
| CN35327 | KAS202-1 | RUS | 2 | 5 | 1 | 0.1584 | CN107546 | 38777 | RUS | 2 | 2 | 2 | 0.1067 |
| CN107360 | Sara | CAN | 1 | 5 | 1 | 0.1583 | CN107624 | Zarja | KOR | 5 | 2 | 3 | 0.1069 |
| CN29789 | Hei Nung No. 18 | BGR | 21 | 5 | 1 | 0.1578 | CN35314 | KAS134-5 | CHN | 3 | 5 | 2 | 0.1073 |
| AACSpringfield | AAC Springfield | OBL | 24 | 4 | 1 | 0.1573 | CN107882 | Starachramiskaya | RUS | 2 | 2 | 2 | 0.1073 |
| CN30316 | Early Harvest No. 1 | ROM | 12 | 5 | 1 | 0.1568 | CN107644 | Zolta z Zolna | POL | 10 | 2 | 2 | 0.1075 |
| CN107494 | Strain No. 28 | DEU | 6 | 2 | 1 | 0.1565 | CN107550 | Soja-C.-St. 12/58 | DEU | 6 | 1 | 2 | 0.1075 |
| Sample Pair | Pairwise Dissimilarity | Equivalent to Different Loci | Number of Samples | Number of GD Samples | |
|---|---|---|---|---|---|
| Sample 1 | Sample 2 | ||||
| A group of five sample pairs | 4 | 3 | |||
| CN32257 | CN31690 | 0.00130 | 26 | ||
| CN32257 | CN31719 | 0.00130 | 26 | ||
| CN32257 | CN32634 | 0.00152 | 30 | ||
| CN31690 | CN32634 | 0.00097 | 19 | ||
| CN31690 | CN31719 | 0.00149 | 30 | ||
| A group of four sample pairs | 4 | 3 | |||
| CN107815 | CN107819 | 0.00119 | 24 | ||
| CN107815 | CN31984 | 0.00187 | 37 | ||
| CN107815 | CN107461 | 0.00133 | 26 | ||
| CN107819 | CN31984 | 0.00157 | 31 | ||
| Individual sample pair | |||||
| CN35309 | CN35329 | 0.00096 | 19 | 2 | 1 |
| CN32829 | CN32451 | 0.00143 | 29 | 2 | 1 |
| CN32053 | CN32631 | 0.00112 | 22 | 2 | 1 |
| CN107826 | CN31692 | 0.00169 | 34 | 2 | 1 |
| CN107580 | CN107581 | 0.00085 | 17 | 2 | 1 |
| CN107562 | CN107631 | 0.00166 | 33 | 2 | 1 |
| CN107558 | CN107855 | 0.00152 | 30 | 2 | 1 |
| Total | 22 | 13 | |||
Publisher’s Note: MDPI stays neutral with regard to jurisdictional claims in published maps and institutional affiliations. |
© 2021 by the authors. Licensee MDPI, Basel, Switzerland. This article is an open access article distributed under the terms and conditions of the Creative Commons Attribution (CC BY) license (https://creativecommons.org/licenses/by/4.0/).
Share and Cite
Fu, Y.-B.; Cober, E.R.; Morrison, M.J.; Marsolais, F.; Peterson, G.W.; Horbach, C. Patterns of Genetic Variation in a Soybean Germplasm Collection as Characterized with Genotyping-by-Sequencing. Plants 2021, 10, 1611. https://doi.org/10.3390/plants10081611
Fu Y-B, Cober ER, Morrison MJ, Marsolais F, Peterson GW, Horbach C. Patterns of Genetic Variation in a Soybean Germplasm Collection as Characterized with Genotyping-by-Sequencing. Plants. 2021; 10(8):1611. https://doi.org/10.3390/plants10081611
Chicago/Turabian StyleFu, Yong-Bi, Elroy R. Cober, Malcolm J. Morrison, Frédéric Marsolais, Gregory W. Peterson, and Carolee Horbach. 2021. "Patterns of Genetic Variation in a Soybean Germplasm Collection as Characterized with Genotyping-by-Sequencing" Plants 10, no. 8: 1611. https://doi.org/10.3390/plants10081611
APA StyleFu, Y.-B., Cober, E. R., Morrison, M. J., Marsolais, F., Peterson, G. W., & Horbach, C. (2021). Patterns of Genetic Variation in a Soybean Germplasm Collection as Characterized with Genotyping-by-Sequencing. Plants, 10(8), 1611. https://doi.org/10.3390/plants10081611