
Anthocyanins from Rubus fruticosus L. and Morus nigra L. Applied as Food Colorants: A Natural Alternative


 ,
,  ,
,  ,
,  ,
,  ,
,  , ,
, ,  ,
,  ,
,  and
and 
Abstract
1. Introduction
2. Results and Discussion
2.1. Chemical Composition
2.1.1. Free Sugars
2.1.2. Organic Acids
2.1.3. Tocopherols
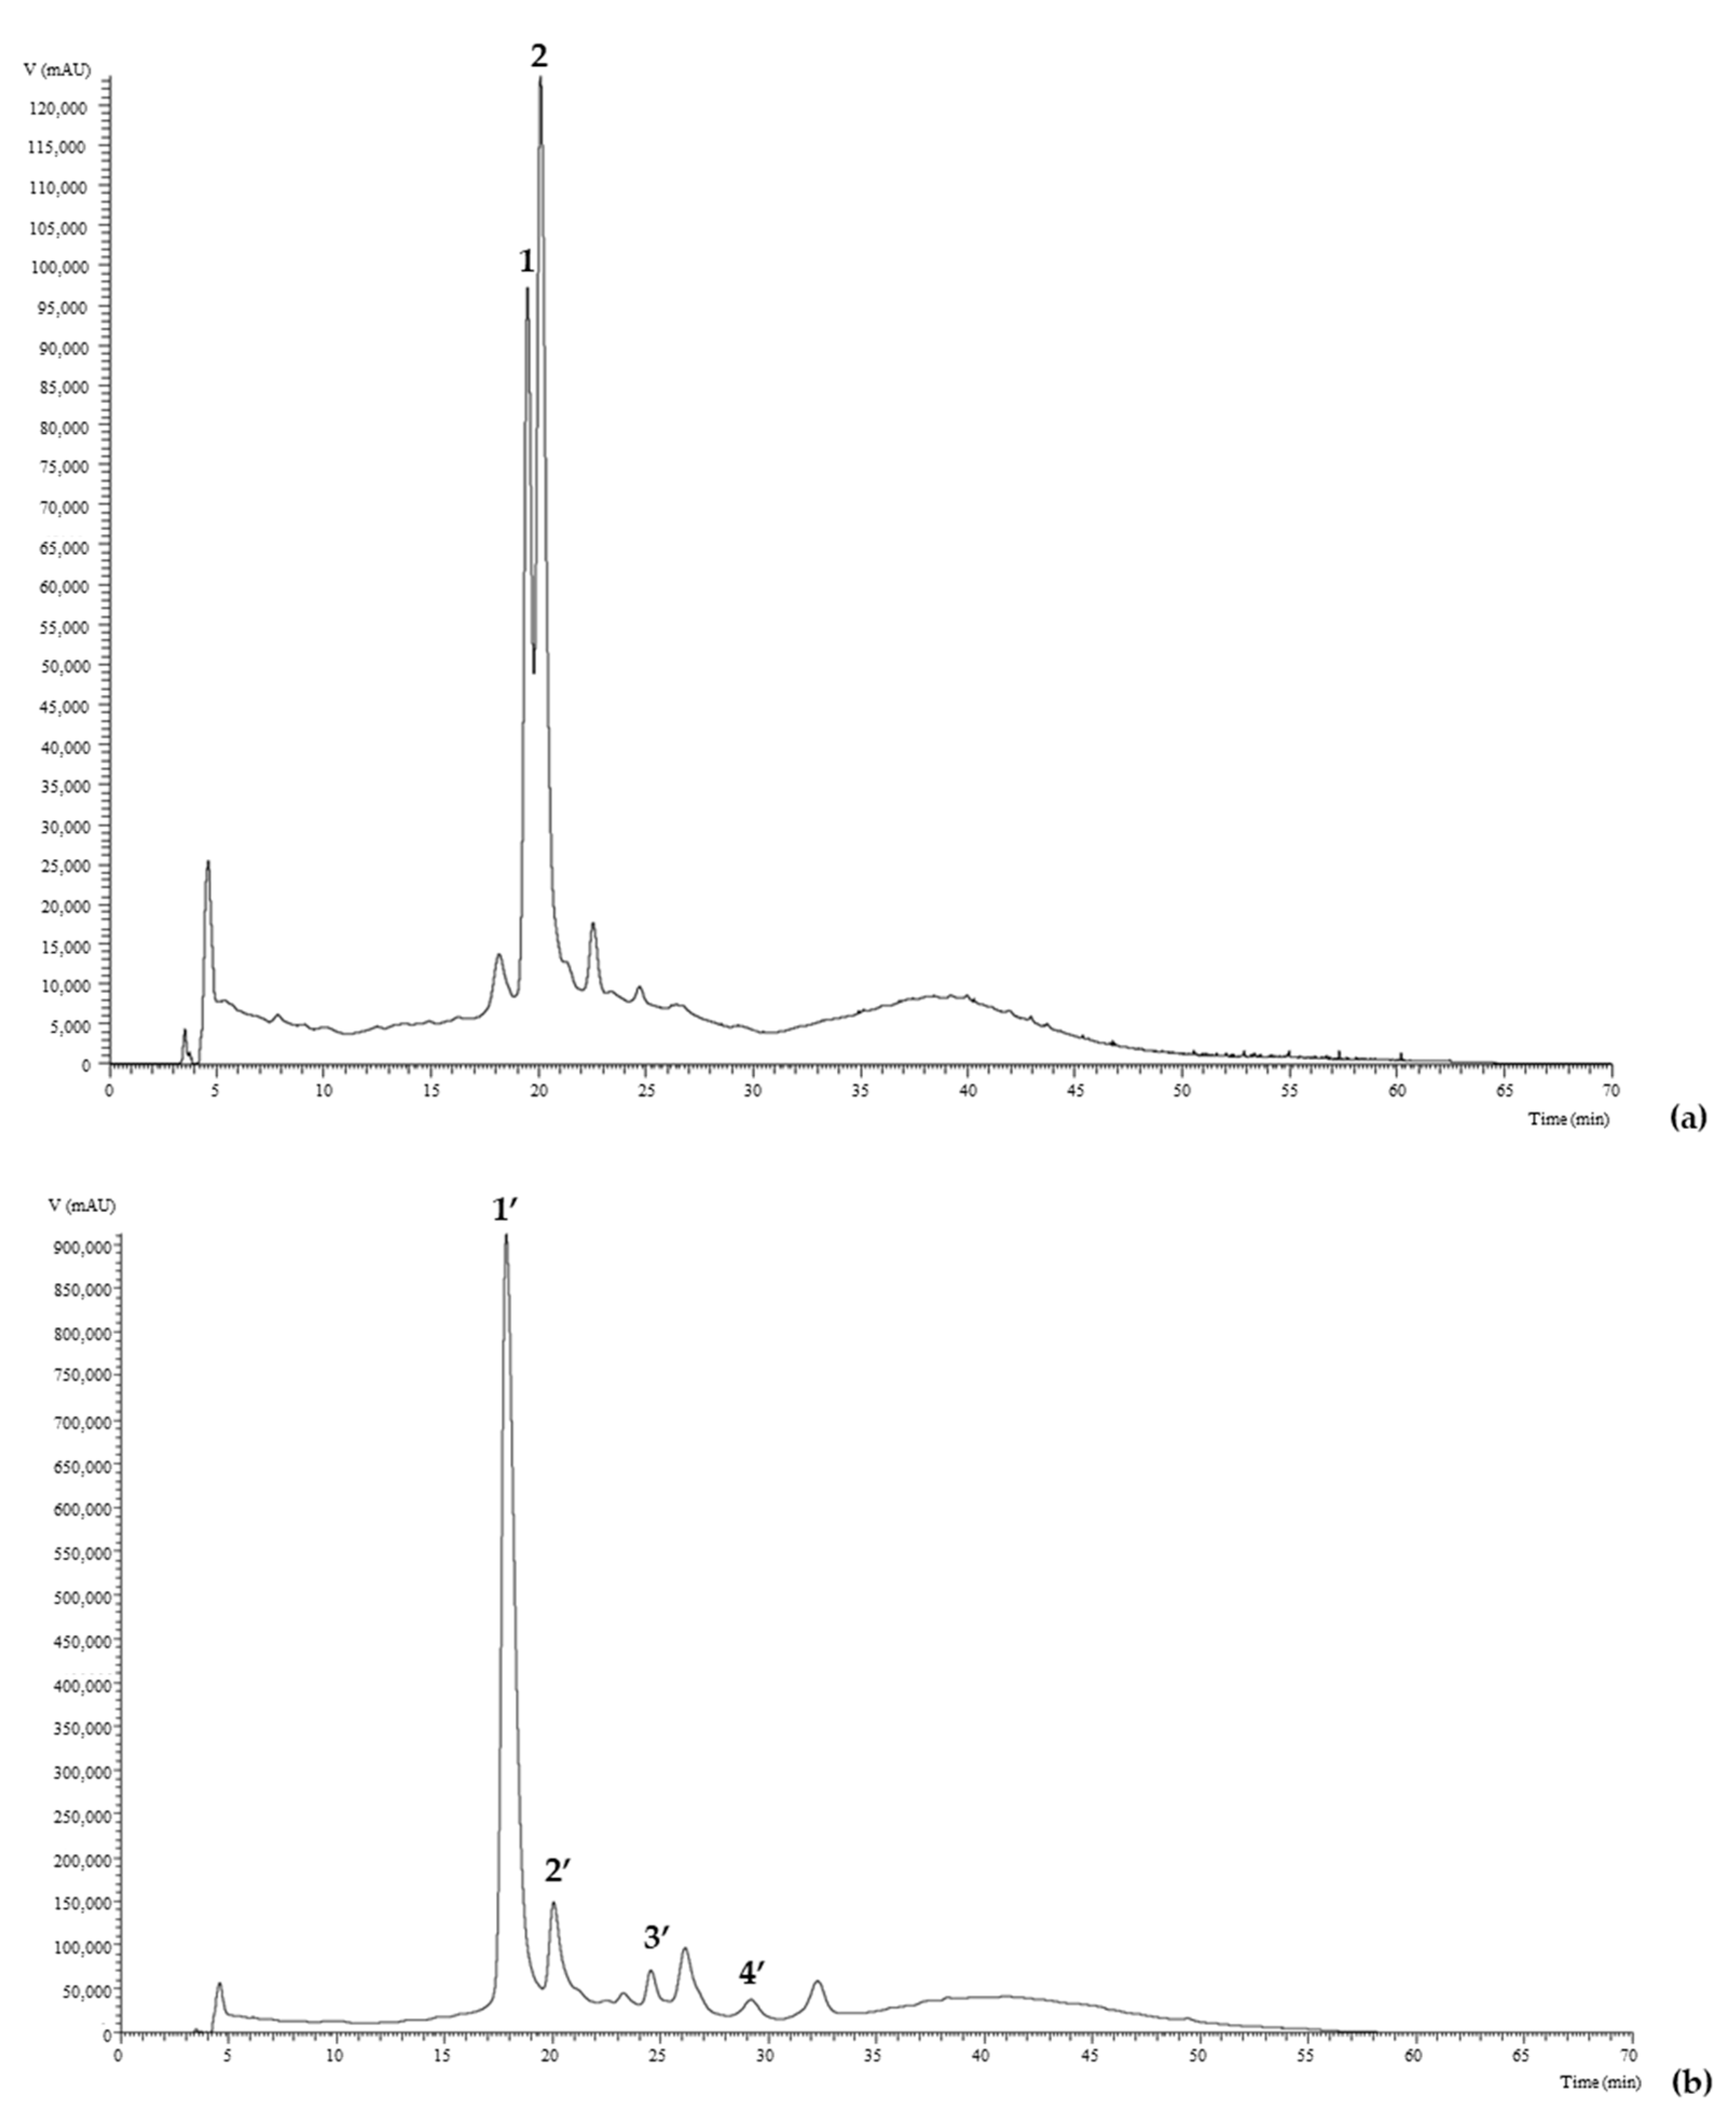
2.1.4. Anthocyanins
2.2. Bioactive Properties
2.2.1. Antioxidant Activity
2.2.2. Antimicrobial Activity
2.3. Stability of the Colouring Formulations
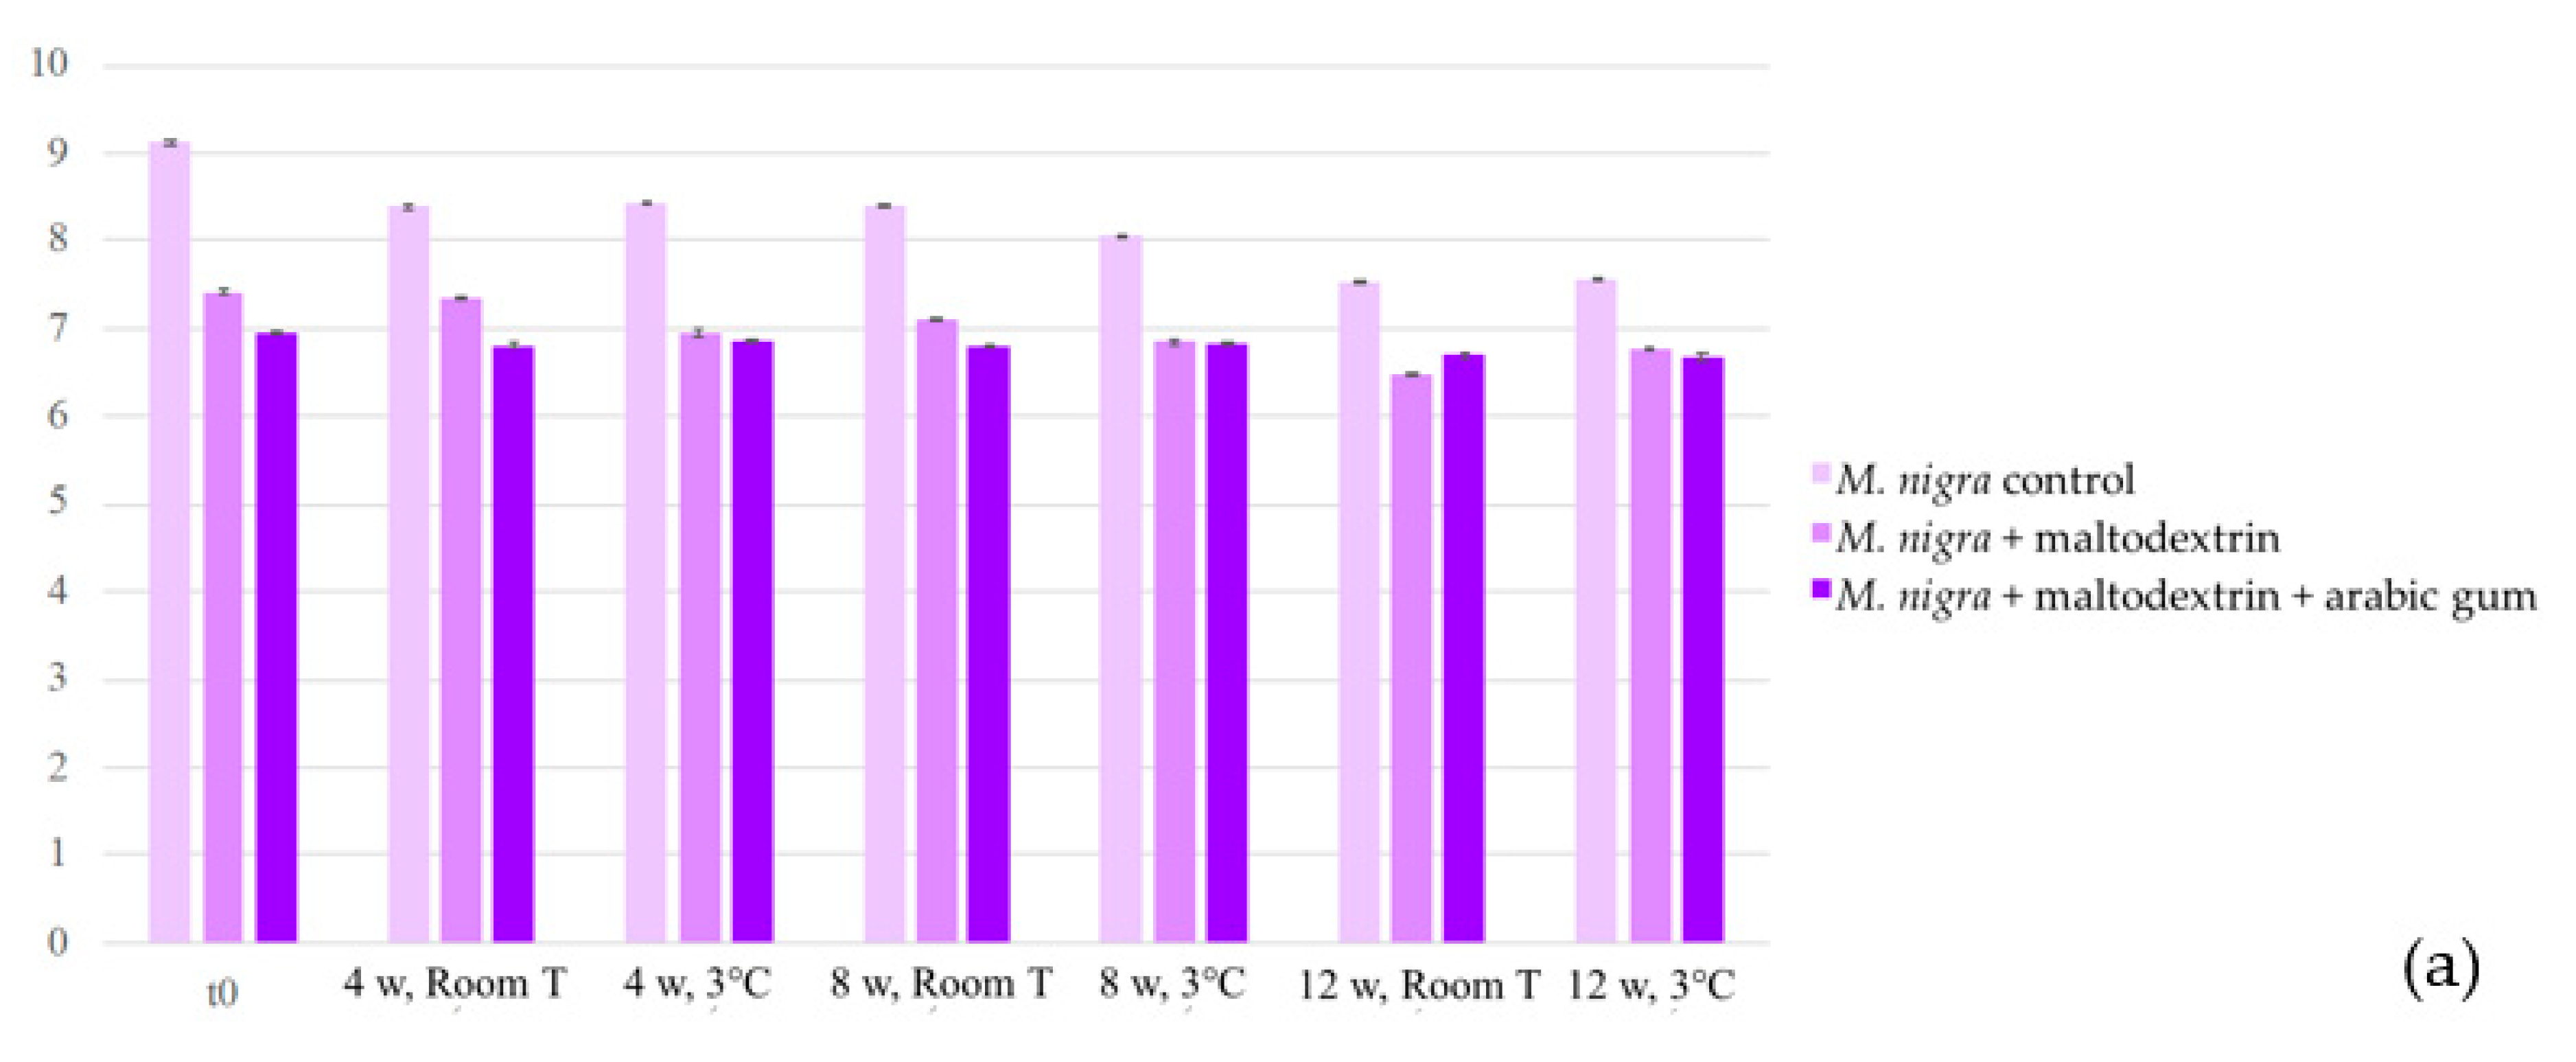
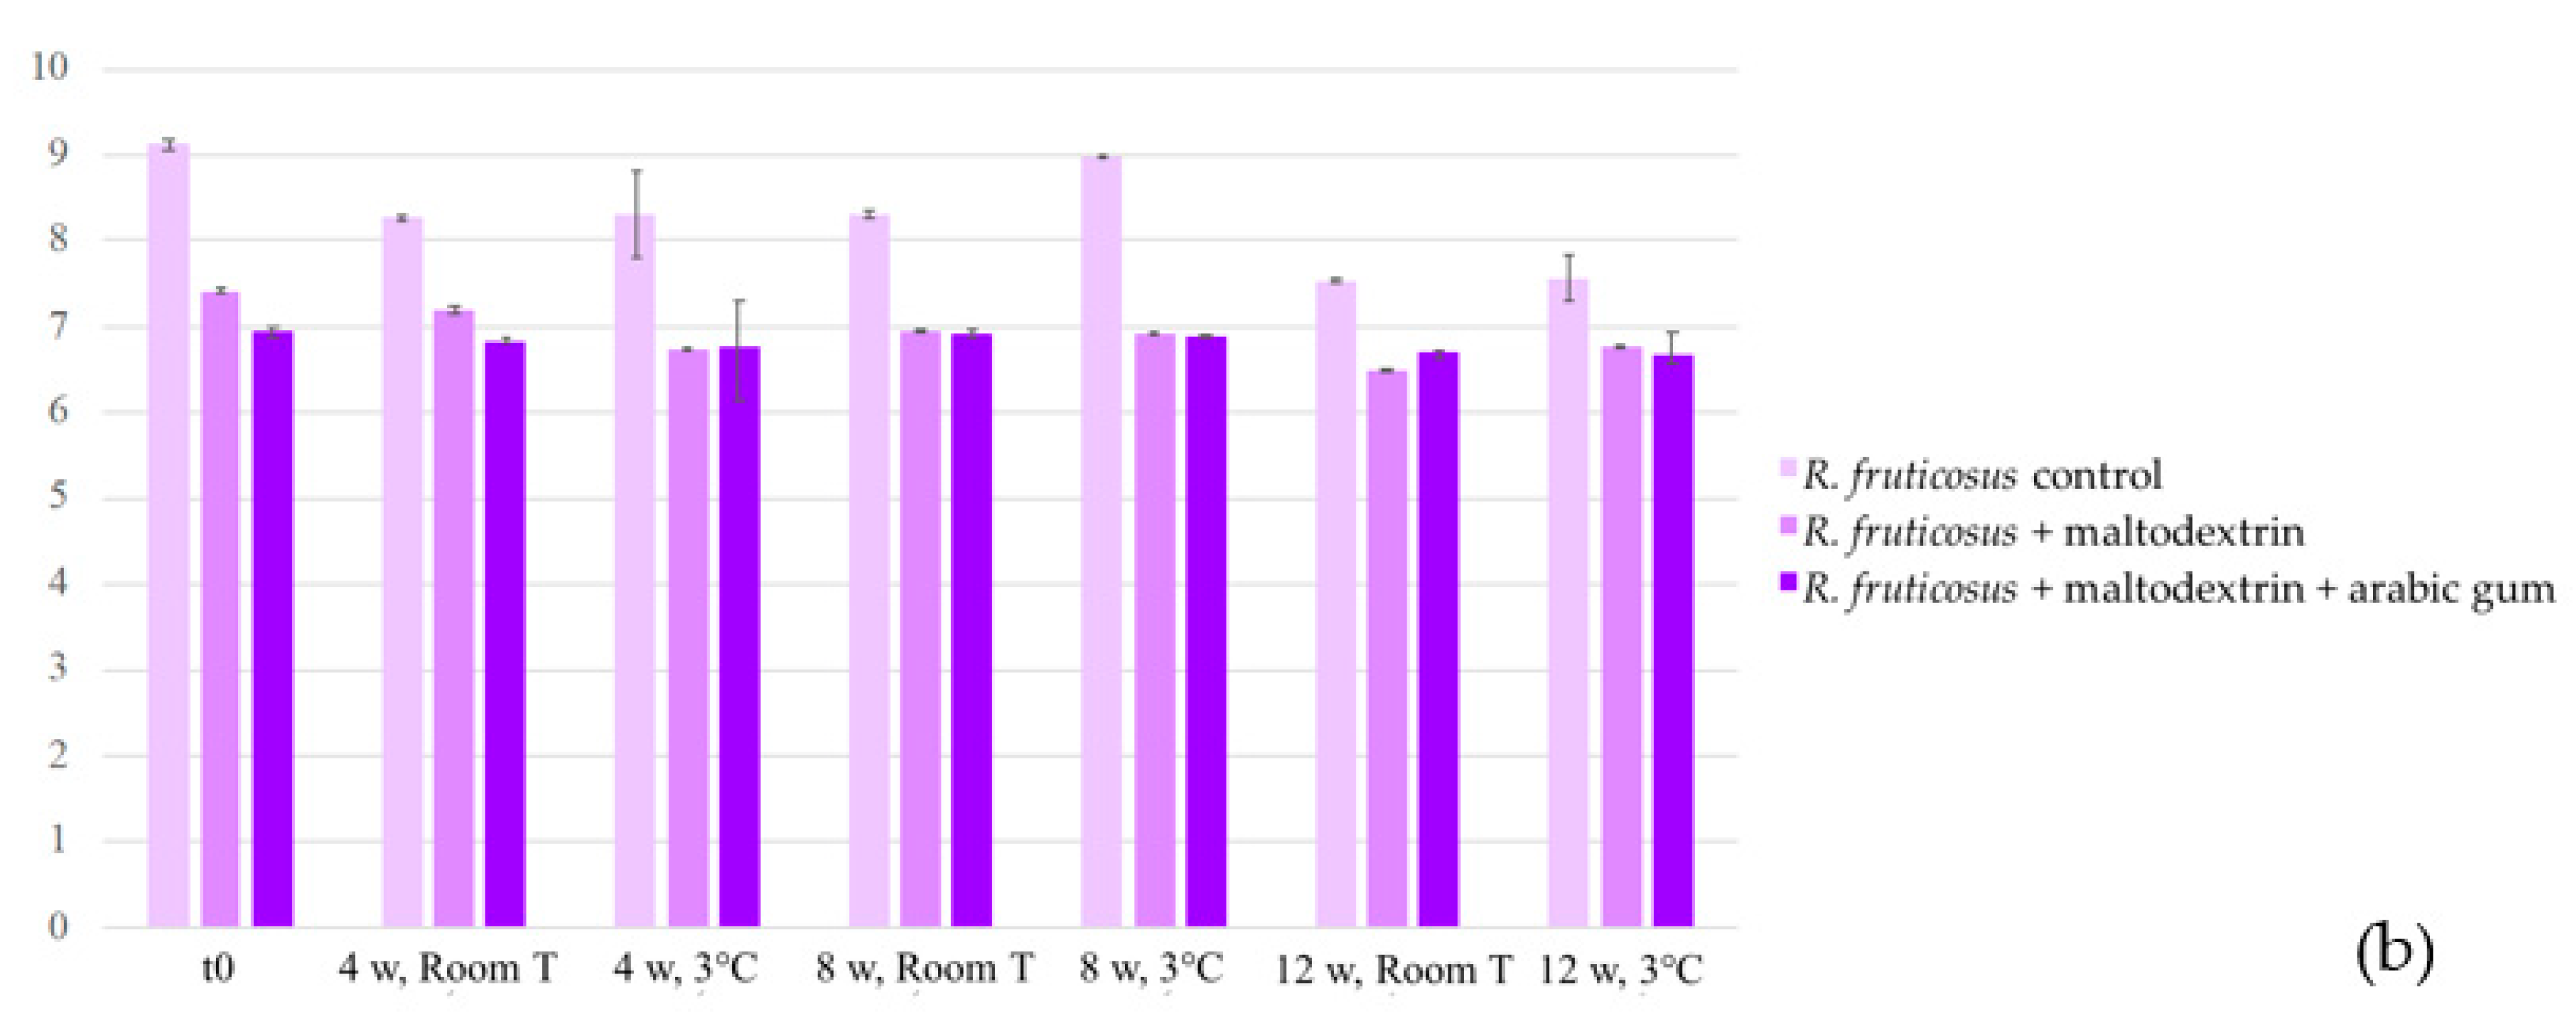
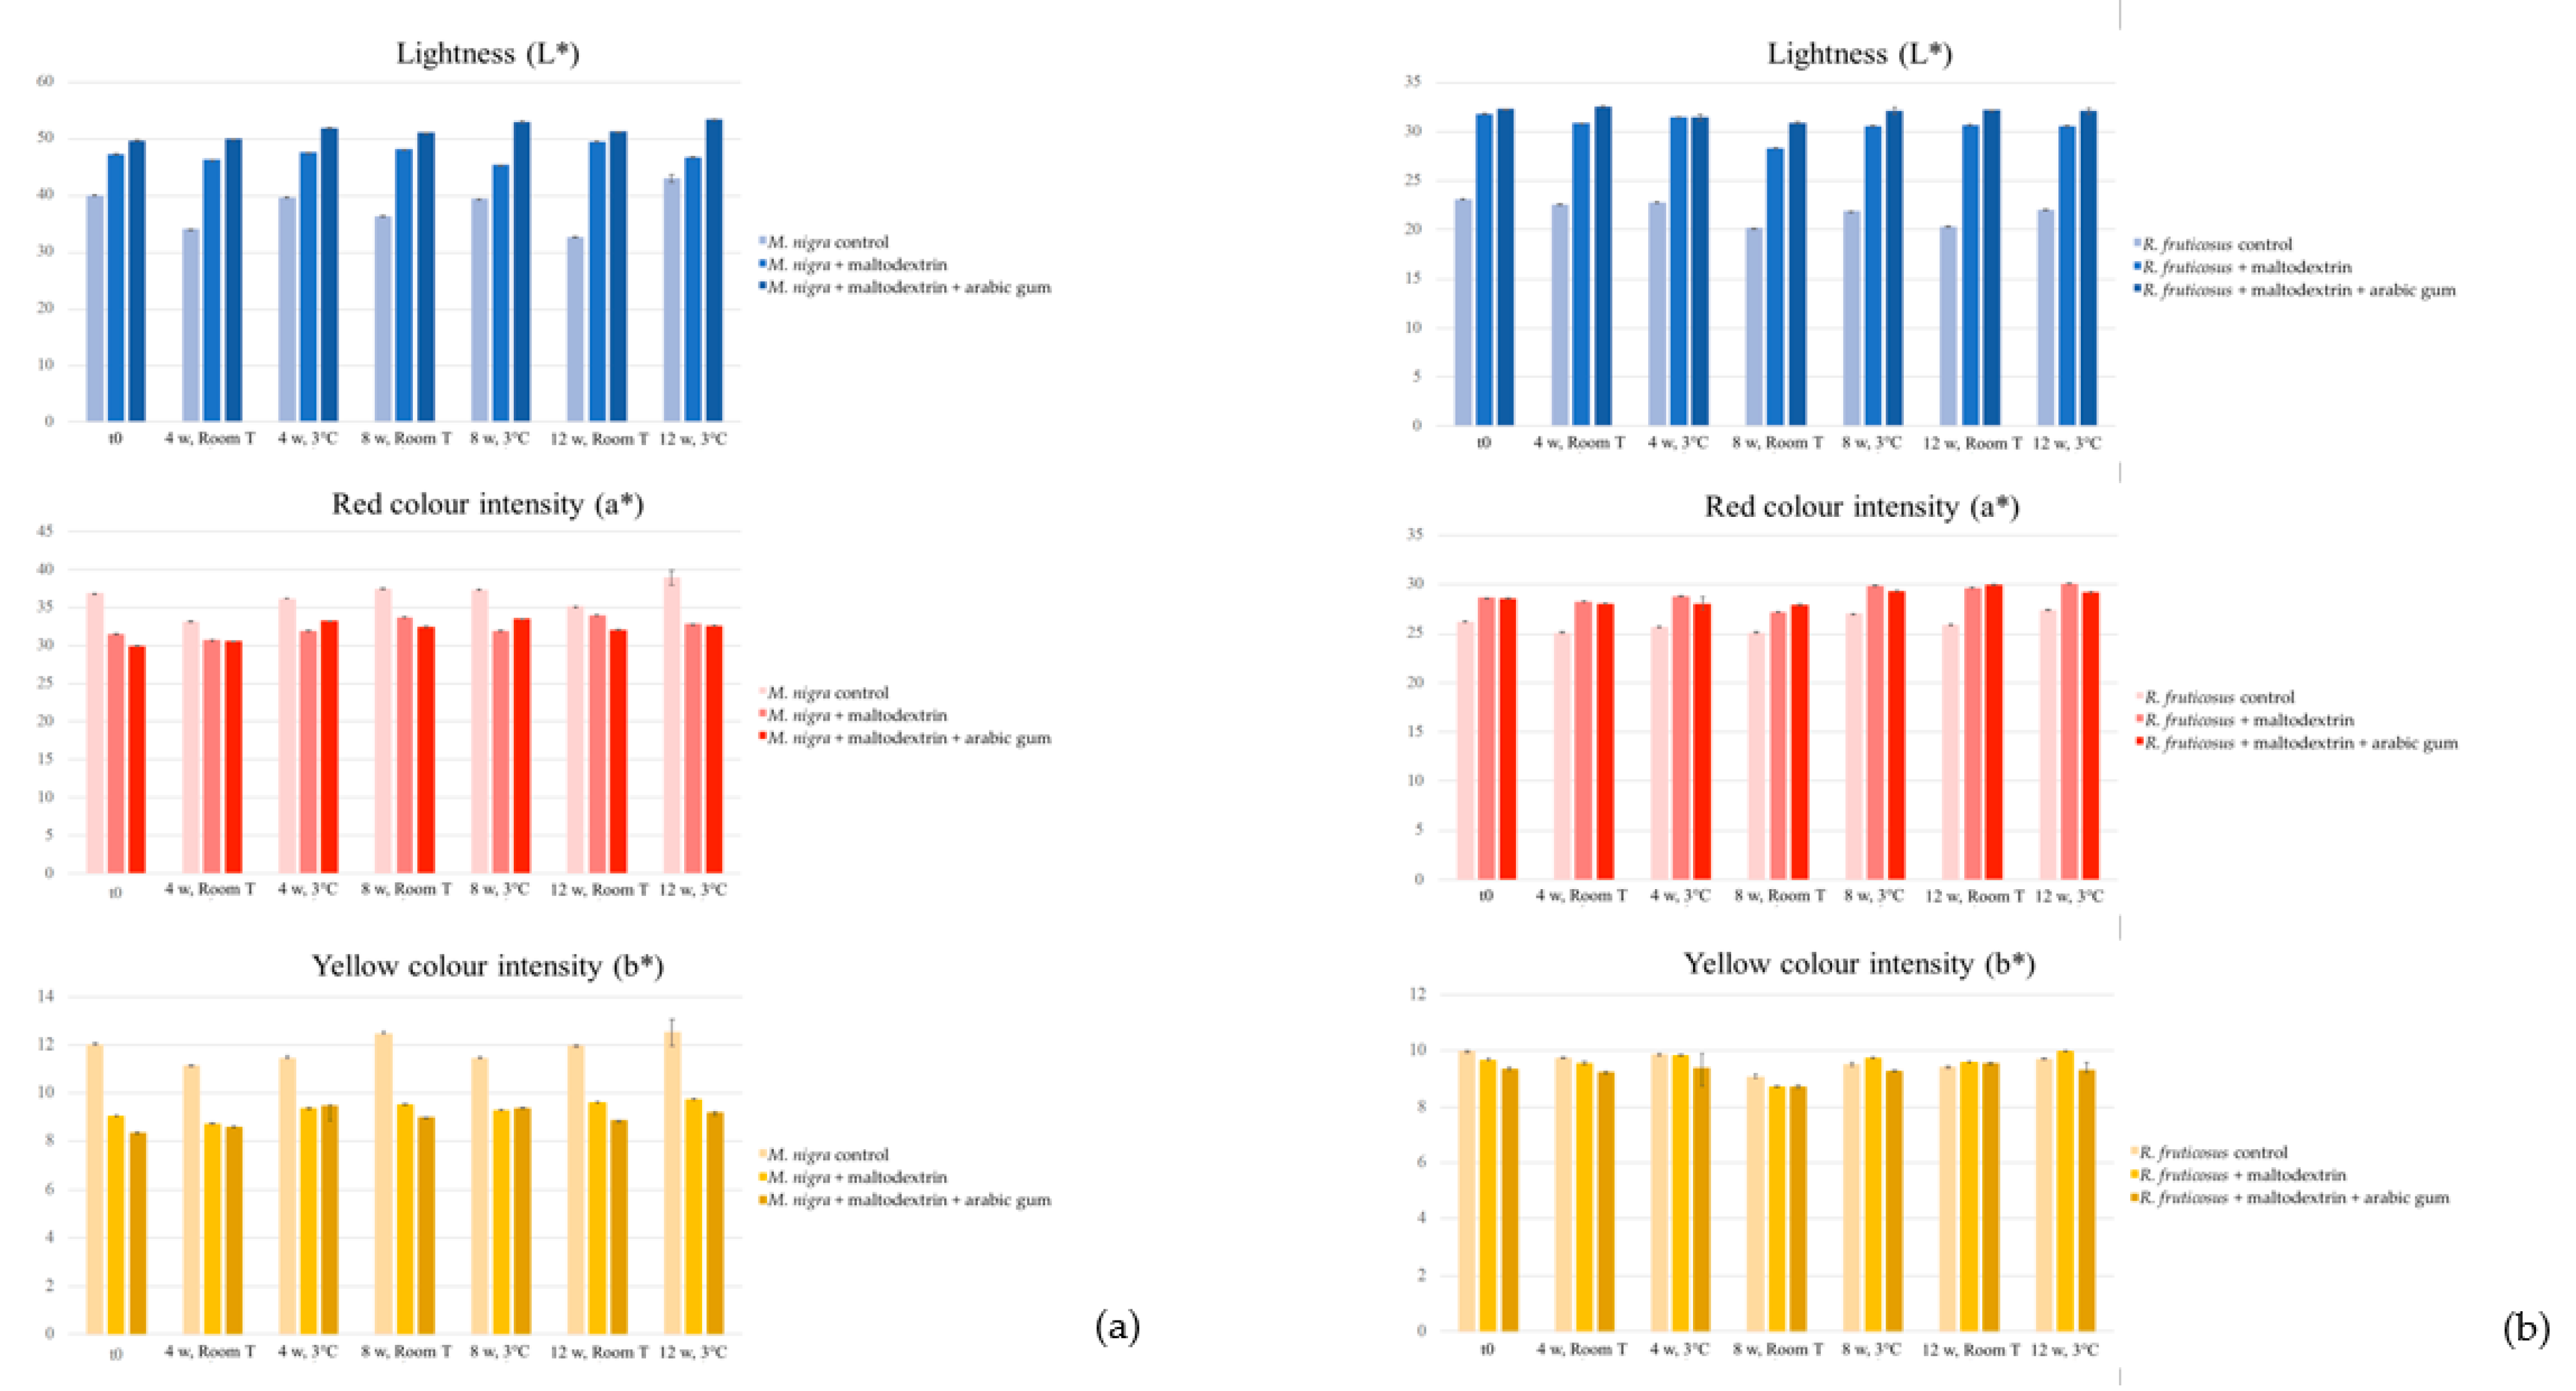
2.3.1. Colour and Anthocyanin Concentration
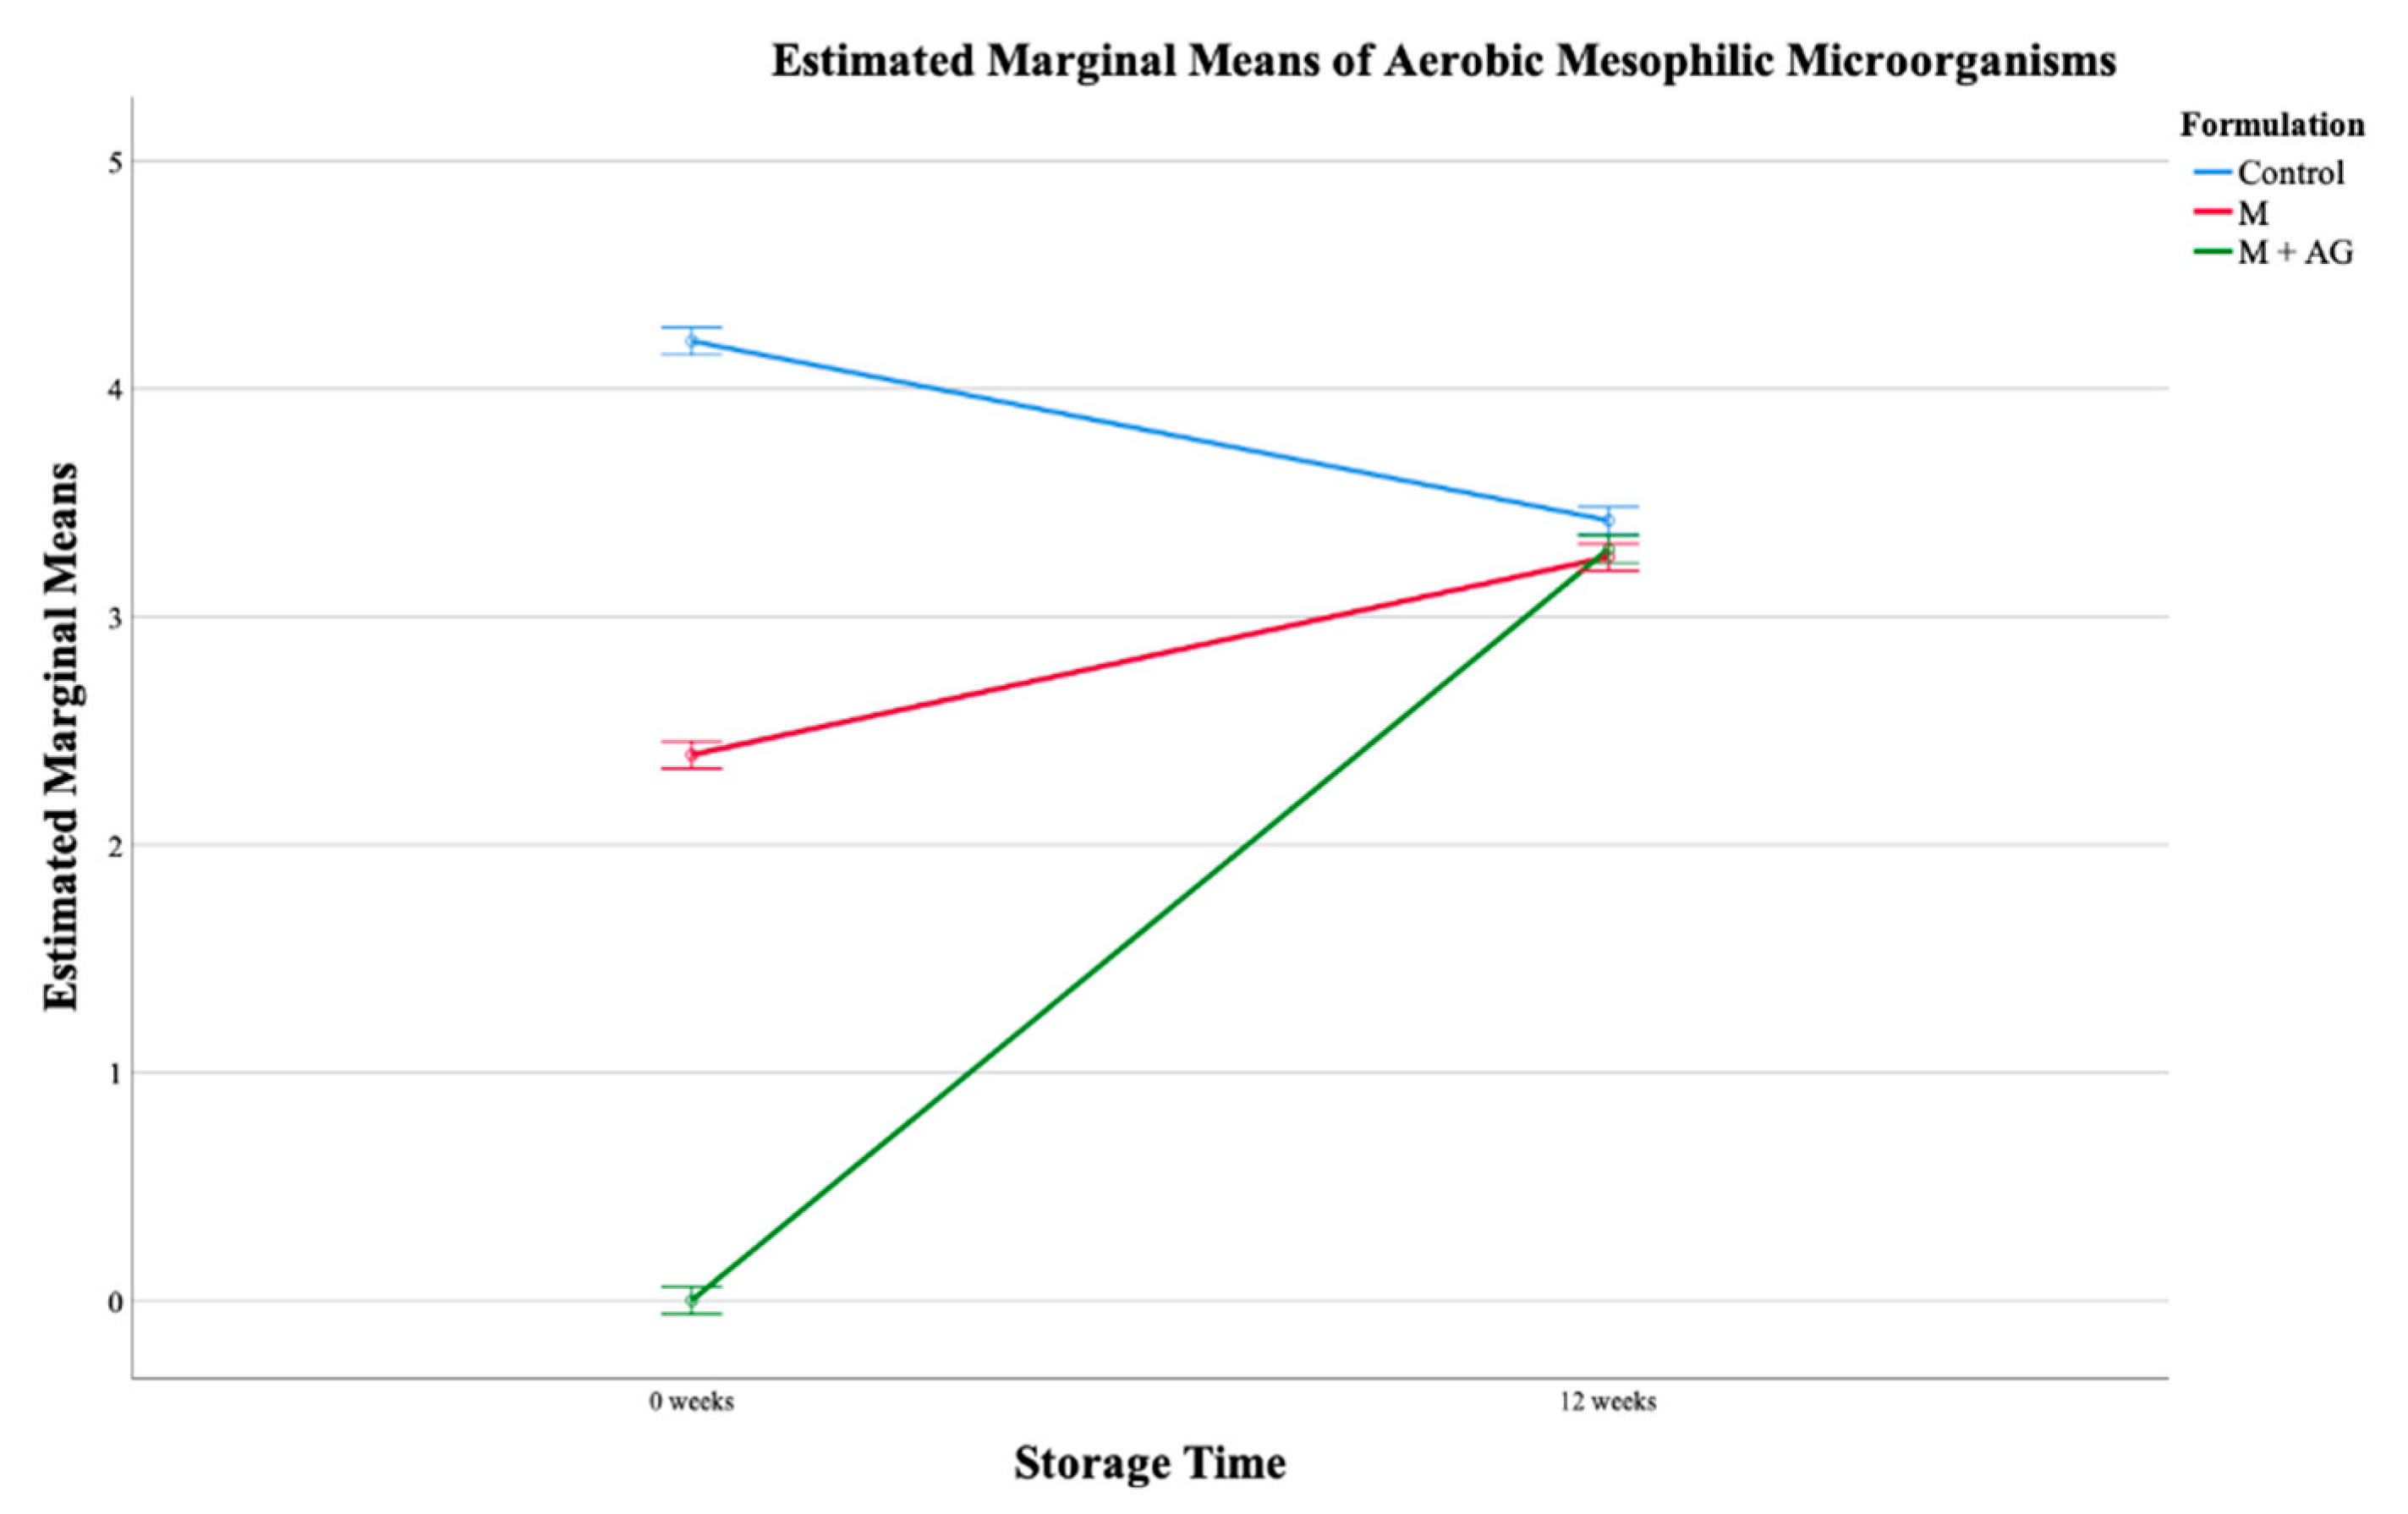
2.3.2. Microbial Analysis
Evaluation of Pasteurization Efficiency
Microbial Load in the Final Juice Samples
2.3.3. Cytotoxicity
3. Materials and Methods
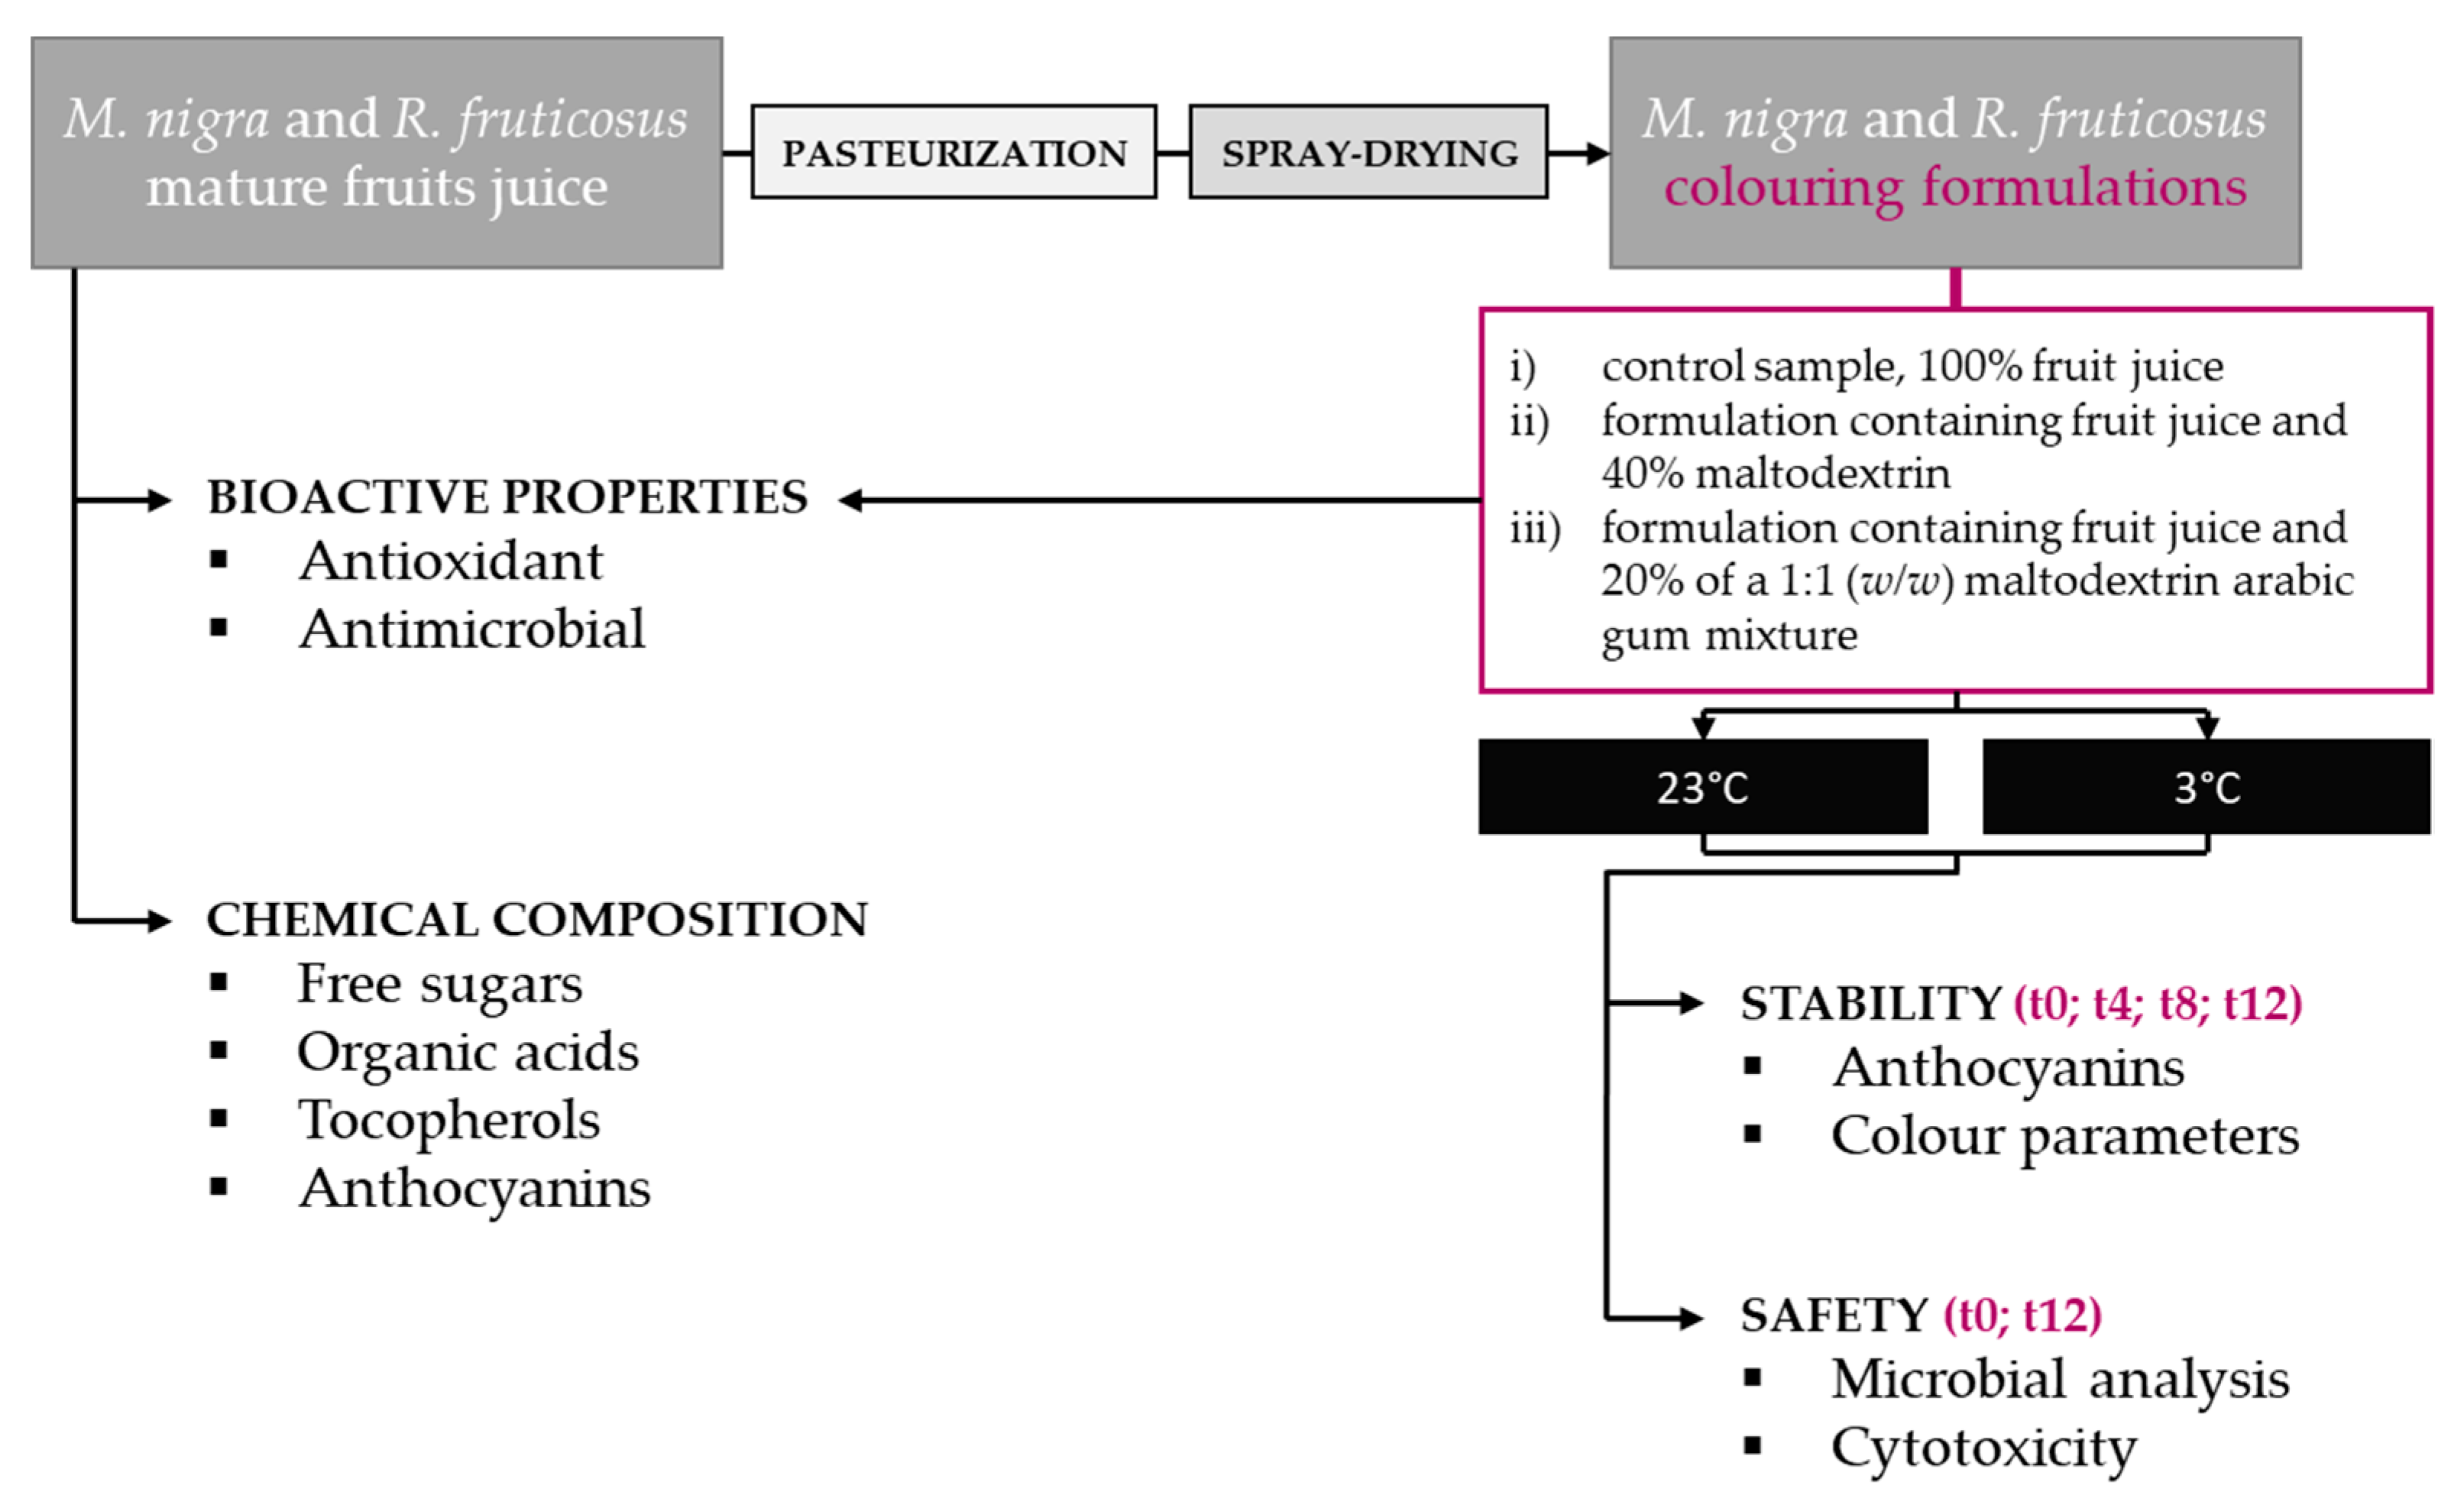
3.1. Samples
3.2. Chemical Composition
3.2.1. Free Sugars
3.2.2. Organic Acids
3.2.3. Tocopherols
3.2.4. Anthocyanins
3.3. Bioactive Properties
3.3.1. Antioxidant Properties
3.3.2. Antimicrobial Properties
3.4. Colouring Formulations
3.4.1. Pasteurization
3.4.2. Spray-Drying
3.5. Stability of the Colouring Formulations
3.5.1. Anthocyanin Concentration and Colour Parameters
3.5.2. Microbial Analysis
3.5.2.1. Determination of the Pasteurization Procedure
3.5.2.2. Microbial Load of the Final Colouring Formulations Subjected to the Chosen Pasteurization Conditions
3.5.3. Cytotoxicity
3.6. Statistical Analysis
4. Conclusions
Author Contributions
Funding
Institutional Review Board Statement
Informed Consent Statement
Data Availability Statement
Acknowledgments
Conflicts of Interest
References
- Lakshmi, C.G. Food coloring: The natural way. Res. J. Chem. Sci. Res. J. Chem. Sci 2014, 4, 2231–2606. [Google Scholar]
- Martins, N.; Roriz, C.L.; Morales, P.; Barros, L.; Ferreira, I.C.F.R. Food colorants: Challenges, opportunities and current desires of agro-industries to ensure consumer expectations and regulatory practices. Trends Food Sci. Technol. 2016, 52, 1–15. [Google Scholar] [CrossRef]
- Özgen, M.; Serçe, S.; Kaya, C. Phytochemical and antioxidant properties of anthocyanin-rich Morus nigra and Morus rubra fruits. Sci. Hortic. (Amst.) 2009, 119, 275–279. [Google Scholar] [CrossRef]
- Zia-Ul-Haq, M.; Riaz, M.; De Feo, V.; Jaafar, H.Z.E.; Moga, M. Rubus fruticosus L.: Constituents, biological activities and health related uses. Molecules 2014, 19, 10998–11029. [Google Scholar] [CrossRef]
- Tonioni, G.; Santos, T.R.; Macedo, R.; Peters, V.M.; Narciso, M.; de da Silveira, R.C.; de Guerra, M.O. Efficacy of Morus nigra L. on reproduction in female Wistar rats. Food Chem. Toxicol. 2011, 50, 816–822. [Google Scholar]
- Chen, H.; Pu, J.; Liu, D.; Yu, W.; Shao, Y.; Yang, G.; Xiang, Z.; He, N. Anti-inflammatory and antinociceptive properties of flavonoids from the fruits of black mulberry (Morus nigra L). PLoS ONE 2016, 11, e0153080. [Google Scholar] [CrossRef]
- Kutlu, T.; Durmaz, G.; Ateş, B.; Yilmaz, I.; Çetin, M.Ş. Antioxidant properties of different extracts of black mulberry (Morus nigra L.). Turkish J. Biol. 2011, 35, 103–110. [Google Scholar]
- Pawlowska, A.M.; Oleszek, W.; Braca, A. Quali-quantitative analyses of flavonoids of Morus nigra L. and Morus alba L. (Moraceae) fruits. J. Agric. Food Chem. 2008, 56, 3377–3380. [Google Scholar] [CrossRef] [PubMed]
- Costa, G.R. Efeito de Extratos Ricos em Antocianinas ou Elagitaninos de Amora Silvestre (Morus nigra L.), Amora Preta (Rubus spp), e Grumixama (Eugenia brasiliensis Lam) no Crescimento e em Marcas Epigenéticas, (Tesis doctoral); Universidade de São Paulo: São Paulo, Brasil, 2015. [Google Scholar]
- Ercisli, S.; Orhan, E. Some physico-chemical characteristics of black mulberry (Morus nigra L.) genotypes from Northeast Anatolia region of Turkey. Sci. Hortic. (Amst.) 2008, 116, 41–46. [Google Scholar] [CrossRef]
- Sánchez-Salcedo, E.M.; Sendra, E.; Carbonell-Barrachina, Á.A.; Martínez, J.J.; Hernández, F. Fatty acids composition of Spanish black (Morus nigra L.) and white (Morus alba L.) mulberries. Food Chem. 2016, 190, 566–571. [Google Scholar] [CrossRef] [PubMed]
- Ercisli, S.; Orhan, E. Chemical composition of white (Morus alba), red (Morus rubra) and black (Morus nigra) mulberry fruits. Food Chem. 2007, 103, 1380–1384. [Google Scholar] [CrossRef]
- Huang, W.Y.; Zhang, H.C.; Liu, W.X.; Li, C.Y. Survey of antioxidant capacity and phenolic composition of blueberry, blackberry, and strawberry in Nanjing. J. Zhejiang Univ. Sci. B 2012, 13, 94–102. [Google Scholar] [CrossRef]
- Milivojević, J.; Maksimović, V.; Nikolić, M.; Bogdanović, J.; Maletić, R.; Milatović, D. Chemical and antioxidant properties of cultivated and wild Fragraria and Rubus berries. J. Food Qual. 2011, 34, 1–9. [Google Scholar] [CrossRef]
- Gundogdu, M.; Muradoglu, F.; Sensoy, R.I.G.; Yilmaz, H. Determination of fruit chemical properties of Morus nigra L., Morus alba L. and Morus rubra L. by HPLC. Sci. Hortic. (Amst.) 2011, 132, 37–41. [Google Scholar] [CrossRef]
- Akšić, M.F.; Tosti, T.; Sredojević, M.; Milivojević, J.; Meland, M.; Natić, M. Comparison of sugar profile between leaves and fruits of blueberry and strawberry cultivars grown in organic and integrated production system. Plants 2019, 8, 205. [Google Scholar] [CrossRef] [PubMed]
- Palonen, P.; Buszard, D.; Donnelly, D. Two approaches to in vitro screening of raspberry cultivars for cold hardiness. Acta Hortic. 1999, 505, 191–197. [Google Scholar] [CrossRef]
- Vara, A.L.; Pinela, J.; Dias, M.I.; Petrović, J.; Nogueira, A.; Soković, M.; Ferreira, I.C.F.R.; Barros, L. Compositional features of the “Kweli” red raspberry and its antioxidant and antimicrobial activities. Foods 2020, 9, 1522. [Google Scholar] [CrossRef]
- Koyuncu, F. Organic acid composition of native black mulberry fruit. Chem. Nat. Compd. 2004, 40, 367–369. [Google Scholar] [CrossRef]
- Kafkas, E.; Koşar, M.; Türemiş, N.; Başer, K.H.C. Analysis of sugars, organic acids and vitamin C contents of blackberry genotypes from Turkey. Food Chem. 2006, 97, 732–736. [Google Scholar] [CrossRef]
- Wajs-Bonikowska, A.; Stobiecka, A.; Bonikowski, R.; Krajewska, A.; Sikora, M.; Kula, J. A comparative study on composition and antioxidant activities of supercritical carbon dioxide, hexane and ethanol extracts from blackberry (Rubus fruticosus) growing in Poland. J. Sci. Food Agric. 2017, 97, 3576–3583. [Google Scholar] [CrossRef]
- Wu, X.; Prior, R.L. Systematic identification and characterization of anthocyanins by HPLC-ESI-MS/MS in common foods in the United States: Fruits and berries. J. Agric. Food Chem. 2005, 53, 2589–2599. [Google Scholar] [CrossRef] [PubMed]
- Arfan, M.; Khan, R.; Rybarczyk, A.; Amarowicz, R. Antioxidant Activity of Mulberry Fruit Extracts. Int. J. Mol. Sci 2012, 13, 2472–2480. [Google Scholar] [CrossRef] [PubMed]
- Do, H.T.T.; Nguyen, H.V.H. Effects of Spray-Drying Temperatures and Ratios of Gum Arabic to Microcrystalline Cellulose on Antioxidant and Physical Properties of Mulberry Juice Powder. Beverages 2018, 4, 101. [Google Scholar] [CrossRef]
- Ferrari, C.C.; Marconi Germer, S.P.; Alvim, I.D.; de Aguirre, J.M. Storage Stability of Spray-Dried Blackberry Powder Produced with Maltodextrin or Gum Arabic. Dry. Technol. 2013, 31, 470–478. [Google Scholar] [CrossRef]
- Četojević-Simin, D.D.; Ranitović, A.S.; Cvetković, D.D.; Markov, S.L.; Vinčić, M.N.; Djilas, S.M. Bioactivity of blackberry (Rubus fruticosus L.) pomace: Polyphenol content, radical scavenging, antimicrobial and antitumor activity. Acta Period. Technol. 2017, 48, 63–76. [Google Scholar] [CrossRef]
- Khalid, N.; Atiq Fawad, S.; Ahmed, I. Antimicrobial Activity, Phytochemical Profile and Trace Minerals of Black Mulberry (Morus nigra L.) Fresh Juice. Pak. J. Bot. 2001, 3, 91–96. [Google Scholar]
- Ferrari, C.C.; Germer, S.P.M.; de Aguirre, J.M. Effects of Spray-Drying Conditions on the Physicochemical Properties of Blackberry Powder. Dry. Technol. 2012, 30, 154–163. [Google Scholar] [CrossRef]
- Food and Drug Administration (FDA) Federal Register: Hazard Analysis and Critical Control Point (HAACP); Procedures for the Safe and Sanitary Processing and Importing of Juice. Available online: https://www.federalregister.gov/documents/2001/01/19/01-1291/hazard-analysis-and-critical-control-point-haacp-procedures-for-the-safe-and-sanitary-processing-and (accessed on 12 April 2021).
- Barros, L.; Pereira, E.; Calhelha, R.C.; Dueñas, M.; Carvalho, A.M.; Santos-Buelga, C.; Ferreira, I.C.F.R. Bioactivity and chemical characterization in hydrophilic and lipophilic compounds of Chenopodium ambrosioides L. J. Funct. Foods 2013, 5, 1732–1740. [Google Scholar] [CrossRef]
- Pereira, C.; Carvalho, A.M.; Barros, L.; Ferreira, I.C.F.R.F.R. Use of UFLC-PDA for the analysis of organic acids in thirty-five species of food and medicinal plants. Food Anal. Methods 2013, 6, 1337–1344. [Google Scholar] [CrossRef]
- Gonçalves, G.A.; Soares, A.A.; Correa, R.C.G.; Barros, L.; Haminiuk, C.W.I.; Peralta, R.M.; Ferreira, I.C.F.R.; Bracht, A. Merlot grape pomace hydroalcoholic extract improves the oxidative and inflammatory states of rats with adjuvant-induced arthritis. J. Funct. Foods 2017, 33, 408–418. [Google Scholar] [CrossRef]
- Pereira, C.; Calhelha, R.C.; Barros, L.; Queiroz, M.J.R.P.; Ferreira, I.C.F.R. Synergisms in antioxidant and anti-hepatocellular carcinoma activities of artichoke, milk thistle and borututu syrups. Ind. Crops Prod. 2014, 52, 709–713. [Google Scholar] [CrossRef]
- Lockowandt, L.; Pinela, J.; Roriz, C.L.; Pereira, C.; Abreu, R.M.V.; Calhelha, R.C.; Alves, M.J.; Barros, L.; Bredol, M.; Ferreira, I.C.F.R. Chemical features and bioactivities of cornflower (Centaurea cyanus L.) capitula: The blue flowers and the unexplored non-edible part. Ind. Crops Prod. 2019, 128, 496–503. [Google Scholar] [CrossRef]
- Soković, M.; Glamočlija, J.; Marin, P.D.; Brkić, D.; Griensven, L.J.L.D. van Antibacterial effects of the essential oils of commonly consumed medicinal herbs using an in vitro model. Molecules 2010, 15, 7532–7546. [Google Scholar] [CrossRef]
- Soković, M.; Van Griensven, L.J.L.D. Antimicrobial activity of essential oils and their components against the three major pathogens of the cultivated button mushroom. Agaricus bisporus. Eur. J. Plant Pathol. 2006, 116, 211–224. [Google Scholar] [CrossRef]
- Molina, A.K.; Vega, E.N.; Pereira, C.; Dias, M.I.; Heleno, S.A.; Rodrigues, P.; Fernandes, I.P.; Barreiro, M.F.; Kostić, M.; Soković, M.; et al. Promising antioxidant and antimicrobial food colourants from Lonicera caerulea L. var. Kamtschatica. Antioxidants 2019, 8, 394. [Google Scholar] [CrossRef]
- Moser, P.; De Souza, R.T.; Nicoletti Telis, V.R. Spray drying of grape juice from hybrid CV. BRS Violeta: Microencapsulation of anthocyanins using protein/maltodextrin blends as drying aids. J. Food Process. Preserv. 2017, 41, e12852. [Google Scholar] [CrossRef]
- Pereira, E.; Antonio, A.L.; Barreira, J.C.M.; Barros, L.; Bento, A.; Ferreira, I.C.F.R. Gamma irradiation as a practical alternative to preserve the chemical and bioactive wholesomeness of widely used aromatic plants. Food Res. Int. 2015, 67, 338–348. [Google Scholar] [CrossRef]
- Fernandes, F.A.; Carocho, M.; Heleno, S.A.; Rodrigues, P.; Dias, M.I.; Pinela, J.; Prieto, M.A.; Simal-Gandara, J.; Barros, L.; Ferreira, I.C.F.R. Effect of Natural Preservatives on the Nutritional Profile, Chemical Composition, Bioactivity and Stability of a Nutraceutical Preparation of Aloe arborescens. Antioxidants 2020, 9, 281. [Google Scholar] [CrossRef]
- Abreu, R.M.V.; Ferreira, I.C.F.R.; Calhelha, R.C.; Lima, R.T.; Vasconcelos, M.H.; Adega, F.; Chaves, R.; Queiroz, M.J.R.P. Anti-hepatocellular carcinoma activity using human HepG2 cells and hepatotoxicity of 6-substituted methyl 3-aminothieno[3,2-b]pyridine-2-carboxylate derivatives: In vitro evaluation, cell cycle analysis and QSAR studies. Eur. J. Med. Chem. 2011, 46, 5800–5806. [Google Scholar] [CrossRef] [PubMed]


| M. nigra | R. fruticosus | p-Value | |
|---|---|---|---|
| Free Sugars (mg/g extract) | |||
| Fructose | 248 ± 2 | 201 ± 1 | <0.001 |
| Glucose | 229.9 ± 0.3 | 163.5 ± 0.1 | <0.001 |
| Sucrose | 2.70 ± 0.08 | 3.7 ± 0.2 | <0.001 |
| Trehalose | 3.5 ± 0.1 | 5.3 ± 0.1 | <0.001 |
| Raffinose | 5.1 ± 0.2 | 12.1 ± 0.6 | <0.001 |
| Unknown | nd | 21 ± 1 | - |
| Total | 449 ± 2 | 373 ± 1 | <0.001 |
| Organic acids (mg/g extract) | |||
| Oxalic acid | 14.91 ± 0.09 | 5.52 ± 0.02 | <0.001 |
| Malic acid | 146.9 ± 0.6 | 101.9 ± 0.2 | <0.001 |
| Total | 161.8 ± 0.6 | 107.3 ± 0.2 | <0.001 |
| Tocopherols (mg/g extract) | |||
| α-Tocopherol | 43 ± 2 | 6.1 ± 0.1 | <0.001 |
| β-Tocopherol | 1.27 ± 0.03 | nd | - |
| γ-Tocopherol | 12.5 ± 0.2 | nd | - |
| δ-Tocopherol | 5.5 ± 0.1 | nd | - |
| Total | 62 ± 2 | 6.1 ± 0.1 | <0.001 |
| Peak | Rt (min) | λmax (nm) | [M]+ m/z | MS2 | Tentative Identification | Concentration (mg/g Extract) |
|---|---|---|---|---|---|---|
| M. nigra | ||||||
| 1 | 19.72 | 515 | 449 | 287(100) | Cyanidin-3-O-glucoside | 6.096 ± 0.003 |
| 2 | 22.00 | 517 | 595 | 449(31), 287(100) | Cyanidin-O-rhamnoside-O-hexoside | 2.443 ± 0.002 |
| Total | 8.538 ± 0.005 | |||||
| R. fruticosus | ||||||
| 1′ | 16.69 | 518 | 449 | 287(100) | Cyanidin-O-hexoside | 3.761 ± 0.007 |
| 2′ | 19.55 | 518 | 449 | 287(100) | Cyanidin-3-O-glucoside | 1.81 ± 0.01 |
| 3′ | 24.01 | 517 | 419 | 287(100) | Cyanidin-O-pentoside | 1.265 ± 0.001 |
| 4′ | 30.14 | 519 | 593 | 287(100) | Cyanidin-3-O-dioxaloilglucoside | 1.198 ± 0.001 |
| Total | 8.03 ± 0.02 | |||||
| Antioxidant Activity (IC50 Values, µg/mL) | |||||||
|---|---|---|---|---|---|---|---|
| M. nigra extract | M. nigra control | M. nigra + M | M. nigra + M + AG | Trolox 1 | |||
| TBARS assay | 39 ± 2a | 55.6 ± 0.4c | 51 ± 1b | 52 ± 2b | 139 ± 5 | ||
| OxHLIA assay | 60 min | 253 ± 10d | 166 ± 5c | 124 ± 5b | 108 ± 5a | 85 ± 2 | |
| 120 min | 569 ± 14d | 324 ± 17c | 286 ± 10a | 296 ± 11a | 183 ± 4 | ||
| Antibacterial activity (MIC and MBC values, mg/mL) | |||||||
| M. nigra extract | M. nigra control | M. nigra + M | M. nigra + M + AG | Streptomycin 1 | Ampicilin 1 | ||
| Bacillus cereus | MIC/MBC | 5.01/10.02 | 6.81/6.81 | 8.52/8.52 | 8.52/8.52 | 0.10/0.20 | 0.25/0.40 |
| Staphylococcus aureus | MIC/MBC | 20.04/20.04 | 3.41/6.81 | 4.26/8.52 | 4.26/8.52 | 0.17/0.25 | 0.34/0.37 |
| Listeria monocytogenes | MIC/MBC | 10.02/20.04 | 3.41/3.41 | 4.26/4.26 | 4.26/4.26 | 0.20/0.30 | 0.40/0.50 |
| Escherichia coli | MIC/MBC | 2.50/5.01 | 3.41/3.41 | 4.26/8.52 | 4.26/8.52 | 0.20/0.30 | 0.40/0.50 |
| Enterobacter cloacae | MIC/MBC | 10.02/20.04 | 1.7/1.7 | 2.13/2.13 | 4.26/4.26 | 0.043/0.25 | 0.086/0.37 |
| Salmonella Typhimurium | MIC/MBC | 10.02/20.04 | 1.7/3.41 | 2.13/4.26 | 4.26/4.26 | 0.20/0.30 | 0.75/1.20 |
| Antifungal activity (MIC and MFC values, mg/mL) | |||||||
| M. nigra extract | M. nigra control | M. nigra + M | M. nigra + M + AG | Ketoconazole 1 | Bifonazole 1 | ||
| Aspergillus fumigatus | MIC/MFC | 5.01/10.02 | 13.63/27.27 | 17.05/17.05 | 8.52/17.05 | 0.38/0.95 | 0.48/0.64 |
| Aspergillus versicolor | MIC/MFC | 2.51/5.01 | 6.81/27.27 | 4.26/8.52 | 4.26/8.52 | 0.20/0.50 | 0.10/0.20 |
| Aspergillus niger | MIC/MFC | 20.04/>20.04 | 27.27/>27.27 | 34.09/>34.09 | 17.05/34.09 | 0.20/0.50 | 0.15/0.20 |
| Penicillium funiculosum | MIC/MFC | 2.51/5.01 | 13.63/27.27 | 17.05/34.09 | 8.52/34.09 | 0.20/0.50 | 0.20/0.25 |
| Penicillium ochrochloron | MIC/MFC | 2.51/5.01 | 27.27/>27.27 | 34.09/>34.09 | 34.09/>34.09 | 1.00/1.50 | 0.20/0.25 |
| Trichoderma viride | MIC/MFC | 1.25/2.51 | 2.13/13.63 | 2.13/4.26 | 4.26/8.52 | 1.00/1.00 | 0.15/0.20 |
| Antioxidant Activity (IC50 Values, µg/mL) | |||||||
|---|---|---|---|---|---|---|---|
| R. fruticosus extract | R. fruticosus control | R. fruticosus + M | R. fruticosus + M + AG | Trolox 1 | |||
| TBARS assay | 100 ± 2c | 78.4 ± 0.8a | 101 ± 2c | 94.9 ± 0.2b | 139 ± 5b | ||
| OxHLIA assay | 60 min | 120 ± 7c | 81 ± 3a | 108 ± 5b | 106 ± 5b | 85 ± 2a | |
| 120 min | 215 ± 3b | 194 ± 6a | 250 ± 4c | 248 ± 5c | 183 ± 4a | ||
| Antibacterial activity (MIC and MBC values, mg/mL) | |||||||
| R. fruticosus extract | R. fruticosus control | R. fruticosus + M | R. fruticosus + M + AG | Streptomycin 1 | Ampicilin 1 | ||
| Bacillus cereus | MIC/MBC | 5.03/10.06 | 2.53/5.06 | 2.51/5.02 | 5.03/10.06 | 0.10/0.20 | 0.25/0.40 |
| Staphylococcus aureus | MIC/MBC | 13.41/20.12 | 5.06/13.49 | 20.08/20.08 | 10.06/20.12 | 0.17/0.25 | 0.34/0.37 |
| Listeria monocytogenes | MIC/MBC | 10.06/20.12 | 5.06/10.12 | 10.04/20.08 | 10.06/26.83 | 0.20/0.30 | 0.40/0.50 |
| Escherichia coli | MIC/MBC | 2.51/2.51 | 1.27/2.53 | 2.51/5.02 | 1.26/2.52 | 0.20/0.30 | 0.40/0.50 |
| Enterobacter cloacae | MIC/MBC | 13.41/20.12 | 5.06/10.12 | 10.04/20.08 | 5.03/10.06 | 0.043/0.25 | 0.086/0.37 |
| Salmonella typhimurium | MIC/MBC | 13.41/20.12 | 5.06/10.12 | 10.04/20.08 | 5.03/10.06 | 0.20/0.30 | 0.75/1.20 |
| Antifungal activity (MIC and MFC values, mg/mL) | |||||||
| R. fruticosus extract | R. fruticosus control | R. fruticosus + M | R. fruticosus + M + AG | Ketoconazole 1 | Bifonazole 1 | ||
| Aspergillus fumigatus | MIC/MFC | 5.03/10.06 | 2.53/5.06 | 2.51/5.02 | 5.03/10.06 | 0.38/0.95 | 0.48/0.64 |
| Aspergillus versicolor | MIC/MFC | 20.12/>20.12 | 1.27/2.53 | 1.26/2.52 | 1.26/2.52 | 0.20/0.50 | 0.10/0.20 |
| Aspergillus niger | MIC/MFC | 20.12/>20.12 | 5.06/10.12 | 3.77/5.02 | 5.03/10.06 | 0.20/0.50 | 0.15/0.20 |
| Penicillium funiculosum | MIC/MFC | 2.52/5.03 | 1.27/2.53 | 2.51/5.02 | 2.52/5.03 | 0.20/0.50 | 0.20/0.25 |
| Penicillium ochrochloron | MIC/MFC | 2.52/5.03 | 5.06/10.12 | 2.51/5.02 | 5.03/10.06 | 1.00/1.50 | 0.20/0.25 |
| Trichoderma viride | MIC/MFC | 1.26/2.52 | 0.91/1.27 | 2.51/5.02 | 1.26/2.52 | 1.00/1.00 | 0.15/0.20 |
| Initial Counts (before Pasteurization) (log10 CFU/mL) | Counts after Pasteurization at 80 °C (log10 CFU/mL) | Counts after Pasteurization at 90 °C (log10 CFU/mL) | log10 Cycle Reduction in Contaminated Samples without Pasteurization | log10 Cycle Reduction after Pasteurization at 80 °C | log10 Cycle Reduction after Pasteurization at 90 °C | |
|---|---|---|---|---|---|---|
| E. coli | 5.36 ± 0.02 | nd | nd | 3.57 | 8.93 | 8.93 |
| B. cereus | 3.46 ± 0.06 | nd | nd | 3.75 | 7.21 | 7.21 |
| A. parasiticus | 4.44 ± 0.05b | 2.82 ± 0.05a | nd | 4.33 | 5.96 | 8.77 |
| Z. rouxii | 3.59 ± 0.03b | 2.31 ± 0.08a | nd | 4.02 | 5.26 | 7.61 |
| Aerobic Mesophilic Microorganisms | Coliforms | Yeasts | Moulds | ||
|---|---|---|---|---|---|
| Room temperature | |||||
| Storage time (ST) | 0 weeks | 1 ± 2 | nd | 1 ± 2 | 3.14 ± 0.19 |
| 12 weeks | 1 ± 2 | nd | nd | nd | |
| p-value (n = 15) | Student’s t test | 0.407 | - | <0.001 | <0.001 |
| Formulation (F) | Control | 3.5 ± 0.1 | nd | 2 ± 2 | 2 ± 2 |
| M | nd | nd | nd | 1 ± 2 | |
| M + AG | nd | nd | nd | 2 ± 2 | |
| p-value (n = 10) | Tukey’s HSD test | <0.001 | - | <0.001 | <0.001 |
| ST×F (n = 30) | p-value | 0.498 | - | <0.001 | <0.001 |
| Refrigerated temperature | |||||
| Storage time (ST) | 0 weeks | 1 ± 2 | nd | 1 ± 1 | 3.1 ± 0.2 |
| 12 weeks | 3.4 ± 0.7 | nd | 1 ± 1 | 2.9 ± 0.1 | |
| p-value (n = 15) | Student’s T test | <0.001 | <0.001 | <0.001 | <0.001 |
| Formulation (F) | Control | 3.8 ± 0.2 | nd | 2 ± 2 | 3.2 ± 0.2 |
| M | 2 ± 2 | nd | nd | 2.89 ± 0.08 | |
| M + AG | 1 ± 1 | nd | 1 ± 2 | 3.15 ± 0.06 | |
| p-value (n = 10) | Tukey’s HSD test | <0.001 | - | <0.001 | <0.001 |
| ST × F (n = 30) | p-value | <0.001 | - | <0.001 | <0.001 |
| Aerobic Mesophilic Microorganisms | Coliforms | Yeasts | Moulds | ||
|---|---|---|---|---|---|
| Room temperature | |||||
| Storage time (ST) | 0 weeks | 2 ± 2 | nd | 2 ± 1 | 1 ± 1 |
| 12 weeks | 3.0 ± 0.4 | nd | 2 ± 1 | 1 ± 1 | |
| p-value (n = 15) | Student’s T test | <0.001 | - | <0.001 | 0.032 |
| Formulation (F) | Control | 3.7 ± 0.5 | nd | 3.12 ± 0.06 | 2.9 ± 0.1 |
| M | 2.5 ± 0.1 | nd | 3.0 ± 0.3 | nd | |
| M + AG | 2 ± 2 | nd | nd | nd | |
| p-value (n = 10) | Tukey’s HSD test | <0.001 | - | <0.001 | - |
| ST × F (n = 30) | p-value | <0.001 | - | <0.001 | 0.016 |
| Refrigerated temperature | |||||
| Storage time (ST) | 0 weeks | 2 ± 2 | nd | 2 ± 1 | 1 ± 1 |
| 12 weeks | 3.32 ± 0.08 | nd | 2 ± 1 | 2 ± 2 | |
| p-value (n = 15) | Student’s T test | 0.028 | - | 0.114 | 0.942 |
| Formulation (F) | Control | 3.8 ± 0.4 | nd | 3.05 ± 0.09 | 2.9 ± 0.2a |
| M | 2.8 ± 0.5 | nd | 3.0 ± 0.3 | 2 ± 2b | |
| M + AG | 2 ± 2 | nd | nd | nd | |
| p-value (n = 10) | Tukey’s HSD test | <0.001 | - | <0.001 | <0.001 |
| ST × F (n = 30) | p-value | <0.001 | - | <0.001 | 0.855 |
Publisher’s Note: MDPI stays neutral with regard to jurisdictional claims in published maps and institutional affiliations. |
© 2021 by the authors. Licensee MDPI, Basel, Switzerland. This article is an open access article distributed under the terms and conditions of the Creative Commons Attribution (CC BY) license (https://creativecommons.org/licenses/by/4.0/).
Share and Cite
Vega, E.N.; Molina, A.K.; Pereira, C.; Dias, M.I.; Heleno, S.A.; Rodrigues, P.; Fernandes, I.P.; Barreiro, M.F.; Stojković, D.; Soković, M.; et al. Anthocyanins from Rubus fruticosus L. and Morus nigra L. Applied as Food Colorants: A Natural Alternative. Plants 2021, 10, 1181. https://doi.org/10.3390/plants10061181
Vega EN, Molina AK, Pereira C, Dias MI, Heleno SA, Rodrigues P, Fernandes IP, Barreiro MF, Stojković D, Soković M, et al. Anthocyanins from Rubus fruticosus L. and Morus nigra L. Applied as Food Colorants: A Natural Alternative. Plants. 2021; 10(6):1181. https://doi.org/10.3390/plants10061181
Chicago/Turabian StyleVega, Erika N., Adriana K. Molina, Carla Pereira, Maria Inês Dias, Sandrina A. Heleno, Paula Rodrigues, Isabel P. Fernandes, Maria Filomena Barreiro, Dejan Stojković, Marina Soković, and et al. 2021. "Anthocyanins from Rubus fruticosus L. and Morus nigra L. Applied as Food Colorants: A Natural Alternative" Plants 10, no. 6: 1181. https://doi.org/10.3390/plants10061181
APA StyleVega, E. N., Molina, A. K., Pereira, C., Dias, M. I., Heleno, S. A., Rodrigues, P., Fernandes, I. P., Barreiro, M. F., Stojković, D., Soković, M., Carocho, M., Barreira, J. C. M., Ferreira, I. C. F. R., & Barros, L. (2021). Anthocyanins from Rubus fruticosus L. and Morus nigra L. Applied as Food Colorants: A Natural Alternative. Plants, 10(6), 1181. https://doi.org/10.3390/plants10061181