
Metabolic Alterations in Pisum sativum Roots during Plant Growth and Arbuscular Mycorrhiza Development

 , , ,
, , ,  , , , , , and
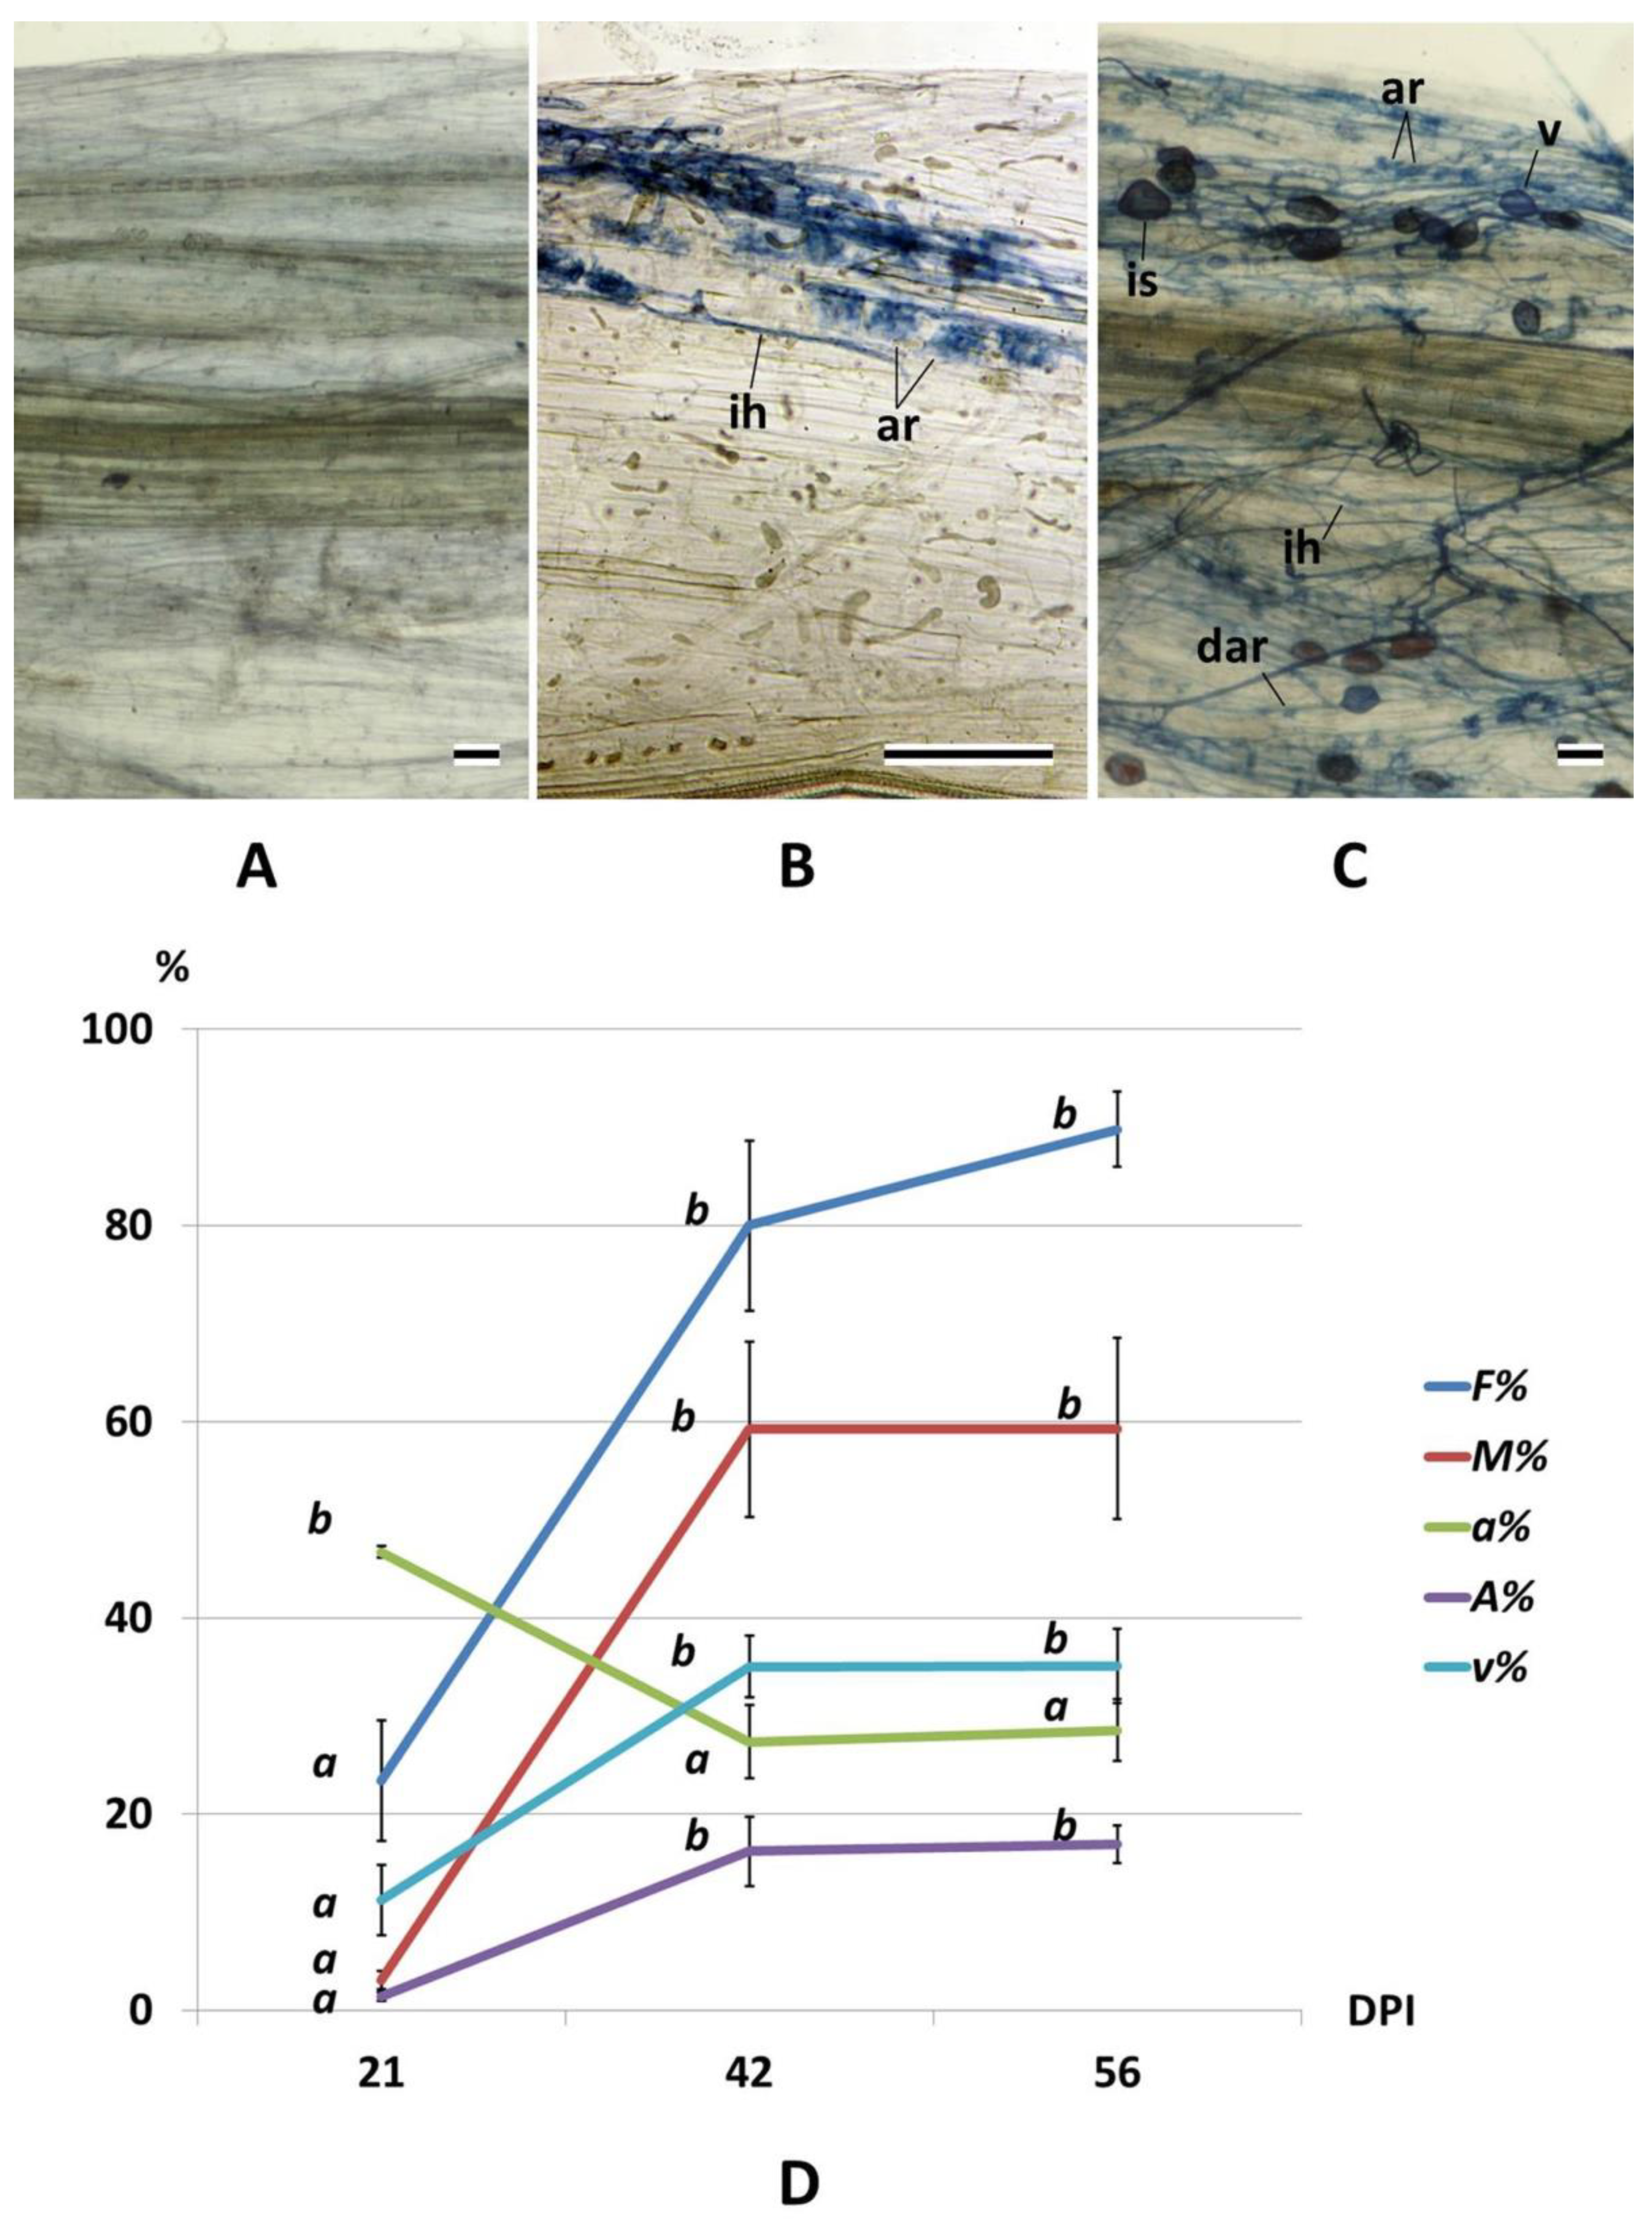
Abstract
1. Introduction
2. Results
2.1. Arbuscular Mycorrhiza Development and Root Growth
2.2. Changes in the Metabolite Profiles of Pea Roots
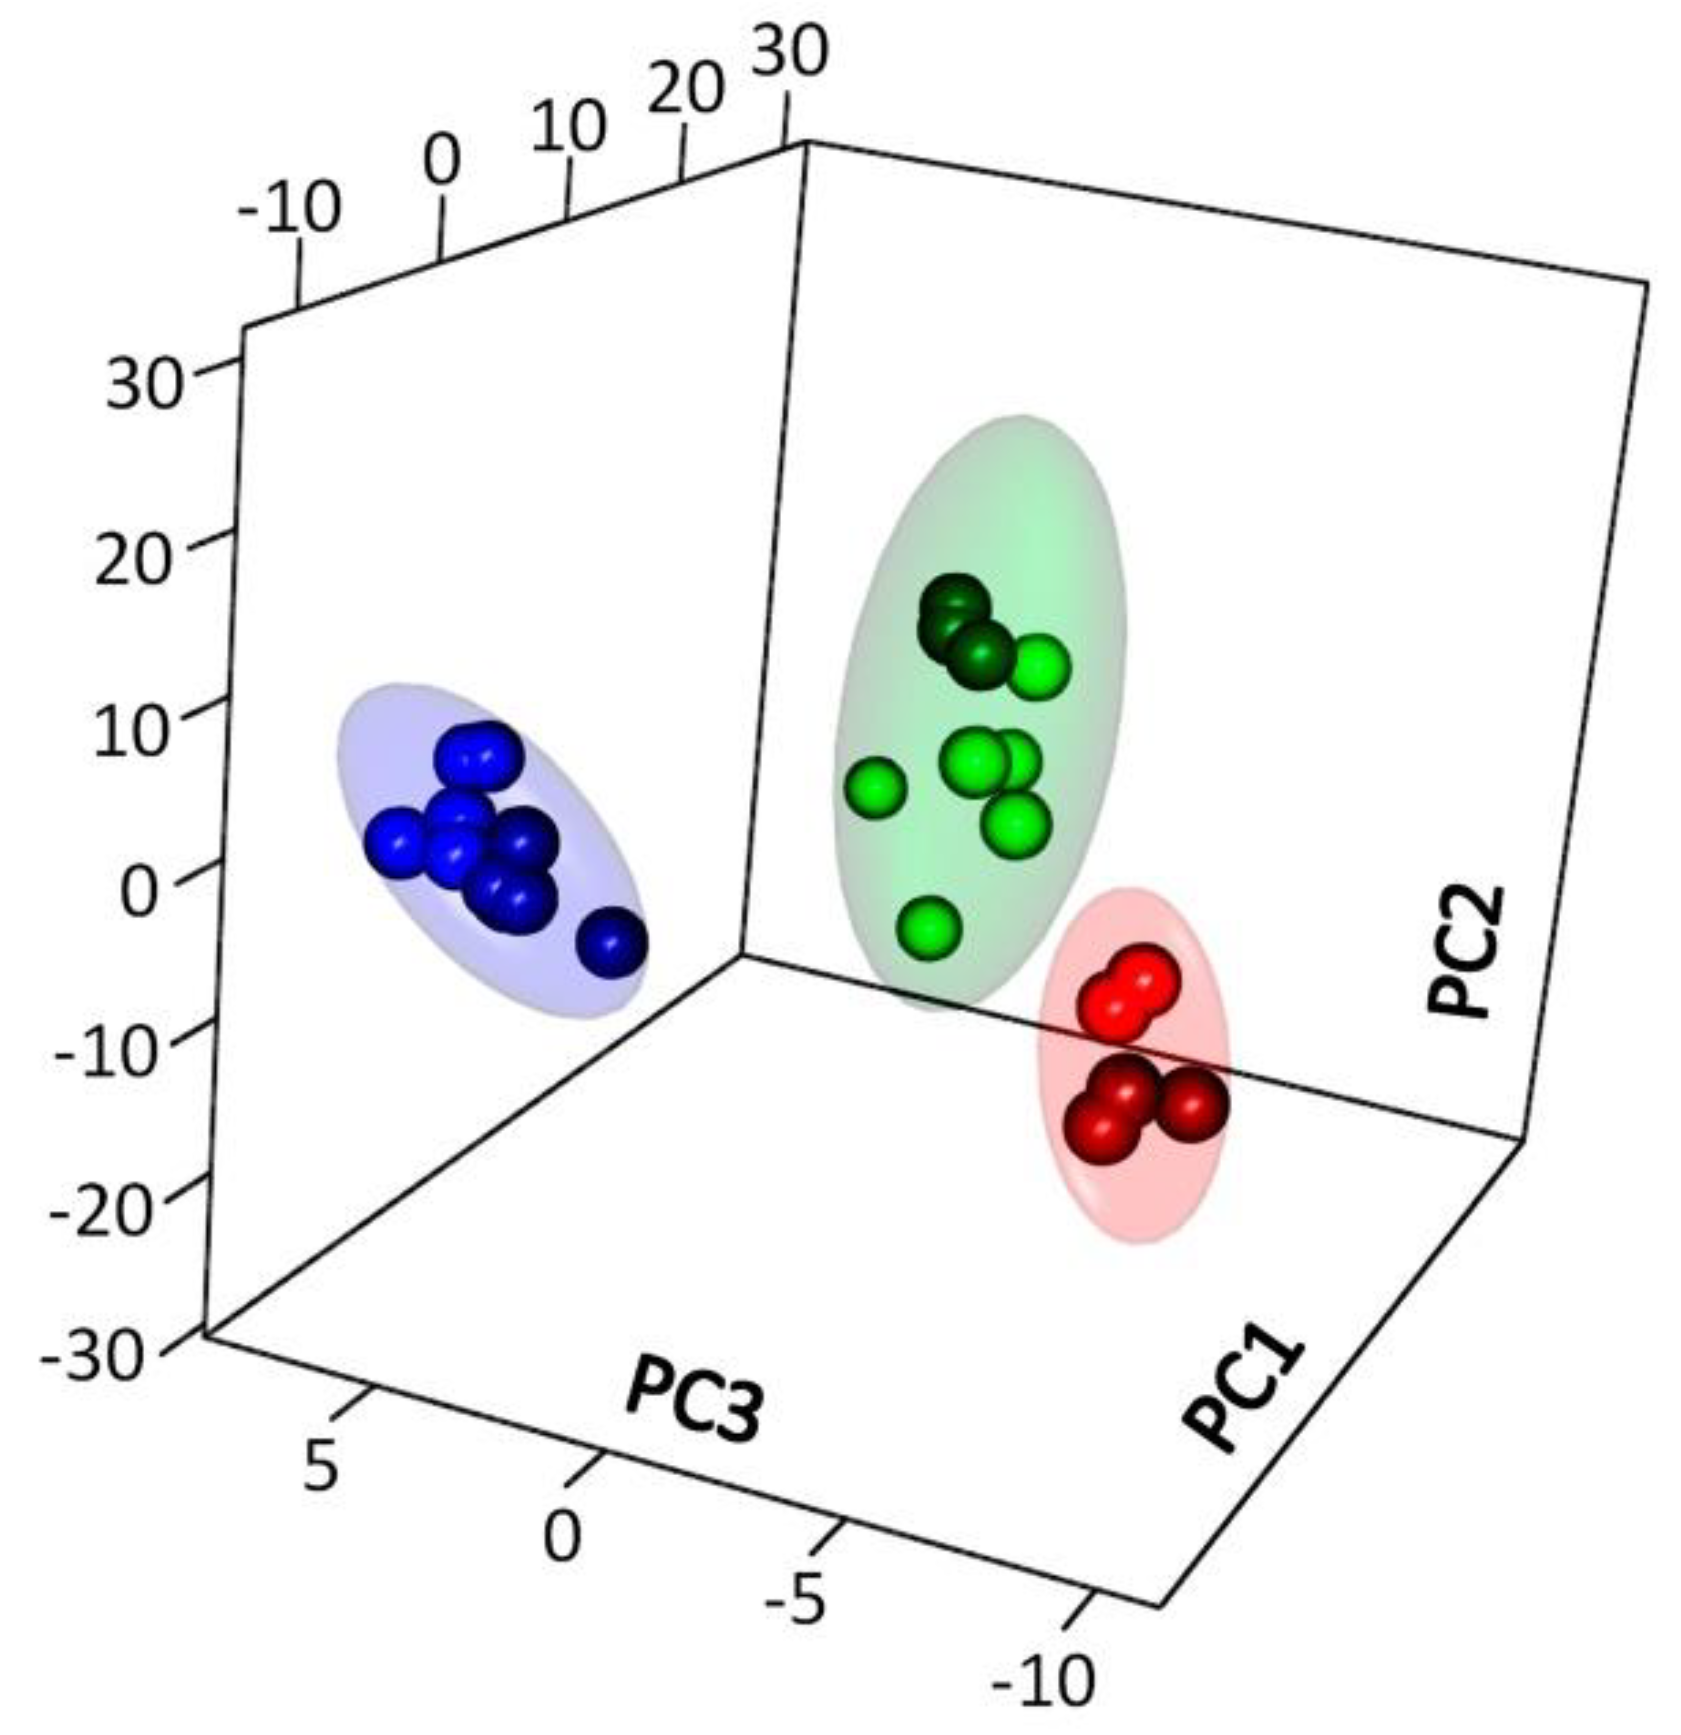
2.2.1. General Characteristics of the Metabolite Profile
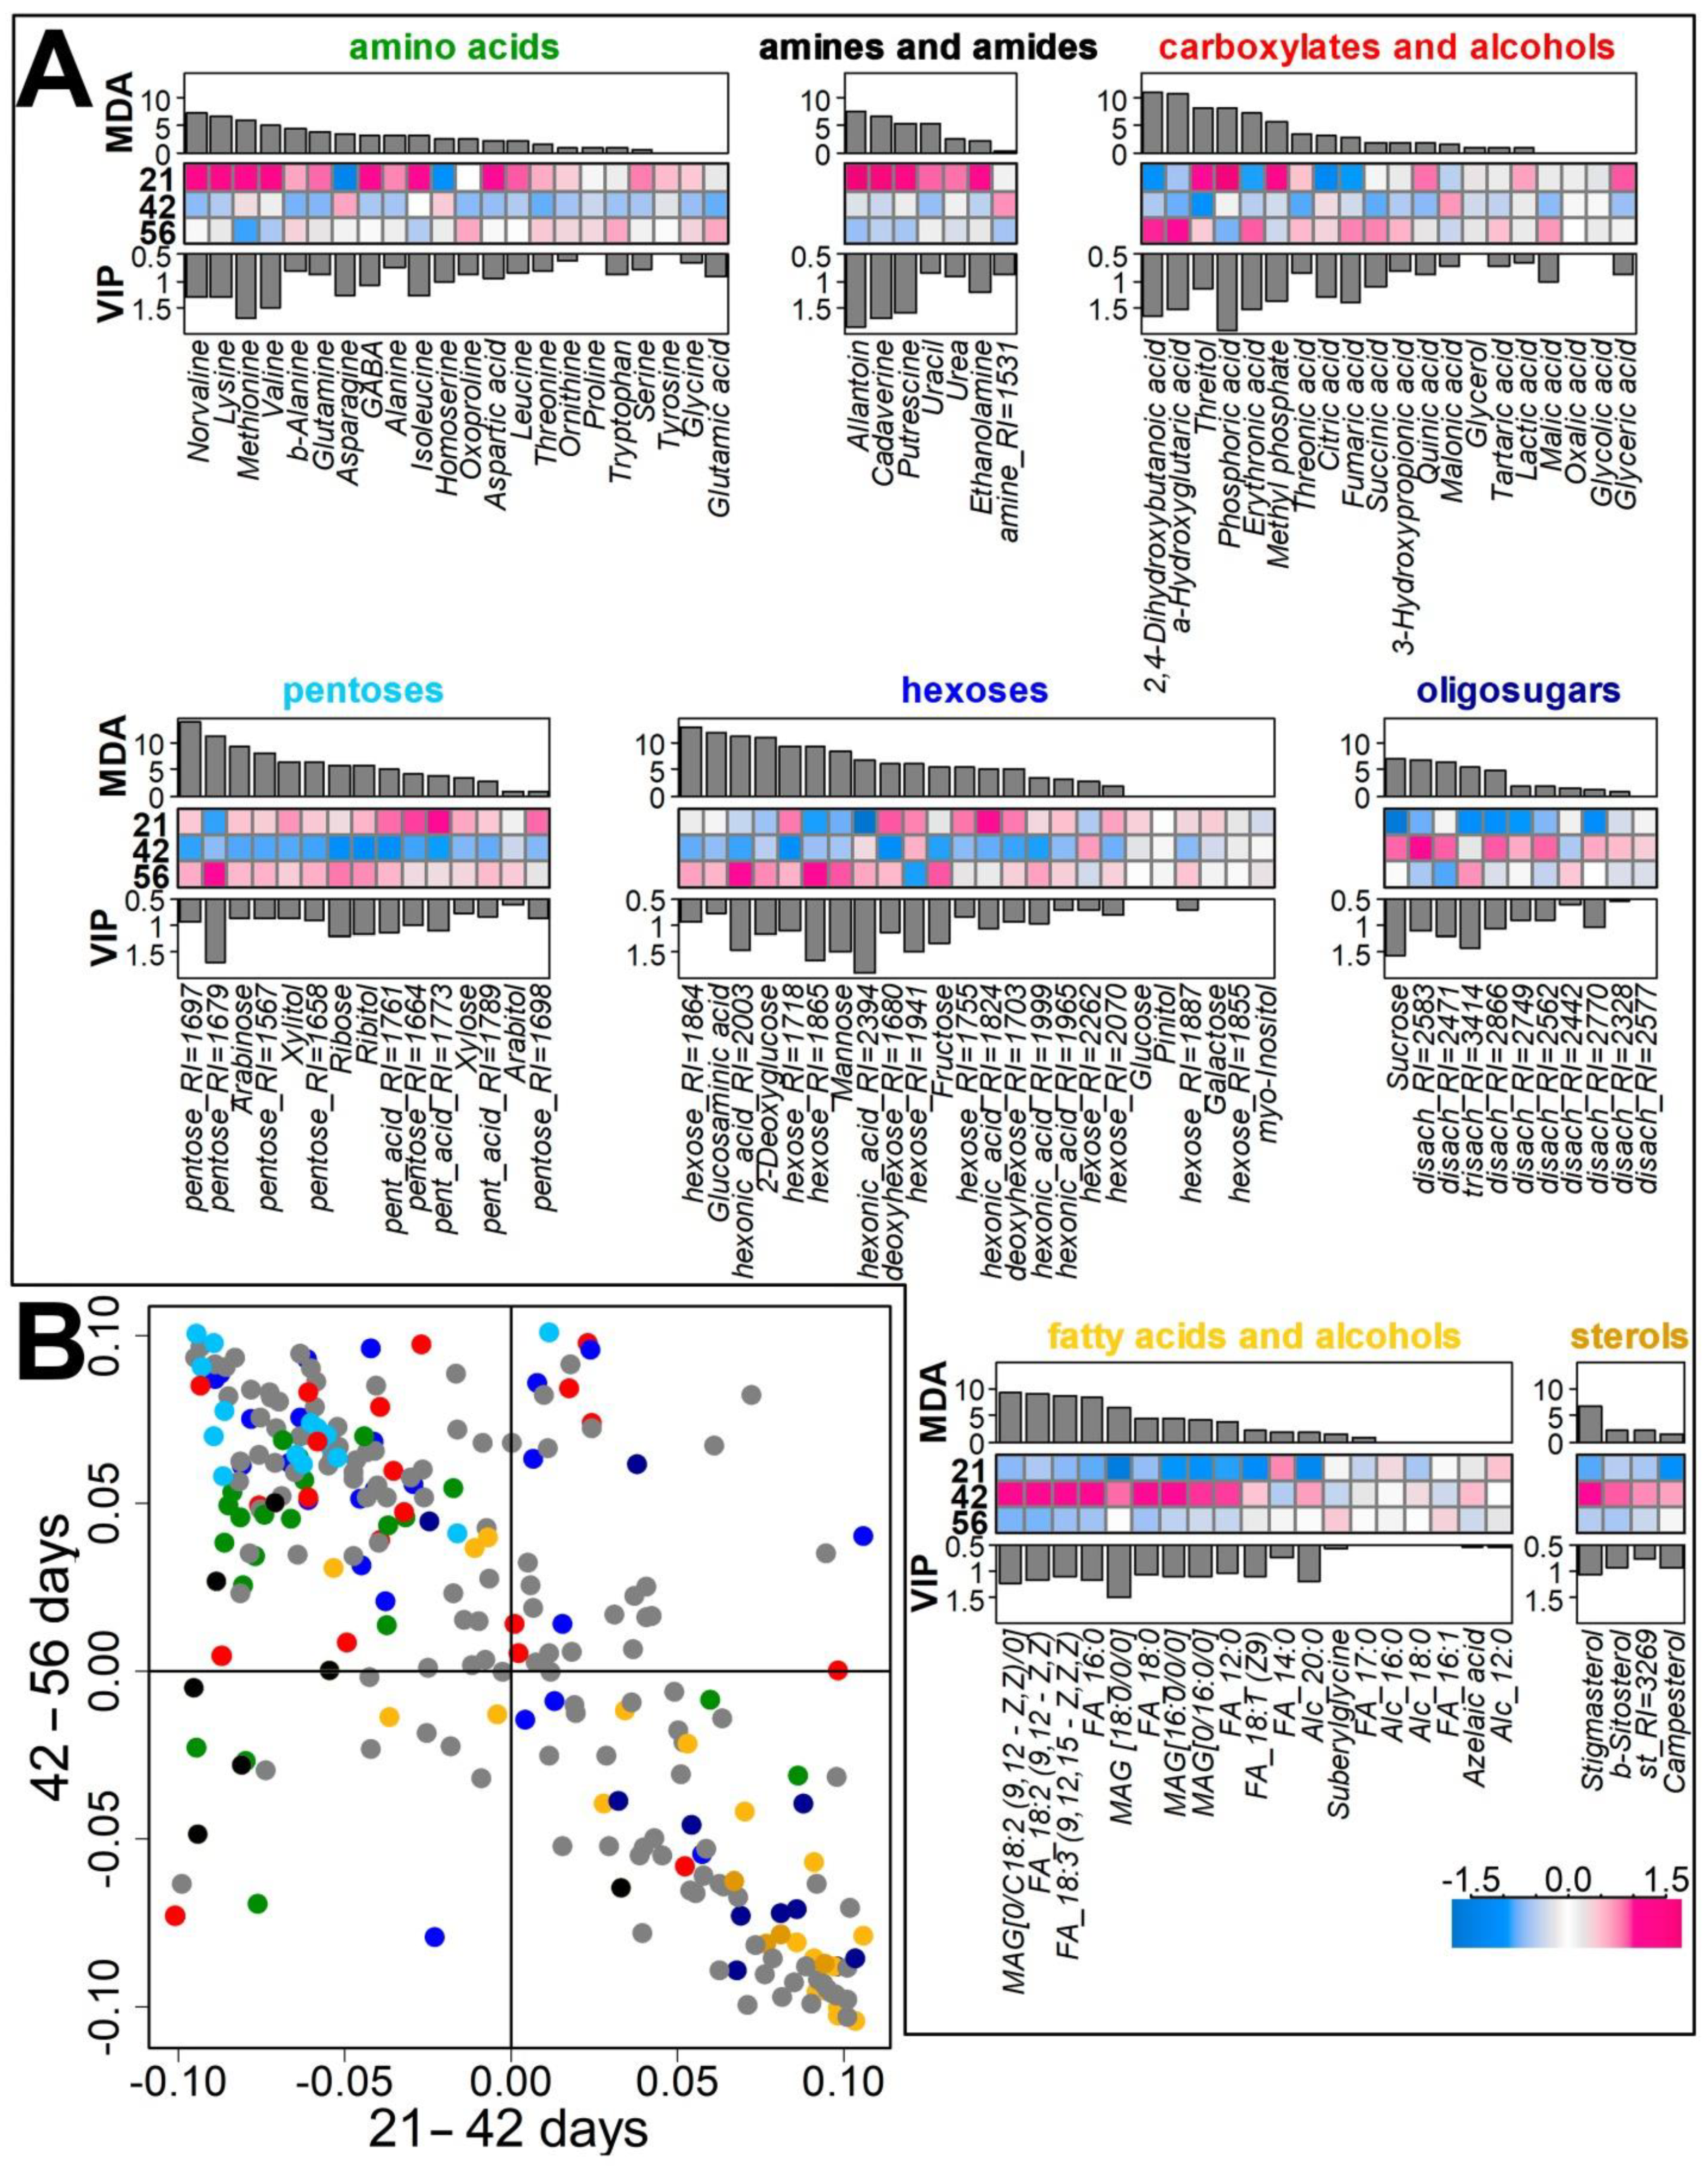
2.2.2. Identification of Differences in the Metabolite Profiles of Pea Roots during Plant Development
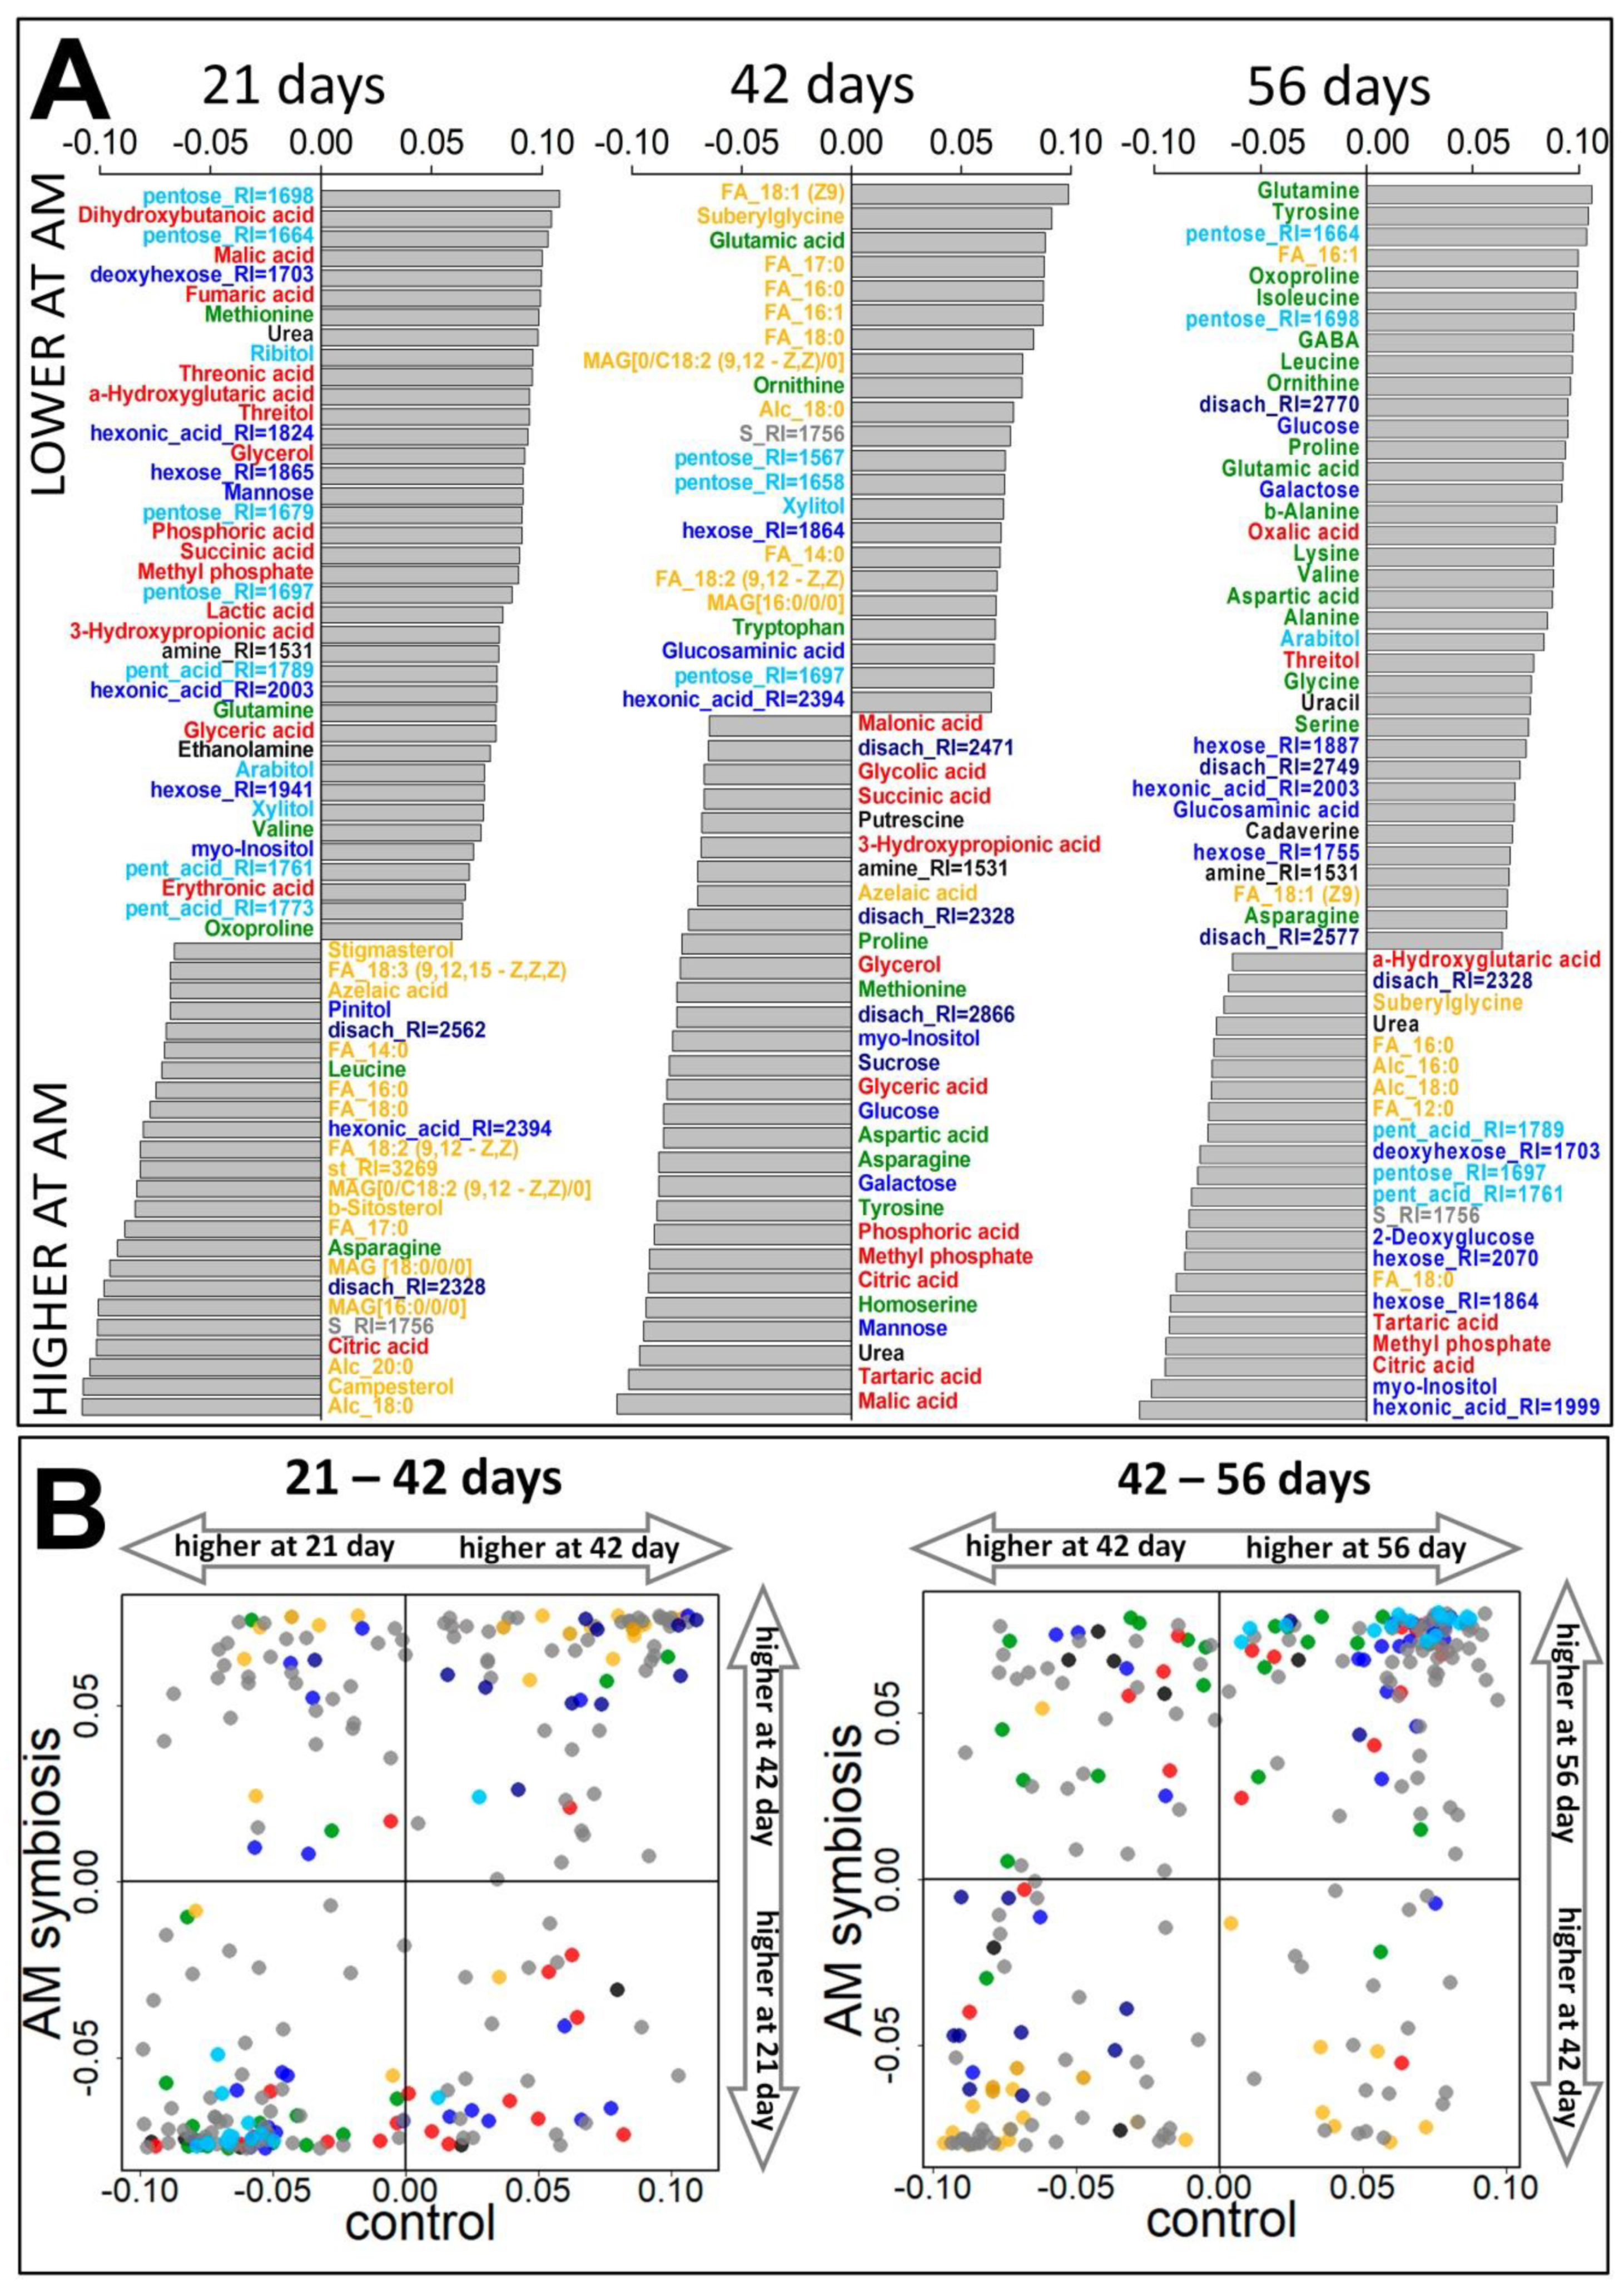
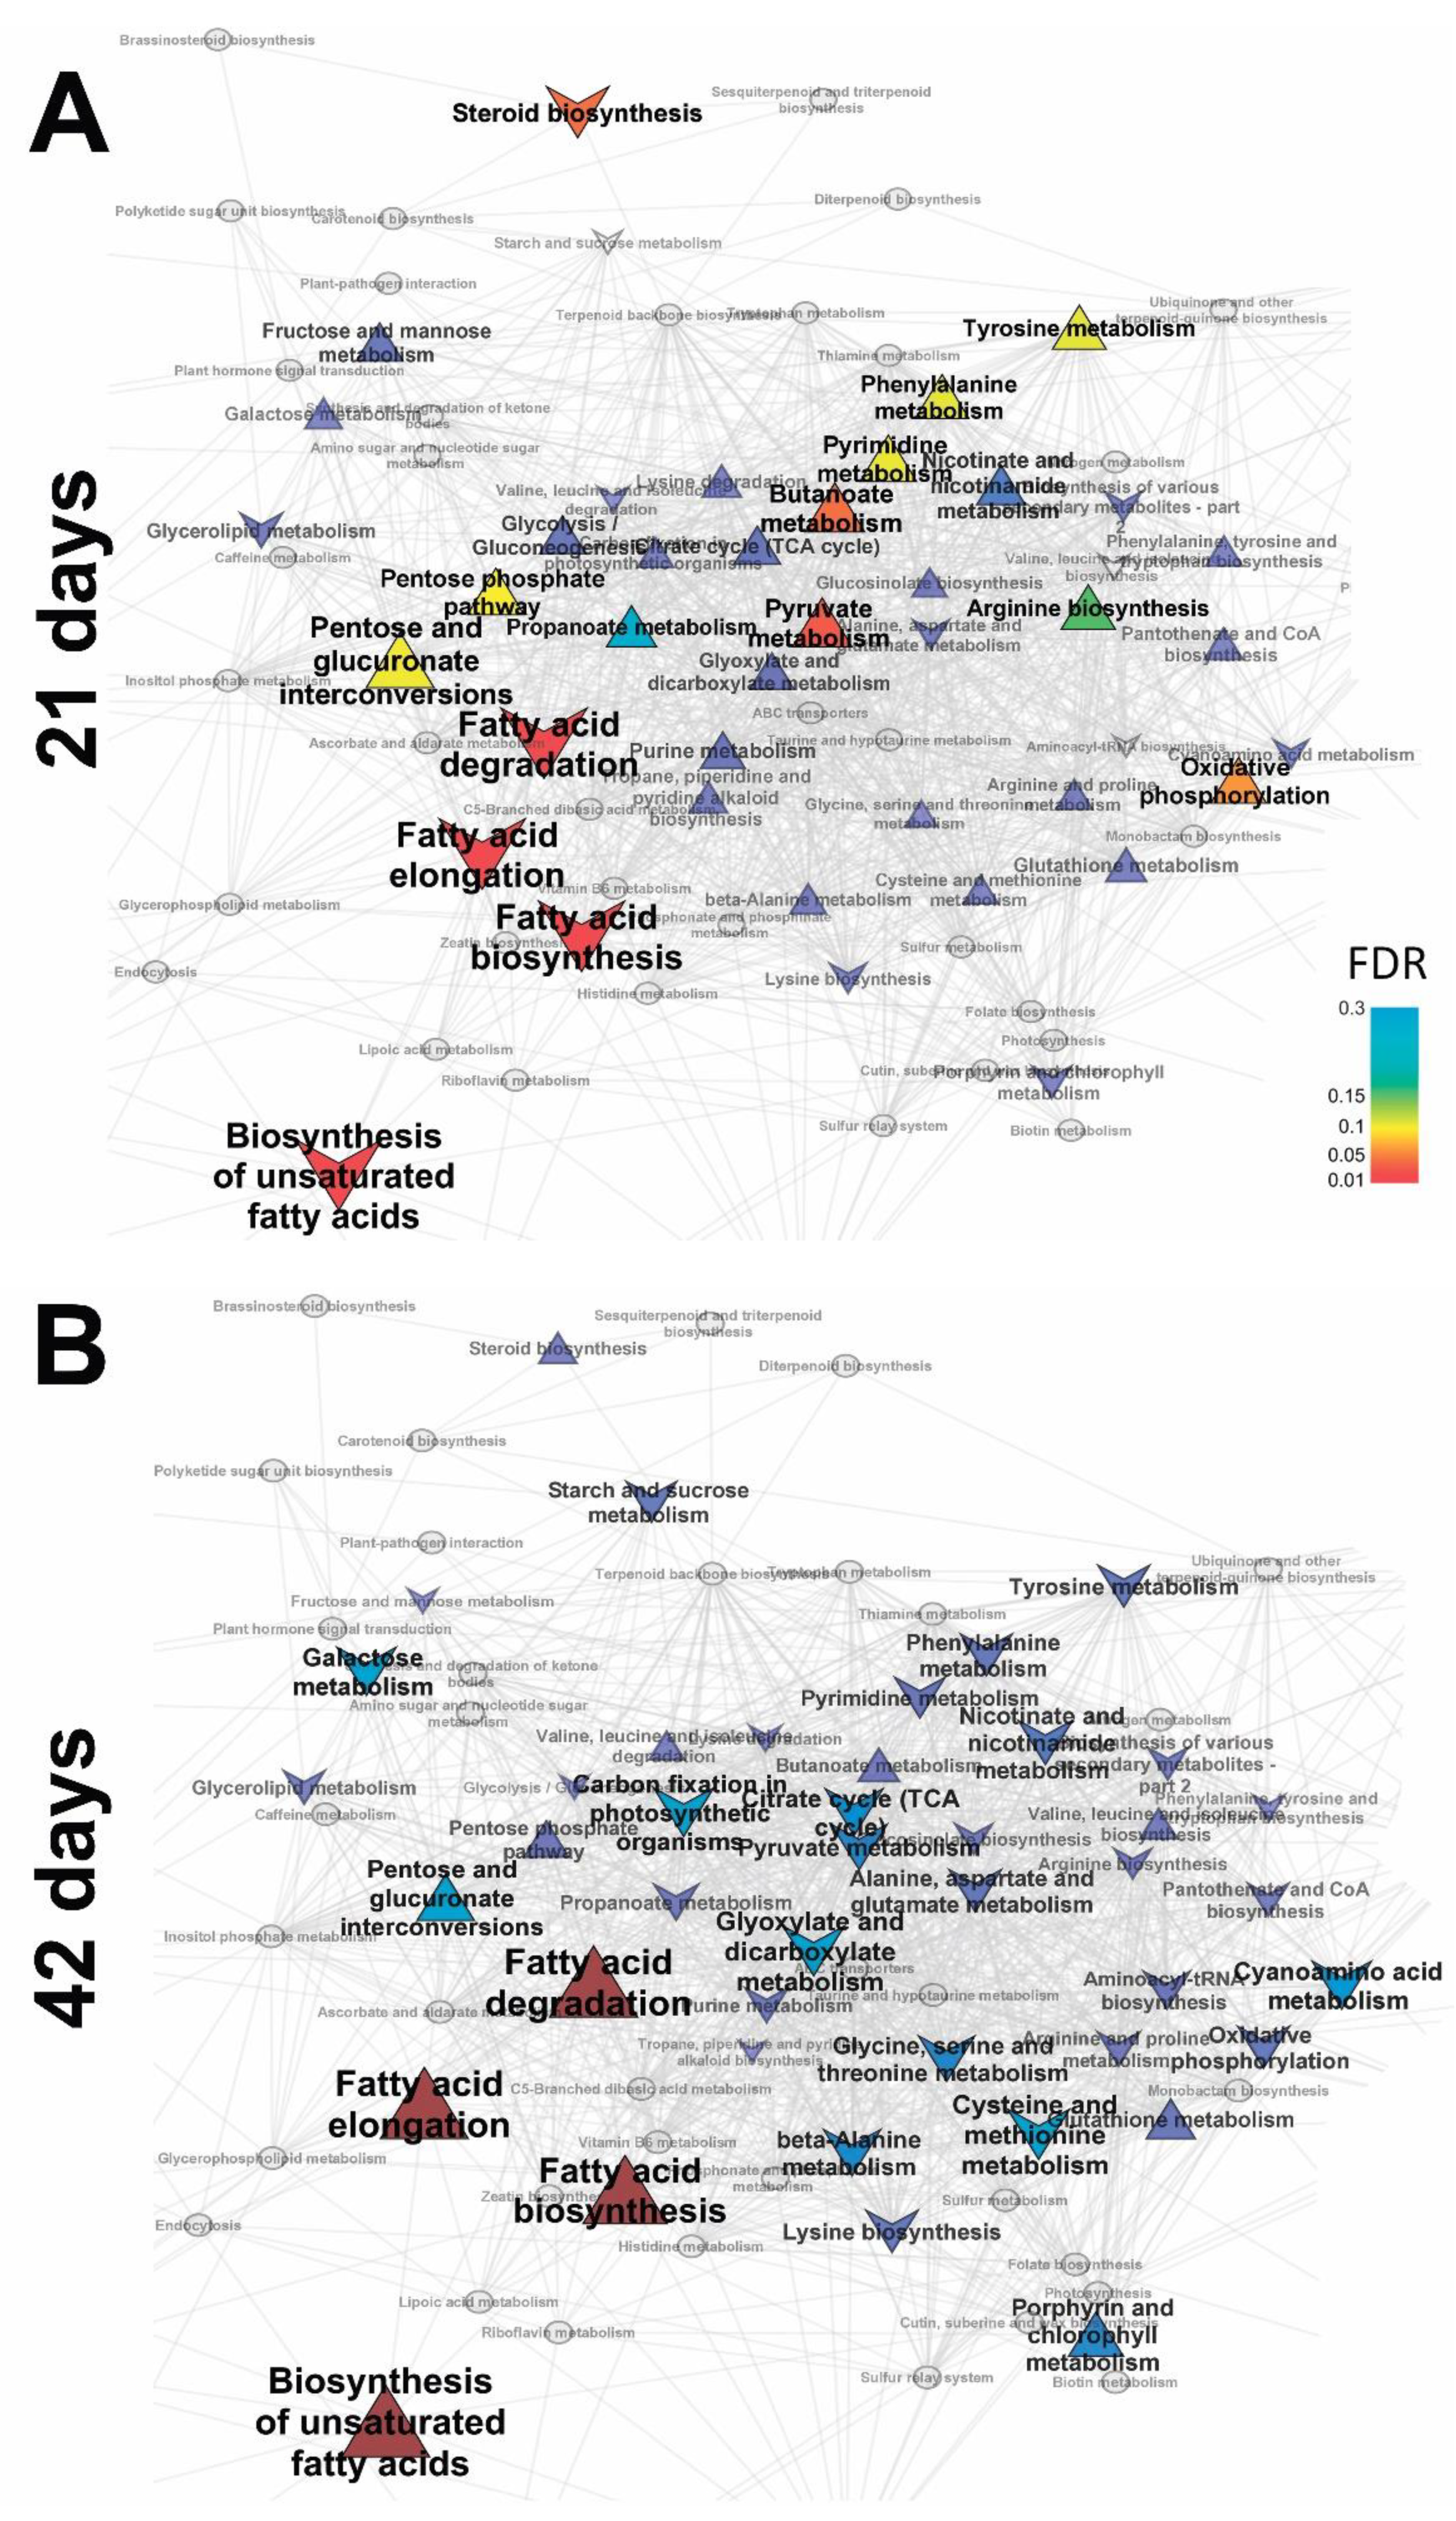
2.3. Identification of Differences in the Metabolite Profiles of Pea Roots during Mycorrhization
2.3.1. Vegetation Stage (21 Days)
2.3.2. Flowering Stage (42 Days)
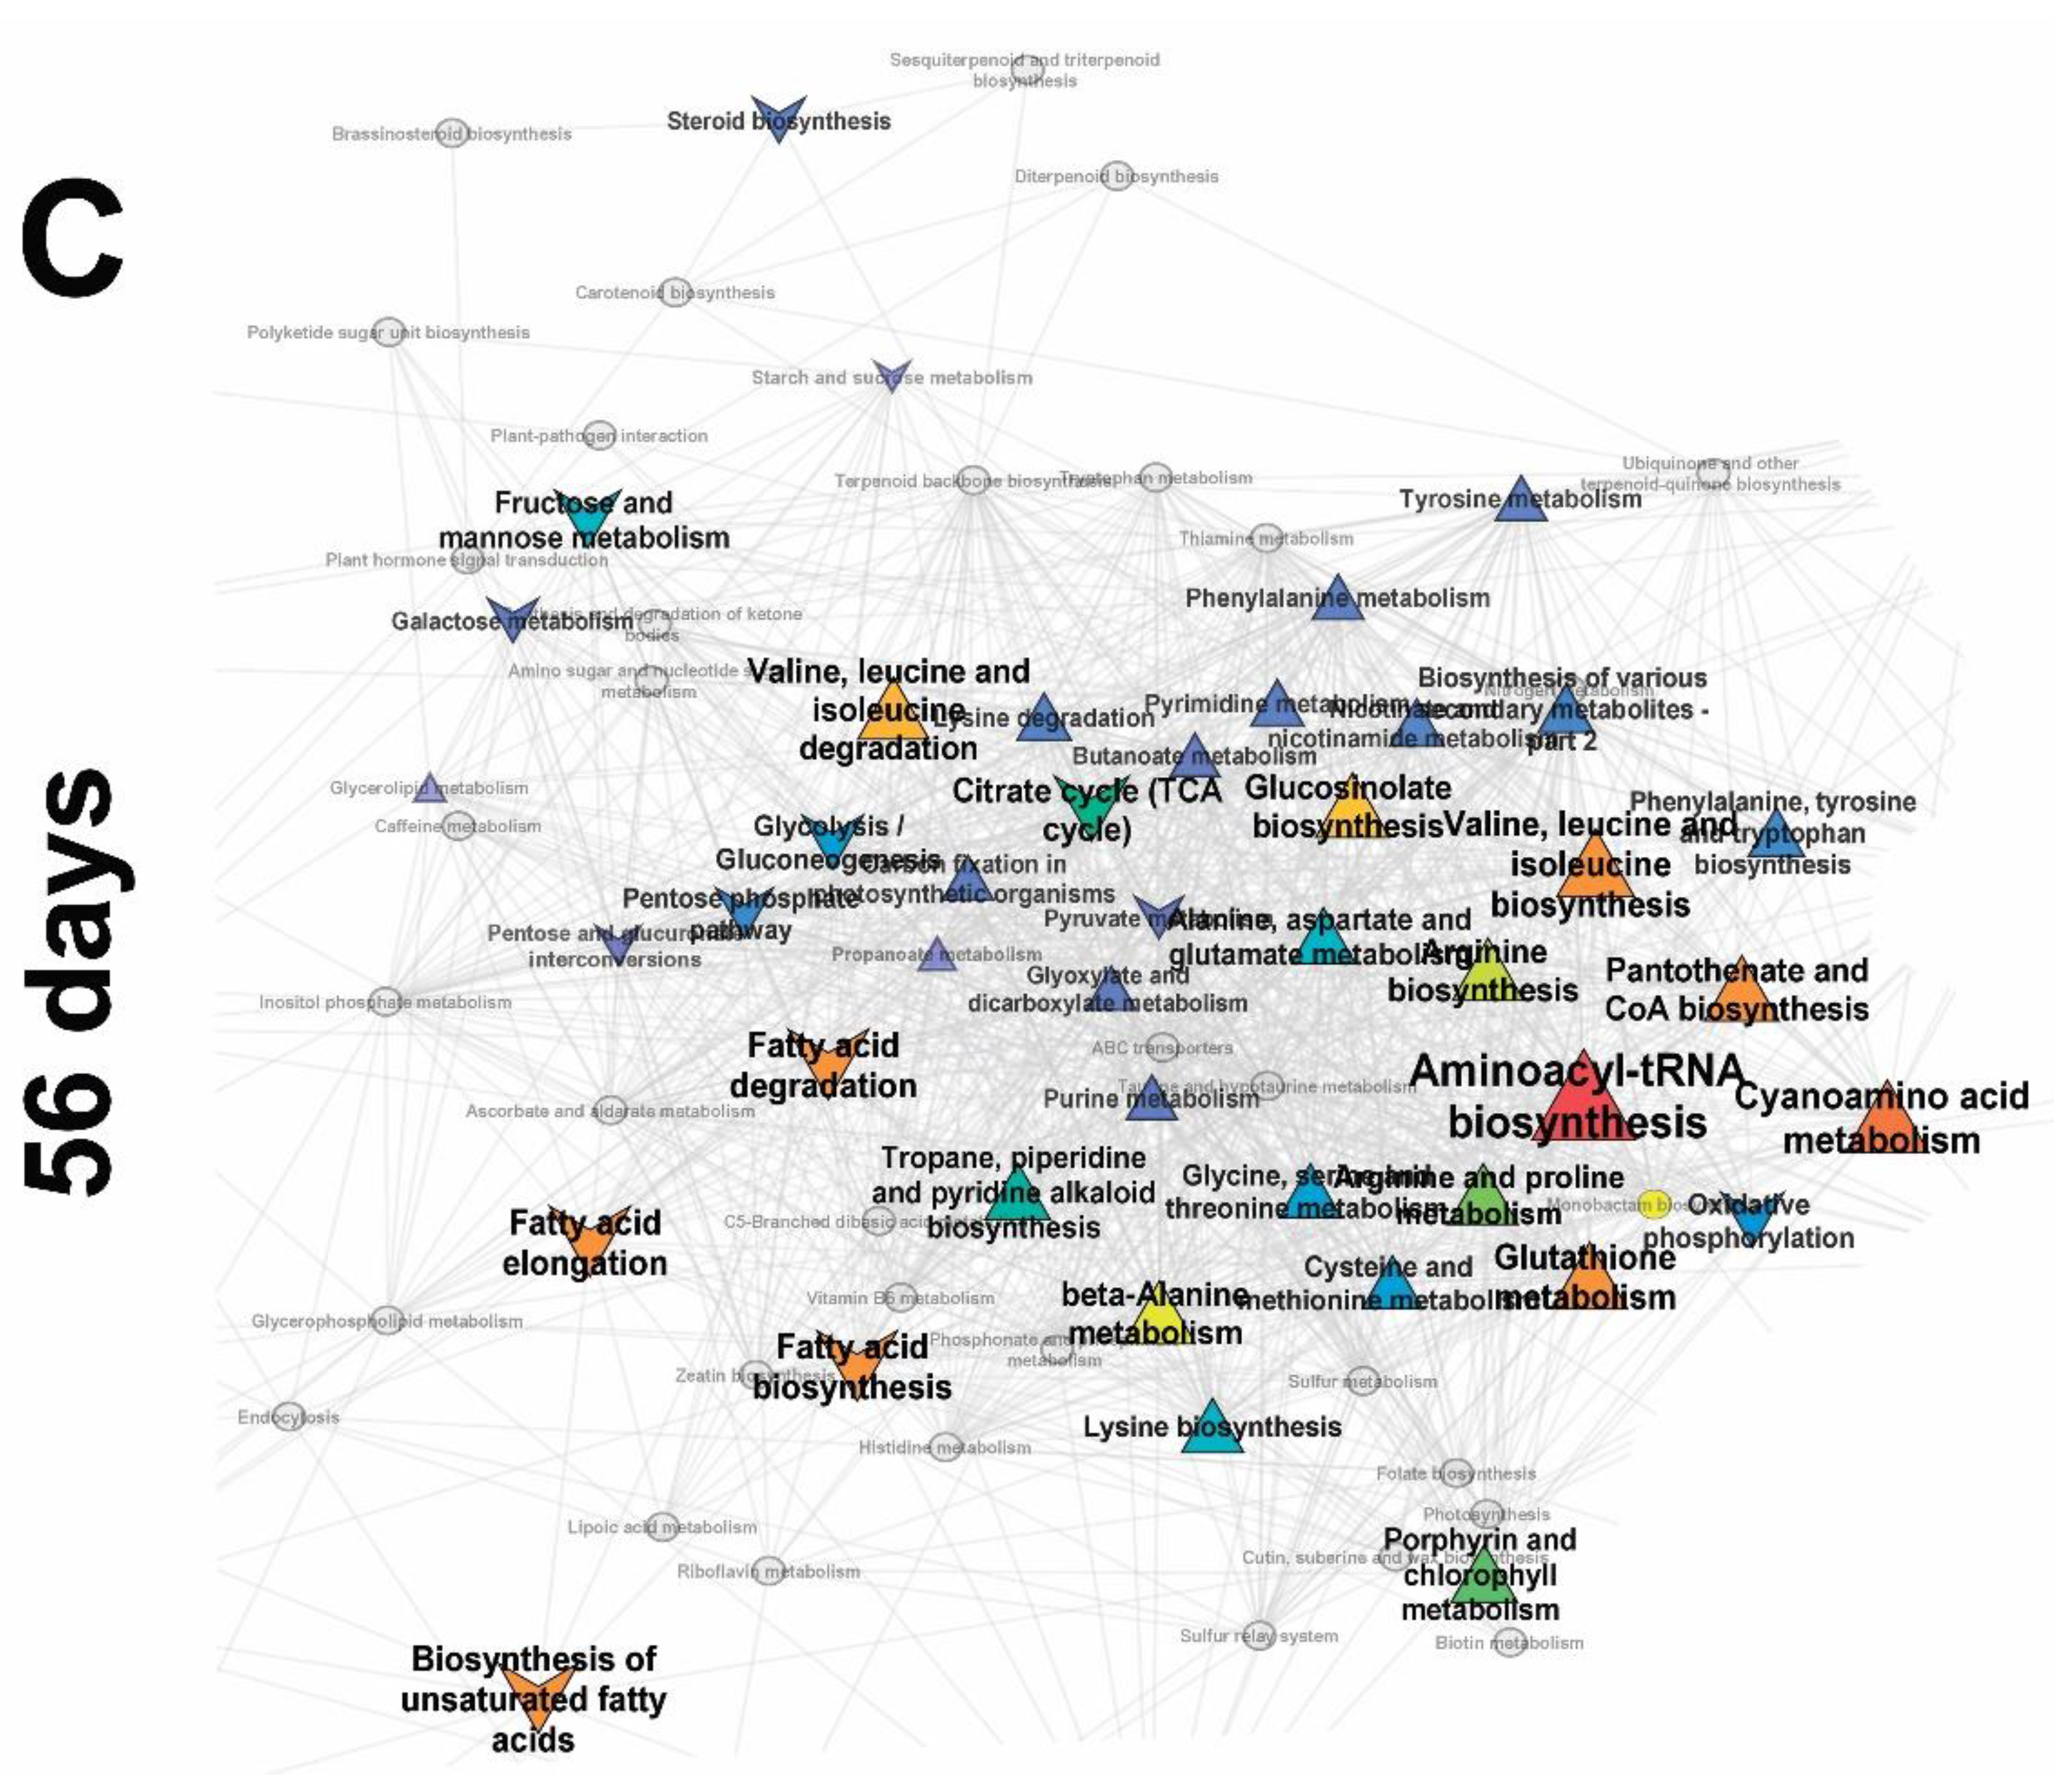
2.3.3. Frooting (Green Pod, 56 Days)
2.3.4. Influence of Mycorrhiza on Plant Development
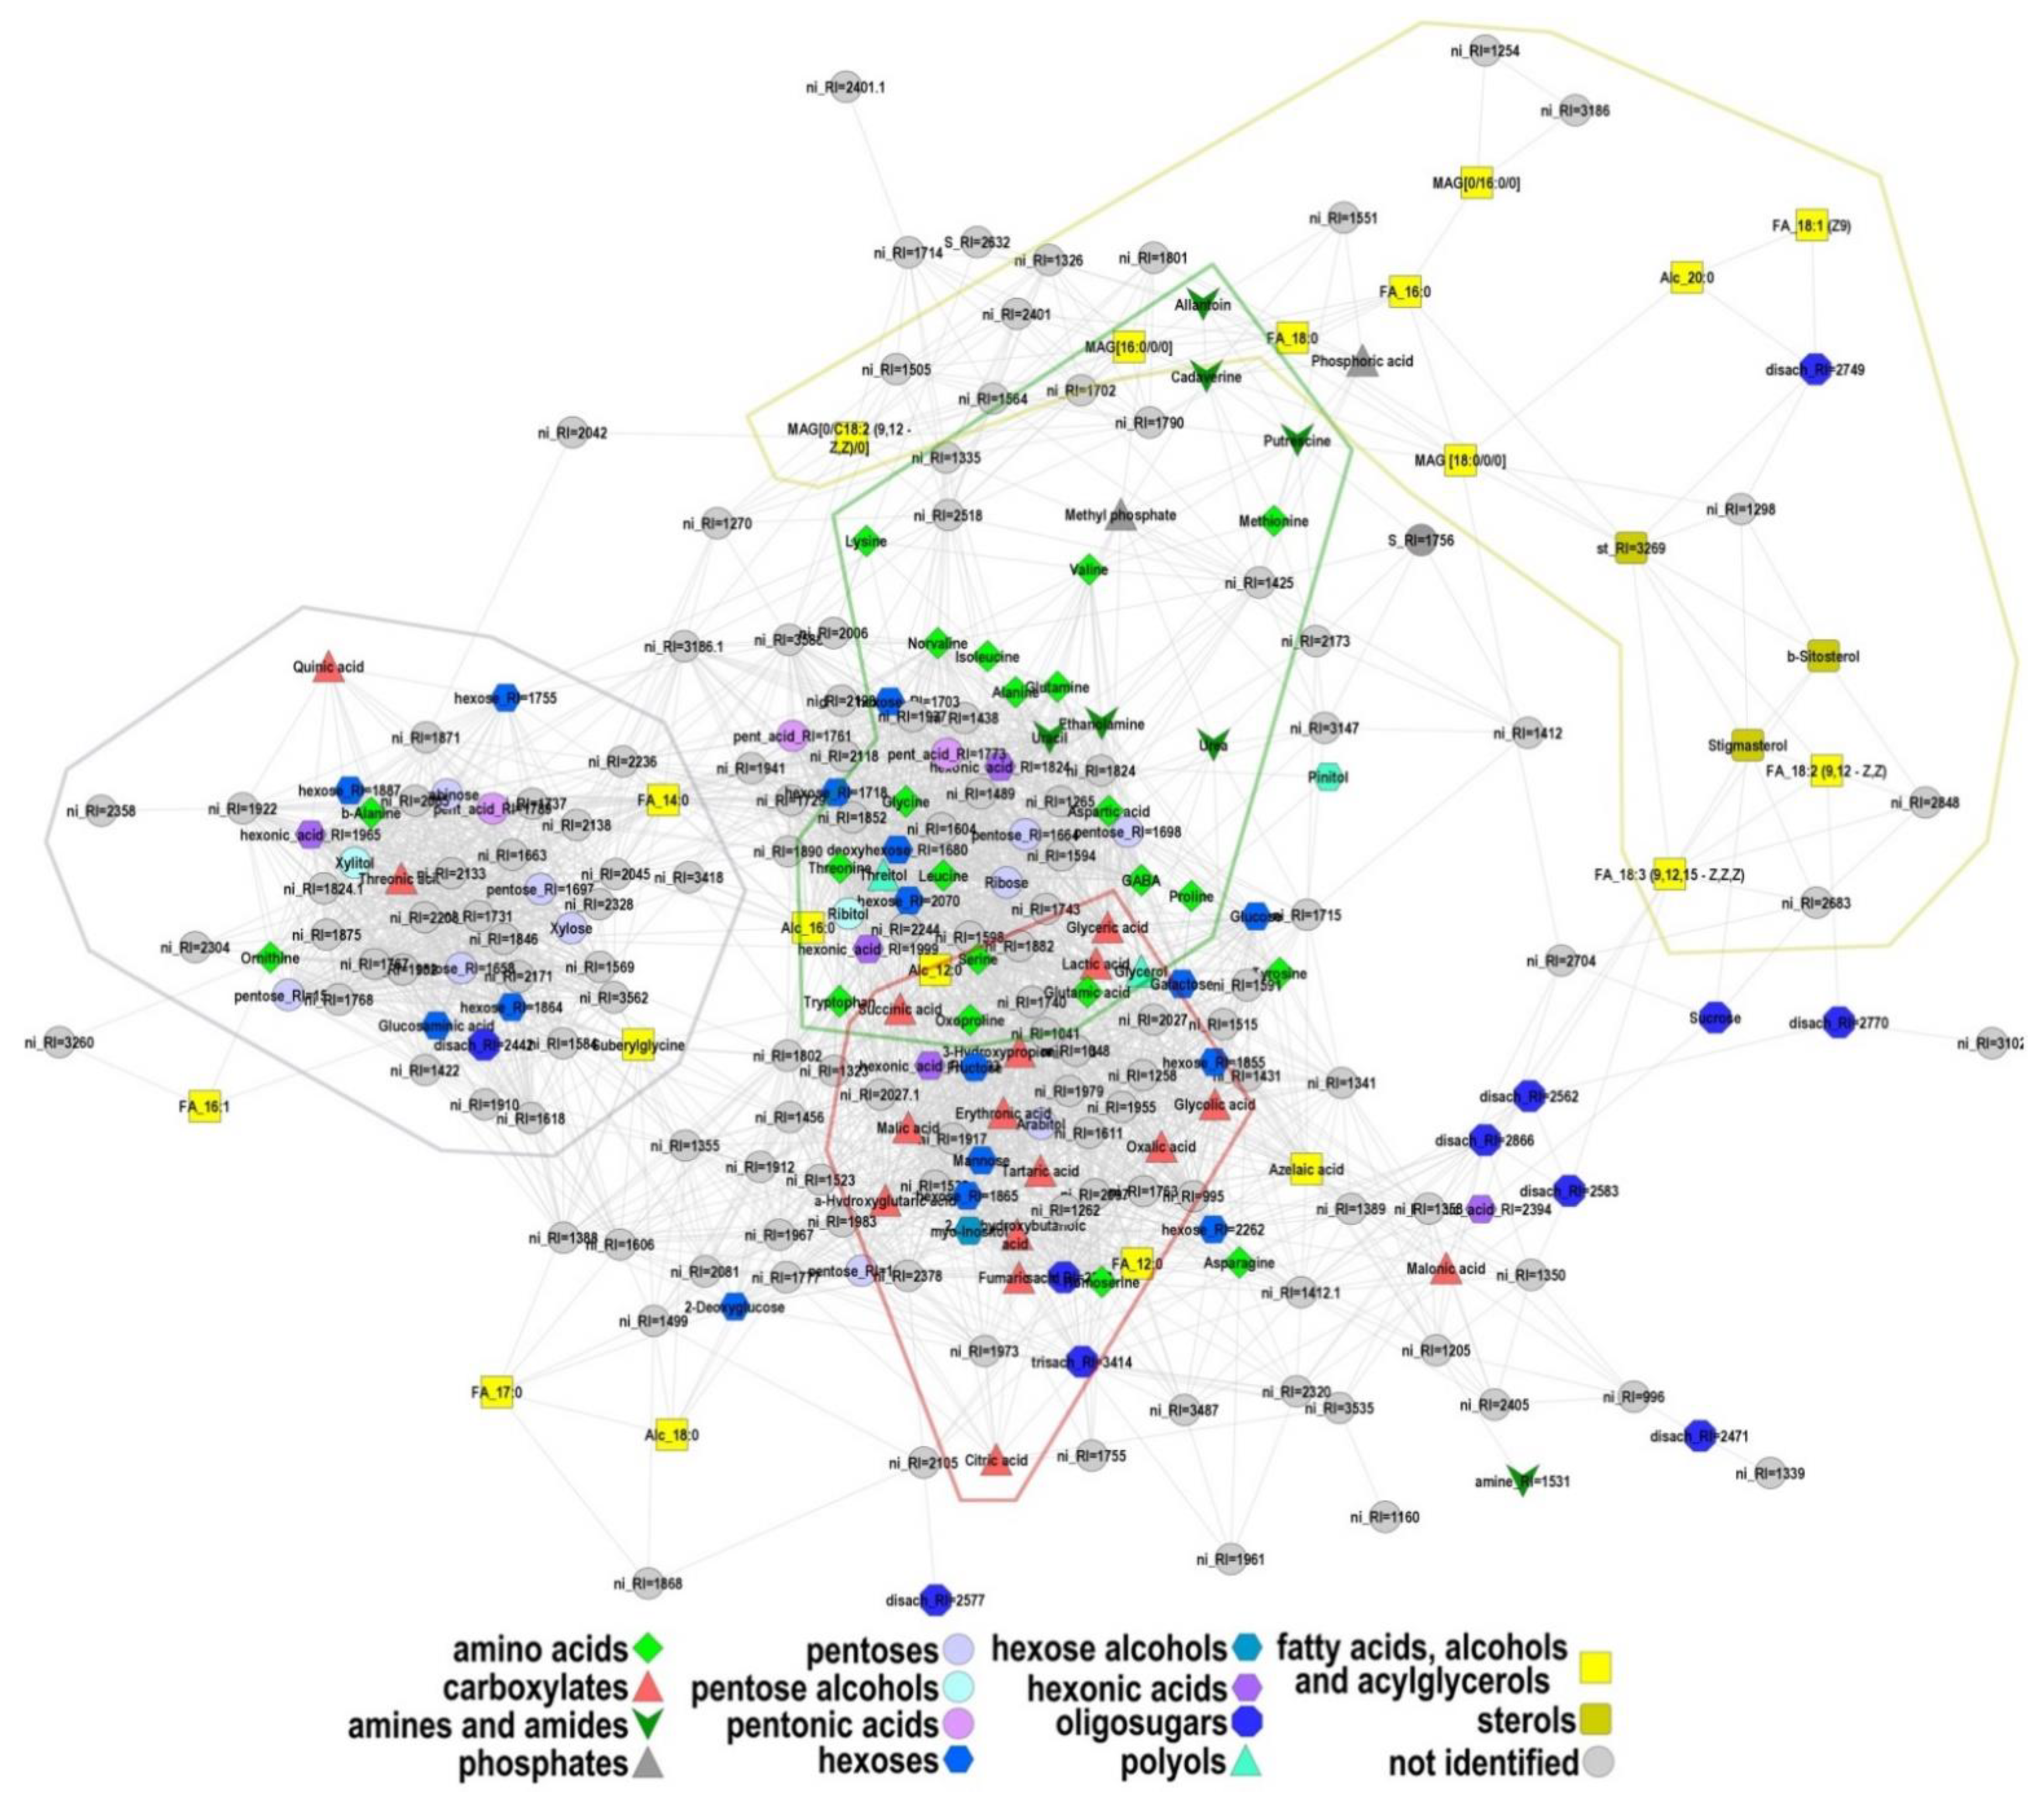
2.4. Correlation Analysis of the Metabolite Pools
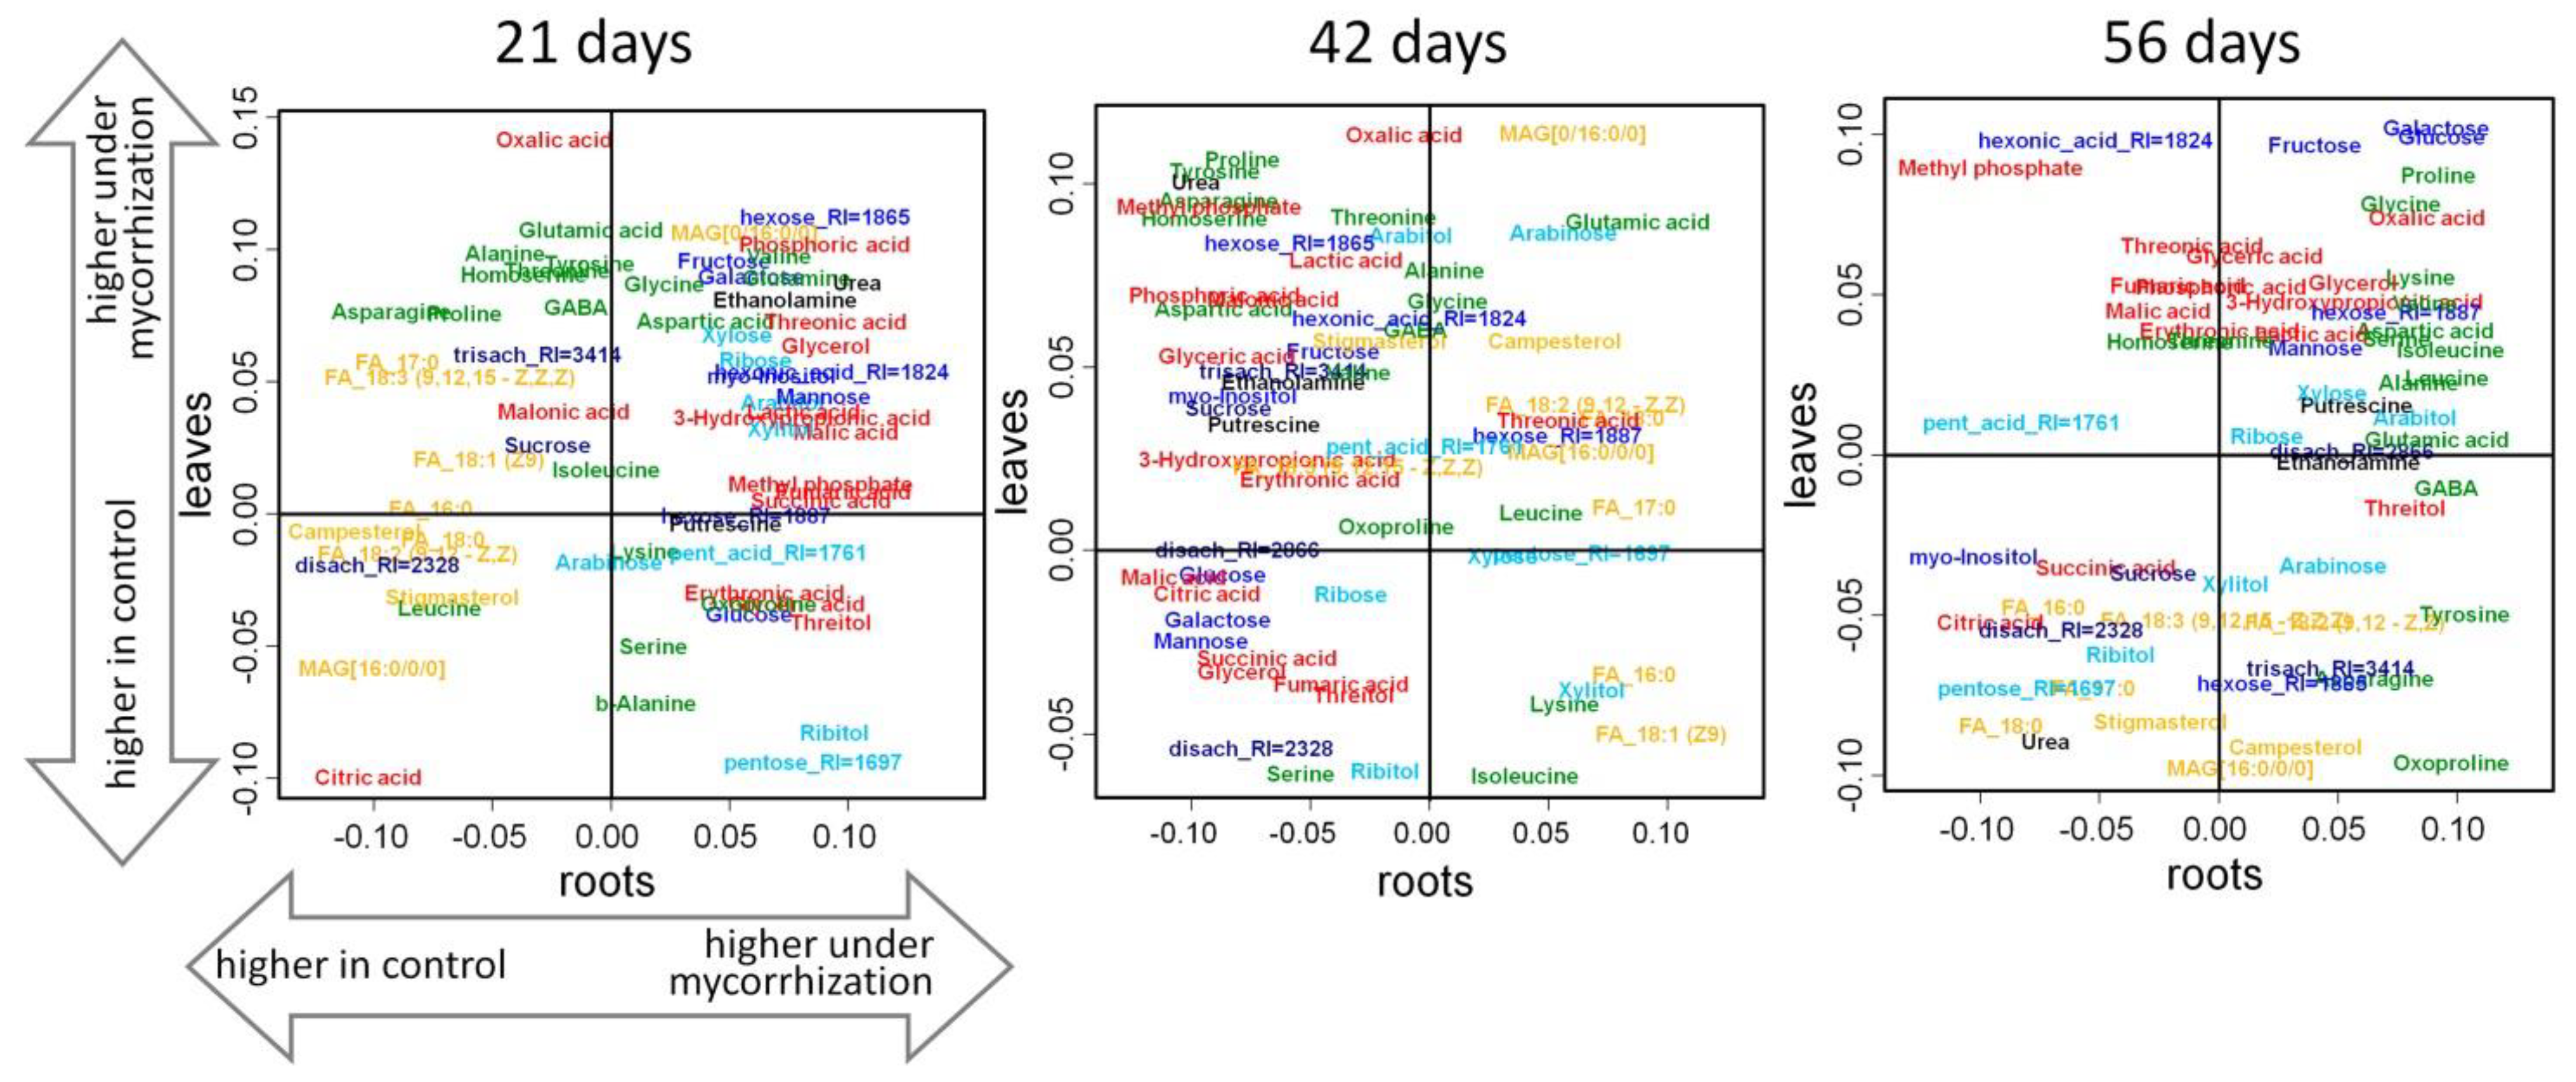
Comparison of the Effect of Mycorrhization on the Leaf and Root Metabolome
3. Discussion
4. Materials and Methods
4.1. Biological Material, Experimental Conditions, and Collection of Plant Material
4.2. Analysis of AM Development
4.3. Sample Preparation for Metabolome Analysis
4.4. GC-MS Analysis
4.5. GC-MS Data Interpretation
4.6. Mathematical Analysis of Metabolome Data
5. Conclusions
Supplementary Materials
Author Contributions
Funding
Institutional Review Board Statement
Informed Consent Statement
Data Availability Statement
Acknowledgments
Conflicts of Interest
References
- Smith, S.E.; Read, D.J. Mycorrhizal Symbiosis, 3rd ed.; Elsevier Academic Press: Maryland Heights, MO, USA, 2008. [Google Scholar]
- Tisserant, E.; Kohler, A.; Dozolme-Seddas, P.; Balestrini, R.; Benabdellah, K.; Colard, A.; Croll, D.; Da Silva, C.; Gomez, S.K.; Koul, R.; et al. The transcriptome of the arbuscular mycorrhizal fungus Glomus intraradices (DAOM 197198) reveals functional tradeoffs in an obligate symbiont. New Phytol. 2012, 193, 755–769. [Google Scholar] [CrossRef]
- Manck-Götzenberger, J.; Requena, N. Arbuscular mycorrhiza symbiosis induces a major transcriptional reprogramming of the Potato SWEET sugar transporter family. Front. Plant Sci. 2016, 7, 487. [Google Scholar] [CrossRef] [PubMed]
- Luginbuehl, L.H.; Menard, G.N.; Kurup, S.; Van Erp, H.; Radhakrishnan, G.V.; Breakspear, A.; Oldroyd, G.E.D.; Eastmond, P.J. Fatty acids in arbuscular mycorrhizal fungi are synthesized by the host plant. Science 2017, 356, 1175–1178. [Google Scholar] [CrossRef]
- Shtark, O.Y.; Puzanskiy, R.K.; Avdeeva, G.S.; Yurkov, A.P.; Smolikova, G.; Yemelyanov, V.V.; Kliukova, M.S.; Shavarda, A.L.; Kirpichnikova, A.A.; Zhernakov, A.I.; et al. Metabolic alterations in pea leaves during arbuscular mycorrhiza development. PeerJ 2019, 7, e7495. [Google Scholar] [CrossRef] [PubMed]
- Fester, T.; Sawers, R. Progress and challenges in agricultural applications of arbuscular mycorrhizal fungi. Crit. Rev. Plant Sci. 2011, 30, 459–470. [Google Scholar] [CrossRef]
- Ahanger, M.A.; Hashem, A.; Abd-Allah, E.F.; Ahmad, P. Arbuscular mycorrhiza in crop improvement under environmental stress. Emerg. Technol. Manag. Crop Stress Toler. 2014, 2, 69–95. [Google Scholar] [CrossRef]
- Latef, A.A.H.A.; Hashem, A.; Rasool, S. Arbuscular mycorrhizal symbiosis and abiotic stress in plants: A review. J. Plant Biol. 2016, 59, 407–426. [Google Scholar] [CrossRef]
- Rivero, J.; Álvarez, D.; Flors, V.; Azcón-Aguilar, C.; Pozo, M.J. Root metabolic plasticity underlies functional diversity in mycorrhiza-enhanced stress tolerance in tomato. New Phytol. 2018, 220, 1322–1336. [Google Scholar] [CrossRef] [PubMed]
- Xavier, L.J.C.; Germida, J.J. Selective interactions between arbuscular mycorrhizal fungi and Rhizobium leguminosarum bv. viceae enhance pea yield and nutrition. Biol. Fertil. Soil. 2003, 37, 161–167. [Google Scholar] [CrossRef]
- Schweiger, R.; Baier, M.C.; Persicke, M.; Müller, C. High specificity in plant leaf metabolic responses to arbuscular mycorrhiza. Nat. Commun. 2014, 5, 3886. [Google Scholar] [CrossRef] [PubMed]
- Konvalinková, T.; Jansa, J. Lights off for arbuscular mycorrhiza: On its symbiotic functioning under light deprivation. Front. Plant Sci. 2016, 7, 782. [Google Scholar] [CrossRef]
- Iriti, M.; Vitalini, S. Plant metabolomics in the global scenario of food security: A systems-biology approach for sustainable crop production. Int. J. Mol. Sci. 2018, 19, 2094. [Google Scholar] [CrossRef]
- Peters, K.; Worrich, A.; Weinhold, A.; Alka, O.; Balcke, G.; Birkemeyer, C.; Bruelheide, H.; Calf, O.W.; Dietz, S.; Dührkop, K.; et al. Current challenges in plant eco-metabolomics. Int. J. Mol. Sci. 2018, 19, 1385. [Google Scholar] [CrossRef] [PubMed]
- Majumdar, S.; Keller, A.A. Omics to address the opportunities and challenges of nanotechnology in agriculture. Crit. Rev. Environ. Sci. Technol. 2020, 1–42. [Google Scholar] [CrossRef]
- Tian, Z.; Wang, J.W.; Li, J.; Han, B. Designing future crops: Challenges and strategies for sustainable agriculture. Plant J. 2021, 105, 1165–1178. [Google Scholar] [CrossRef] [PubMed]
- Schweiger, R.; Mueller, C. Leaf metabolome in arbuscular mycorrhizal symbiosis. Curr. Opin. Plant Biol. 2015, 26, 120–126. [Google Scholar] [CrossRef]
- Schliemann, W.; Ammer, C.; Strack, D. Metabolite profiling of mycorrhizal roots of Medicago truncatula. Phytochemistry 2008, 69, 112–146. [Google Scholar] [CrossRef]
- Rivero, J.; Gamir, J.; Aroca, R.; Pozo, M.J.; Flors, V. Metabolic transition in mycorrhizal tomato roots. Front. Microbiol. 2015, 6, 598. [Google Scholar] [CrossRef]
- Sanmartín, N.; Sánchez-Bel, P.; Pastor, V.; Pastor-Fernández, J.; Mateu, D.; Pozo, M.J.; Cerezo, M.; Flors, V. Root-to-shoot signalling in mycorrhizal tomato plants upon Botrytis cinerea infection. Plant Sci. 2020, 298, 110595. [Google Scholar] [CrossRef]
- Bernardo, L.; Carletti, P.; Badeck, F.W.; Rizza, F.; Morcia, C.; Ghizzoni, R.; Ghizzoni, R.; Rouphael, Y.; Colla, G.; Terzi, V.; et al. Metabolomic responses triggered by arbuscular mycorrhiza enhance tolerance to water stress in wheat cultivars. Plant Physiol. Biochem. 2019, 137, 203–212. [Google Scholar] [CrossRef]
- Tripathi, P.; Rabara, R.C.; Reese, R.N.; Miller, M.A.; Rohila, J.S.; Subramanian, S.; Shen, Q.J.; Morandi, D.; Bücking, H.; Shulaev, V.; et al. A toolbox of genes, proteins, metabolites and promoters for improving drought tolerance in soybean includes the metabolite coumestrol and stomatal development genes. BMC Genom. 2016, 17, 102. [Google Scholar] [CrossRef]
- Salloum, M.S.; Insani, M.; Monteoliva, M.I.; Menduni, M.F.; Silvente, S.; Carrari, F.; Luna, C. Metabolic responses to arbuscular mycorrhizal fungi are shifted in roots of contrasting soybean genotypes. Mycorrhiza 2019, 29, 459–473. [Google Scholar] [CrossRef]
- Avio, L.; Turrini, A.; Giovannetti, M.; Sbrana, C. Designing the ideotype mycorrhizal symbionts for the production of healthy food. Front. Plant Sci. 2018, 9, 1089. [Google Scholar] [CrossRef]
- Kaur, S.; Suseela, V. Unraveling arbuscular mycorrhiza-induced changes in plant primary and secondary metabolome. Metabolites 2020, 10, 335. [Google Scholar] [CrossRef] [PubMed]
- Jacobi, L.M.; Kukalev, A.S.; Ushakov, K.V.; Tsyganov, V.E.; Provorov, N.A.; Borisov, A.Y.; Tikhonovich, I. Genetic variability of garden pea (Pisum sativum L.) for symbiotic capacities. Pisum Genet. 1999, 31, 44–45. [Google Scholar]
- Rivera-Becerril, F.; Calantzis, C.; Turnau, K.; Caussanel, J.P.; Belimov, A.A.; Gianinazzi, S.; Strasser, R.J.; Gianinazzi-Pearson, V. Cadmium accumulation and buffering of cadmium-induced stress by arbuscular mycorrhiza in three Pisum sativum L. genotypes. J. Exp. Bot. 2002, 53, 1177–1185. [Google Scholar] [CrossRef]
- Borisov, A.Y.; Naumkina, T.S.; Shtark, O.Y.; Danilova, T.N.; Tsyganov, V.E. Effectiveness of combined inoculation of pea (Pisum sativum L.) with arbuscular-mycorrhizal fungi and rhizobia. Proc. Russ. Acad. Sci. (Dokl. Ross. Akad. Sel’skohozyaistvennykh Nauk) 2004, 4, 5–7. [Google Scholar]
- Desalegn, G.; Turetschek, R.; Kaul, H.P.; Wienkoop, S. Microbial symbionts affect Pisum sativum proteome and metabolome under Didymella pinodes infection. J. Proteom. 2016, 143, 173–187. [Google Scholar] [CrossRef]
- Zhukov, V.A.; Akhtemova, G.A.; Zhernakov, A.I.; Sulima, A.S.; Shtark, O.Y.; Tikhonovich, I.A. Evaluation of the symbiotic effectiveness of pea (Pisum sativum L.) genotypes in pot experiment. Agric. Biol. (Sel’skokhozyaistvennaya Biol.) 2017, 52, 607–614. [Google Scholar] [CrossRef]
- Yurkov, A.P.; Lactionov, Y.V.; Kojemyakov, A.P.; Stepanova, G.V. Symbiotic efficiency of bacterial and fungal preparations for forage crops according to seed harvest. Fodder 2017, 3, 16–21. [Google Scholar]
- Mamontova, T.; Afonin, A.M.; Ihling, C.; Soboleva, A.; Lukasheva, E.; Sulima, A.S.; Shtark, O.Y.; Akhtemova, G.A.; Povydysh, M.N.; Sinz, A.; et al. Profiling of seed proteome in pea (Pisum sativum L.) lines characterized with high and low responsivity to combined inoculation with nodule bacteria and arbuscular mycorrhizal fungi. Molecules 2019, 24, 1603. [Google Scholar] [CrossRef] [PubMed]
- Turetschek, R.; Desalegn, G.; Epple, T.; Kaul, H.P.; Wienkoop, S. Key metabolic traits of Pisum sativum maintain cell vitality during Didymella pinodes infection: Cultivar resistance and the microsymbionts’ influence. J. Proteom. 2017, 169, 189–201. [Google Scholar] [CrossRef]
- Ranjbar Sistani, N.; Desalegn, G.; Kaul, H.P.; Wienkoop, S. Seed metabolism and pathogen resistance enhancement in Pisum sativum during colonization of arbuscular mycorrhizal fungi: An integrative metabolomics-proteomics approach. Front. Plant Sci. 2020, 11, 872. [Google Scholar] [CrossRef] [PubMed]
- Tshewang, S.; Rengel, Z.; Siddique, K.H.M.; Solaiman, Z.M. Growth, rhizosphere carboxylate exudation, and arbuscular mycorrhizal colonisation in temperate perennial pasture grasses varied with phosphorus application. Agronomy 2020, 10, 2017. [Google Scholar] [CrossRef]
- Hill, J.O.; Simpson, R.J.; Moore, A.D.; Chapman, D.F. Morphology and response of roots of pasture species to phosphorus and nitrogen nutrition. Plant Soil 2006, 286, 7–19. [Google Scholar] [CrossRef]
- Fester, T.; Fetzer, I.; Buchert, S.; Lucas, R.; Rillig, M.C.; Härtig, C. Towards a systemic metabolic signature of the arbuscular mycorrhizal interaction. Oecologia 2011, 167, 913–924. [Google Scholar] [CrossRef] [PubMed]
- Pedone-Bonfim, M.V.; Lins, M.A.; Coelho, I.R.; Santana, A.S.; Silva, F.S.; Maia, L.C. Mycorrhizal technology and phosphorus in the production of primary and secondary metabolites in cebil (Anadenanthera colubrina (Vell.) Brenan) seedlings. J. Sci. Food Agricult. 2013, 93, 1479–1484. [Google Scholar] [CrossRef]
- Goicoechea, N.; Baslam, M.; Erice, G.; Irigoyen, J.J. Increased photosynthetic acclimation in alfalfa associated with arbuscular mycorrhizal fungi (AMF) and cultivated in greenhouse under elevated CO2. J. Plant Physiol. 2014, 171, 1774–1781. [Google Scholar] [CrossRef]
- Hodge, A.; Storer, K. Arbuscular mycorrhiza and nitrogen: Implications for individual plants through to ecosystems. Plant Soil 2015, 386, 1–19. [Google Scholar] [CrossRef]
- Gargallo-Garriga, A.; Sardans, J.; Perez-Trujillo, M.; Rivas-Ubach, A.; Oravec, M.; Vecerova, K.; Urban, O.; Jentsch, A.; Kreyling, J.; Beierkuhnlein, C.; et al. Opposite metabolic responses of shoots and roots to drought. Sci. Rep. 2014, 4, 6829. [Google Scholar] [CrossRef]
- Canarini, A.; Kaiser, C.; Merchant, A.; Richter, A.; Wanek, W. Root exudation of primary metabolites: Mechanisms and their roles in plant responses to environmental stimuli. Front. Plant Sci. 2019, 10, 157. [Google Scholar] [CrossRef] [PubMed]
- Badri, D.V.; Quintana, N.; El Kassis, E.G.; Kim, H.K.; Choi, Y.H.; Sugiyama, A.; Verpoorte, R.; Martinoia, E.; Manter, D.K.; Vivanco, J.M. An ABC transporter mutation alters root exudation of phytochemicals that provoke an overhaul of natural soil microbiota. Plant Physiol. 2009, 151, 2006–2017. [Google Scholar] [CrossRef]
- Ogawa, A.; Ando, F.; Toyofuku, K.; Kawashima, C. Sucrose metabolism for the development of seminal root in maize seedlings. Plant Prod. Sci. 2009, 12, 9–16. [Google Scholar] [CrossRef]
- Govindarajulu, M.; Pfeffer, P.E.; Jin, H.; Abubaker, J.; Douds, D.D.; Allen, J.W.; Bücking, H.; Lammers, P.J.; Shachar-Hill, Y. Nitrogen transfer in the arbuscular mycorrhizal symbiosis. Nature 2005, 435, 819–823. [Google Scholar] [CrossRef] [PubMed]
- Bago, B.; Pfeffer, P.E.; Shachar-Hill, Y. Carbon metabolism and transport in arbuscular mycorrhizas. Plant Physiol. 2000, 124, 949–958. [Google Scholar] [CrossRef]
- Bago, B.; Pfeffer, P.E.; Zipfel, W.; Lammer, P.; Shachar-Hill, Y. Tracking metabolism and imaging transport in arbuscular mycorrhizal fungi. Metabolism and transport in AM fungi. Plant Soil 2002, 244, 189–197. [Google Scholar] [CrossRef]
- MacLean, A.M.; Bravo, A.; Harrison, M.J. Plant signaling and metabolic pathways enabling arbuscular mycorrhizal symbiosis. Plant Cell 2017, 29, 2319–2335. [Google Scholar] [CrossRef]
- Engvild, K.J. Nodulation and nitrogen fixation mutants of pea (Pisum sativum). Theor. Appl. Genet. 1987, 74, 711–713. [Google Scholar] [CrossRef]
- Hoagland, D.R.; Arnon, D.T. The water-culture method for growing plants without soil. In Agriculture Experiment Station Circular; University of California: Berkeley, CA, USA, 1938; p. 347. [Google Scholar]
- Knott, C.M. A key for stages of development of the pea (Pisum sativum). Ann. Appl. Biol. 1987, 111, 233–245. [Google Scholar] [CrossRef]
- Vierheilig, H.; Coughlan, A.P.; Wyss, U.; Piche, Y. Ink and vinegar, a simple staining technique for arbuscular-mycorrhizal fungi. Appl. Environ. Microbiol. 1998, 64, 5004–5007. [Google Scholar] [CrossRef]
- Trouvelot, A.; Kough, J.L.; Gianinazzi-Pearson, V. Mesure du taux de mycorhization VA d’un systeme radiculaire. Recherche de methodes d’estimation ayant une signification fonctionnelle. In Physiological and Genetical Aspects of Mycorrhizae; Gianinazzi-Pearson, V., Gianinazzi, S., Eds.; INRA Press: Paris, France, 1986; pp. 217–221. [Google Scholar]
- Little, T.M.; Hills, F.J. Agricultural Experimentation, Design and Analysis; John Wiley & Sons: New York, NY, USA, 1978; No. 630.72 L5. [Google Scholar]
- Puzanskiy, R.K.; Yemelyanov, V.V.; Kliukova, M.S.; Shavarda, A.L.; Shtark, O.Y.; Yurkov, A.P.; Shishova, M.F. Optimization of metabolite profiling for black medick (Medicago lupulina) and peas (Pisum sativum). Appl. Biochem. Microbiol. 2018, 54, 442–448. [Google Scholar] [CrossRef]
- Johnsen, L.; Skou, P.; Khakimov, B.; Bro, R. Gas chromatography—Mass spectrometry data processing made easy. J. Chromatogr. A 2017, 1503, 57–64. [Google Scholar] [CrossRef]
- R Core Team. R: A Language and Environment for Statistical Computing; R Foundation for Statistical Computing: Vienna, Austria, 2020; Available online: https://www.R-project.org/ (accessed on 31 March 2021).
- Hastie, T.; Tibshirani, R.; Narasimhan, B.; Chu, G. Impute: Imputation for Microarray Data. R Package Version 1.60.0. 2019. Available online: https://bioconductor.org/packages/release/bioc/html/impute.html (accessed on 19 May 2021).
- Stacklies, W.; Redestig, H.; Scholz, M.; Walther, D.; Selbig, J. pcaMethods-a bioconductor package providing PCA methods for incomplete data. Bioinformatics 2007, 23, 1164–1167. [Google Scholar] [CrossRef] [PubMed]
- Murdoch, D.; Adler, D.; Nenadic, O.; Urbanek, S.; Chen, M.; Gebhardt, A.; Bolker, B.; Csardi, G.; Strzelecki, A.; Senger, A.; et al. Rgl: 3D Visualization Using OpenGL. R Package Version 0.100.54. 2020. Available online: https://CRAN.R-project.org/package=rgl (accessed on 31 March 2021).
- Thévenot, E.; Roux, A.; Xu, Y.; Ezan, E.; Junot, C. Analysis of the human adult urinary metabolome variations with age, body mass index, and gender by implementing a comprehensive workflow for univariate and OPLS statistical analyses. J Proteome Res. 2015, 14, 3322–3335. [Google Scholar] [CrossRef] [PubMed]
- Liaw, A.; Wiener, M. Classification and Regression by random Forest. R News 2002, 2, 18–22. [Google Scholar]
- Korotkevich, G.; Sukhov, V.; Sergushichev, A. Fast gene set enrichment analysis. bioRxiv 2016. [Google Scholar] [CrossRef]
- Tenenbaum, D. KEGGREST: Client-Side REST Access to KEGG. R Package Version 1.26.1. 2019. Available online: https://bioconductor.org/packages/release/bioc/html/KEGGREST.html (accessed on 19 May 2021).
- Shannon, P.; Markiel, A.; Ozier, O.; Baliga, N.S.; Wang, J.T.; Ramage, D.; Amin, N.; Schwikowski, B.; Ideker, T. Cytoscape: A software environment for integrated models of biomolecular interaction networks. Genome Res. 2003, 13, 2498–2504. [Google Scholar] [CrossRef]
- Gu, Z.; Eils, R.; Schlesner, M. Complex heatmaps reveal patterns and correlations in multidimensional genomic data. Bioinformatics 2016, 32, 2847–2849. [Google Scholar] [CrossRef]


Publisher’s Note: MDPI stays neutral with regard to jurisdictional claims in published maps and institutional affiliations. |
© 2021 by the authors. Licensee MDPI, Basel, Switzerland. This article is an open access article distributed under the terms and conditions of the Creative Commons Attribution (CC BY) license (https://creativecommons.org/licenses/by/4.0/).
Share and Cite
Shtark, O.; Puzanskiy, R.; Avdeeva, G.; Yemelyanov, V.; Shavarda, A.; Romanyuk, D.; Kliukova, M.; Kirpichnikova, A.; Tikhonovich, I.; Zhukov, V.; et al. Metabolic Alterations in Pisum sativum Roots during Plant Growth and Arbuscular Mycorrhiza Development. Plants 2021, 10, 1033. https://doi.org/10.3390/plants10061033
Shtark O, Puzanskiy R, Avdeeva G, Yemelyanov V, Shavarda A, Romanyuk D, Kliukova M, Kirpichnikova A, Tikhonovich I, Zhukov V, et al. Metabolic Alterations in Pisum sativum Roots during Plant Growth and Arbuscular Mycorrhiza Development. Plants. 2021; 10(6):1033. https://doi.org/10.3390/plants10061033
Chicago/Turabian StyleShtark, Oksana, Roman Puzanskiy, Galina Avdeeva, Vladislav Yemelyanov, Alexey Shavarda, Daria Romanyuk, Marina Kliukova, Anastasia Kirpichnikova, Igor Tikhonovich, Vladimir Zhukov, and et al. 2021. "Metabolic Alterations in Pisum sativum Roots during Plant Growth and Arbuscular Mycorrhiza Development" Plants 10, no. 6: 1033. https://doi.org/10.3390/plants10061033
APA StyleShtark, O., Puzanskiy, R., Avdeeva, G., Yemelyanov, V., Shavarda, A., Romanyuk, D., Kliukova, M., Kirpichnikova, A., Tikhonovich, I., Zhukov, V., & Shishova, M. (2021). Metabolic Alterations in Pisum sativum Roots during Plant Growth and Arbuscular Mycorrhiza Development. Plants, 10(6), 1033. https://doi.org/10.3390/plants10061033