
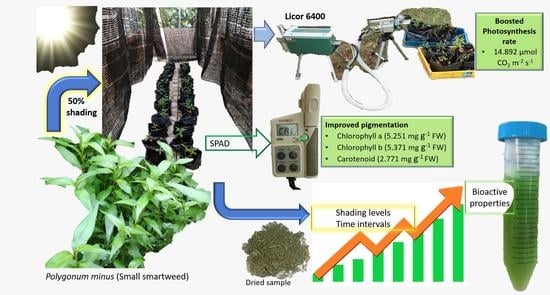
Shading Effects on Leaf Gas Exchange, Leaf Pigments and Secondary Metabolites of Polygonum minus Huds., an Aromatic Medicinal Herb

 ,
,  , and
, and
Abstract
1. Introduction
2. Results
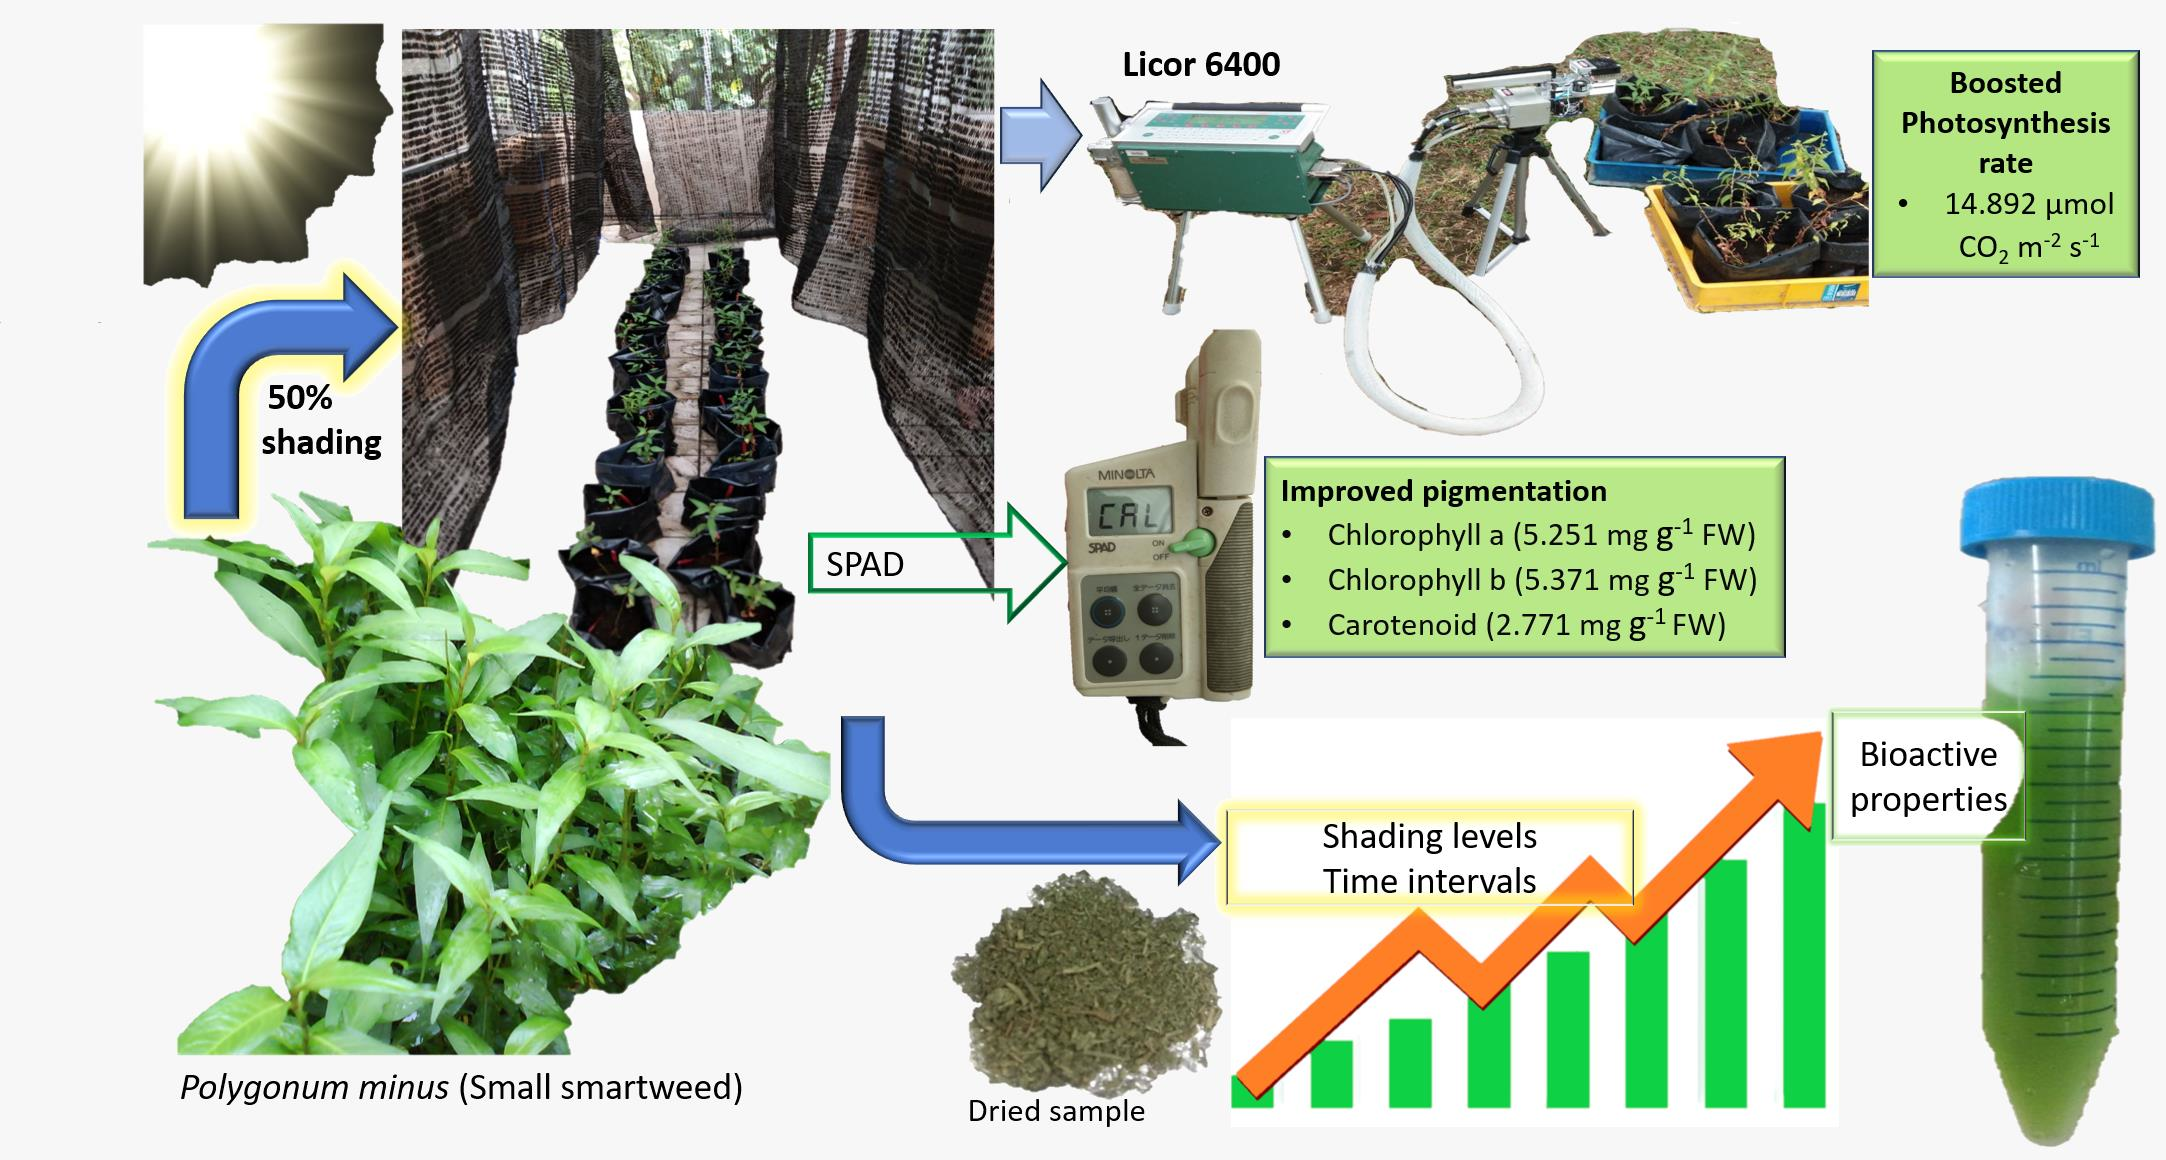
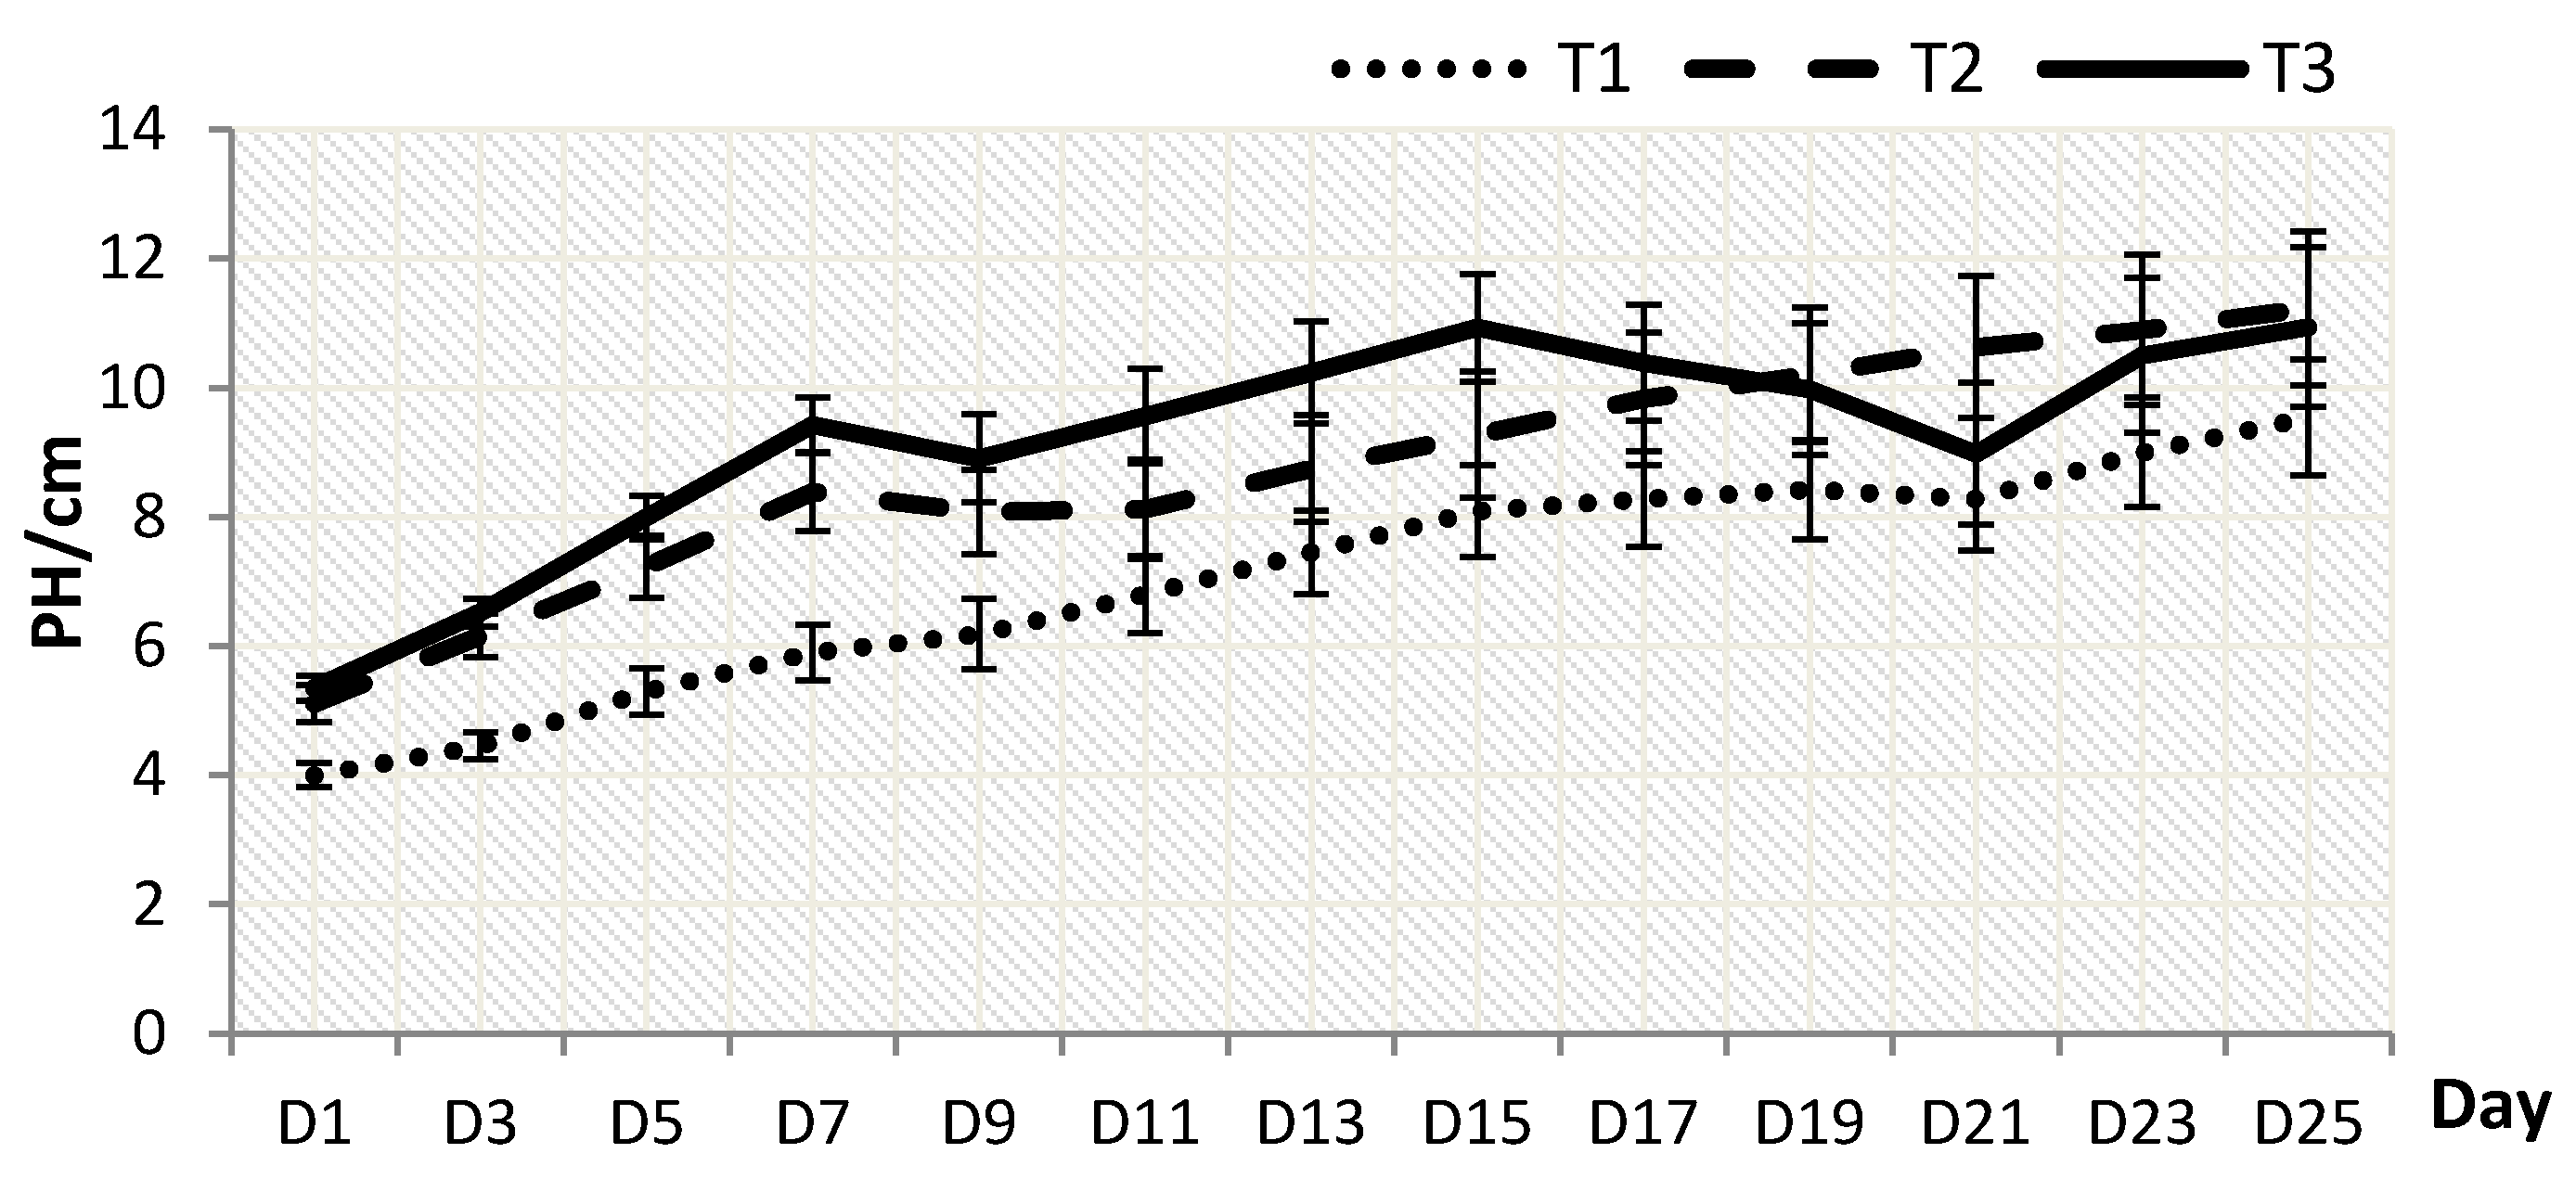
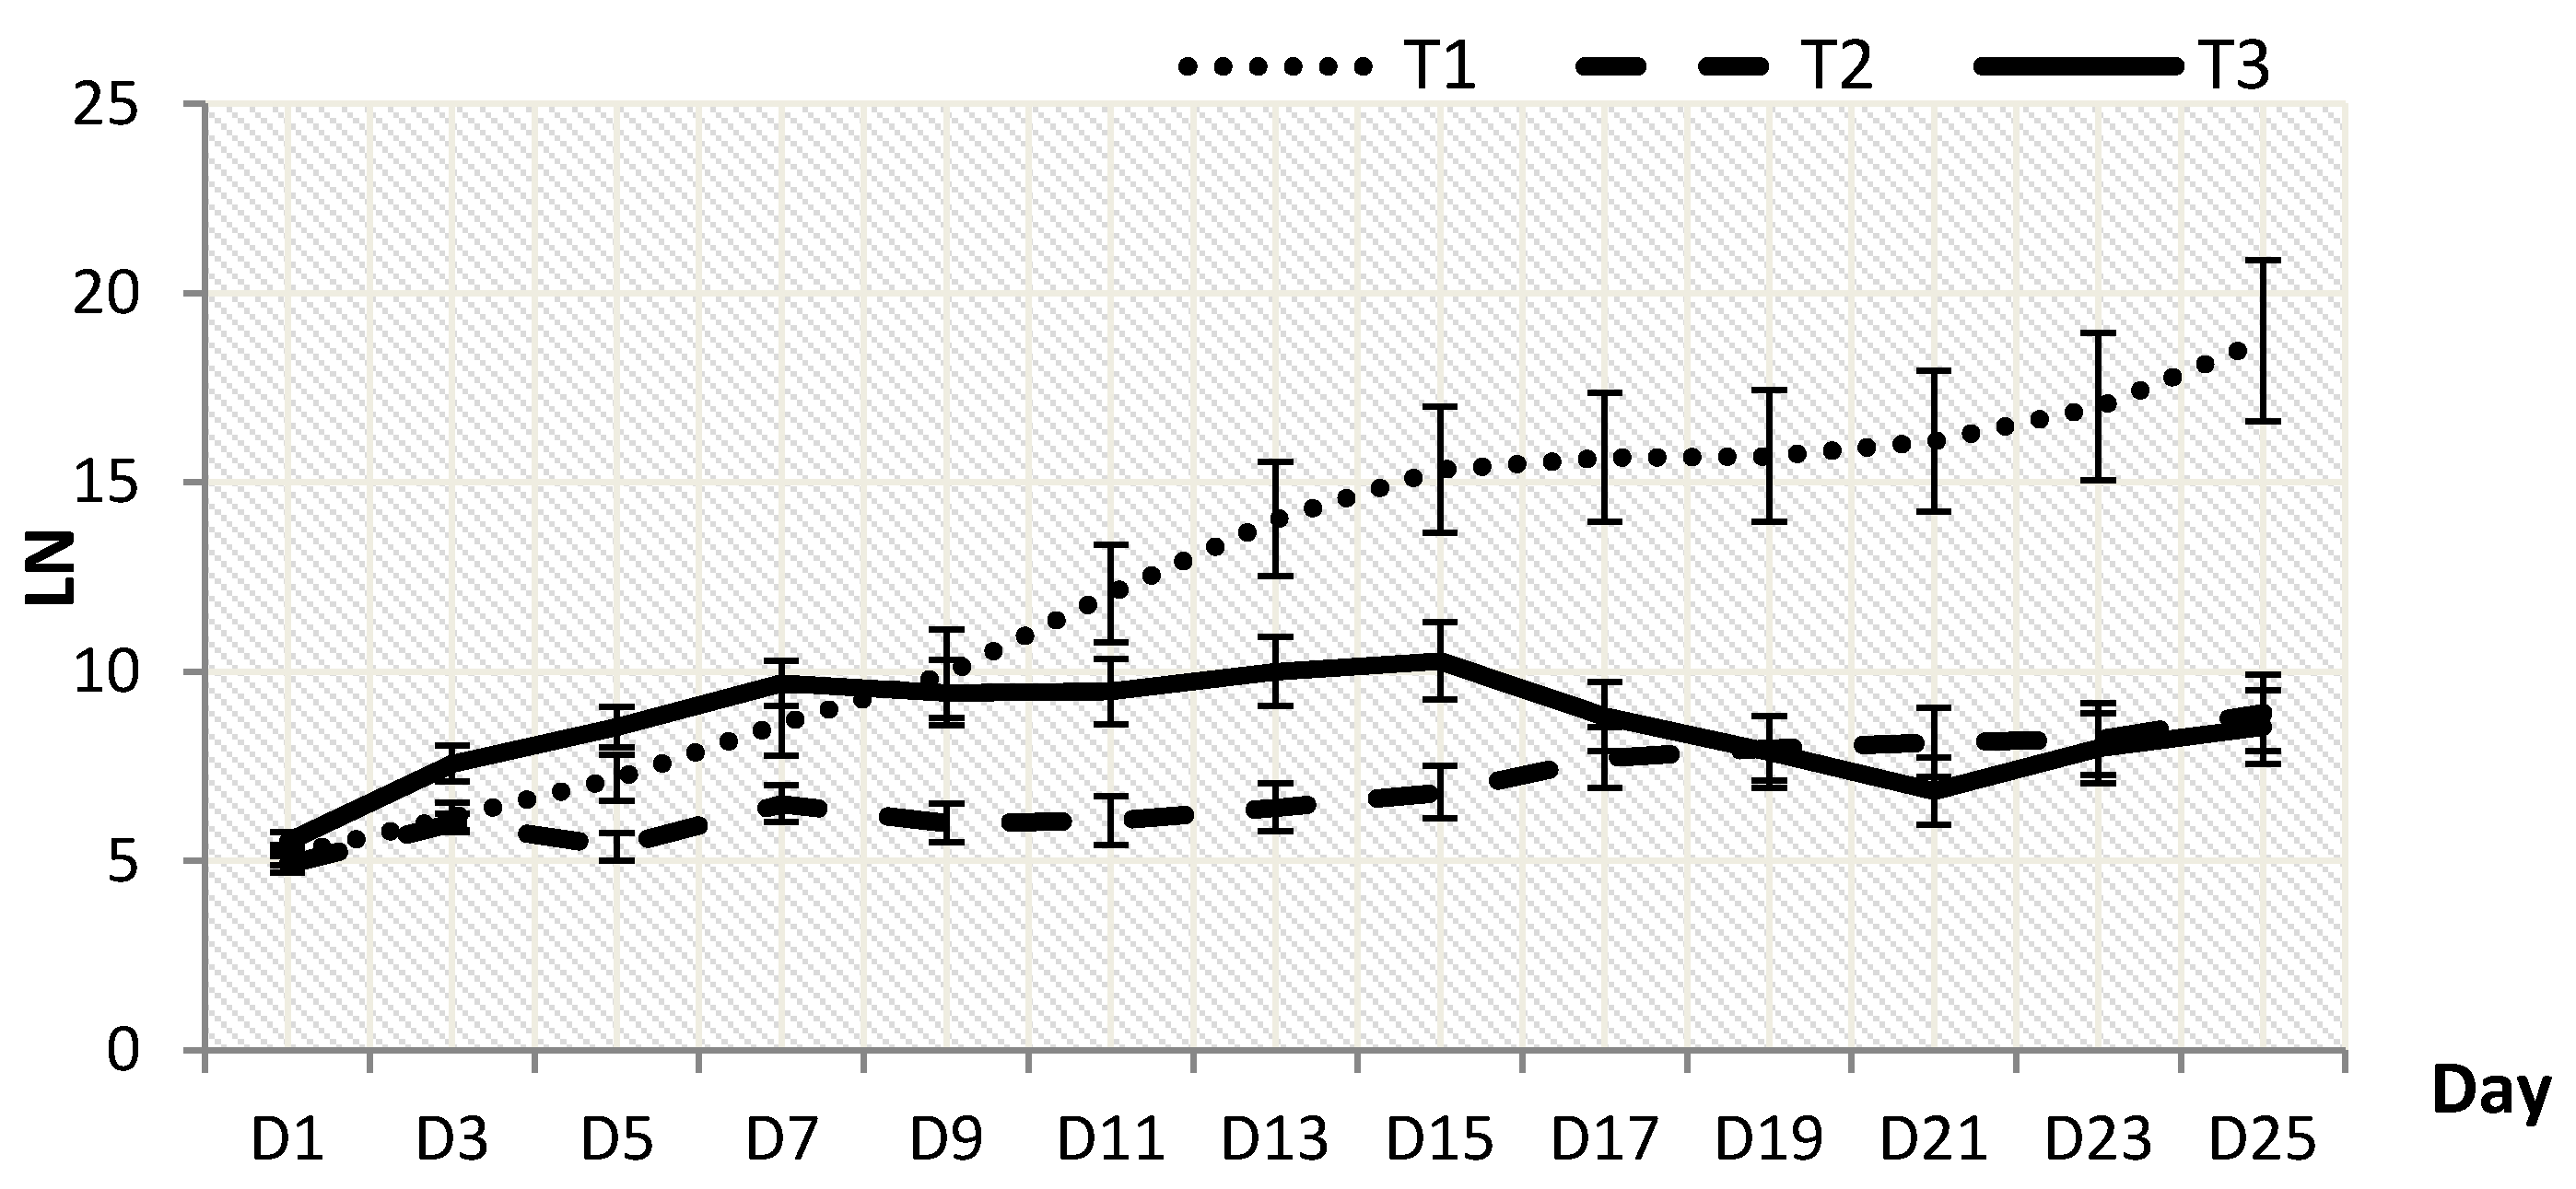
2.1. Plant Growth
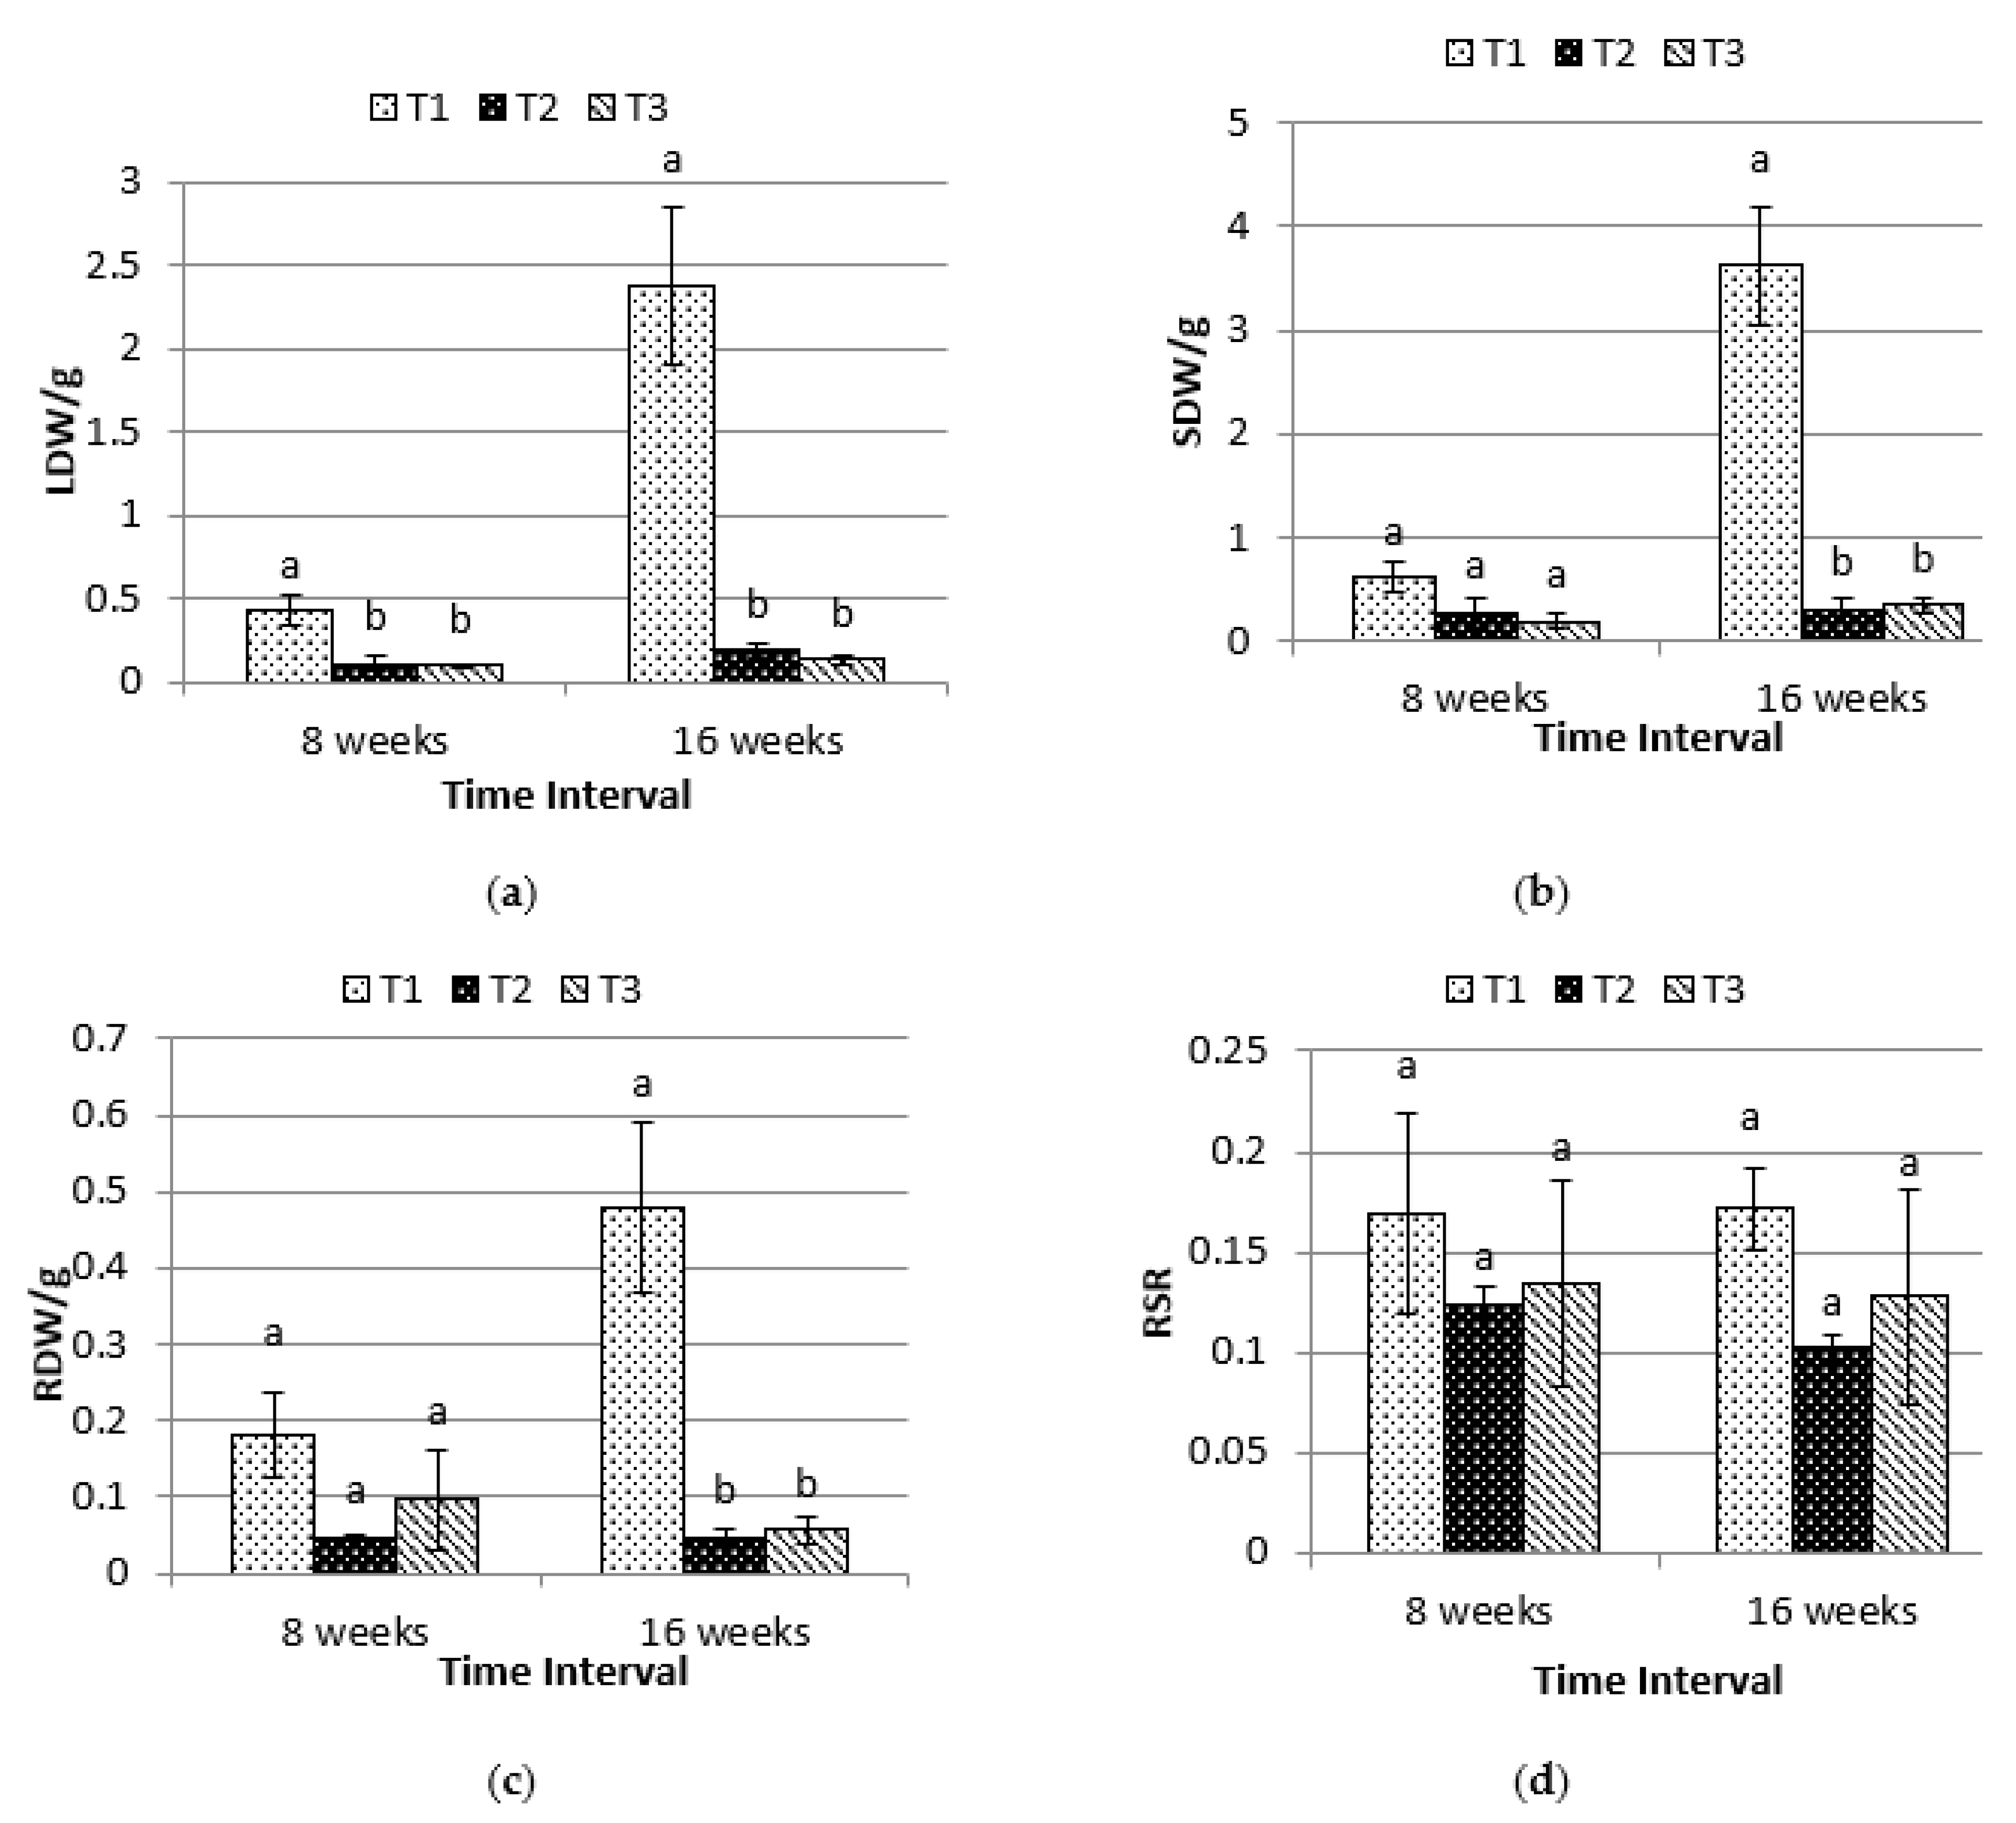
2.2. Biomass Dry Weight and Root-Shoot Ratio(RSR)
2.3. Leaf Gas Exchange, Leaf Pigments and In-Situ Chlorophyll
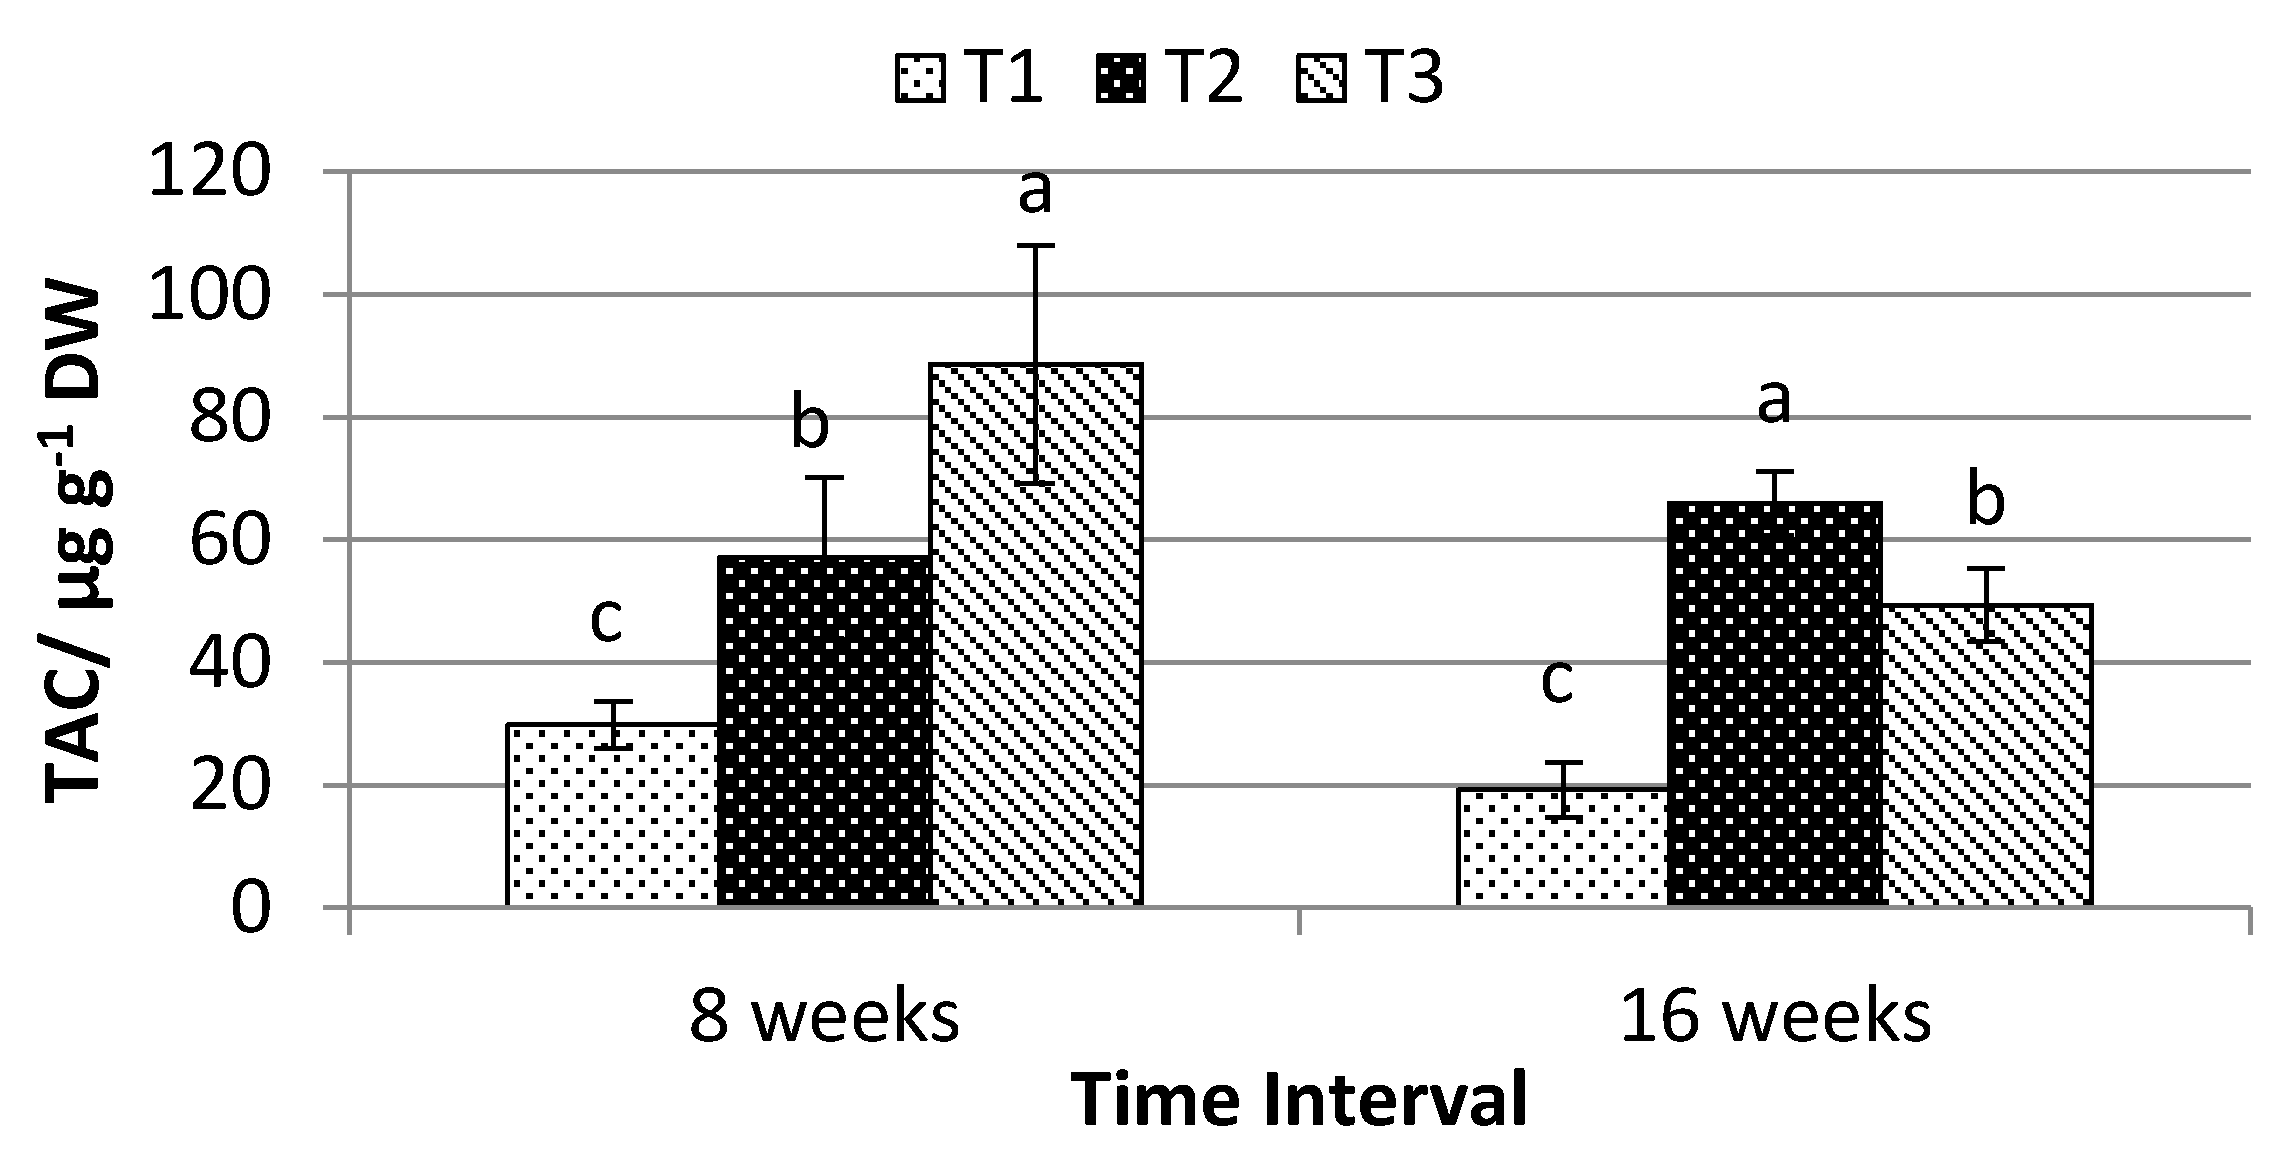
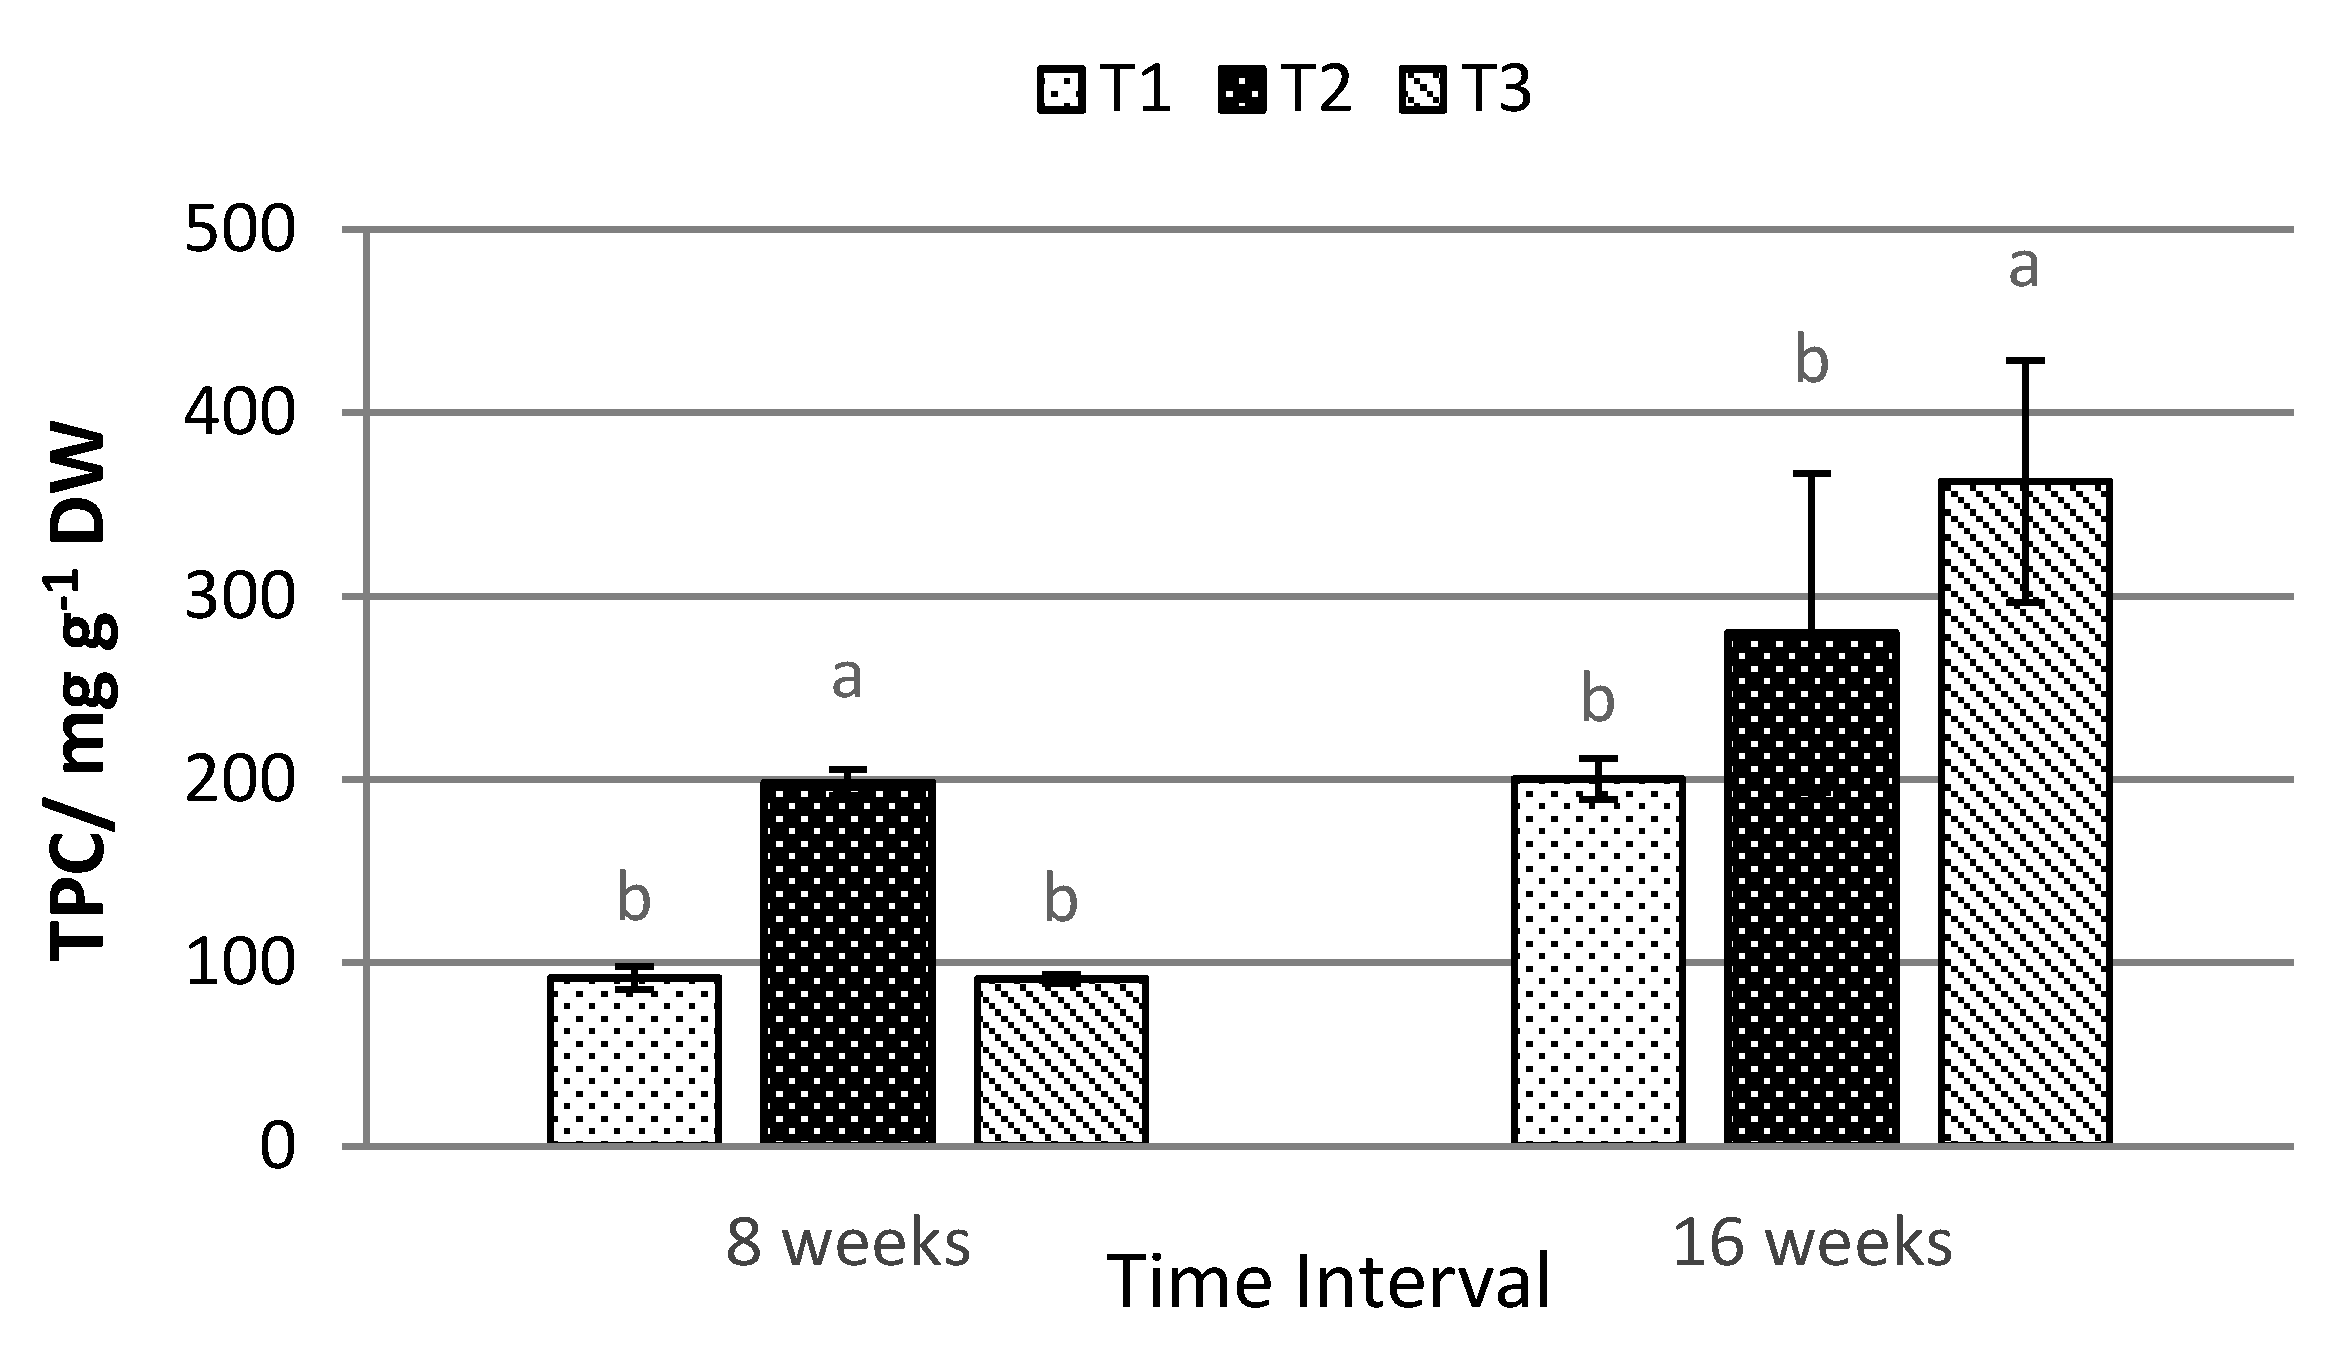
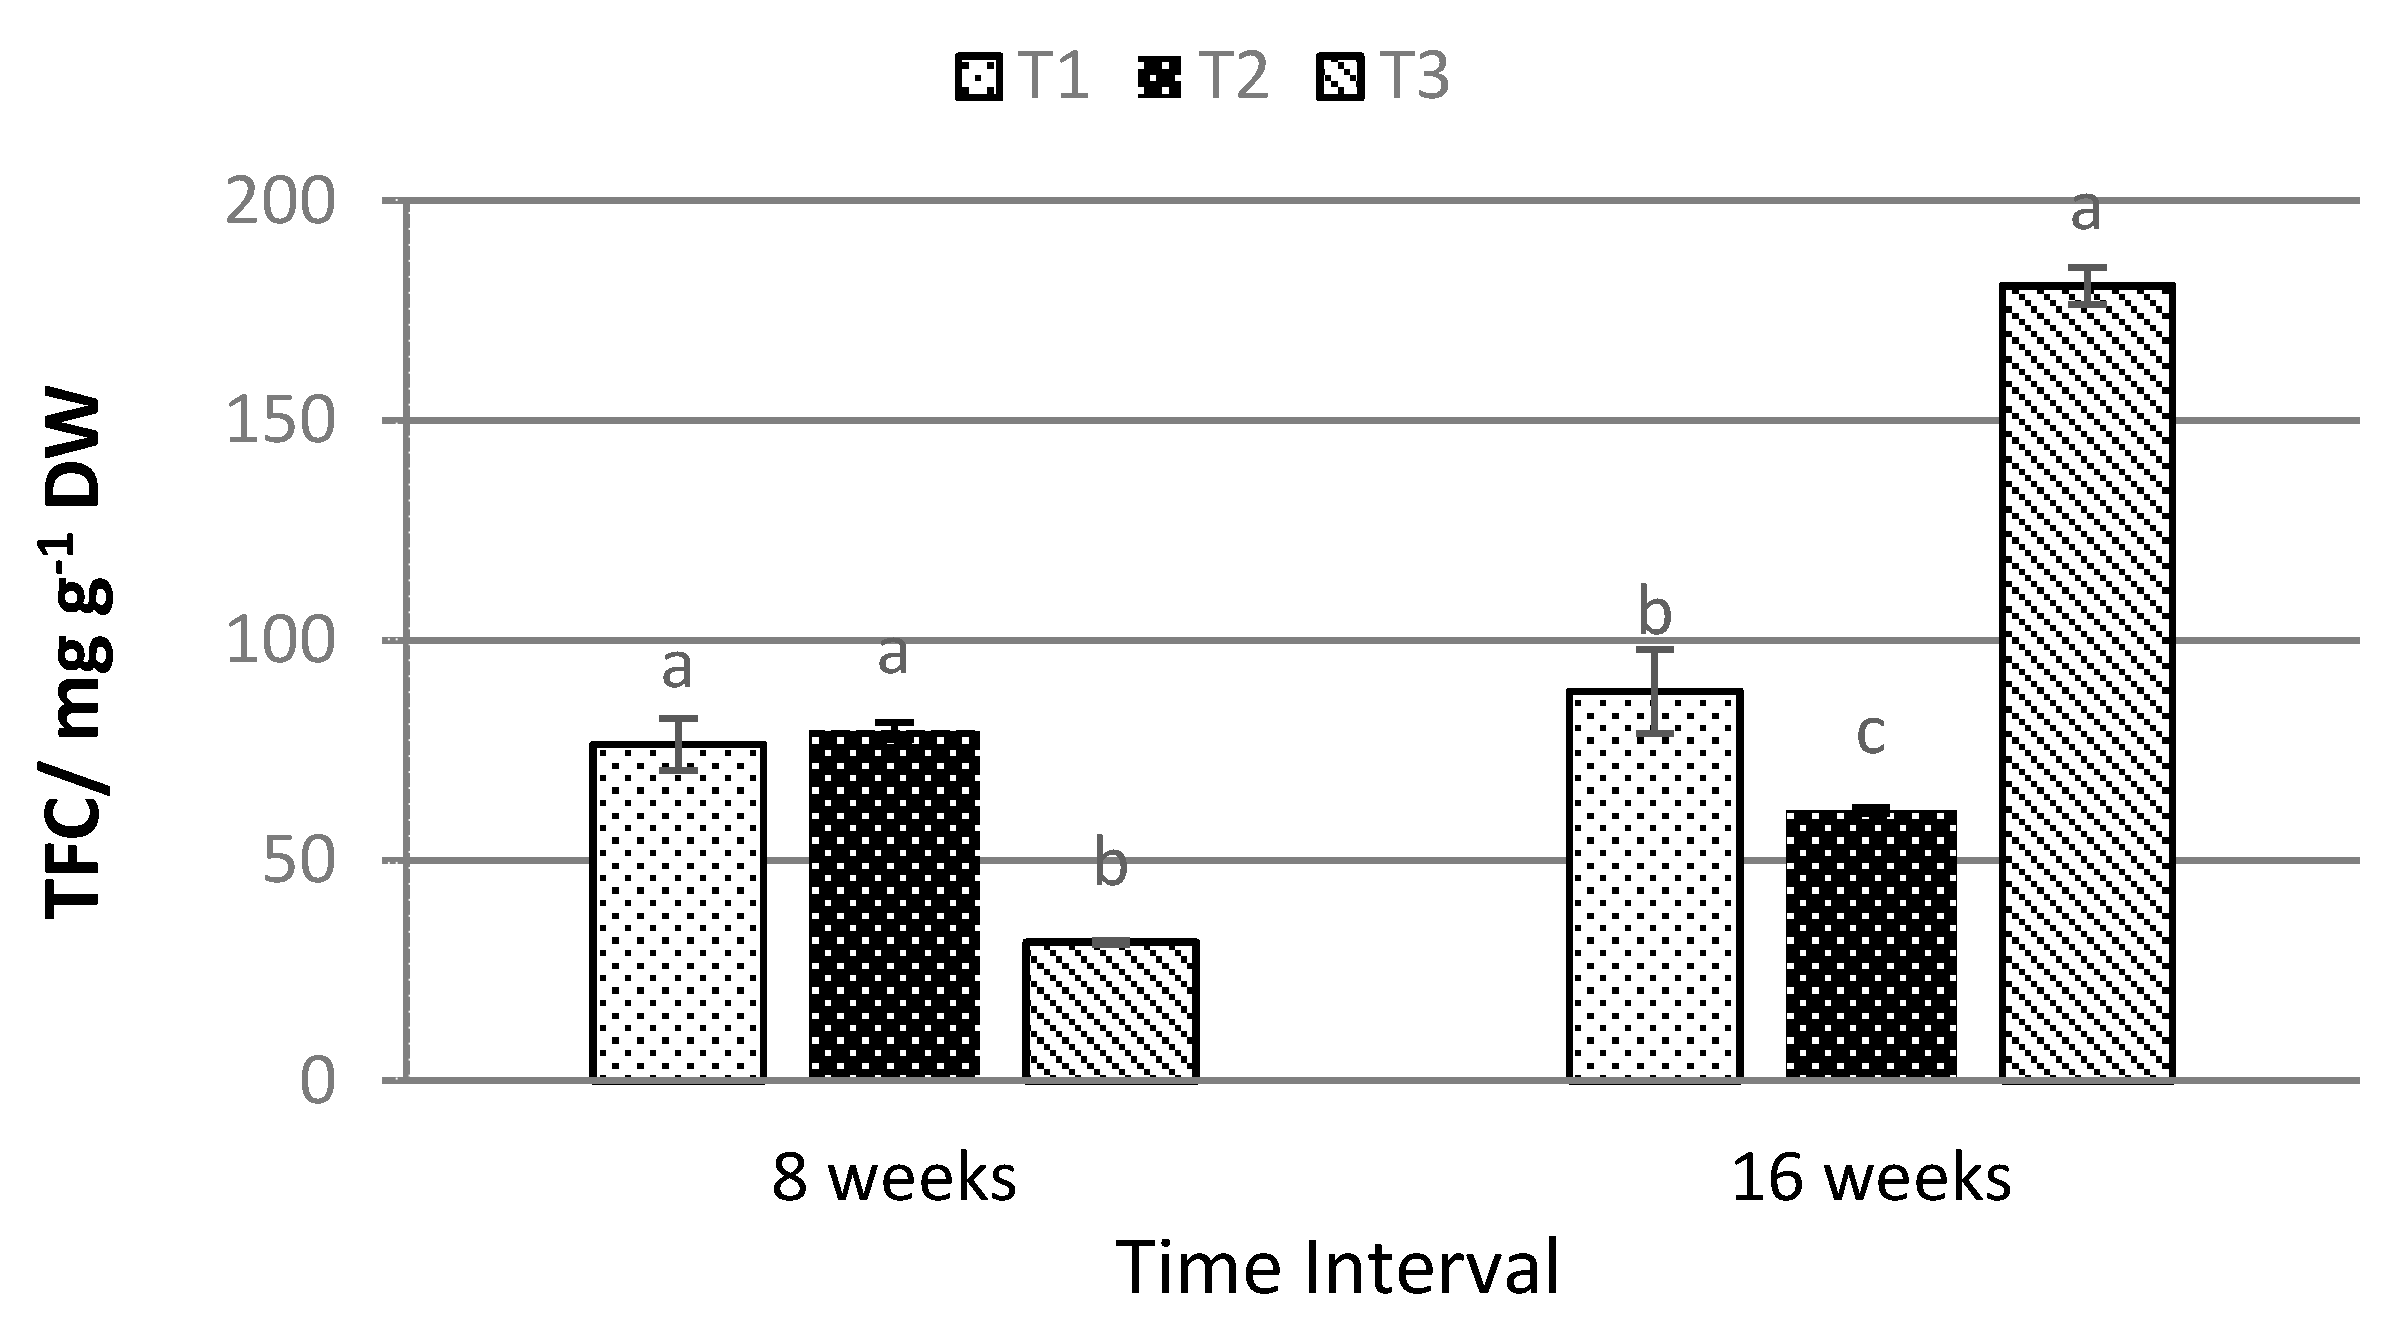
2.4. Total Anthocyanin, Phenolic, and Flavonoid Content
2.5. Radical Scavenging Assays
3. Discussion
4. Materials and Methods
4.1. Treatments Description and Maintanance
4.2. Plant Growth
4.3. Biomass Dry Weight and Root-Shoot Ratio
4.4. Leaf Gas Exchange
4.5. In-Situ Chlorophyll Content
4.6. Leaf Chlorophyll and Carotenoid Analysis
4.7. Total Anthocyanin Content
4.8. Total Phenolic and Flavonoid Content
4.9. Ferric Reducing Antioxidant Power (FRAP)
4.10. DPPH Radical Scavenging Assay
4.11. Statistical Analysis
5. Conclusions
Author Contributions
Funding
Acknowledgments
Conflicts of Interest
References
- Rusdi, N.A.; Goh, H.-H.; Baharum, S.N. GC-MS/Olfactometric characterisation and aroma extraction dilution analysis of aroma active compounds in Polygonum minus essential oil. Plant Omics 2016, 9, 289–291. [Google Scholar] [CrossRef]
- Christapher, P.V.; Parasuraman, S.; Christina, J.M.A.; Vikneswaran, M.; Asmawi, M.Z. Review onPolygonum minus. Huds, a commonly used food additive in Southeast Asia. Pharmacogn. Res. 2015, 7, 1–6. [Google Scholar] [CrossRef]
- Baharum, S.N.; Bunawan, H.; Ghani, M.A.; Mustapha, W.A.W.; Noor, N.M. Analysis of the Chemical Composition of the Essential Oil of Polygonum minus Huds. Using Two-Dimensional Gas Chromatography-Time-of-Flight Mass Spectrometry (GC-TOF MS). Molecules 2010, 15, 7006–7015. [Google Scholar] [CrossRef] [PubMed]
- Vikram, P.; Chiruvella, K.K.; Ripain, I.H.A.; Arifullah, M.; Hua, G.S. A recent review on phytochemical constituents and medicinal properties of kesum (Polygonum minus Huds.). Asian Pac. J. Trop. Biomed. 2014, 4, 430–435. [Google Scholar] [CrossRef]
- Qader, S.W.; Abdulla, M.A.; Chua, L.S.; Hamdan, S. Potential Bioactive Property of Polygonum minus Huds (kesum) Review. Sci. Res. Essays 2012, 7, 90–93. [Google Scholar] [CrossRef]
- Maizura, M.; Aminah, A.; Wan Aida, W.M. Total Phenolic Content and Antioxidant Activity of Kesum (Polygonum minus), ginger (Zingiber officinale) and Turmeric (Curcuma longa) Extract. Int. Food Res. J. 2011, 18, 526–531. [Google Scholar]
- You, Y.; Shahar, S.; Haron, H.; Yahya, H.M. More Ulam for Your Brain: A Review on the Potential Role of Ulam in Protecting Against Cognitive Decline. Sains Malays. 2018, 47, 2713–2729. [Google Scholar] [CrossRef]
- Ghazali, M.A.M.; Al-Naqeb, G.; Selvarajan, K.K.; Hasan, M.H.; Adam, A. Apoptosis Induction byPolygonum minusIs Related to Antioxidant Capacity, Alterations in Expression of Apoptotic-Related Genes, and S-Phase Cell Cycle Arrest in HepG2 Cell Line. BioMed Res. Int. 2014, 2014, 539607. [Google Scholar] [CrossRef]
- Ahmad, R.; Sahidin, I.; Taher, M.; Low, C.; Noor, N.M.; Sillapachaiyaporn, C.; Chuchawankul, S.; Sarachana, T.; Tencomnao, T.; Iskandar, F.; et al. Polygonumins A, a newly isolated compound from the stem of Polygonum minus Huds with potential medicinal activities. Sci. Rep. 2018, 8, 1–15. [Google Scholar] [CrossRef] [PubMed]
- Kurata, H.; Matsumura, S.; Furusaki, S. Light irradiation causes physiological and metabolic changes for purine alkaloid production by a Coffea arabica cell suspension culture. Plant Sci. 1997, 123, 197–203. [Google Scholar] [CrossRef]
- Briskin, D.P.; Gawienowski, M.C. Differential effects of light and nitrogen on production of hypericins and leaf glands in Hypericum perforatum. Plant Physiol. Biochem. 2001, 39, 1075–1081. [Google Scholar] [CrossRef]
- Affendy, H.; Aminuddin, M.; Arifin, A.; Mandy, M.; Julius, K.; Tamer, A. Effects of Light Intensity on Orthosiphon stamineus Benth. Seedlings Treated with Different Organic Fertilizers. Int. J. Agric. Res. 2010, 5, 201–207. [Google Scholar] [CrossRef]
- Pan, J.; Guo, B. Effects of Light Intensity on the Growth, Photosynthetic Characteristics, and Flavonoid Content of Epimedium pseudowushanense BL Guo. Molecules 2016, 21, 1475. [Google Scholar] [CrossRef] [PubMed]
- Fan, X.-X.; Xu, Z.-G.; Liu, X.-Y.; Tang, C.-M.; Wang, L.-W.; Han, X.-L. Effects of light intensity on the growth and leaf development of young tomato plants grown under a combination of red and blue light. Sci. Hortic. 2013, 153, 50–55. [Google Scholar] [CrossRef]
- Liu, Q.-H.; Wu, X.; Chen, B.-C.; Ma, J.-Q.; Gao, J. Effects of Low Light on Agronomic and Physiological Characteristics of Rice Including Grain Yield and Quality. Rice Sci. 2014, 21, 243–251. [Google Scholar] [CrossRef]
- Zhu, H.; Li, X.; Zhai, W.; Liu, Y.; Gao, Q.; Liu, J.; Ren, L.; Chen, H.; Zhu, Y. Effects of low light on photosynthetic properties, antioxidant enzyme activity, and anthocyanin accumulation in purple pak-choi (Brassica campestris ssp. Chinensis Makino). PLoS ONE 2017, 12, e0179305. [Google Scholar] [CrossRef] [PubMed]
- Ghasemzadeh, A.; Jaafar, H.Z.E.; Rahmat, A.; Wahab, P.E.M.; Halim, M.R.A. Effect of Different Light Intensities on Total Phenolics and Flavonoids Synthesis and Anti-oxidant Activities in Young Ginger Varieties (Zingiber officinale Roscoe). Int. J. Mol. Sci. 2010, 11, 3885–3897. [Google Scholar] [CrossRef]
- Ibrahim, M.H.; Jaafar, H.Z.E.; Karimi, E.; Ghasemzadeh, A. Allocation of Secondary Metabolites, Photosynthetic Capacity, and Antioxidant Activity of Kacip Fatimah (Labisia pumilaBenth) in Response toCO2and Light Intensity. Sci. World J. 2014, 2014, 1–13. [Google Scholar] [CrossRef]
- Morelli, G.; Ruberti, I. Shade Avoidance Responses. Driving Auxin along Lateral Routes. Plant Physiol. 2000, 122, 621–626. [Google Scholar] [CrossRef]
- Ding, Z.; Galvan-Ampudia, C.S.; Demarsy, E.; Łangowski, Ł.; Kleine-Vehn, J.; Fan, Y.; Morita, M.T.; Tasaka, M.; Fankhauser, C.; Offringa, R.; et al. Light-mediated polarization of the PIN3 auxin transporter for the phototropic response in Arabidopsis. Nat. Cell Biol. 2011, 13, 447–452. [Google Scholar] [CrossRef]
- Semchenko, M.; Lepik, M.; Götzenberger, L.; Zobel, K. Positive effect of shade on plant growth: Amelioration of stress or active regulation of growth rate? J. Ecol. 2011, 100, 459–466. [Google Scholar] [CrossRef]
- Falster, D.S.; Westoby, M. Plant height and evolutionary games. Trends Ecol. Evol. 2003, 18, 337–343. [Google Scholar] [CrossRef]
- Paez, A.; Gebre, G.M.; Gonzalez, E.M.; Tschaplinski, T.J. Growth, soluble carbohydrates, and aloin concentration of Aloe vera plants exposed to three irradiance levels. Environ. Exp. Bot. 2000, 44, 133–139. [Google Scholar] [CrossRef]
- Silva, F.G.; Pinto, J.E.B.P.; Cardoso, M.D.G.; Nascimento, E.A.; Nelson, D.L.; Sales, J.D.F.; Mol, D.J.D.S. Influence of radiation level on plant growth, yield and quality of essential oil in carqueja. Ciência Agrotecnologia 2006, 30, 52–57. [Google Scholar] [CrossRef]
- Vanneste, S.; Friml, J. Auxin: A Trigger for Change in Plant Development. Cell 2009, 136, 1005–1016. [Google Scholar] [CrossRef]
- Yang, X.-Y.; Ye, X.-F.; Liu, G.-S.; Wei, H.-Q.; Wang, Y. Effects of light intensity on morphological and physiological characteristics of tobacco seedlings. J. Appl. Ecol. 2007, 18, 2642–2645. [Google Scholar]
- Butler, R.D. The Effect of Light Intensity on Stem and Leaf Growth in Broad Bean Seedlings. J. Exp. Bot. 1963, 14, 142–152. [Google Scholar] [CrossRef]
- Makino, A.; Sato, T.; Nakano, H.; Mae, T. Leaf photosynthesis, plant growth and nitrogen allocation in rice under different irradiances. Planta 1997, 203, 390–398. [Google Scholar] [CrossRef]
- Zervoudakis, G.; Salahas, G.; Kaspiris, G.; Konstantopoulou, E. Influence of light intensity on growth and physiological characteristics of common sage (Salvia officinalis L.). Braz. Arch. Biol. Technol. 2012, 55, 89–95. [Google Scholar] [CrossRef]
- Xie, S.; Luo, X. Effect of leaf position and age on anatomical structure, photosynthesis, stomatal conductance and transpiration of Asian pear. Bot. Bull. Acad. Sin. 2003, 44. [Google Scholar] [CrossRef]
- Jose, S.; Merritt, S.; Ramsey, C.L. Growth, nutrition, photosynthesis and transpiration responses of longleaf pine seedlings to light, water and nitrogen. For. Ecol. Manag. 2003, 180, 335–344. [Google Scholar] [CrossRef]
- Harris, R.W. Root-shoot ratios. J. Arboric. 1992, 18, 39–42. [Google Scholar]
- Poorter, H.; Nagel, O. The role of biomass allocation in the growth response of plants to different levels of light, CO2, nutrients and water: A quantitative review. Funct. Plant Biol. 2000, 27, 1191. [Google Scholar] [CrossRef]
- Fernandes, V.F.; De Almeida, L.B.; Feijó, E.V.D.S.; Silva, D.D.C.; De Oliveira, R.A.; Mielke, M.S.; Costa, L.C.D.B. Light intensity on growth, leaf micromorphology and essential oil production of Ocimum gratissimum. Rev. Bras. Farm. 2013, 23, 419–424. [Google Scholar] [CrossRef]
- Shipley, B.; Meziane, D. The balanced-growth hypothesis and the allometry of leaf and root biomass allocation. Funct. Ecol. 2002, 16, 326–331. [Google Scholar] [CrossRef]
- Mielke, M.S.; Schaffer, B. Photosynthetic and growth responses of Eugenia uniflora L. seedlings to soil flooding and light intensity. Environ. Exp. Bot. 2010, 68, 113–121. [Google Scholar] [CrossRef]
- Dai, Y.; Shen, Z.; Liu, Y.; Wang, L.; Hannaway, D.; Lu, H. Effects of shade treatments on the photosynthetic capacity, chlorophyll fluorescence, and chlorophyll content of Tetrastigma hemsleyanum Diels et Gilg. Environ. Exp. Bot. 2009, 65, 177–182. [Google Scholar] [CrossRef]
- Dordas, C.A.; Sioulas, C. Safflower yield, chlorophyll content, photosynthesis, and water use efficiency response to nitrogen fertilization under rainfed conditions. Ind. Crops Prod. 2008, 27, 75–85. [Google Scholar] [CrossRef]
- Walters, R.G. Towards an understanding of photosynthetic acclimation. J. Exp. Bot. 2004, 56, 435–447. [Google Scholar] [CrossRef]
- Ormrod, D.P.; Lesser, V.M.; Olszyk, D.M.; Tingey, D.T. Elevated Temperature and Carbon Dioxide Affect Chlorophylls and Carotenoids in Douglas-Fir Seedlings. Int. J. Plant Sci. 1999, 160, 529–534. [Google Scholar] [CrossRef]
- Bohne, F.; Linden, H. Regulation of carotenoid biosynthesis genes in response to light in Chlamydomonas reinhardtii. Biochim. Biophys. Acta (BBA) Gene Struct. Expr. 2002, 1579, 26–34. [Google Scholar] [CrossRef]
- Lichtenthaler, H.K.; Buschmann, C. Chlorophylls and Carotenoids: Measurement and Characterization by UV-VIS Spectroscopy. Curr. Protoc. Food Anal. Chem. 2001, 1, 4–15. [Google Scholar] [CrossRef]
- Kitajima, K.; Hogan, K.P. Increases of chlorophyll a /b ratios during acclimation of tropical woody seedlings to nitrogen limitation and high light. Plant Cell Environ. 2003, 26, 857–865. [Google Scholar] [CrossRef] [PubMed]
- Crawford, A.J.; McLachlan, D.H.; Hetherington, A.M.; Franklin, K.A. High temperature exposure increases plant cooling capacity. Curr. Biol. 2012, 22, 396–397. [Google Scholar] [CrossRef]
- Haldimann, P. How do changes in temperature during growth affect leaf pigment composition and photosynthesis in Zea mays genotypes differing in sensitivity to low temperature? J. Exp. Bot. 1999, 50, 543–550. [Google Scholar] [CrossRef]
- Canavar, Ö. Comparison and determination of the leaf temperature of sunflower and safflower under drought stress. Helia 2013, 36, 47–58. [Google Scholar] [CrossRef]
- Kanemasu, E.T.; Tanner, C.B. Stomatal Diffusion Resistance of Snap Beans. I. Influence of Leaf-Water Potential. Plant Physiol. 1969, 44, 1547–1552. [Google Scholar] [CrossRef]
- Bower, K.E. Relationship between Transpiration and Nitrogen Uptake by Pepper (Capsicum annuum) as Mediated by Vapor Pressure Deficit. Master’s Thesis, The University of Georgia, Athens, GA, USA, 2005. [Google Scholar]
- Bauer, H.; Ache, P.; Wohlfart, F.; Al-Rasheid, K.A.; Sonnewald, S.; Sonnewald, U.; Kneitz, S.; Hetherington, A.M.; Hedrich, R. How Do Stomata Sense Reductions in Atmospheric Relative Humidity? Mol. Plant 2013, 6, 1703–1706. [Google Scholar] [CrossRef][Green Version]
- Arve, L.E.; Terfa, M.T.; Gislerød, H.R.; Olsen, J.E.; Torre, S. High relative air humidity and continuous light reduce stomata functionality by affecting the ABA regulation in rose leaves. Plant Cell Environ. 2013, 36, 382–392. [Google Scholar] [CrossRef] [PubMed]
- Maurel, C.; Verdoucq, L.; Rodrigues, O. Aquaporins and plant transpiration. Plant Cell Environ. 2016, 39, 2580–2587. [Google Scholar] [CrossRef]
- Paiva, E.A.S.; Isaias, R.M.D.S.; Vale, F.H.A.; Queiroz, C.G.D.S. The influence of light intensity on anatomical structure and pigment contents of Tradescantia pallida (Rose) Hunt. cv. purpurea Boom (Commelinaceae) leaves. Braz. Arch. Biol. Technol. 2003, 46, 617–624. [Google Scholar] [CrossRef]
- Nguyen, P.; Cin, V.D. The role of light on foliage colour development in coleus (Solenostemon scutellarioides (L.) Codd). Plant Physiol. Biochem. 2009, 47, 934–945. [Google Scholar] [CrossRef] [PubMed]
- Kawabata, S.; Kusuhara, Y.; Li, Y.; Sakiyama, R. The Regulation of Anthocyanin Biosynthesis in Eustoma grandiflorum under Low Light Conditions. J. Jpn. Soc. Hortic. Sci. 1999, 68, 519–526. [Google Scholar] [CrossRef]
- Dhar, M.K.; Sharma, R.; Koul, A.; Kaul, S. Development of fruit color in Solanaceae: A story of two biosynthetic pathways. Briefings Funct. Genom. 2015, 14, 199–212. [Google Scholar] [CrossRef]
- Ibrahim, M.H.; Jaafar, H.Z.E. Primary, Secondary Metabolites, H2O2, Malondialdehyde and Photosynthetic Responses of Orthosiphon stimaneus Benth. to Different Irradiance Levels. Molecules 2012, 17, 1159–1176. [Google Scholar] [CrossRef]
- Cevahir, G.; Yentur, S.; Yazgan, M.E.V.Z.U.L.E.; Unal, M.; Yilmazer, N.A.D.I.M. Peroxidase activity in relation to anthocyanin and chlorophyll content in juvenile and adult leaves of “mini-star” Gazania splendens. Pak. J. Bot. 2004, 36, 603–610. [Google Scholar]
- Seyoum, A.; Asres, K.; El-Fiky, F.K. Structure–radical scavenging activity relationships of flavonoids. Phytochemistry 2006, 67, 2058–2070. [Google Scholar] [CrossRef]
- Hamid, A.A.; Aminuddin, A.; Yunus, M.H.M.; Murthy, J.K.; Hui, C.K.; Ugusman, A. Antioxidative and anti-inflammatory activities of Polygonum minus: A review of literature. Rev. Cardiovasc. Med. 2020, 21, 275–287. [Google Scholar] [CrossRef] [PubMed]
- Greenberg, E.R.; Sporn, M.B. Antioxidant Vitamins, Cancer, and Cardiovascular Disease. N. Engl. J. Med. 1996, 334, 1189–1190. [Google Scholar] [CrossRef]
- Block, K.I.; Koch, A.C.; Mead, M.N.; Tothy, P.K.; Newman, R.A.; Gyllenhaal, C. Impact of antioxidant supplementation on chemotherapeutic toxicity: A systematic review of the evidence from randomized controlled trials. Int. J. Cancer 2008, 123, 1227–1239. [Google Scholar] [CrossRef] [PubMed]
- Somporn, C.; Kamtuo, A.; Theerakulpisut, P.; Siriamornpun, S. Effect of shading on yield, sugar content, phenolic acids and antioxidant property of coffee beans (Coffea Arabica L. cv. Catimor) harvested from north-eastern Thailand. J. Sci. Food Agric. 2012, 92, 1956–1963. [Google Scholar] [CrossRef] [PubMed]
- Karimi, E.; Jaafar, H.Z.; Ghasemzadeh, A.; Ibrahim, M.H. Light intensity effects on production and antioxidant activity of flavonoids and phenolic compounds in leaves, stems and roots of three varieties of Labisia pumila Benth. Aust. J. Crops Sci. 2013, 7, 1016. [Google Scholar]
- Stagnari, F.; Galieni, A.; Pisante, M. Shading and nitrogen management affect quality, safety and yield of greenhouse-grown leaf lettuce. Sci. Hortic. 2015, 192, 70–79. [Google Scholar] [CrossRef]
- Mahmud, M.; Ramasamy, S.; Othman, R.; Abdullah, R.; Yaacob, J.S. Effect of Vermicompost Application on Bioactive Properties and Antioxidant Potential of MD2 Pineapple Fruits. Agronomy 2019, 9, 97. [Google Scholar] [CrossRef]
- Stahl, W.; Sies, H. Antioxidant activity of carotenoids. Mol. Asp. Med. 2003, 24, 345–351. [Google Scholar] [CrossRef]
- Williams, C.A. Anthocyanins and other flavonoids. Nat. Prod. Rep. 2004, 21, 539–573. [Google Scholar] [CrossRef]
- Miguel, M.G. Anthocyanins: Antioxidant and/or anti-inflammatory activities. J. Appl. Pharm. Sci. 2011, 1, 7–15. [Google Scholar]
- Sanquetta, C.R.; Corte, A.P.; Da Silva, F. Biomass expansion factor and root-to-shoot ratio for Pinus in Brazil. Carbon Balance Manag. 2011, 6, 6. [Google Scholar] [CrossRef]
- Raai, M.N.; Zain, N.A.M.; Osman, N.; Rejab, N.A.; Sahruzaini, N.A.; Cheng, A. Effects of shading on the growth, development and yield of winged bean (Psophocarpus tetragonolobus). Ciência Rural 2020, 50. [Google Scholar] [CrossRef]
- Li, Y.; He, N.; Hou, J.; Xu, L.; Liu, C.; Zhang, J.; Wang, Q.; Zhang, X.; Wu, X. Factors Influencing Leaf Chlorophyll Content in Natural Forests at the Biome Scale. Front. Ecol. Evol. 2018, 6. [Google Scholar] [CrossRef]
- Giusti, M.; Wrolstad, R.E. Characterization and Measurement of Anthocyanins by UV-Visible Spectroscopy. Curr. Protoc. Food Anal. Chem. 2001, 1, 1–2. [Google Scholar] [CrossRef]
- Yusof, Z.; Ramasamy, S.; Mahmood, N.Z.; Yaacob, J.S. Vermicompost Supplementation Improves the Stability of Bioactive Anthocyanin and Phenolic Compounds in Clinacanthus nutans Lindau. Molecules 2018, 23, 1345. [Google Scholar] [CrossRef] [PubMed]
- Benzie, I.F.; Strain, J. Ferric reducing/antioxidant power assay: Direct measure of total antioxidant activity of biological fluids and modified version for simultaneous measurement of total antioxidant power and ascorbic acid concentration. Methods Enzymol. 1999, 299, 15–27. [Google Scholar] [CrossRef]


| Treatments | T1 | T2 | T3 | |
|---|---|---|---|---|
| Leaf gas exchange | A (µ mol CO2 m−2 s−1) | 6.845 ± 1.68 b | 14.892 ± 3.65 a | 6.860 ± 2.36 b |
| Tleaves (°C) | 33.81 ± 0.381 b | 36.10 ± 1.061 a | 35.69 ± 0.432 a | |
| E (mmol H2O m−2 s−1) | 0.259 ± 0.0008 b | 0.3399 ± 0.0008 a | 0.282 ± 0.0008 b | |
| Gs (mol H2O m−2 s−1) | 0.006 ± 0.00078 b | 0.007 ± 0.00083 a | 0.0058 ± 0.000818 b | |
| Pigments | Chl a (mg g−1 FW) | 2.843 ± 0.128 c | 5.251 ± 0.539 a | 3.9 ± 0.161 b |
| Chl b (mg g−1 FW) | 3.308 ± 0.031 bc | 5.317 ± 0.785 a | 3.848 ± 0.338 ab | |
| Car (mg g−1 FW) | 1.474 ± 0.052 bc | 2.771 ± 0.369 a | 2.244 ± 0.195 ab | |
| Chl a + b (mg g−1 FW) | 6.151 ± 0.144 bc | 10.568 ± 1.324 a | 7.748 ± 0.497 ab | |
| a/b ratio | 0.859 ± 0.036 a | 1.013 ± 0.058 a | 1.029 ± 0.046 a | |
| SPAD | 26.258 ± 0.822 c | 33.716 ± 1.198 a | 30.305 ± 0.916 b |
| 1 | 2 | 3 | 4 | 5 | 6 | 7 | 8 | 9 | 10 | 11 | 12 | 13 | 14 | 15 | 16 | 17 | 18 | 19 | ||
|---|---|---|---|---|---|---|---|---|---|---|---|---|---|---|---|---|---|---|---|---|
| 1 | PH | 1 | - | - | ||||||||||||||||
| 2 | LN | 0.692 ** | 1 | - | ||||||||||||||||
| 3 | LDW | −0.276 | 0.212 | 1 | ||||||||||||||||
| 4 | SDW | −0.185 | 0.266 | 0.988 ** | 1 | |||||||||||||||
| 5 | RDW | −0.184 | 0.264 | 0.985 ** | 0.998 ** | 1 | ||||||||||||||
| 6 | RSR | −0.500 | 0.008 | 0.793 ** | 0.746 ** | 0.764 ** | 1 | |||||||||||||
| 7 | A | −0.088 | −0.210 | −0.040 | 0.044 | 0.045 | −0.162 | 1 | ||||||||||||
| 8 | E | 0.075 | −0.495 | −0.326 | −0.300 | −0.323 | −0.441 | 0.242 | 1 | |||||||||||
| 9 | Gs | 0 | −0.530 | −0.335 | −0.304 | −0.326 | −0.434 | 0.313 | 0.972 ** | 1 | ||||||||||
| 10 | Tleaves | 0.484 | 0.026 | −0.209 | −0.189 | −0.199 | −0.344 | −0.104 | 0.501 | 0.293 | 1 | |||||||||
| 11 | Chl a | 0.342 | −0.277 | −0.398 | −0.314 | −0.316 | −0.557 * | 0.536 * | 0.652 * | 0.620 * | 0.468 | 1 | ||||||||
| 12 | Chl b | 0.145 | −0.367 | −0.304 | −0.254 | −0.255 | −0.394 | 0.540 * | 0.553 * | 0.508 | 0.416 | 0.939 ** | 1 | |||||||
| 13 | Car | 0.311 | −0.254 | −0.397 | −0.329 | −0.333 | −0.595 * | 0.482 | 0.513 | 0.477 | 0.42 | 0.963 ** | 0.946 ** | 1 | ||||||
| 14 | Chl a+b | 0.244 | −0.329 | −0.355 | −0.287 | −0.289 | −0.480 | 0.546 * | 0.610 * | 0.570 * | 0.448 | 0.984 ** | 0.986 ** | 0.969 ** | 1 | |||||
| 15 | a/b ratio | 0.524 | 0.262 | −0.263 | −0.164 | −0.168 | −0.475 | 0.033 | 0.239 | 0.282 | 0.105 | 0.149 | −0.196 | 0.038 | −0.030 | 1 | ||||
| 16 | SPAD | 0.586 * | 0.089 | −0.330 | −0.321 | −0.321 | −0.448 | −0.195 | 0.388 | 0.213 | 0.850 ** | 0.463 | 0.43 | 0.456 | 0.453 | 0.027 | 1 | |||
| 17 | TAC | −0.094 | −0.410 | −0.382 | −0.330 | −0.331 | −0.552 | 0.483 | 0.309 | 0.434 | −0.255 | 0.522 | 0.413 | 0.549 * | 0.473 | 0.351 | −0.103 | 1 | ||
| 18 | TPC | 0.805 ** | 0.361 | −0.281 | −0.204 | −0.212 | −0.553 * | 0.072 | 0.357 | 0.212 | 0.798 ** | 0.529 | 0.39 | 0.498 | 0.464 | 0.36 | 0.744 ** | −0.119 | 1 | |
| 19 | TFC | 0.845 ** | 0.498 | −0.428 | −0.365 | −0.378 | −0.680 * | −0.162 | 0.154 | 0.029 | 0.663 * | 0.353 | 0.192 | 0.387 | 0.274 | 0.445 | 0.644 * | −0.085 | 0.889 ** | 1 |
| Treatments | FRAP (mg g−1 DE) | DPPH IC50 (mg mL−1) | ||
|---|---|---|---|---|
| 8 Weeks | 16 Weeks | 8 Weeks | 16 Weeks | |
| T1 | 2.041 ± 0.004 ab | 1.930 ± 0.404 ab | 3.338 ± 0.001 a | 4.202 ± 0.423 a |
| T2 | 1.933 ± 0.016 ab | 2.616 ± 0.071 a | 2.543 ± 0.001 ab | 0.657 ± 0.007 b |
| T3 | 1.641 ± 0.019 b | 1.457 ± 0.036 bc | 2.168 ± 0.340 ab | 1.949 ± 0.571 ab |
| 1 | 2 | 3 | 4 | 5 | 6 | 7 | 8 | ||
|---|---|---|---|---|---|---|---|---|---|
| 1 | Chl a | 1 | |||||||
| 2 | Chl b | 0.939 ** | 1 | ||||||
| 3 | Car | 0.963 ** | 0.946 ** | 1 | |||||
| 4 | TAC | 0.522 | 0.413 | 0.549 * | 1 | ||||
| 5 | TPC | 0.529 | 0.390 | 0.498 | −0.119 | 1 | |||
| 6 | TFC | 0.353 | 0.192 | 0.387 | −0.085 | 0.889 ** | 1 | ||
| 7 | FRAP | 0.734 ** | 0.598 * | 0.707 ** | 0.859 ** | 0.246 | 0.185 | 1 | |
| 8 | DPPH | −0.209 | −0.110 | −0.330 | −0.666 * | −0.034 | −0.202 | −0.590 * | 1 |
Publisher’s Note: MDPI stays neutral with regard to jurisdictional claims in published maps and institutional affiliations. |
© 2021 by the authors. Licensee MDPI, Basel, Switzerland. This article is an open access article distributed under the terms and conditions of the Creative Commons Attribution (CC BY) license (http://creativecommons.org/licenses/by/4.0/).
Share and Cite
Mohd Yusof, F.F.; Yaacob, J.S.; Osman, N.; Ibrahim, M.H.; Wan-Mohtar, W.A.A.Q.I.; Berahim, Z.; Mohd Zain, N.A. Shading Effects on Leaf Gas Exchange, Leaf Pigments and Secondary Metabolites of Polygonum minus Huds., an Aromatic Medicinal Herb. Plants 2021, 10, 608. https://doi.org/10.3390/plants10030608
Mohd Yusof FF, Yaacob JS, Osman N, Ibrahim MH, Wan-Mohtar WAAQI, Berahim Z, Mohd Zain NA. Shading Effects on Leaf Gas Exchange, Leaf Pigments and Secondary Metabolites of Polygonum minus Huds., an Aromatic Medicinal Herb. Plants. 2021; 10(3):608. https://doi.org/10.3390/plants10030608
Chicago/Turabian StyleMohd Yusof, Fairuz Fatini, Jamilah Syafawati Yaacob, Normaniza Osman, Mohd Hafiz Ibrahim, Wan Abd Al Qadr Imad Wan-Mohtar, Zulkarami Berahim, and Nurul Amalina Mohd Zain. 2021. "Shading Effects on Leaf Gas Exchange, Leaf Pigments and Secondary Metabolites of Polygonum minus Huds., an Aromatic Medicinal Herb" Plants 10, no. 3: 608. https://doi.org/10.3390/plants10030608
APA StyleMohd Yusof, F. F., Yaacob, J. S., Osman, N., Ibrahim, M. H., Wan-Mohtar, W. A. A. Q. I., Berahim, Z., & Mohd Zain, N. A. (2021). Shading Effects on Leaf Gas Exchange, Leaf Pigments and Secondary Metabolites of Polygonum minus Huds., an Aromatic Medicinal Herb. Plants, 10(3), 608. https://doi.org/10.3390/plants10030608