
Impact of Rising Temperature in the Deposition Patterns of Bioactive Compounds in Field Grown Food Barley Grains

 ,
,  , , and
Abstract
1. Introduction
2. Results
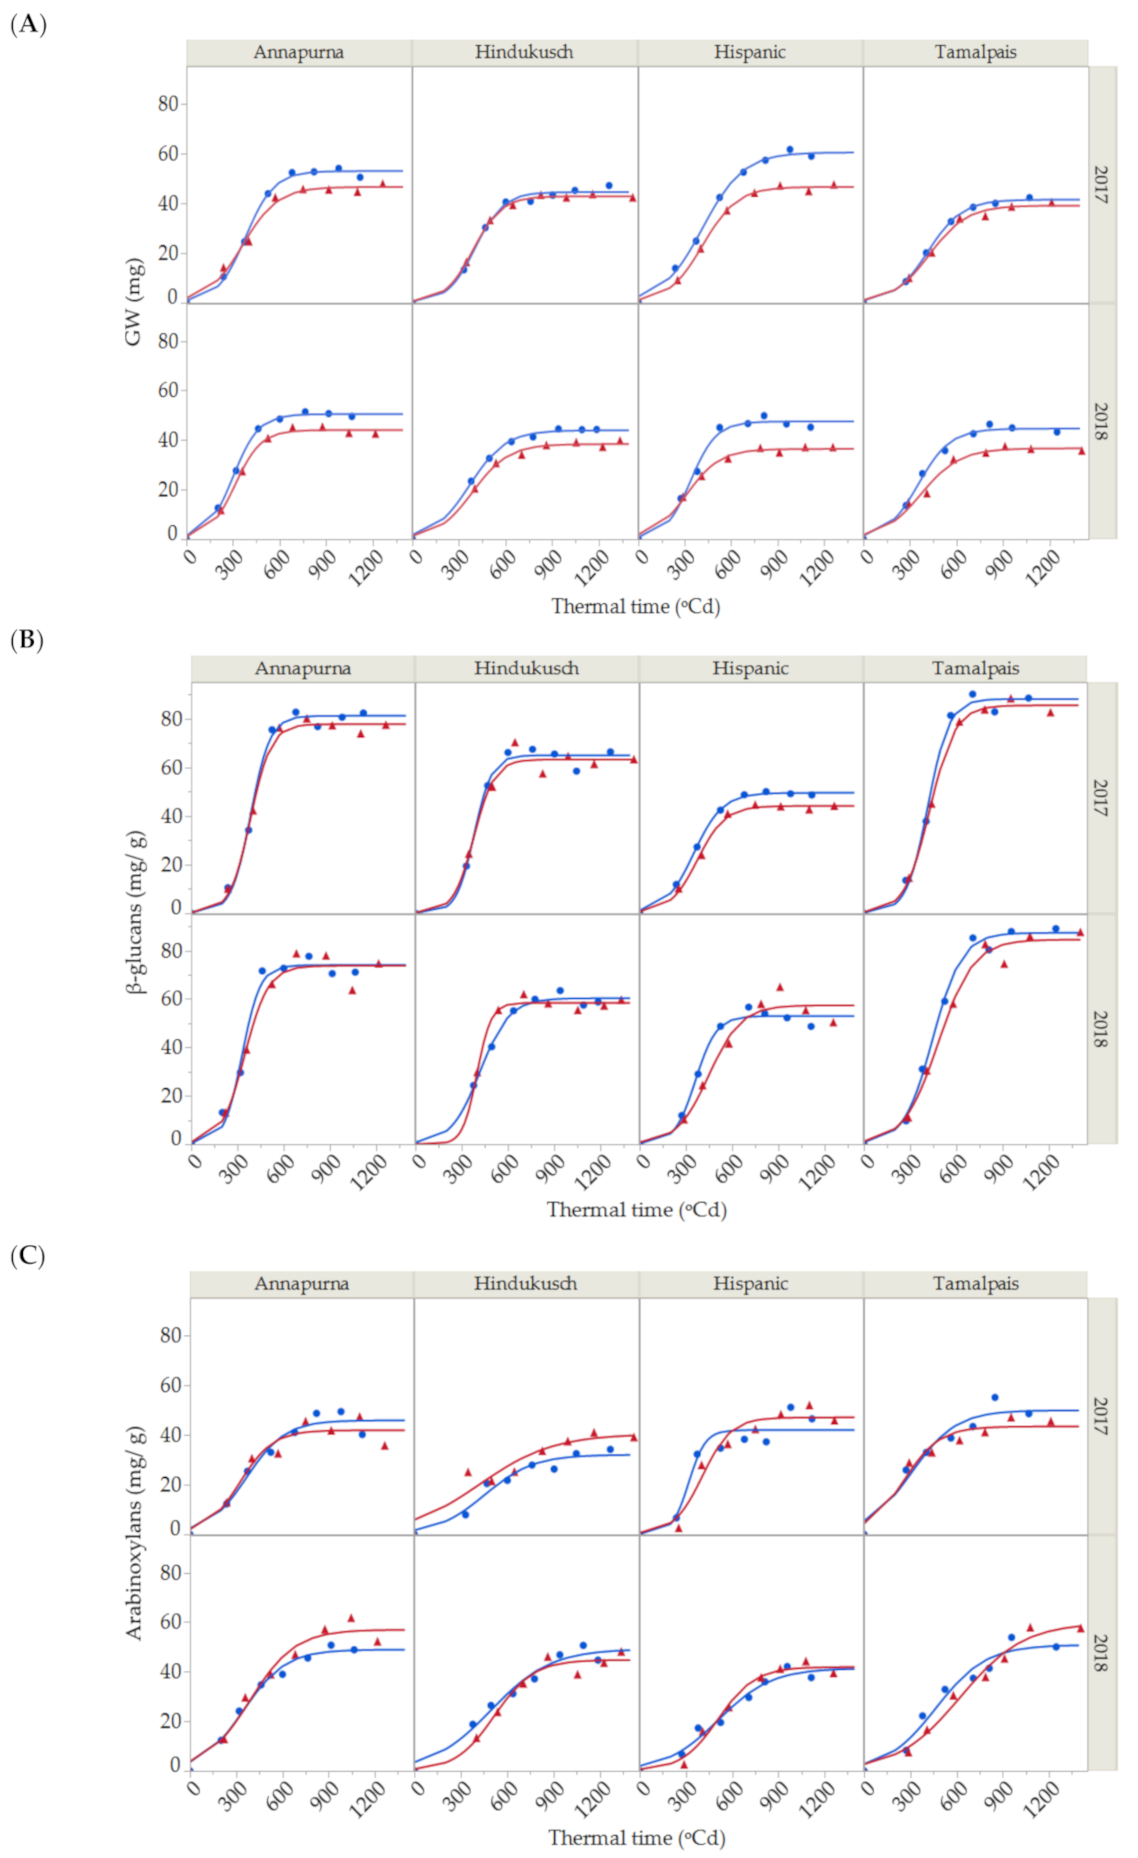
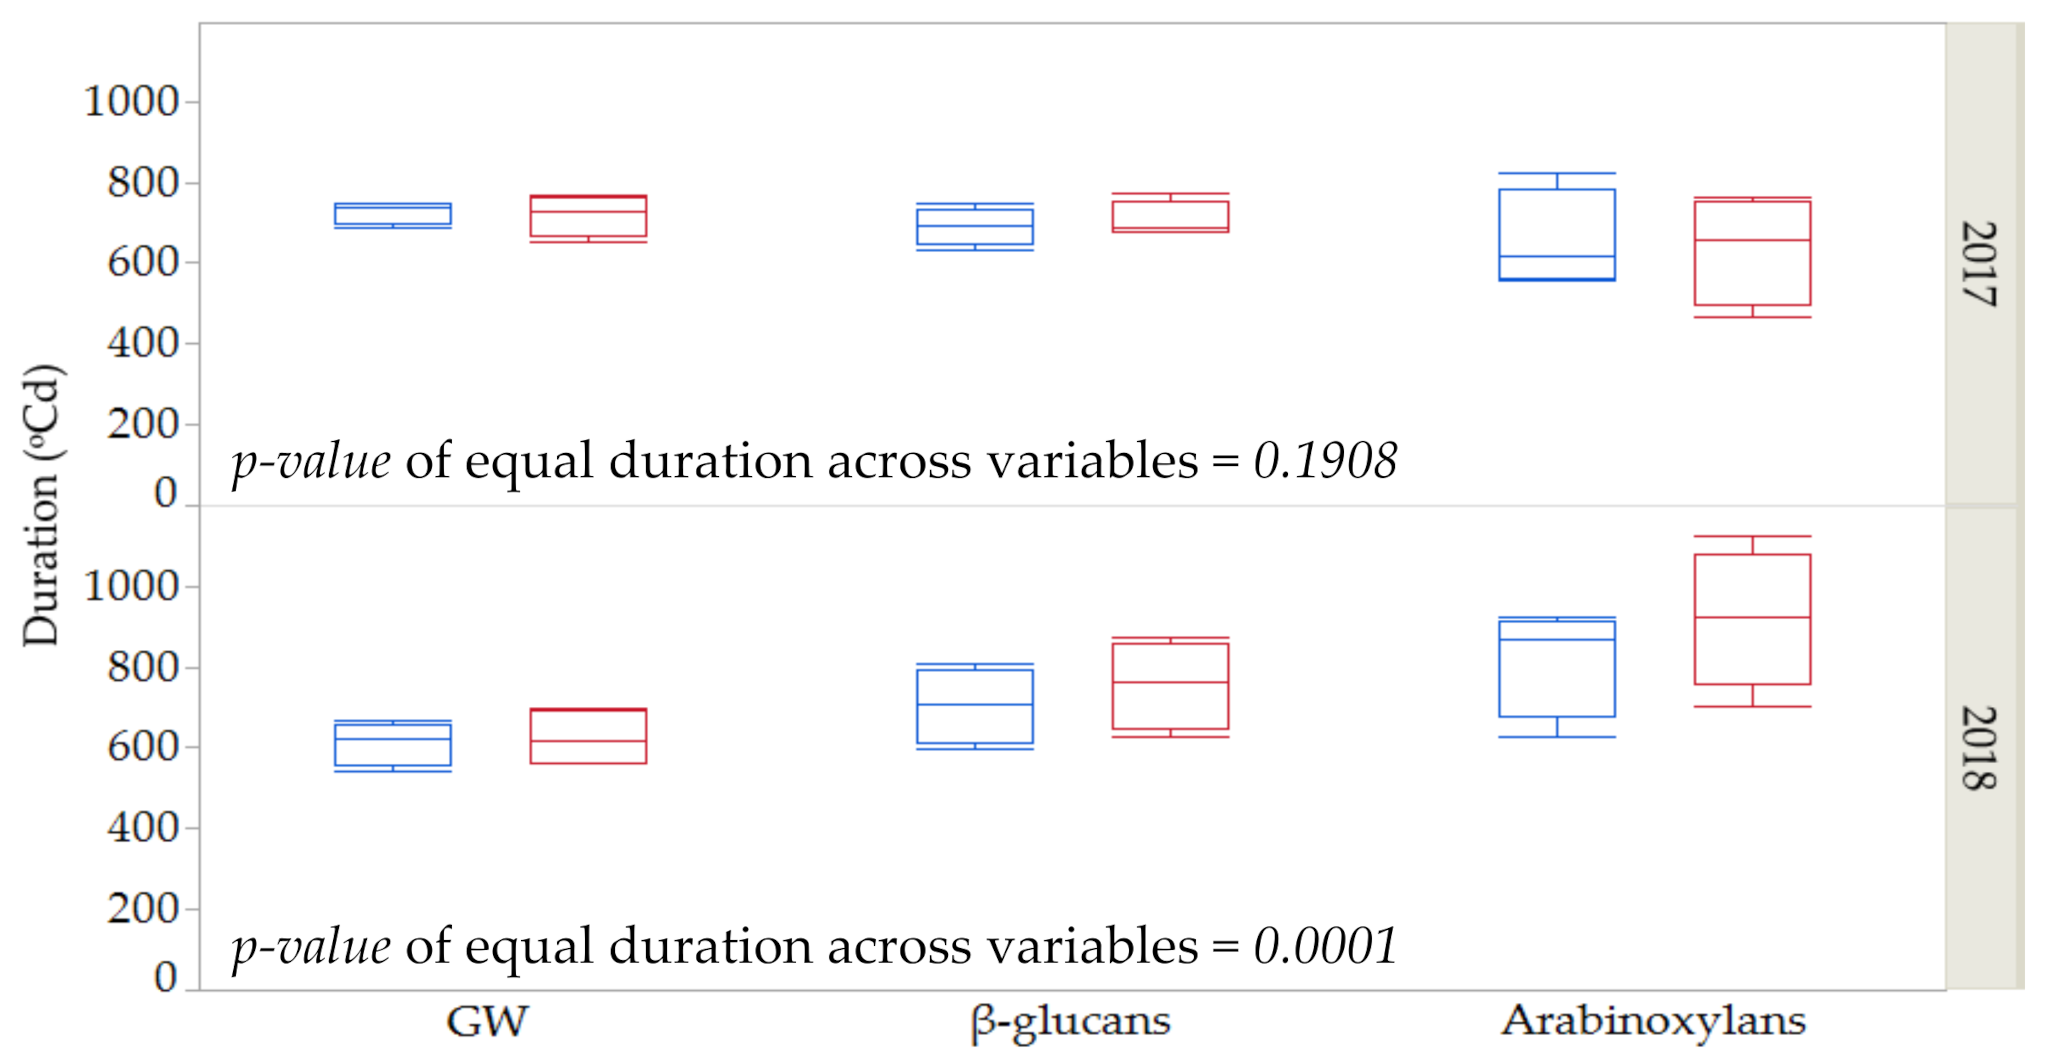
2.1. Grain Weight
2.2. β-Glucan and Arabinoxylan Contents
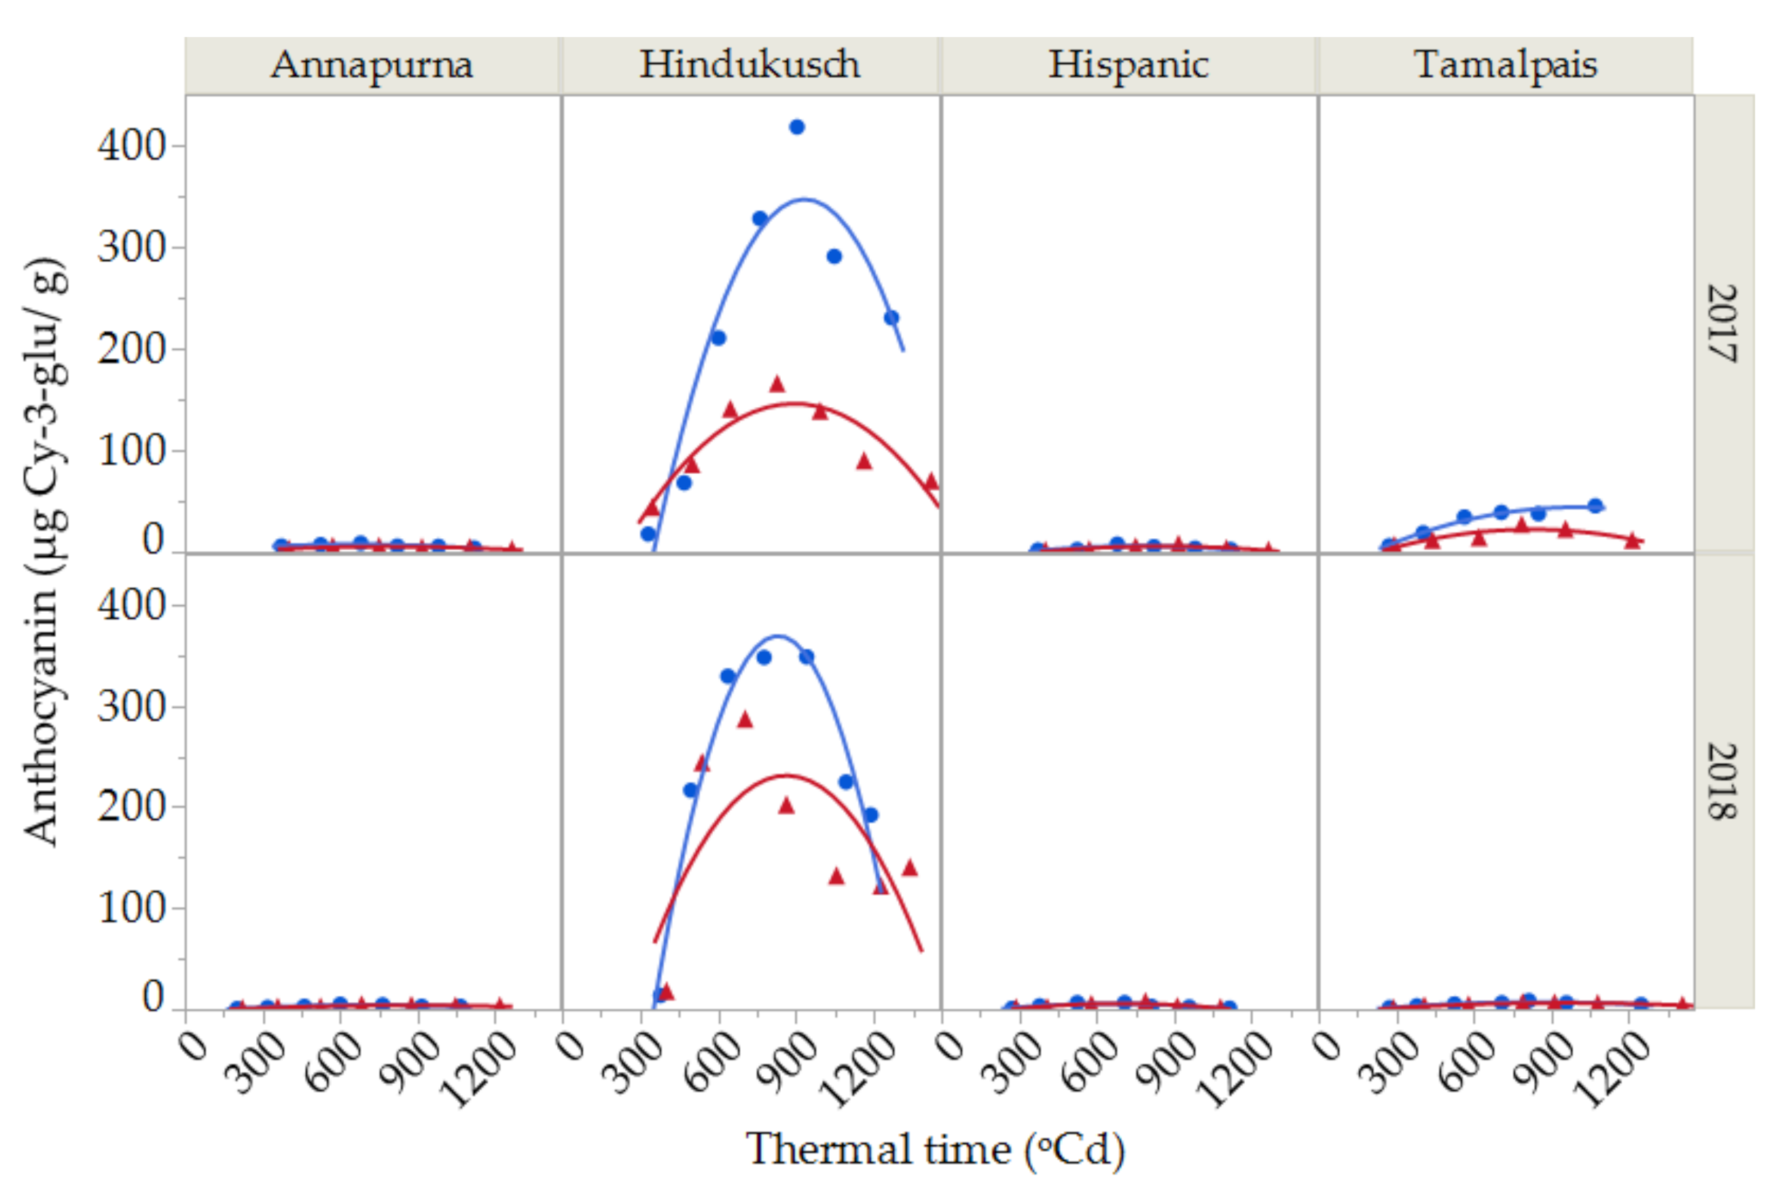
2.3. Anthocyanin Contents
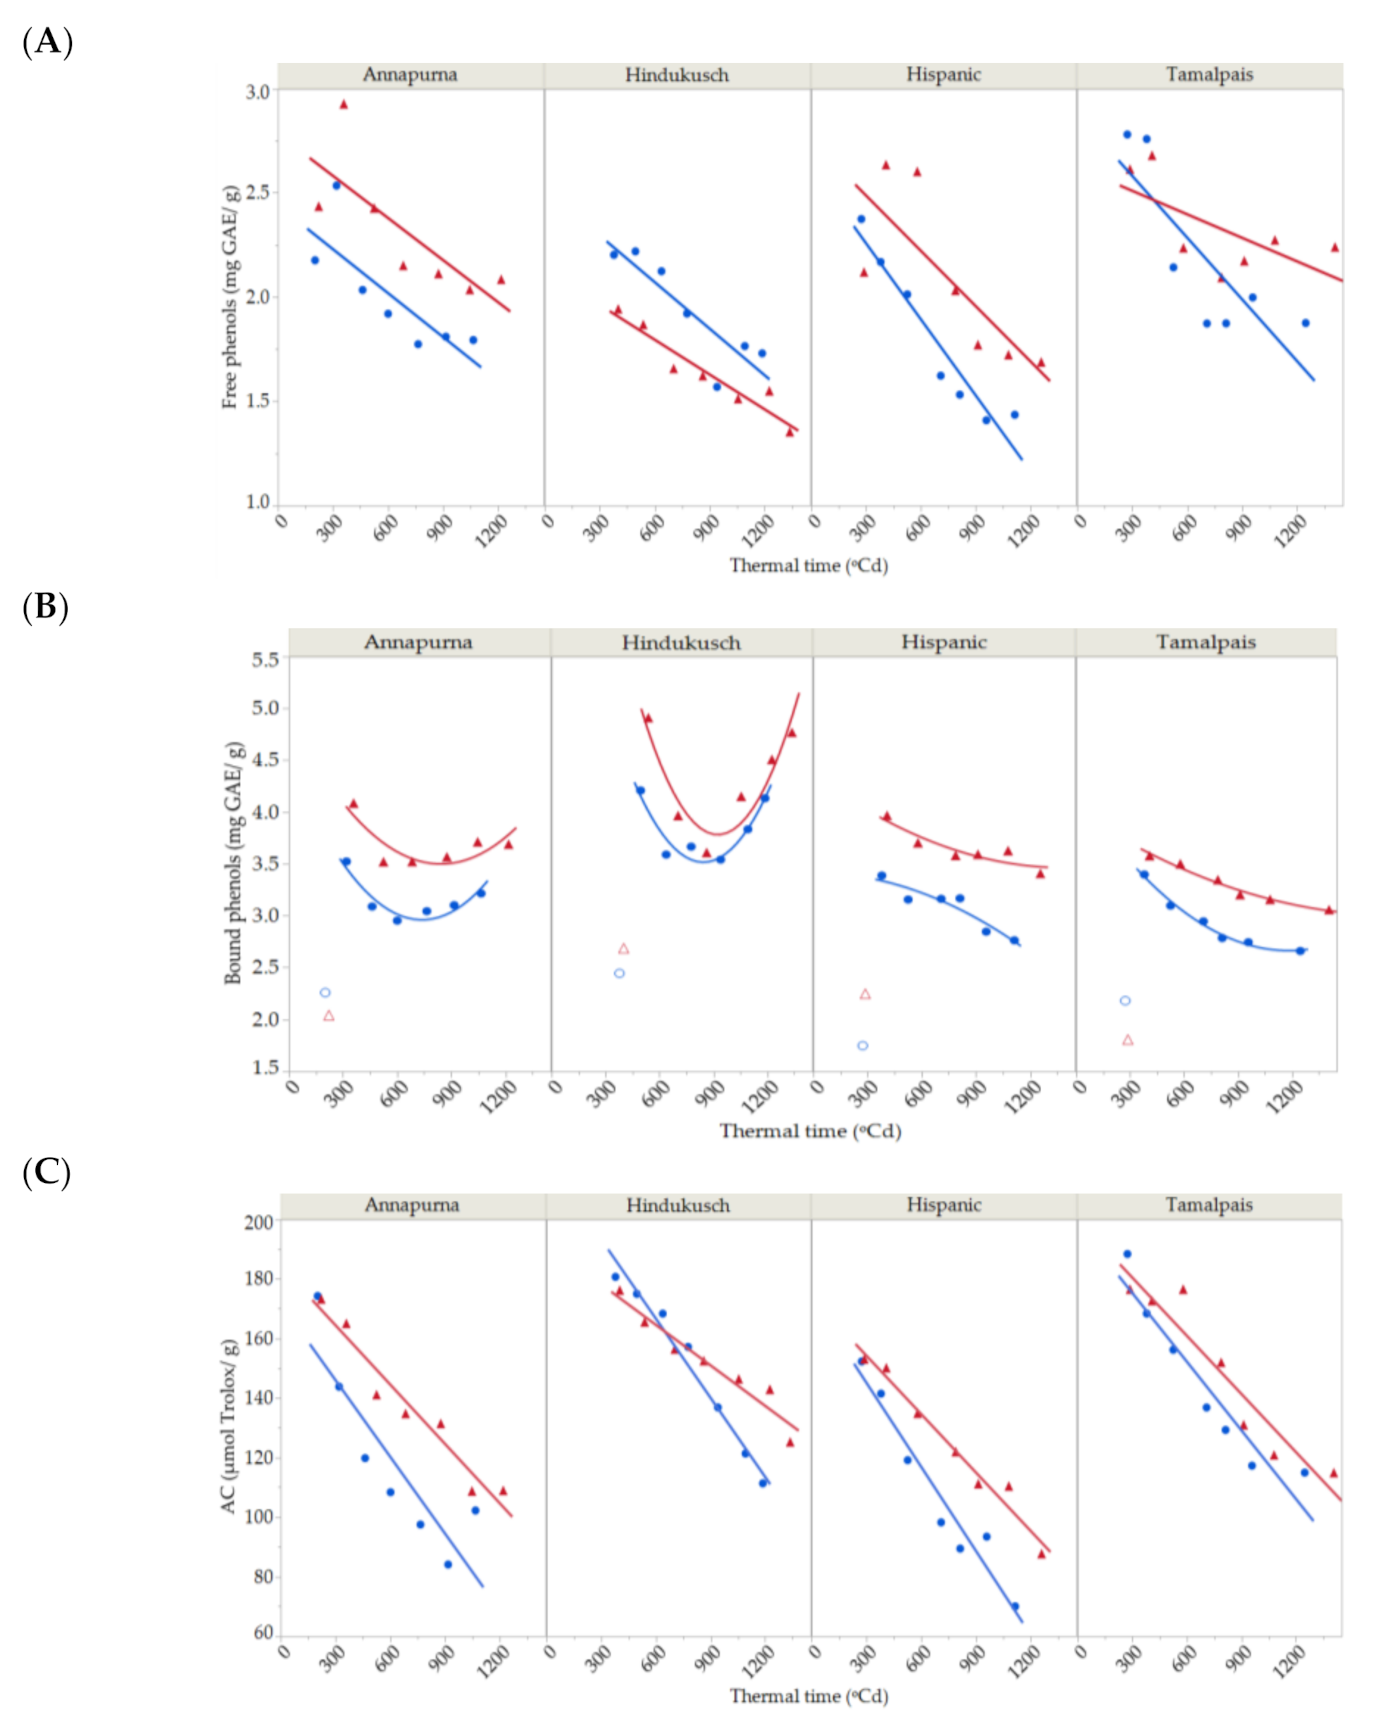
2.4. Free and Bound Phenol Contents
2.5. Antioxidant Capacity
3. Discussion
4. Materials and Methods
4.1. Field Site Description, Treatments and Experimental Conditions
4.2. Grain Weight and Milling
4.3. Determination of β-Glucans and Arabinoxylans
4.4. Determination of Anthocyanins
4.5. Determination of Free and Bound Phenolic Compounds
4.6. Determination of Antioxidant Capacity
4.7. Statistical Analysis
5. Conclusions
Supplementary Materials
Author Contributions
Funding
Conflicts of Interest
Abbreviations
References
- Idehen, E.; Tang, Y.; Sang, S. Bioactive phytochemicals in barley. J. Food Drug Anal. 2017, 25, 148–161. [Google Scholar] [CrossRef]
- EFSA. Scientific opinion on the substantiation of health claims related to β-glucans from oats and barley and maintenance of normal blood LDL-cholesterol concentrations (ID 1236, 1299), increase in satiety leading to a reduction in energy intake (ID 851, 852), reduction of post-prandial glycaemic responses (ID 821, 824), and “digestive function” (ID 850) pursuant to Article 13(1) of Regulation (EC) No 1924/2006. EFSA J. 2011, 9, 2207. Available online: http://www.efsa.europa.eu/en/efsajournal/pub/2207 (accessed on 8 June 2020).
- FDA. Food Labeling: Health Claims; Soluble Dietary Fiber from Certain Foods and Coronary Heart Disease. [Docket No. FDA-2008-P0090]. Available online: https://pubmed.ncbi.nlm.nih.gov/12361061/ (accessed on 8 June 2020).
- De Graaff, P.; Govers, C.; Wichers, H.J.; Debets, R. Consumption of β-glucans to spice up T cell treatment of tumors: A review. Expert Opin. Biol. Ther. 2018, 18, 1023–1040. [Google Scholar] [CrossRef] [PubMed]
- Biliaderis, C.G.; Lazaridou, A. Cereal non-starch polysaccharides as functional food ingredients: Structure-physical properties relations. Prog. Theor. Exp. Phys. 2009, 13, 197–201. [Google Scholar]
- Pandey, K.B.; Rizvi, S.I. Plant polyphenols as dietary antioxidants in human health and disease. Oxid. Med. Cell Longev. 2009, 2, 270–278. [Google Scholar] [CrossRef]
- Suriano, S.; Iannucci, A.; Codianni, P.; Fares, C.; Russo, M.; Pecchioni, N.; Marciello, U.; Savino, M. Phenolic acids profile, nutritional and phytochemical compounds, antioxidant properties in colored barley grown in southern Italy. Int. Food Res. J. 2018, 113, 221–233. [Google Scholar] [CrossRef]
- Martínez, M.; Motilva, M.J.; López de las Hazas, M.C.; Romero, M.P.; Vaculova, K.; Ludwig, I.A. Phytochemical composition and β-glucan content of barley genotypes from two different geographic origins for human health food production. Food Chem. 2018, 245, 61–70. [Google Scholar] [CrossRef] [PubMed]
- Schulman, A.H.; Runeberg-Roos, P.; Jääskeläinen, M. Grain filling and starch synthesis in barley. In Carbohydrate Reserves in Plants-Synthesis and Regulation, 1st ed.; Gupta, A.K., Kaur, N., Eds.; Elsevier Science B.V.: Amsterdam, The Netherlands, 2000; pp. 147–167. [Google Scholar]
- Dodig, D.; Kandi, V.; Zori, M.; Nikoli-Dori, E.; Nikoli, A.; Mutavdži, B.; Perov, D.; Šurlan-Momirovi, G. Comparative kernel growth and yield components of two- and six-row barley (Hordeum vulgare) under terminal drought simulated by defoliation. Crop. Pasture Sci. 2018, 69, 1215–1224. [Google Scholar] [CrossRef]
- Loss, S.P.; Kirby, E.J.M.; Siddique, K.H.M.; Perry, M.W. Grain growth and development of old and modern Australian wheats. Field Crop. Res. 1989, 21, 131–146. [Google Scholar] [CrossRef]
- Egli, D.B. The role of seed in the determination of yield in grain crops. Aust. J. Agric. Res. 2006, 57, 1237–1247. [Google Scholar] [CrossRef]
- De Arcangelis, E.; Messia, M.C.; Marconi, E. Variation of polysaccharides profiles in developing kernels of different barley cultivars. J. Cereal Sci. 2019, 85, 273–278. [Google Scholar] [CrossRef]
- Verspreet, J.; Hemdane, S.; Dornez, E.; Cuyvers, S.; Pollet, A.; Delcour, J.A.; Courtin, C.M. Analysis of Storage and Structural Carbohydrates in Developing Wheat (Triticum aestivum L.) Grains Using Quantitative Analysis and Microscopy. J. Agric. Food Chem. 2013, 61, 9251–9259. [Google Scholar] [CrossRef]
- Wilson, S.M.; Burton, R.A.; Collins, H.M.; Doblin, M.S.; Pettolino, F.A.; Shirley, N.; Fincher, G.B.; Bacic, A. Pattern of Deposition of Cell Wall Polysaccharides and Transcript Abundance of Related Cell Wall Synthesis Genes during Differentiation in Barley Endosperm. Plant. Physiol. 2012, 159, 655–670. [Google Scholar] [CrossRef] [PubMed]
- Ma, D.; Li, Y.; Zhang, J.; Wang, C.; Qin, H.; Ding, H.; Xie, Y.; Guo, T. Accumulation of phenolic compounds and expression profiles of phenol acid biosynthesis-related genes in developing grains of white, purple and red wheat. Front. Plant. Sci. 2016, 7, 528. [Google Scholar] [CrossRef]
- Knievel, D.C.; Abdel-Aal, E.S.M.; Rabalski, I.; Nakamura, T.; Hucl, P. Grain color development and the inheritance of high anthocyanin blue aleurone and purple pericarp in spring wheat (Triticum aestivum L.). J. Cereal Sci. 2009, 50, 113–120. [Google Scholar] [CrossRef]
- IPCC. Climate Change 2013: The Physical Science Basis. Contribution of Working Group I to the Fifth Assessment Report of the Intergovernmental Panel on Climate Change; Stocker, T.F., Qin, D., Plattner, G.-K., Tignor, M.M.B., Allen, S.K., Boschung, J., Nauels, A., Xia, Y., Bex, V., Midgley, P.M., Eds.; Cambridge University Press: Cambridge, UK; New York, NY, USA, 2013; p. 1535. [Google Scholar]
- Ko, J.; Ng, C.T.; Jeong, S.; Kim, J.-H.; Lee, B.; Kim, H.-Y. Impacts of regional climate change on barley yield and its geographical variation in South Korea. Int. Agrophys. 2019, 33, 81–96. [Google Scholar] [CrossRef]
- Dell’Aversana, E.; Hessini, K.; Ferchichi, S.; Fusco, G.M.; Woodrow, P.; Ciarmiello, L.F.; Abdelly, C.; Carillo, P. Salinity Duration Differently Modulates Physiological Parameters and Metabolites Profile in Roots of Two Contrasting Barley Genotypes. Plants 2021, 10, 307. [Google Scholar] [CrossRef] [PubMed]
- Ezquer, I.; Salameh, I.; Colombo, L.; Kalaitzis, P. Plant Cell Walls Tackling Climate Change: Biotechnological Strategies to Improve Crop Adaptations and Photosynthesis in Response to Global Warming. Plants 2020, 9, 212. [Google Scholar] [CrossRef]
- Li, J.; Lin, X.; Chen, A.; Peterson, T.; Ma, K.; Bertzky, M.; Ciais, P.; Kapos, V.; Peng, C.; Poulter, B. Global Priority Conservation Areas in the Face of 21st Century Climate Change. PLoS ONE 2013, 8, e54839. [Google Scholar] [CrossRef]
- Savin, R.; Nicolas, M.E. Effects of short periods of drought and high temperature on grain growth and starch accumulation of two malting barley cultivars. Aust. J. Plant. Physiol. 1996, 23, 201–210. [Google Scholar] [CrossRef]
- Martínez-Subirà, M.; Romero, M.P.; Moralejo, M.; Macià, A.; Puig, E.; Savin, R.; Romagosa, I. Post-anthesis thermal stress induces differential accumulation of bioactive compounds in field-grown barley. J. Sci. Food Agric. (under review).
- Elía, M.; Slafer, G.A.; Savin, R. Yield and grain weight responses to post-anthesis increases in maximum temperature under field grown wheat as modified by nitrogen supply. Field Crops Res. 2018, 221, 228–237. [Google Scholar] [CrossRef]
- Dias, A.S.; Lidon, F.C. Evaluation of Grain Filling Rate and Duration in Bread and Durum Wheat, under Heat Stress after Anthesis. J. Agron. Crop. Sci. 2009, 195, 137–147. [Google Scholar] [CrossRef]
- MacLeod, L.C.; Duffus, C.M. Reduced starch content, sucrose synthase activity in developing endosperm of barley plants grown at elevated temperatures. Aust. J. Plant. Physiol. 1988, 15, 367–375. [Google Scholar] [CrossRef]
- Swanston, J.S.; Ellis, R.P.; Perez -Vendrell, A.; Voltas, J.; Molina-Cano, J.L. Patterns of barley grain development in Spain and Scotland and their implications for malting quality. Cereal Chem. 1997, 74, 456–461. [Google Scholar] [CrossRef]
- Molina-Cano, J.L.; Francesch, M.; Perez Vendrell, A.M.; Ramo, T.; Voltas, J.; Brufau, J. Genetic and environmental variation in malting and feed quality of barley. J. Cereal Sci. 1997, 25, 37–47. [Google Scholar] [CrossRef]
- Rakszegi, M.; Lovegrove, A.; Balla, K.; Láng, L.; Bedo, Z.; Veisz, O.; Shewry, P.R. Effect of heat and drought stress on the structure and composition of arabinoxylan and β-glucan in wheat grain. Carbohydr. Polym. 2014, 102, 557–565. [Google Scholar] [CrossRef] [PubMed]
- Shao, Y.; Xu, F.; Sun, X.; Bao, J.; Beta, T. Phenolic acids, anthocyanins, and antioxidant capacity in rice (Oryza sativa L.) grains at four stages of development after flowering. Food Chem. 2014, 143, 90–9691. [Google Scholar] [CrossRef] [PubMed]
- Zhang, M.W.; Zhang, R.F.; Zhang, F.X.; Liu, R.H. Phenolic profiles and antioxidant activity of black rice bran of different commercially available varieties. J. Agric. Food Chem. 2010, 58, 7580–7587. [Google Scholar] [CrossRef]
- Bustos, D.V.; Riegel, R.; Calderini, D.F. Anthocyanin content of grains in purple wheat is affected by grain position, assimilate availability and agronomic management. J. Cereal Sci. 2012, 55, 257–264. [Google Scholar] [CrossRef]
- Ahmed, N.; Maekawa, M.; Noda, K. Anthocyanin accumulation and expression pattern of anthocyanin biosynthesis genes in developing wheat coleoptiles. Biol. Plant. 2009, 53, 223–228. [Google Scholar] [CrossRef]
- Sharma, A.; Babar Shahzad, B.; Abdul Rehman, A.; Renu Bhardwaj, R.; Marco Landi, M.; Zheng, B. Response of Phenylpropanoid Pathway and the Role of Polyphenols in Plants under Abiotic Stress. Molecules 2019, 24, 2452. [Google Scholar] [CrossRef] [PubMed]
- Tsormpatsidis, E.; Henbest, R.G.C.; Davis, F.J.; Battey, N.H.; Hadley, P.; Wagstaffe, A. UV irradiance as a major influence on growth, development and secondary products of commercial importance in Lollo Rosso lettuce ‘Revolution’ grown under polyethylene films. Environ. Exp. Bot. 2008, 63, 232–239. [Google Scholar] [CrossRef]
- Özkaya, B.; Turksoy, S.; Özkaya, H.; Baumgartner, B.; Özkeser, İ.; Köksel, H. Changes in the functional constituents and phytic acid contents of firiks produced from wheats at different maturation stages. Food Chem. 2018, 246, 150–155. [Google Scholar] [CrossRef] [PubMed]
- McCallum, J.A.; Walker, J.R. Phenolic biosynthesis during grain development in wheat (Triticum aestivum L.) III. Changes in hydroxycinnamic acids during grain development. J. Cereal Sci. 1991, 13, 161–172. [Google Scholar] [CrossRef]
- Gonzalez-San José, M.L.; Diez, C. Relationship between anthocyanins and sugars during the ripening of grape berries. Food Chem. 1992, 43, 193–197. [Google Scholar] [CrossRef]
- Solfanelli, C.; Poggi, A.; Loreti, E.; Alpi, A.; Perata, P. Sucrose-specific induction of the anthocyanin biosynthetic pathway in Arabidopsis. Plant. Physiol. 2006, 140, 637–646. [Google Scholar] [CrossRef]
- Guo, R.; Yuan, G.; Wang, Q. Effect of sucrose and mannitol on the accumulation of health promoting compounds and the activity of metabolic enzymes in broccoli sprouts. Sci. Hortic. 2011, 128, 159–165. [Google Scholar] [CrossRef]
- Silvestro, R.D.; Loreto, A.D.; Bosi, S.; Bregola, V.; Marotti, I.; Benedettelli, S.; Segura-Carretero, A.; Dinelli, G. Environment and genotype effects on antioxidant properties of organically grown wheat varieties: A 3-year study. J. Sci. Food Agric. 2016, 97, 641–664. [Google Scholar] [CrossRef]
- Shamloo, M.; Babawale, E.A.; Furtado, A.; Henry, R.J.; Eck, P.K.; Peter, J.H.; Jones, P.J.H. Effects of genotype and temperature on accumulation of plant secondary metabolites in Canadian and Australian wheat grown under controlled environments. Sci. Rep. 2017, 7, 9133. [Google Scholar] [CrossRef]
- Wu, G.; Johnson, S.K.; Bornman, J.F.; Bennett, S.J.; Clarke, M.W.; Singh, V.; Fang, Z. Growth temperature and genotype both play important roles in sorghum grain phenolic composition. Sci. Rep. 2016, 6, 21835. [Google Scholar] [CrossRef]
- Zhu, Y.; Li, T.; Fu, X.; Abbasi, A.M.; Zheng, B.; Liu, R.H. Phenolics content, antioxidant and antiproliferative activities of dehulled highland barley (Hordeum vulgare L.). J. Funct. Foods. 2015, 19, 439–450. [Google Scholar] [CrossRef]
- Zadoks, J.C.; Chang, T.T.; Konzak, C.F. A decimal code for the growth stages of cereals. Weed Res. 1974, 14, 415–421. [Google Scholar] [CrossRef]
- Servei Meteorologic de Catalunya. Available online: https://www.meteo.cat (accessed on 3 September 2020).
- β-Glucan Assay Kit (Mixed Linkage) (K-BGLU). Megazyme (Wicklow, Ireland). Available online: https://www.megazyme.com/documents/Booklet/K-BGLU_DATA.pdf (accessed on 10 March 2021).
- D-Xylose Assay Kit (K-XYLOSE). Megazyme (Wicklow, Ireland). Available online: https://www.megazyme.com/documents/Booklet/K-XYLOSE_DATA.pdf (accessed on 10 March 2021).
- Abdel-Aal, E.S.M.; Hucl, P. A rapid method for quantifying total anthocyanins in blue aleurone and purple pericarp wheats. Cereal Chem. 1999, 76, 350–354. [Google Scholar] [CrossRef]
- Bobo-García, G.; Davidov-Pardo, G.; Arroqui, C.; Vírseda, P.; Marín-Arroyo, M.R.; Navarro, M. Intra-laboratory validation of microplate methods for total phenolic content and antioxidant activity on polyphenolic extracts, and comparison with conventional spectrophotometric methods. J. Sci. Food Agric. 2014, 95, 204–209. [Google Scholar] [CrossRef]
- Huang, D.; Ou, B.; Hampsch-Woodill, M.; Flanagan, J.A.; Prior, R.L. High-throughput assay of oxygen radical absorbance capacity (ORAC) using a multichannel liquid handling system coupled with a microplate fluorescence reader in 96-well format. J. Agric. Food Chem. 2002, 50, 4437–4444. [Google Scholar] [CrossRef] [PubMed]


| Source | df | Maximum Weight | Growth Rate | Duration | ||||||
|---|---|---|---|---|---|---|---|---|---|---|
| Sum of Squares | F Ratio | p-Value | Sum of Squares | F Ratio | p-Value | Sum of Squares | F Ratio | p-Value | ||
| Corrected total | 15 | 582.0 | 0.000028960 | 87,893 | ||||||
| Year | 1 | 64.1 | 4.78 | 0.0651 | 0.000000004 | 0.00 | 0.9887 | 44,123 | 28.62 | 0.0011 |
| Genotype: G | 3 | 188.0 | 4.67 | 0.0427 | 0.000001001 | 1.74 | 0.2579 | 25,485 | 4.95 | 0.0376 |
| Environment: E | 1 | 191.3 | 14.26 | 0.0069 | 0.000006260 | 3.27 | 0.1207 | 3.000 | 0.00 | 0.9699 |
| G × E | 3 | 44.3 | 1.11 | 0.4061 | 0.000003110 | 0.54 | 0.6745 | 1286 | 0.25 | 0.8591 |
| Residual | 7 | 93.9 | 0.000011500 | 12,016 | ||||||
| Source | df | Maximum Content | Growth Rate | Duration | ||||||
|---|---|---|---|---|---|---|---|---|---|---|
| Sum of Squares | F Ratio | p-Value | Sum of Squares | F Ratio | p-Value | Sum of Squares | F Ratio | p-Value | ||
| Corrected total | 15 | 3112.0 | 0.00017606 | 94,632 | ||||||
| Year | 1 | 2.2 | 0.10 | 0.7571 | 0.00000210 | 0.22 | 0.6573 | 4340 | 1.22 | 0.3065 |
| Genotype: G | 3 | 2946.9 | 46.05 | 0.0001 | 0.00007037 | 2.39 | 0.1543 | 51,292 | 4.79 | 0.0403 |
| Environment: E | 1 | 11.8 | 0.55 | 0.4830 | 0.00000166 | 0.17 | 0.6933 | 5412 | 1.52 | 0.2578 |
| G × E | 3 | 2.4 | 0.04 | 0.9885 | 0.00003325 | 1.13 | 0.4003 | 8617 | 0.81 | 0.5297 |
| Residual | 7 | 148.7 | 0.00006867 | 24,971 | ||||||
| Source | df | Maximum Content | Growth Rate | Duration | ||||||
|---|---|---|---|---|---|---|---|---|---|---|
| Sum of Squares | F Ratio | p-Value | Sum of Squares | F Ratio | p-Value | Sum of Squares | F Ratio | p-Value | ||
| Corrected total | 15 | 674.1 | 0.00016401 | 523,370 | ||||||
| Year | 1 | 165.8 | 4.51 | 0.0714 | 0.00002439 | 2.25 | 0.1775 | 227,143 | 9.03 | 0.0198 |
| Genotype: G | 3 | 233.3 | 2.11 | 0.1870 | 0.00005678 | 1.75 | 0.2436 | 102,788 | 1.36 | 0.3304 |
| Environment: E | 1 | 16.0 | 0.43 | 0.5310 | 0.00000077 | 0.07 | 0.7973 | 7346 | 1.29 | 0.6057 |
| G × E | 3 | 1.3 | 0.01 | 0.9981 | 0.00000652 | 0.20 | 0.8925 | 9969 | 0.13 | 0.9379 |
| Residual | 7 | 257.6 | 0.00007566 | 176,124 | ||||||
| Source | df | Sum of Squares | F Ratio | p-Value |
|---|---|---|---|---|
| Corrected total | 27 | 343,845 | ||
| Thermal time: TT | 2 | 187,749 | 32.24 | 0.0000 |
| Year: Y | 1 | 3215 | 1.10 | 0.3090 |
| Environment: E | 1 | 49,574 | 17.03 | 0.0008 |
| Y × E | 1 | 3111 | 1.07 | 0.3166 |
| TT × Y | 2 | 12,908 | 2.22 | 0.1413 |
| TT × E | 2 | 37,208 | 6.39 | 0.0091 |
| TT × Y × E | 2 | 3498 | 0.60 | 0.5603 |
| Residual | 16 | 46,581 |
| Source | Free Phenols (First-Degree Model) | Bound Phenols (Second-Degree Model) | Antioxidant Capacity (First-Degree-Model) | |||||||||
|---|---|---|---|---|---|---|---|---|---|---|---|---|
| df | Sum of Squares | F Ratio | p-Value | df | Sum of Squares | F Ratio | p-Value | df | Sum of Squares | F Ratio | p-Value | |
| Corrected total | 55 | 7.751 | 47 | 11.95 | 55 | 46,131 | ||||||
| Thermal time: TT | 1 | 3.364 | 92.31 | 0.0000 | 2 | 0.75 | 22.78 | 0.0000 | 1 | 29,490 | 390.43 | 0.0001 |
| Genotype: G | 3 | 1.392 | 12.73 | 0.0000 | 3 | 6.44 | 129.70 | 0.0000 | 3 | 15,590 | 68.80 | 0.0001 |
| Environment: E | 1 | 0.409 | 11.22 | 0.0027 | 1 | 2.80 | 169.11 | 0.0000 | 1 | 3274 | 43.34 | 0.0001 |
| G × E | 3 | 0.793 | 7.25 | 0.0013 | 3 | 0.08 | 1.66 | 0.2030 | 3 | 1073 | 4.73 | 0.0064 |
| TT × G | 3 | 0.142 | 1.30 | 0.2981 | 6 | 1.42 | 14.26 | 0.0000 | 3 | 125 | 0.55 | 0.6495 |
| TT × E | 1 | 0.127 | 3.48 | 0.0743 | 2 | 0.01 | 0.33 | 0.7206 | 1 | 909 | 12.03 | 0.0013 |
| TT × G × E | 3 | 0.068 | 0.62 | 0.6088 | 6 | 0.06 | 0.61 | 0.7226 | 3 | 190 | 0.84 | 0.4801 |
| Residual | 40 | 1.458 | 24 | 0.40 | 40 | 3021 | ||||||
Publisher’s Note: MDPI stays neutral with regard to jurisdictional claims in published maps and institutional affiliations. |
© 2021 by the authors. Licensee MDPI, Basel, Switzerland. This article is an open access article distributed under the terms and conditions of the Creative Commons Attribution (CC BY) license (http://creativecommons.org/licenses/by/4.0/).
Share and Cite
Martínez-Subirà, M.; Moralejo, M.; Puig, E.; Romero, M.-P.; Savin, R.; Romagosa, I. Impact of Rising Temperature in the Deposition Patterns of Bioactive Compounds in Field Grown Food Barley Grains. Plants 2021, 10, 598. https://doi.org/10.3390/plants10030598
Martínez-Subirà M, Moralejo M, Puig E, Romero M-P, Savin R, Romagosa I. Impact of Rising Temperature in the Deposition Patterns of Bioactive Compounds in Field Grown Food Barley Grains. Plants. 2021; 10(3):598. https://doi.org/10.3390/plants10030598
Chicago/Turabian StyleMartínez-Subirà, Mariona, Marian Moralejo, Eva Puig, María-Paz Romero, Roxana Savin, and Ignacio Romagosa. 2021. "Impact of Rising Temperature in the Deposition Patterns of Bioactive Compounds in Field Grown Food Barley Grains" Plants 10, no. 3: 598. https://doi.org/10.3390/plants10030598
APA StyleMartínez-Subirà, M., Moralejo, M., Puig, E., Romero, M.-P., Savin, R., & Romagosa, I. (2021). Impact of Rising Temperature in the Deposition Patterns of Bioactive Compounds in Field Grown Food Barley Grains. Plants, 10(3), 598. https://doi.org/10.3390/plants10030598