Article

Genome-Wide Analysis of MDHAR Gene Family in Four Cotton Species Provides Insights into Fiber Development via Regulating AsA Redox Homeostasis

1
Key Laboratory of Xinjiang Phytomedicine Resource and Utilization of Ministry of Education, College of Life Sciences, Shihezi University, Shihezi 832003, China
2
Ministry of Education Key Laboratory for Ecology of Tropical Islands, College of Life Sciences, Hainan Normal University, Haikou 571158, China
3
Genetics and Cellular Engineering Group, Institute of Molecular Toxicology and Pharmacology, Helmholtz Zentrum Muenchen, 85764 Neuherberg, Germany
*
Authors to whom correspondence should be addressed.
These authors contributed equally to this work.
Plants 2021, 10(2), 227; https://doi.org/10.3390/plants10020227
Submission received: 18 November 2020 / Revised: 17 January 2021 / Accepted: 20 January 2021 / Published: 25 January 2021
(This article belongs to the Special Issue Ascorbic Acid Biosynthesis, Recycling and Oxidation in Plants)

Abstract

:
Monodehydroasorbate reductase (MDHAR) (EC1.6.5.4), a key enzyme in ascorbate-glutathione recycling, plays important roles in cell growth, plant development and physiological response to environmental stress via control of ascorbic acid (AsA)-mediated reduction/oxidation (redox) regulation. Until now, information regarding MDHAR function and regulatory mechanism in Gossypium have been limited. Herein, a genome-wide identification and comprehensive bioinformatic analysis of 36 MDHAR family genes in four Gossypium species, Gossypium arboreum, G. raimondii, G. hirsutum, and G. barbadense, were performed, indicating their close evolutionary relationship. Expression analysis of GhMDHARs in different cotton tissues and under abiotic stress and phytohormone treatment revealed diverse expression features. Fiber-specific expression analysis showed that GhMDHAR1A/D, 3A/D and 4A/D were preferentially expressed in fiber fast elongating stages to reach peak values in 15-DPA fibers, with corresponding coincident observances of MDHAR enzyme activity, AsA content and ascorbic acid/dehydroascorbic acid (AsA/DHA) ratio. Meanwhile, there was a close positive correlation between the increase of AsA content and AsA/DHA ratio catalyzed by MDHAR and fiber elongation development in different fiber-length cotton cultivars, suggesting the potential important function of MDHAR for fiber growth. Following H2O2 stimulation, GhMDHAR demonstrated immediate responses at the levels of mRNA, enzyme, the product of AsA and corresponding AsA/DHA value, and antioxidative activity. These results for the first time provide a comprehensive systemic analysis of the MDHAR gene family in plants and the four cotton species and demonstrate the contribution of MDHAR to fiber elongation development by controlling AsA-recycling-mediated cellular redox homeostasis.

1. Introduction

Reactive oxygen species (ROS) are important signaling molecules that play significant roles in plant development, cell growth and in response to environmental stresses and phytohormone signaling [1,2,3,4,5]. To counteract excessive ROS and the detrimental effects of cellular oxidation, plants have evolved corresponding defense mechanism for detoxification of ROS by controlling cellular reduction/oxidation (redox) balance. In this, the ascorbate-glutathione (Asc-GSH) cycle, also namely Asc recycling pathway, is regarded as the critical pathway that mediates the antioxidative molecule of Asc as a coenzyme to eliminate redundant ROS by involving them in the enzymatic reactions. It also stabilizes cellular redox status to play a multifunction role in controlling cell growth and plant development [6,7]. Of the Asc antioxidant system enzymes, ascorbate peroxidase (APX, EC1.11.1.11) is the prototypical ROS-scavenging enzyme utilizing ascorbic acid (AsA) as substrate to reduce hydrogen peroxide (H2O2) to water [4,8]. As a byproduct of the reaction, the generated monodehydroascorbate acid (MDHA, an oxidative form of Asc) is then reduced to AsA by monodehydroascorbate reductase (MDHAR, EC1.6.5.4) to balance the AsA pool in cells by GSH-coupled continuous enzymatic reactions [6,9].
As evinced by genetic experiments, Asc is an important abundant antioxidant that executes a vital role in detoxifying cellular excessive ROS by enzymatic reactions [6,9], regulating plant growth and development [10,11,12] as well as controlling cellular processes including cell growth and cell division [13,14,15,16]. For Asc biosynthesis, there are four proposed pathways, including the Smirnoff–Wheeler (SW) pathway, the myo-inositol (MI)-dependent d-glucuronate pathway, the d-galacturonic acid pathway and the recycling pathway by the Foyer–Halliwell–Asada cycle [9,17,18,19]. Among them, the recycling pathway catalyzed by MDHAR is critical for control of the cellular redox status by regeneration of AsA [20,21]. Attempts to increase Asc levels via MDHAR have been widely reported. The AsA content and the AsA/DHA ratio are closely linked with MDHAR activity in tomato [22]. Overexpression of the LeMDHAR gene significantly elevated AsA level and decreased the H2O2 content in tomato (Lycopersicon esculentum Mill.) [23]. Chlamydomonas reinhardtii CrMDHAR1 is a ROS-inducing gene and its overexpression elevated the AsA level and AsA/DHA ratio to resist photooxidative stress [24]. Transgenic tobacco plant lines overexpressing Arabidopsis AtMDHAR1 correlated enrichment of MDHAR enzyme activity and accumulation of AsA content with significantly enhanced tolerance against environmental stress [25].
As a thiol-group-containing flavin adenine dinucleotide (FAD) monomeric enzyme of the AsA-GSH cycle, MDHAR belongs to a multigene family and has been reported to locate in different organelles such as the chloroplast [23,26], mitochondria and peroxisome [27,28,29], and in cytosol [30], as well as both mitochondria and chloroplasts [31]. The MDHAR cDNA has been cloned from diverse plant species containing pea (Pisum sativum L.) [32], tomato (Lycopersicon esculentum Mill.) [33] and spinach (Spinacea oleracea) [34]. The MDHAR proteins were also purified from cytosol of cucumber (Cucumis sativus), soybean (Glycine max) and potato (Solanum tuberosum) [35,36,37], the mitochondria of potato [38], and chloroplasts of spinach (Spinacia oleracea) [34]. Three Physcomitrella patens PpMDHAR cytosolic isoforms indicated different response patterns with increased accumulation of PpMDHAR1 and PpMDHAR3 to salt and osmotic stresses, and normal level of PpMDHAR2 to chilling and oxidative stresses, showing that cytosolic MDHARs are essential for land plants to adapt to dry terrestrial conditions [39]. In Arabidopsis, there are six MDHAR polypeptides, namely AtMDHAR1 to AtMDHAR6, with the different organelle distributions of AtMDHAR1 and AtMDHAR4 in peroxisomes, AtMDHAR2 and AtMDHAR3 in cytosol, AtMDHAR5 in mitochondria and AtMDHAR6 in chloroplasts [40].
Numbers of reports have revealed the important role of MDHAR in resisting abiotic stress in different plants such as arabidopsis [41], wheat [42], tomato [28], etc., by controlling the cellular redox homeostasis as a negative regulator to reduce the cellular ROS level. The multifunctionality of MDHAR has also been studied, including detoxification of 2,4,6-trinitrotoluene (TNT) toxicity [43], reduction of phenoxyl radicals [44], increase of Saccharomyces cerevisiae fermentative capacity [45], strengthening of disease resistance [42], as well as plant growth and development of yield maintenance [46], postgerminative growth [29] and fruit ripening [47].
Cotton cultivars are important crop plants worldwide for their supply of fibers used as raw materials to the textile industry. Fiber growth and development is closely correlated with the final fiber quality [4,48]. A genome-wide analysis of the genes controlling fiber development is an effective method for elucidation of the molecular mechanism, and thus for the potential improvement, of fiber quality [49]. With regard to the Asc metabolic pathway in cotton fiber growth, our previous investigations have shown that, ascorbate peroxidase (APX) appeared with an ethylene-induced expression and participated in fiber cell fast elongation development by modulating ROS homeostasis [4,48]. Moreover, the Asc de novo biosynthesis gene GhVTC1 is the key factor to promote cell elongation under control of ethylene [50], while the myo-inositol-1-phosphate synthase (MIPS) located in the MI-dependent d-glucuronate pathway participated in cell elongation by providing the precursor MI to contribute to Asc biosynthesis [51]. Ascorbate oxidase (AO) is a positive regulator to enhance tobacco cell elongation through generation of H2O2-mediated apoplast oxidation [16]. Together, these results suggest an intimate connection between Asc metabolic genes and cellular ROS balance in fibers. Currently, information regarding MDHAR genes and their functions, as well as the regulatory mechanism involved in fiber development in Gossypium, are largely unknown. In the present study, by a genome-wide identification in four cotton species of G. arboreum, G. raimondii, G. hirsutum and G. barbadense, a total of 36 MDHAR genes were obtained. A comprehensive systematic bioinformatic analysis, including chromosomal location, gene structure, motif distribution and evolutionary relationships, was performed indicating rapid evolution and close evolutionary relationships. G. hirsutum GhMDHARs that showed diverse expression patterns under abiotic stress, and phytohormone treatment demonstrated a close correlation with fiber growth by increasing MDHAR activity, AsA content and AsA/DHA ratio, possibly via involvement of AsA-mediated H2O2 signaling pathway.

2. Results

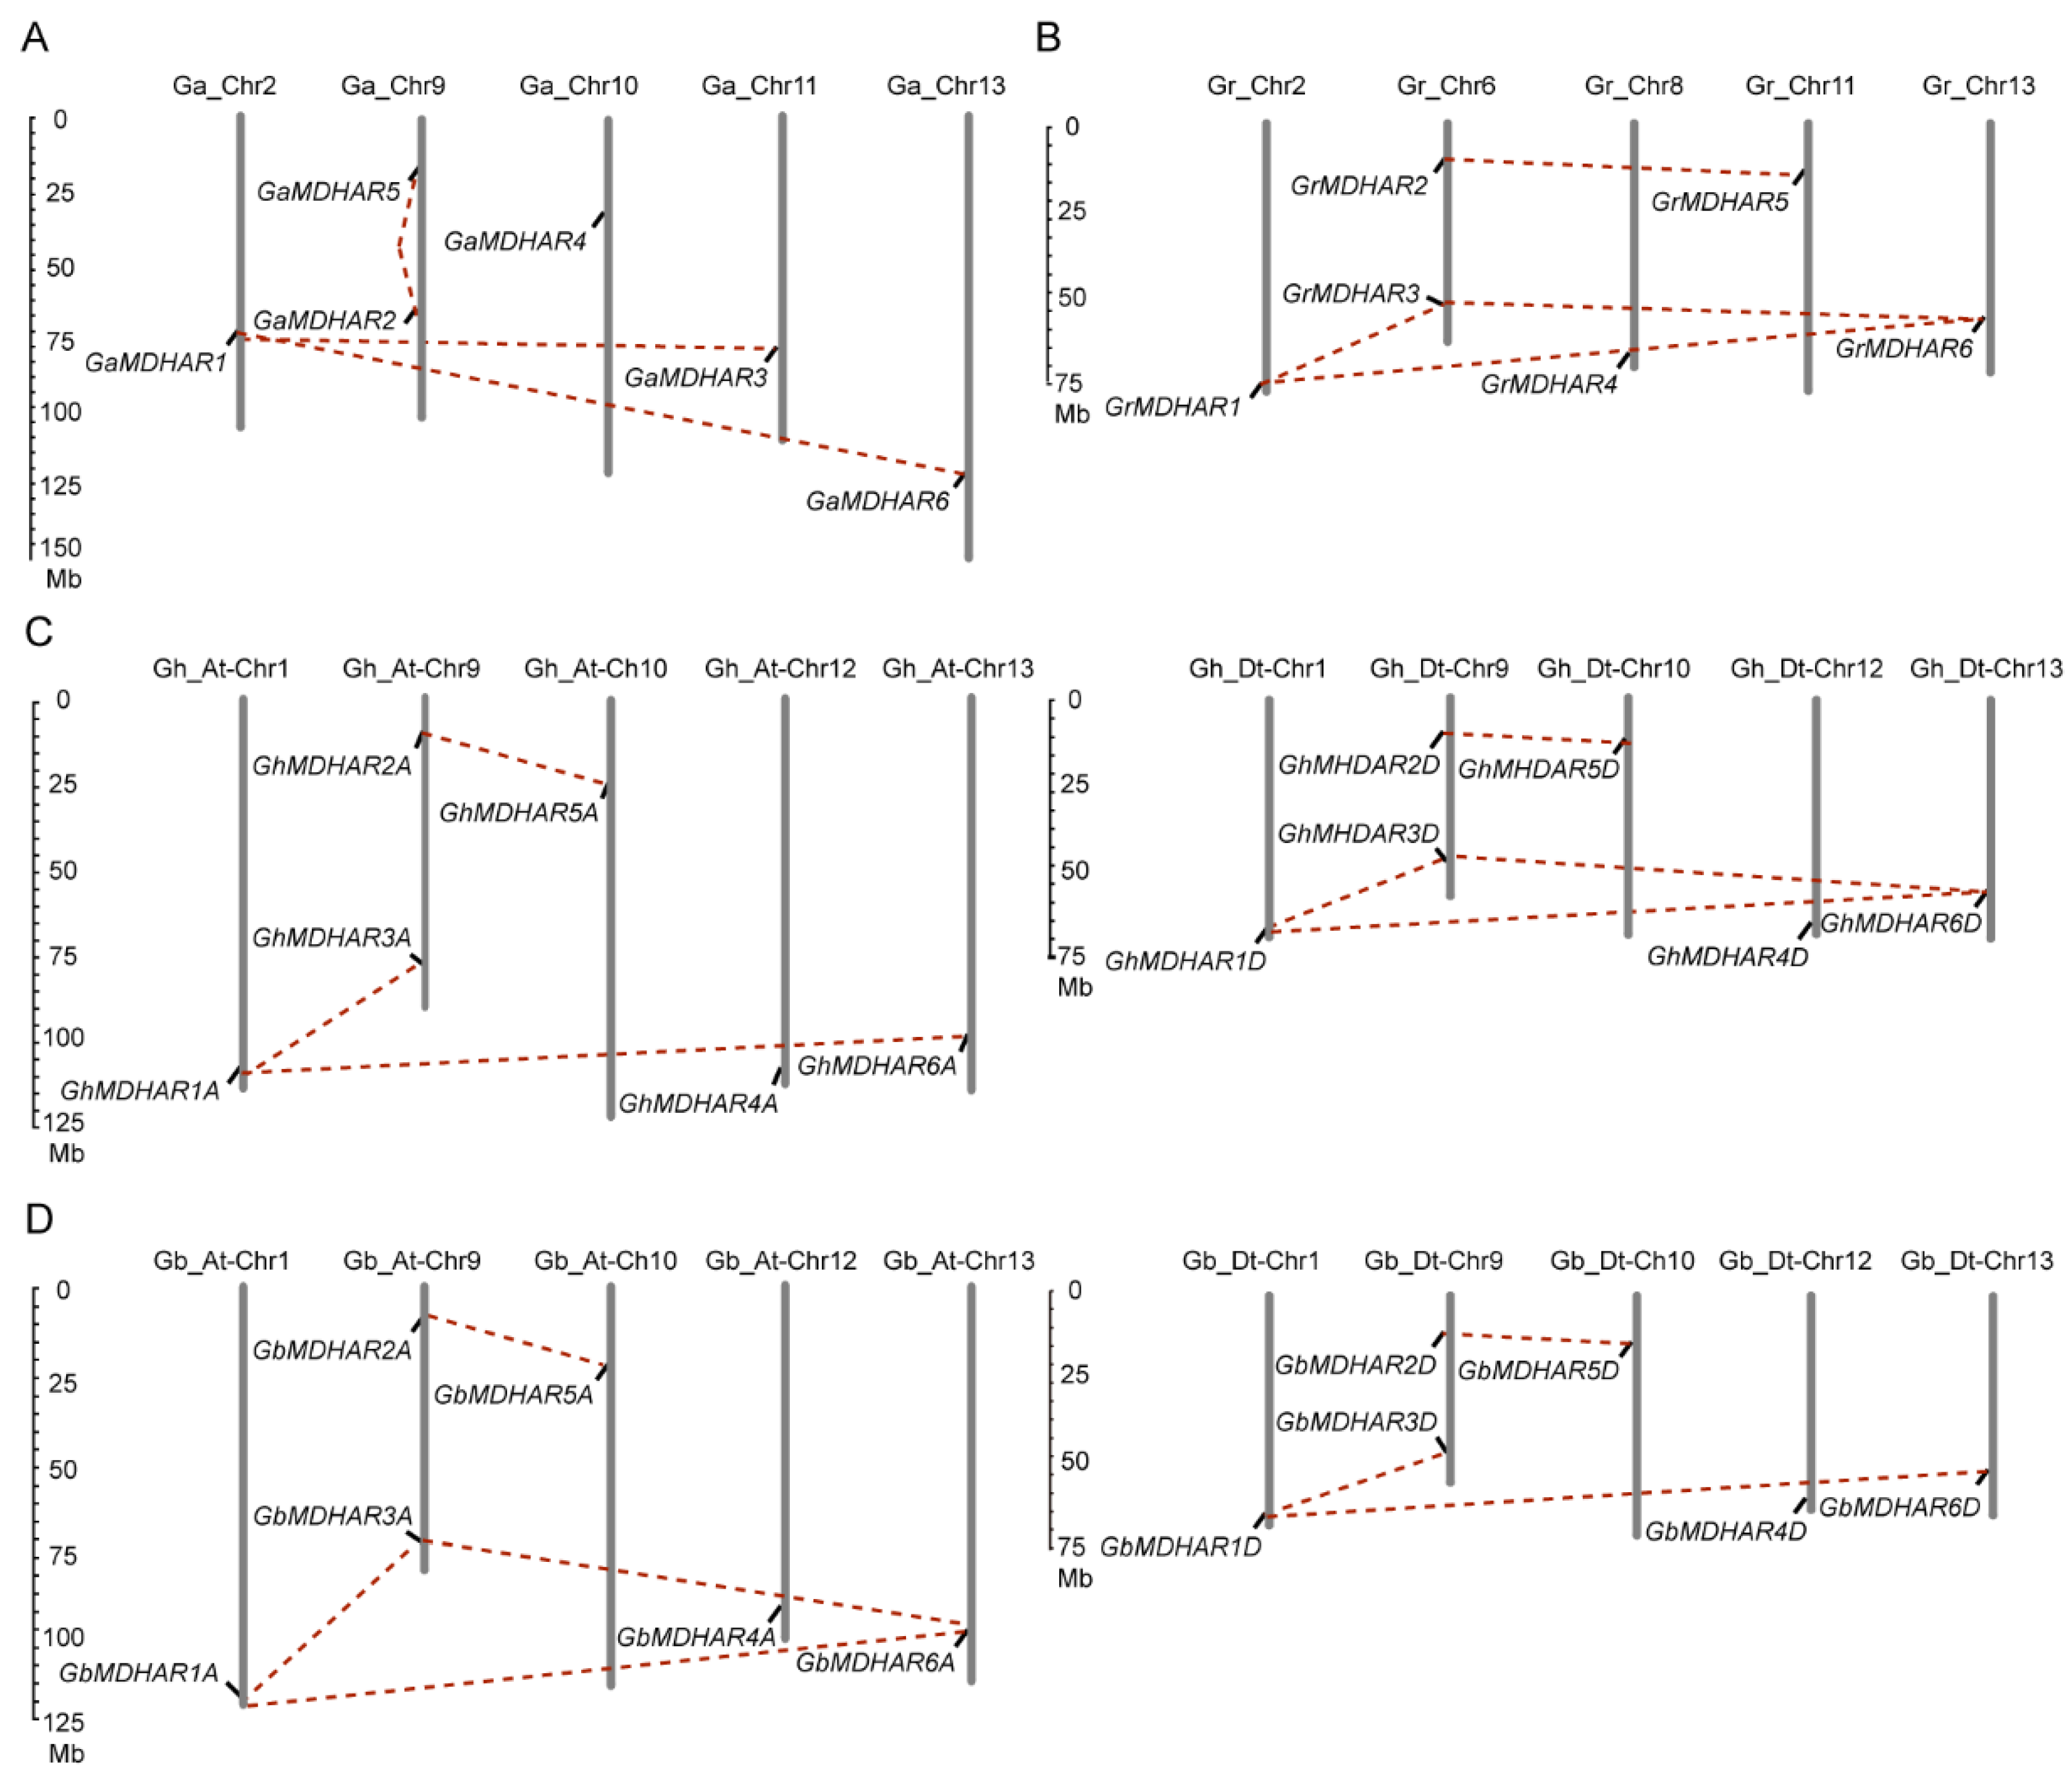
2.1. Identification and Chromosome Location of MDHAR Genes of Four Gossypium Species

By searching the genome of G. arboreum, G. raimondii, G. hirsutum and G. barbadense using arabidopsis MDHAR proteins as queries with the BlastP procedure, a total of 36 MDHAR genes were identified, with six in diploid cotton (G. arboreum and G. raimondii), and twelve in allotetraploid cotton (G. barbadense and G. hirsutum) (Supplementary Table S1). The allotetraploid cotton species have twice the MDHAR members in comparison to the diploid cotton species. The MDHARs possess open reading frame (ORF) lengths ranging from 1305 to 1677 base pair (bp), the encoded proteins have 434 to 558 amino acids with theoretical molecular weight (MW) from 46.83 to 62.25 kDa and theoretical pI from 5.9 to 9.06, respectively (Supplementary Table S1).
The MDHARs were distributed across different chromosomes, with locations on fivechromosomes of G. arboreum (AA genome, Chr 2, 9, 10, 11, and 13) and of G. raimondii (DD genome, Chr 2, 6, 8, 11, and 13). The distributions in allotetraploid cotton species showed similar patterns of orthologous MDHARs on the same chromosomes of G. barbadense and G. hirsutum, with locations on five At and five Dt subgenomes (Chr 1, 9, 10, 12, and 13) (Figure 1). The genomic locations also provide a clue to analyze gene duplication. In the At subgenome, four putative paralogous gene pairs, MDHAR1-MDHAR3, MDHAR2-MDHAR5, MDHAR1-MDHAR6 and MDHAR3-MDHAR6 (only in G. barbadense At subgenome), were found to be segmentally duplicated. The above four paralogous gene pairs were also identified as duplications in the Dt subgenome, with the absence of MDHAR3-MDHAR6 in the G. barbadense Dt subgenome (Figure 1).

2.2. Phylogenetic and Evolutionary Analyses of MDHAR Members

The MDHAR sequences from four cotton species of G. arboreum, G. raimondii, G. barbadense and G. hirsutum, and from another eight plants including Glycine max, Oryza sativa, Sorghum bicolor, Zea mays, Arabidopsis thaliana, Theobroma cacao, Vitis vinifera and Cicer arietinum, were used for construction of a neighbor-joining (N—J) tree, resulting in three typical groups (Group A–C). The orthologous MDHARs in cotton and cacao indicated a close relationship, which might be the reason that they are in the same family of Malvaceae. Cotton MDHAR homologs were classified into the same branches, with MDHAR1, 3, and 6 in group A, MDHAR 2 and 5 in group B, and MDHAR 4 in group C (Figure 2), demonstrating again the close relationship of gene duplication of MDHARs in the same groups.
The evolutionary relationship could be assessed by genetic synteny across related plant species. The syntenic analysis of MDHAR genes of the four cotton species was executed and visualized using Circos software (Supplementary Figure S1). Two paralogs in G. arboreum, one paralog in G. raimondii, nine paralogs in G. barbadense and nine paralogs in G. hirsutum had syntenic relationships. Meanwhile, the number of 47, 27 and 15 had syntenic relationships in Group A, Group B and Group C, respectively (Figure 2), showing that Group A had many syntenic genes compared with the other two groups, indicating the close evolutionary relationships of the MDHAR genes among the four cotton species. The evolutionary rate of MDHAR duplicated gene pairs was evaluated by the Tajima relative rate test, which indicated that MDHAR1/6 and MDHAR2/5 gene pairs showed accelerated evolutionary rate in the four Gossypium species, and the MDHAR3/6 gene indicated accelerated evolutionary rate only in G. hirsutum (Supplementary Table S2), implying the potential functional divergence of these MDHAR gene pairs. Evolutionary selection analysis by nonsynonymous substitution rate/synonymous substitution rate (Ka/Ks) indicated that the ratio of all duplicated MDHAR gene pairs showed a value of <1, indicating all these MDHAR gene pairs were purifying selection and suggesting their rapid evolution (Supplementary Table S3).

2.3. Analyses of Gene Structure, Conserved Motif, and Promoter Cis-Acting Element of MDHAR Genes

To obtain more insights into the evolutionary relationship and potential functional diversity of MDHAR genes, exon/intron organization and conserved motif analyses were performed by Gene Structure Display Server (GSDS) and Multiple Em for Motif Elicitation) (MEME) programs respectively. The MDHAR genes could be divided into different branches (Figure 3A). The same homologous MDHAR genes in different cotton species were classified into the same branch and indicated a highly similar exon/intron arrangement, with the exception of MDHAR6 that contained only one individual exon without intron (Figure 3B), suggesting conservation of the evolutionary relationship. All MDHARs presented high sequence similarity and contained a typical flavin adenine dinucleotide/nicotinamide adenine dinucleotide (FAD/NAD)-binding domain (Supplementary Figure S2), implying a conserved function in catalysis. As a result of nine discovered conserved motifs, nine, eight and seven conserved motifs were presented in MDHAR1, 3, and 6, MDHAR2 and 5, and MDHAR4, respectively, showing the corresponding predicted subcellular locations in the cytosol, membrane-bound peroxisomes, and chloroplast/mitochondria (Figure 3C). The detailed amino acid composition of the conserved motifs is presented in Supplementary Figure S3, suggesting the functional diversity of the different MDHARs. Cis-acting element analysis showed that the distributions in different MDHAR promoter regions are largely diverse, with the exception of the highly consistent composition of MDHAR promoters in A-subgenome but not in D-subgenome in the two allotetraploid species G. hirsutum and G. barbadense. Besides the core elements, regulatory elements related to development and responsiveness to stress and phytohormone were also discovered (Supplementary Figure S4) with detailed information of these elements in Supplementary Table S4, suggesting their potential function for plant growth and regulation by these factors.

2.4. Tissue-Specific and Fiber-Developmental Expression Analysis of G. hirsutum GhMDHARs

The upland cotton G. hirsutum provides the majority of the fibers for textile industry. We analyzed the expression pattern of MDHARs during fiber development and did tissue-specific and fiber-developmental expression analyses in G. hirsutum GhMDHARs. The results indicated that GhMDHAR1A/D and GhMDHAR3A/D were preferentially expressed in all detected tissues including roots, stems, leaves, petals, stamens, pistils, ovules and fibers, with the most significant accumulations in fiber development, suggesting their potential important roles in tissue development especially in fiber growth (Figure 4A). GhMDHAR2A/D indicated moderate expression in all tissues, with the exception of their expressions in fibers and of GhMDHAR2A expression in flower tissues, implying a possible functional difference in flower development. GhMDHAR5A/D also showed moderate expression with an especially high enrichment in flower tissues, presenting their potential function in flower development. GhMDHAR4A/D and GhMDHAR6A/D displayed consistent expression with a moderate and low expression, respectively. Meanwhile, in the other three cotton species, G. barbadense, G. arboreum and G. raimondii, the expression of MDHARs showed highly similar levels with that of G. hirsutum GhMDHARs (Supplementary Figure S5), implying the diverse and important roles of MDHAR expressions for both fiber growth and tissue development.
To further investigate the possible role of GhMDHARs in fiber development, the expressions of GhMDHAR genes during different fiber development stages were detected by quantitative real-time polymerase chain reaction (qRT-PCR). The results indicated that, during different fiber developmental stages, GhMDHAR3A/D showed the most significant accumulations in 5–21 days post anthesis (DPA) fibers (the fast elongation stages), with the peak value at 15 DPA. GhMDHAR1D also presented moderate upregulated expression levels in 5–21 DPA fibers. GhMDHAR1A and GhMDHAR4A/D were mainly enriched in 15-DPA fibers (Figure 4B). These results suggest that these GhMDHAR genes might play important function for fiber development.
As MDHARs have a main function as catalytic enzymes, MDHAR activity was measured during fiber development stages. MDHAR activity indicated significant accumulation in 5–21 DPA fibers and reached a peak value at 15 DPA, compared to that in 0-DPA ovules (Figure 4C). Further, AsA content was measured to validate the key role of MDHAR in AsA regeneration. The results showed that AsA content maintained a high level in 10–21 DPA fibers (the fiber fast elongation and secondary wall deposition stages) and reached the highest level in 15-DPA fibers. The AsA/DHA ratio showed a similar tendency with significant increase at 10–21 DPA with the peak in 15-DPA fibers (Figure 4D). These results demonstrated that a higher MDHAR activity is associated with fiber growth by catalyzing AsA recycling and maintaining the AsA-mediated cellular redox status.

2.5. Expression Analysis of GhMDHARs under Abiotic and Phytohormone Treatments

Expression of MDHAR is regulated by environmental stress, especially drought and salt [25,52], and AsA biosynthesis and metabolism are controlled by phytohormone indole-3-acetic acid (IAA) and ethylene (ETH) [4,16,50]. Thus, to investigate the GhMDHAR expression features under treatments of abiotic stressors, polyethylene glycol (PEG) and NaCl and plant hormones of IAA and ETH treatments were used, and expression abundance of GhMDHAR genes was detected by qRT-PCR, using 0-h expression level of untreated samples as control. The GhMDHAR genes exhibited diverse expression patterns under different treatment conditions. GhMDHAR2A/D, GhMDHAR5A/D, and GhMDHAR6A/D indicated significant accumulated expression under these four treatments, at least in one treated time point, with the exceptions of GhMDHAR5A/D that showed moderate enrichment and of GhMDHAR6A/D that also showed moderate regulation under IAA treatment (Figure 5A). GhMDHAR3A/D displayed a medium accumulation upon PEG, NaCl, and IAA treatment, but was enriched highly under the 24-h ETH treatment. GhMDHAR4A/D illustrated significant increased expression under the treatments of 24-h IAA and 12-h ETH without obvious difference following PEG and NaCl stresses (Figure 5A). The MDHAR family demonstrated significant increased enzyme activity under these four conditions (Figure 5B). The contents of AsA, together with the AsA/DHA ratio, indicated a highly consistency with MDHAR activity, showing significant accumulations under conditions of PEG, NaCl, IAA, and ETH treatments (Figure 5C). These results imply that, GhMDHARs have functional diversity and may play an important role for cotton plants to respond to environmental stress and phytohormone treatment.

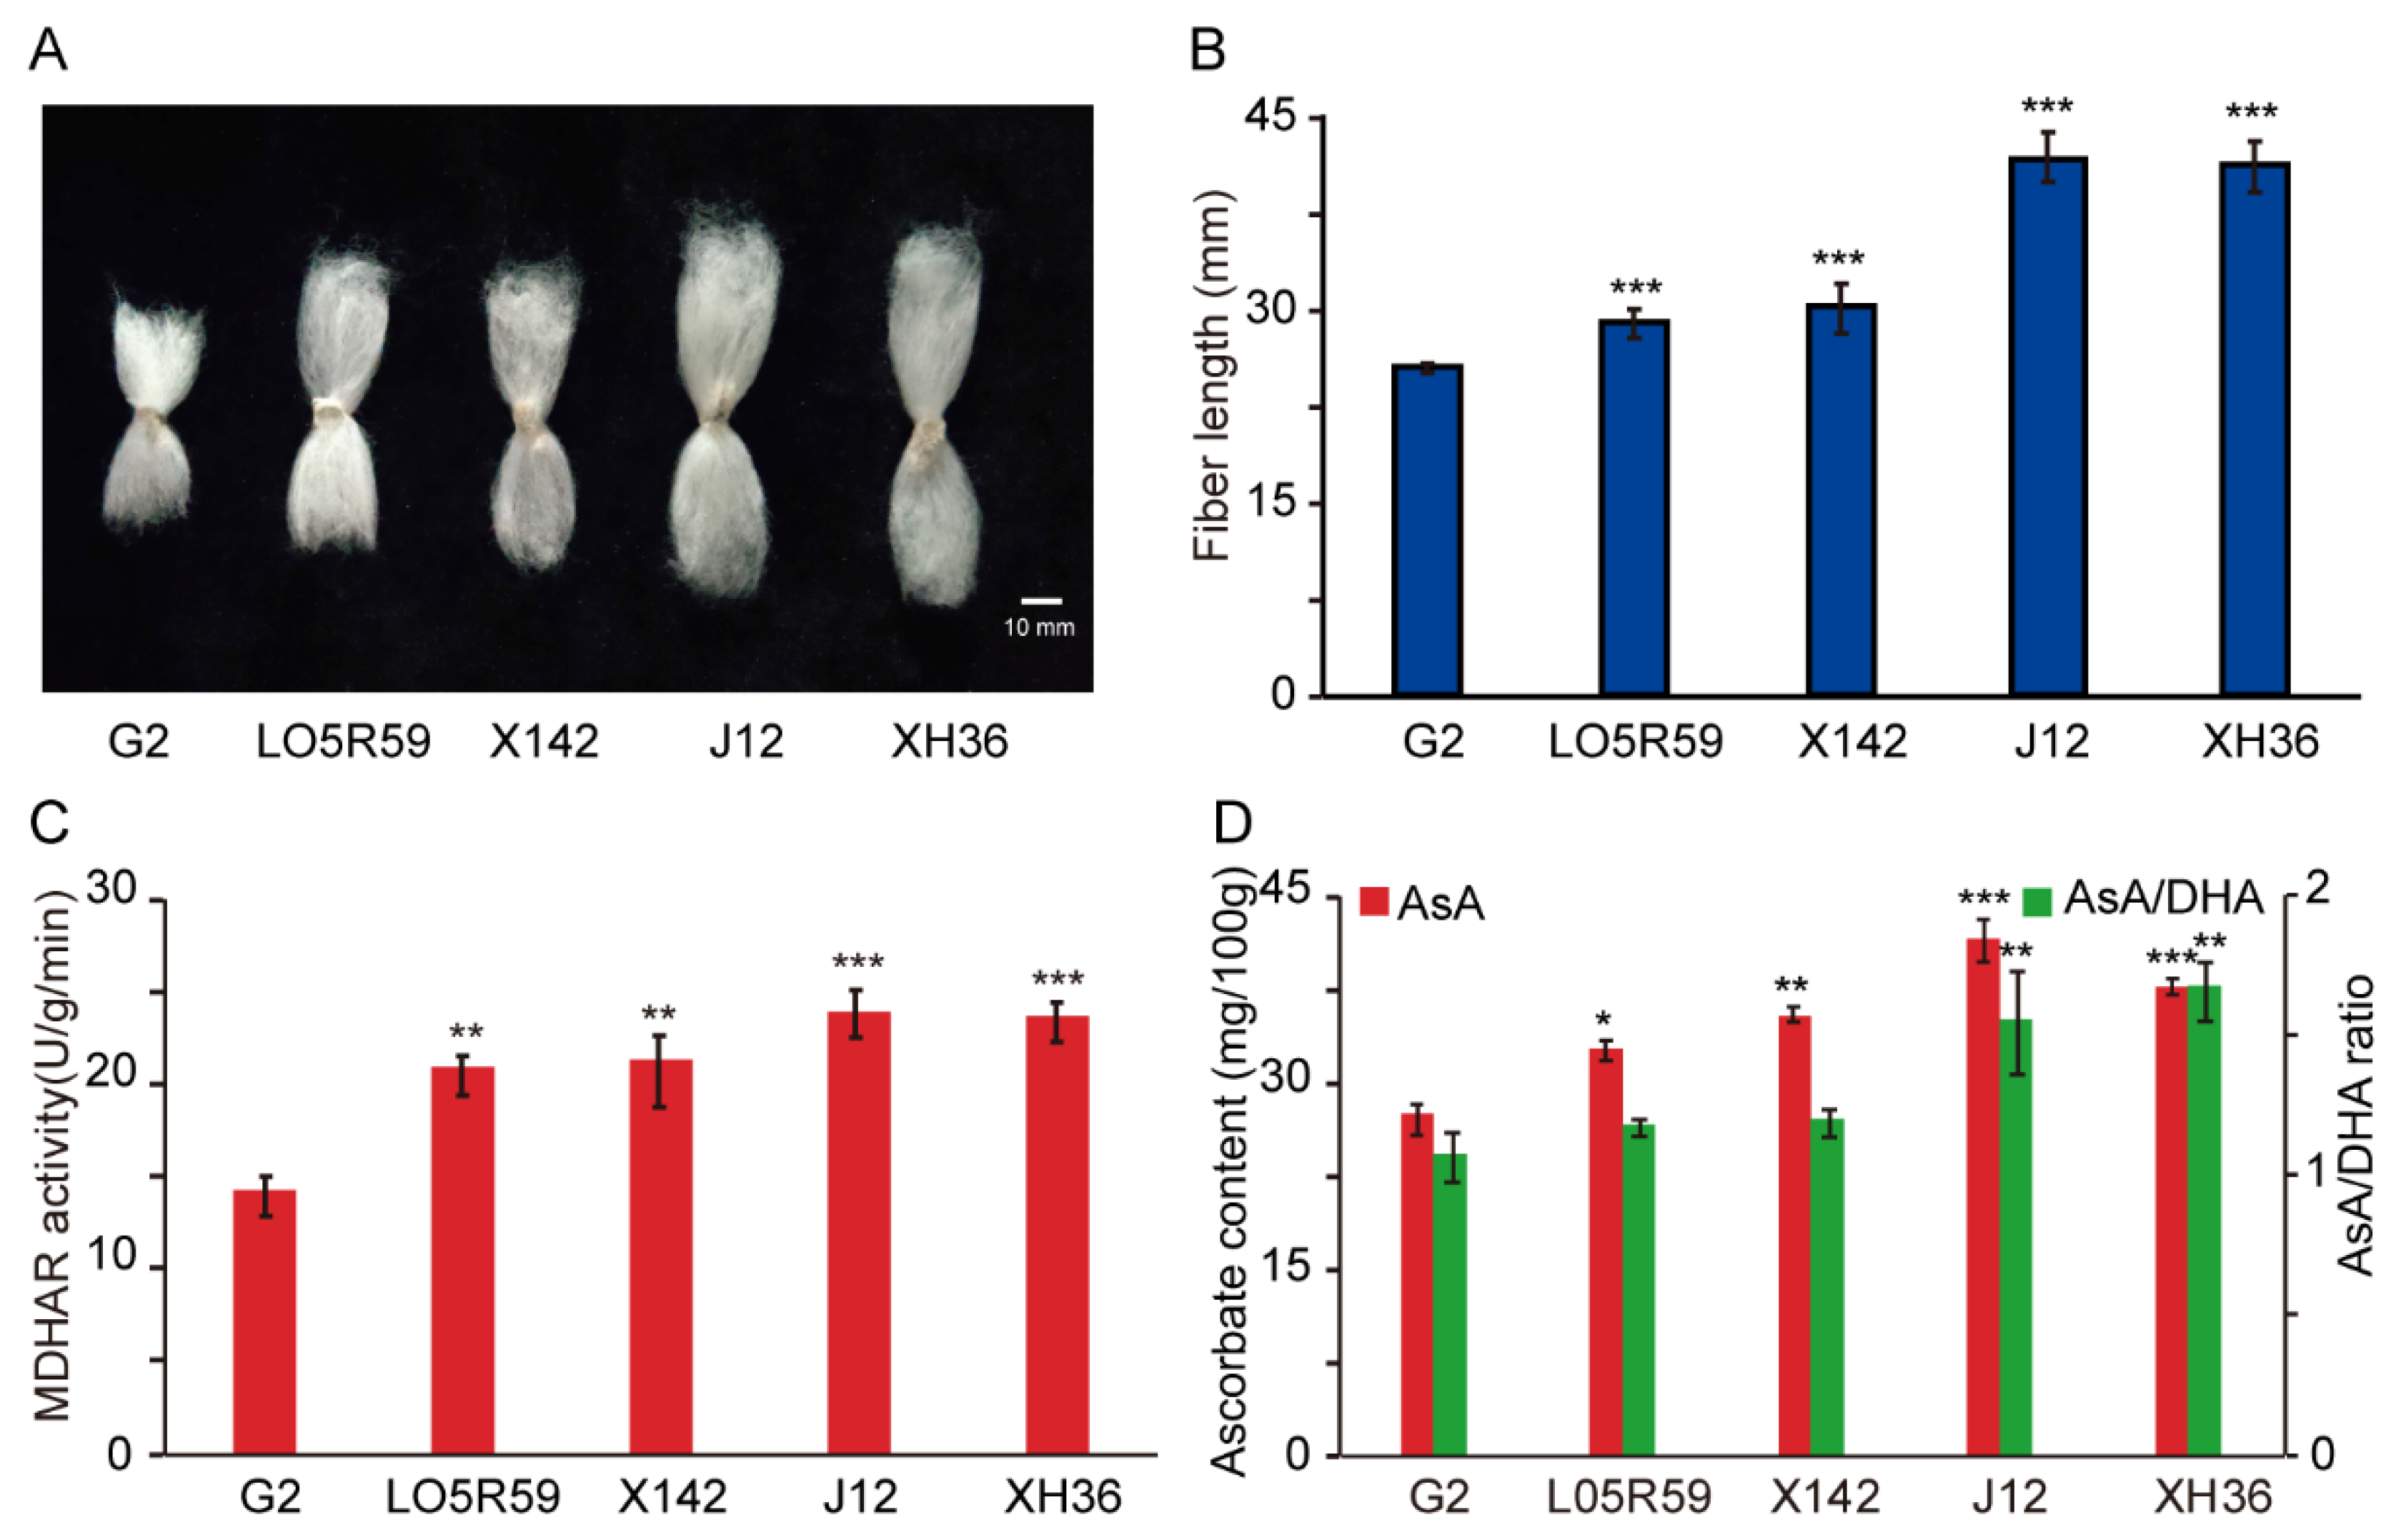
2.6. Analysis of GhMDHAR Involving in Fiber Elongation Development

Our previous studies reported AsA biosynthesis and metabolism as positive regulators involved in fiber growth and cell elongation [16,50]. Therefore, to investigate the GhMDHAR potential function for fiber development, cotton cultivars that have short- (G2), medium- (LO5R59 and X142), and long-fiber (J12 and XH36) lengths were utilized to analyze the connection between MDHAR expression and fiber growth. As presented in Figure 6A,B, these cotton cultivars showed significant differences in fiber length. Meanwhile, MDHAR enzyme activity significantly increased and the AsA content and the AsA/DHA ratio were also significantly increased in the medium and long-fiber cultivars, compared to that in the short-fiber G2 (Figure 6C,D). These results provide a close link between high MDHAR expression and fiber development, suggesting a possible important role for MDHAR in fiber cell elongation via regulation of AsA generation and control of AsA-mediated redox status.

2.7. Analysis of AsA Antioxidative Enzymes under H2O2 Stimulation

With regard to the key role of ROS in plant cell and fiber cell elongation [4,16,48,53,54], and to the important function of the reductive molecule AsA and the corresponding antioxidative enzymes in redundant ROS elimination during the fiber development process [4], expressions of GhMDHAR and the antioxidative enzymes were measured following H2O2 treatment. The results indicated that, at the transcription level, the expressions of GhMDHAR2A/D and GhMDHAR4A/D were significantly induced after 6-h H2O2 stimulation (Figure 7A), implying a potential crucial function in response to ROS. Contrary to the expression level of untreated material, the H2O2-treated materials showed a significant promotion of MDHAR activity after 24-h supplement, together with high levels of AsA content and AsA/DHA ratio after 6-h addition of H2O2, with a continuous increased level thereafter (Figure 7B,C). Other antioxidative enzyme activities were measured. Superoxide dismutase (SOD) showed a prompt increase after 6-h H2O2 treatment and APX and catalase (CAT) indicated significant promotions after 12-h H2O2 stimulation (Figure 7D). These results demonstrate potential GhMDHAR candidates to participate in H2O2 response, and indicate that MDHAR, its catalyzed AsA regeneration and the successive cellular redox situation, combined with the significantly increased activity of the antioxidative enzymes, might play important role in detoxification of ROS.

3. Discussion

MDHAR is an essential enzyme for the regeneration of AsA that performs multiple roles in cell metabolism and physiological response as antioxidative small molecules [55,56], and thus plays important roles in plant development and cell growth [13,15,16] via a nicotinamide adenine dinucleotide phosphate (NADPH)-dependent redox reaction. A plethora of MDHAR genes have been identified in plants including pea, tomato, spinach, cucumber, soybean and potato [32,33,34,35,36,37]. Despite three PpMDHAR in Physcomitrella patens and six AtMDHARs in A. thaliana being reported, there are rare studies for the MDAHR family genes at the genome-wide level with a comprehensive systematic analysis. In this work, by a genome-wide analysis in four cotton species of G. arboreum, G. raimondii, G. hirsutum and G. barbadense, a total of 36 MDHAR members (Supplementary Table S1) were identified that located onto different chromosomes, with six members in diploid cotton G. arboreum and G. raimondii, and 12 members in allotetraploid cotton G. barbadense and G. hirsutum, respectively (Figure 1).
Plant MDHARs are typical FAD monomeric enzymes that catalyze redox reactions using FADH2 as substrate to reduce MDHA to AsA via a GSH-coupled pathway [6,9]. Cotton MDHARs have a representative FAD/NAD binding domain (Supplementary Figure S2) and conserved motifs (Figure 3C), which endow them with the function to catalyze the AsA recycling. Phylogenetic tree analysis constructed by a total of 70 MDHAR sequences from the four cotton species and eight other plant species resulted in three groups, implying a consistent function of the plant MDHARs in the same groups. The 36 cotton MDHARs were classified into different branches with the distinct gene structure organization and motif distribution in different branches (Figure 3), suggesting their potential diverse functions. It was established that the MDHARs that target to different cell compartments perform different functions such as cytosolic PpMDHARs for stress protection [39], peroxisomal PsMDHAR for high light intensity adaptation [57], and chloroplastic LeMDHAR for photoinhibition alleviation [23]. Cotton MDHARs showed different predicted subcellular locations (Figure 3C), maintaining a high consistency with the groups of the phylogenetic tree (Figure 2), implying, again, possible multiple functions of the different targeted MDHARs.
There is abundant evidence that MDHAR genes are expressed correlatively with plant development. Induced expression of pea MDHAR performed important function for seed germination and seedling growth through regulating AsA content [58]. AtMDHAR4 expression is essential for seedling growth through supply of carbon skeletons and energy, via protection of the seed storage oil hydrolysis process by controlling peroxisome ROS levels [29]. In this study, GhMDHARs displayed diverse expression features in different cotton tissues (Figure 4A), suggesting their potential diverse functions in tissue development and plant growth. Considering that AsA is the crucial substance for plant cell enlargement and expansion [13,56], as the important AsA recycling enzyme, several GhMDHARs presented significantly promoted expressions during fiber cell development stages, with the highest level in the fast-elongating stage of 15 DPA, at both mRNA and enzyme activity levels (Figure 4A,B), suggesting there exists a close correlation between MDHAR expression and fiber growth.
MDHAR has been widely studied, especially in the field of plants that resist environmental stress [59]. Eight cotton genes GhMDHAR2A/D, 3A/D, 5A/D and 6A/D indicated significant induced expressions, at both transcriptional and enzymatic levels, under the stresses of PEG and NaCl (Figure 5 A,B). P. patens PpMDHARs were differentially induced with diverse expression patterns under different stress conditions [39]. Avicennia marina AmMDHAR is a salt-inducible gene located in the chloroplast, and its overexpression in tobacco enhanced the tolerance of transgenic plants by increasing the activity of AsA-GSH antioxidative enzymes [52]. Both the mRNA and enzyme expressions of Acanthus ebracteatus AeMDHAR were significantly elevated in the overexpression transgenic rice plant lines that showed increased tolerance to salt stress at both germination and seedling stages [60]. The transgenic tobacco plants overexpressing arabidopsis AtMDHAR1 exhibited strengthened resistance to salt and PEG stresses, showing an increase of MDHAR activity and reductive AsA content coupled with a higher AsA/DHA ratio and lower ROS level as the key factors for the enhanced stress tolerance [25]. In this study, under PEG and NaCl conditions, an elevation of MDHAR enzyme activity and the promotion of corresponding AsA content and AsA/DHA ratio were observed (Figure 5B,C), which displayed the positive connection between stress tolerance and AsA level increase by promotion of MDHAR expression, indicating consistency with reported studies. Phytohormones have long been established as crucial factors for plants to sense and resist the environmental stress [61]. Our results detected the rapid significant induced expressions of GhMDHAR2A/D and 4A/D under IAA treatment and of GhMDHAR2A/D, 3A/D, 4A/D, 5A/D and 6A/D under ETH stimulation, together with the coincident synchronous increases of AsA and AsA/DHA value, validating again the close correlation between phytohormone and stress perception in plants.
AsA plays multifunction roles for redundant ROS detoxification, cell expansion or enlargement, and plant development [13,15,56]. A higher AsA content that might be catalyzed by increased MDHAR activity in longer fibers was observed (Figure 6), which indicated a similar result of AsA accumulation in elongating fibers in cotton [50,62]. Our former studies discovered that AsA accumulation, biosynthesis and metabolism play a key role for fiber cell growth [4,50]. The cell wall is the crucial factor to decide cell length and mechanical strength and is affected by wall-localized hydroxyproline rich glycoproteins (HRGPs) [7]. AsA could influence cell wall alterations as a cofactor of HRGP to promote cell elongation [63,64,65,66], suggesting the possibility of MDHAR participating in cell elongation through the involvement of cell wall assembly indirectly by catalyzing AsA regeneration. ROS, as oxidative molecules, are decisive factors for both plant cell growth and fiber elongation development by affecting redox homeostasis of the cells [4,48,53,67]. Under H2O2 treatment, the MDHAR expression, AsA content and AsA/DHA value, together with AsA-mediated antioxidative enzymes, were significantly elevated (Figure 7), indicating a close link between MDHAR and ROS signaling. Despite the known role of AsA as a reducing agent to respond to ROS, other oxidative molecules were generated by AsA-mediated oxidation reactions, suggesting another possibility for MDHAR involvement in cell elongation via redox signaling pathways [4,16].
Plant hormones such as ethylene and IAA have been reported to control plant root hair, hypocotyl development, and fiber cell elongation [68,69,70,71,72,73,74,75,76,77]. The content of IAA significantly accumulated in the fiber initiation stage and performed important functions for fiber quality [74]. An ethylene signal was the crucial element to decide fiber growth [71,72,75]. Cotton GhMDHARs were significantly induced by IAA and ETH (Figure 5A), coupled with the existing hormone responsive cis-elements (Supplementary Figure S4), showing their potential regulatory role as downstream signaling factors. As a cofactor of 1-aminocyclopropane-1-carboxylic acid oxidase (ACO), which is the key enzyme for ethylene biosynthesis, AsA may control plant cell development [78,79,80], suggesting again the correlation of MDHAR and ethylene signaling. With regard to the existing crosstalk between ROS and phytohormones, and to different subcellular distributions of MDHARs, further investigation into their synergies and functions in different cellular compartments are expected. In conclusion, our results for the first time provide comprehensive systemic analysis of the MDHAR gene family in plants and the four Gossypium species and indicate that MDHAR may be involved in fiber elongation development via controlling AsA-recycling-mediated cellular redox homeostasis.

4. Materials and Methods

4.1. Sequence Acquirement and Chromosomal Distribution of MDHAR Genes in Cotton

The cotton MDHAR sequences were obtained by submitting arabidopsis MDHARs to the genome database for G. arboreum (NCBI, https://www.ncbi.nlm.nih.gov/genome/) [81], G. barbadense (COTTONGEN, https://www.cottongen.org/) [82], G. hirsutum (JGI, https://genome.jgi.doe.gov/portal/) [83] and G. raimondii (JGI, https://genome.jgi.doe.gov/portal/) [84] using local BLASTP program. The transcriptome data of G. hirsutum were downloaded from NCBI (https://www.ncbi.nlm.nih.gov) SRA database (PRJNA248163). The RNA-Seq clean data were mapped to the presented Gossypium genome by TopHat2 (Version 2.0.13, Center for Bioinformatics and Computational Biology, Maryland, USA) and the fragments per kilobase of exon per million reads mapped (FPKM) value was calculated by Cufflinks (Version 2.1.1, University of California, California, USA) [85,86]. The MDHAR candidates were then confirmed by screening the conserved domains by online InterProScan at the website http://www.ebi.ac.uk [87]. The theoretical molecular weight (MW) and isoelectric point (pI) were calculated by online tools at ExPASy website (https://www.expasy.org). Subcellular localizations of the MDHAR proteins were predicted by the online tool ProtComp at Softberry server (http://www.softberry.com/). The MDHAR chromosomal distributions were described by Mapinspect software (Version1.0, Wageningen university, Ralph van Berloo, the Netherlands).

4.2. Evolutionary Analysis and Promoter Cis-Element Identification

Multiple sequence alignment of the MDHAR proteins was performed using ClustalW and the phylogenetic tree of the MDHAR proteins from four cotton cultivars and another eight plant species was constructed by Molecular Evolutionary Genetics Analysis (MEGA 7.0, Institute for Genomics and Evolutionary Medicine, Temple University, Philadelphia, USA) with the parameters of neighbor-joining (N—J) method of 1000 bootstrap replicates, model of p-distance, and Gaps/Missing data treatment by Pairwise deletion. The exon-intron distribution and conserved motif analyses were recognized using the online software of the gene structure display server (GSDS, http://gsds.cbi.pku.edu.cn/index.php) and Multiple EM for Motif Elicitation (MEME, http://meme-suite.org/tools/meme) respectively [88,89]. The Ka/Ks was calculated by Dnasp 5.0 software (Version 5.0, Universitat de Barcelona, Barcelona, Spain) [90]. The Ka/Ks ratios for the GhMDHAR genes were calculated to assess the selection pressure on duplicated genes, with Ka/Ks ratio >1, <1, or = 1 to indicate positive selection, negative selection and purify evolution, respectively [91]. The Tajima relative rate test were used to estimate the evolutionary rate by MEGA 7.0 software. The Circos software (Canada’s Michael Smith Genome Sciences Center, Vancouver, BC, Canada) was used for collinear analysis and the collinear file was calculated by Multiple Collinearity Scan toolkit (MC Scan, Plant Genome Mapping Laboratory, University of Georgia, Georgia, USA) [92]. The TBtools software (State Key Laboratory for Conservation and Utilization of Subtropical Agro-Bioresources, Guangdong, China) was utilized to extract the 1500 bp promoter region upstream of start codon which was then submitted to the online software PlantCARE (http://bioinformatics.psb.ugent.be/webtools/plantcare/) for analyzing the cis-acting element composition [93].

4.3. Cotton Planting and Material Treatment

Upland cotton (G. hirsutum) varieties (X142, G2, LO5R59, J12) and Sea-island cotton (XH36) plants were cultivated in the experimental field of Shihezi University in Shihezi city, Xinjiang, China. The materials of X142 were collected for gene expression analysis, enzyme activity measurement, and treatments of stress and phytohormone. Cotton bolls of X142 were marked with a label on the day post anthesis (defined as 0 DPA) and the ovules and fibers were then collected in different developmental time points of 5, 10, 15, 18, 21 and 28 DPA for cryopreservation and successive use. Cotton seeds were sown in nutrient soil and planted in the greenhouse at 28 °C with a photoperiod of 16 h light/8 h dark. The leaves of three-week-old seedlings of X142 were treated with 20% polyethylene glycol (PEG), 100 mM sodium chloride (NaCl), 100 µm indole-3-acetic acid (IAA), 100 µm ethephon (ETH), and 100 mM H2O2 for 0, 6, 12, 24 h respectively. The treated leaf materials of X142 were collected and stored at −80 °C after flash-freezing in liquid nitrogen for further utilization. The matured fibers of different cotton varieties (G2, LO5R59, X142, J12, and XH36) were collected for length measurement by three independent experiments with 30 samples for each replicate.

4.4. RNA Extraction and qRT-PCR Analysis

Total RNA was extracted from different cotton tissues by our previous method as described [4,16]. The cDNA synthesis was obtained through reverse transcription reaction with 5 microgram total RNA as material according to the instruction of SuperScript® III (Invitrogen, Carlsbad, CA, USA), and then used as a template for qRT-PCR detections with SYBR green real-time PCR master mixes (Applied biosystems, Foster, CA, USA). The specific primers were provided in Supplementary Table S5 and the relative expression levels of the target genes were calculated through the 2−ΔΔCt method using the GhUBQ7 gene as internal control for normalization [94,95]. The relative expression levels of GhMDHAR genes measured by qRT-PCR were used to generate a heatmap that visualized by MultiExperiment viewer (MeV, version 4.9, J. Craig Venter Institute, La Jolla, CA, USA) software.

4.5. Enzyme Assays

The MDHAR enzyme activity was measured by a spectrophotometric method. The materials were ground to powder in liquid nitrogen, and about 50 mg of raw powder was added into 1 mL of pH 6.0 50 mM potassium phosphate buffer (including 1 mM AsA, 40 mM KCl, and 2 mM CaCl2) that was then centrifuged at 14,000 rpm at 4 °C for 10 min. The reaction mix was obtained by the addition of collected enzyme extracts in pH 7.6 50 mM potassium phosphate buffer (containing 0.25 mM NADH, 2.5 mM AsA, and 15 μM FAD), and enough ascorbate oxidase (0.5 unit) was added into the mix solution to trigger the reaction. The values were detected at 340 nm for 2 min, and the absorbance decrease generated by the oxidation of NADH was used to calculate the MDHAR enzyme activity with the extinction coefficient of 6.22 mM−1·cm−1 [96]. The other regular antioxidant enzyme activities of ascorbate peroxidase (APX), superoxide dismutase (SOD), and catalase (CAT) were measured by commercial kits provided by the biotechnological company (Solarbio, Beijing, China).

4.6. Measurement of Asc, AsA and DHA

Asc measurement was performed as in our previous method [16]. Briefly, 5 g of material was ground in mortar on ice in 20 mL 50 g/L trichloroacetic acid (TCA) solution with successive dilution to 100 mL 50 g/L TCA solution. The collected supernatant by filtration was used for AsA determination. The reaction components included 1 mL 50 g/L TCA solution, 1 mL sample extract, 1 mL absolute ethanol, 0.5 mL 0.4% phosphate-ethanol, 1 mL 5 g/L BP-ethanol, and 0.5 mL FeCl3-ethanol solution. The total AsA content was generated by detecting the values at 534 nm through spectrophotometry according to the Asc content standard curve. The 0.5 mL of 60 mmol/L dithiothreitol (DTT) was added to the reaction mix for total Asc determination.

Supplementary Materials

The following are available online at https://www.mdpi.com/2223-7747/10/2/227/s1. Supplementary Figure S1: Segmental duplication of MDHARs and syntenic analysis of G. arboreum, G. raimondii, G. hirsutum and G. barbadense. Supplementary Figure S2: Amino acid sequence alignment of the 36 MDHARs in the four cotton species G. arboreum, G. raimondii, G. hirsutum and G. barbadense. Supplementary Figure S3: Detailed amino acid composition of the nine conserved motifs distributed in MDHAR proteins. Supplementary Figure S4: Analysis of cis-acting element distributions in the promoter regions of MDHAR genes in four cotton species of G. arboreum, G. raimondii, G. hirsutum and G. barbadense. Supplementary Figure S5: Heatmap of expression levels of G. barbadense GbMDHARs in different tissues. Supplementary Table S1: The MDHAR genes information and properties of the deduced proteins. Supplementary Table S2: Tajima relative rate tests of GhMDHAR duplicated gene pairs. Supplementary Table S3: The Ka/Ks ratios for duplicate MDHAR genes in cotton. Supplementary Table S4: Putative cis-element sequences in promoter regions of MDHAR genes. Supplementary Table S5: Primers used in this work.

Author Contributions

Conceptualization, H.L. and X.J.; methodology, F.Z. and B.Z.; software, F.Z., B.Z.; validation, F.W., X.C.; formal analysis, F.W. and A.C.; investigation, F.Z., B.Z.; resources, H.L. and X.J.; data curation, S.X.; writing—original draft preparation, H.L.; writing—review and editing, X.J. and J.A.S.; visualization, F.Z. and H.L.; supervision, H.L.; project administration, H.L. and X.J.; funding acquisition, H.L. All authors have read and agreed to the published version of the manuscript.

Funding

This research was funded by National Natural Science Foundation of China, grant number 31660408 and 31960413, and Science and Technology Project of Bingtuan, grant number 2016AC017 and 2018AB012.

Institutional Review Board Statement

Not applicable

Informed Consent Statement

Not applicable

Data Availability Statement

No new data were created or analyzed in this study. Data sharing is not applicable to this article.

Acknowledgments

We thank Cotton Research Institute of Chinese Academy of Agricultural Sciences for providing the different fiber-length cotton cultivars (G2, LO5R59, and J12).

Conflicts of Interest

The authors declare no conflict of interest.

Abbreviations

ACO1-aminocyclopropane-1-carboxylic acid oxidase
ANOVAAnalysis of Variance
AOAscorbate oxidase
APXAscorbate peroxidase
AsAAscorbic acid
AscAscorbate
CATCatalase
DHADehydroascorbic acid
DPADay post anthesis
DTTDithiothreitol
ETHEthephon
FADFlavin adenine dinucleotide
FPKMFragments per kilobase of exon per million reads mapped
GSDSGene Structure Display Server
GSHGlutathione
HRGPHydroxyproline rich glycoprotein
IAAIndole-3-acetic acid
KaNonsynonymous substitution rate
kDaKiloDalton
KsSynonymous substitution rate
MDHARMonodehydroasorbate reductase
MEGAMolecular evolutionary genetics analysis
MEMEMultiple EM for Motif Elicitation
MIPSMyo-inositol-1-phosphate synthase
MWMolecular weight
NADNicotinamide adenine dinucleotide
NADHNicotinamide adenine dinucleotide
NADPHDinucleotide phosphate
NCBINational Center for Biotechnology Information
N—JNeighbor-joining
ORFOpen reading frame
PEGPolyethylene glycol
pIIsoelectric point
qRT-PCRQuantitative real-time polymerase chain reaction
ROSReactive oxygen species
SODSuperoxide dismutase
TCATrichloroacetic acid
TNT2,4,6-trinitrotoluene
UBQUbiquitin

References

  1. Pastori, G.M.; Kiddle, G.; Antoniw, J.; Bernard, S.; Veljovic-Jovanovic, S.; Verrier, P.J.; Noctor, G.; Foyer, C.H. Leaf vitamin C contentsmodulate plant defense transcripts and regulate genes that control development through hormone signaling. Plant Cell 2003, 15, 939–951. [Google Scholar] [CrossRef] [PubMed] [Green Version]
  2. Apel, K.; Hirt, H. Reactive oxygen species: Metabolism, oxidative stress, and signal transduction. Annu. Rev. Plant Biol. 2004, 55, 373–399. [Google Scholar] [CrossRef] [PubMed] [Green Version]
  3. Mittler, R.; Vanderauwera, S.; Gollery, M.; Van Breusegem, F. Reactive oxygen gene network of plants. Trends Plant Sci. 2004, 9, 490–498. [Google Scholar] [CrossRef] [PubMed]
  4. Li, H.B.; Qin, Y.M.; Pang, Y.; Song, W.Q.; Mei, W.Q.; Zhu, Y.X. A cotton ascorbate peroxidase is involved in hydrogen peroxide homeostasis during fibre cell development. New Phytol. 2007, 175, 462–471. [Google Scholar] [CrossRef]
  5. Marino, D.; Dunand, C.; Puppo, A.; Pauly, N. A burst of plant NADPH oxidases. Trends Plant Sci. 2012, 17, 9–15. [Google Scholar] [CrossRef]
  6. Mittler, R. Oxidative stress, antioxidants and stress tolerance. Trends Plant Sci. 2002, 7, 405–410. [Google Scholar] [CrossRef]
  7. Pignocchi, C.; Foyer, C.H. Apoplastic ascorbate metabolism and its role in the regulation of cell signaling. Curr. Opin. Plant Biol. 2003, 6, 379–389. [Google Scholar] [CrossRef]
  8. Raven, E.L. Peroxidase-catalyzed oxidation of ascorbate. Structural, spectroscopic and mechanistic correlations in ascorbate peroxidase. Subcell. Biochem. 2000, 35, 317–349. [Google Scholar]
  9. Asada, K. The water-water cycle in chloroplasts: Scavenging of active oxygens and dissipation of excess photons. Annu. Rev. Plant Physiol. Plant Mol. Biol. 1999, 50, 601–639. [Google Scholar] [CrossRef]
  10. Conklin, P.L.; Pallanca, J.E.; Last, R.L.; Smirnoff, N. L-ascorbic acid metabolism in the ascorbate-deficient Arabidopsis mutant vtc1. Plant Physiol. 1997, 115, 1277–1285. [Google Scholar] [CrossRef] [Green Version]
  11. Conklin, P.L.; Saracco, S.A.; Norris, S.R.; Last, R.L. Identification of ascorbic acid-deficient Arabidopsis thaliana mutants. Genetics 2000, 154, 847–856. [Google Scholar] [PubMed]
  12. Smirnoff, N.; Wheeler, G.L. Ascorbic acid in plants: Biosynthesis and function. Crit. Rev. Biochem. Mol. Biol. 2000, 35, 291–314. [Google Scholar] [CrossRef] [PubMed]
  13. Conklin, P.L.; Barth, C. Ascorbic acid, a familiar small molecule intertwined in the response of plants to ozone, pathogens, and the onset of senescence. Plant Cell Environ. 2004, 27, 959–970. [Google Scholar] [CrossRef]
  14. Wolucka, B.A.; Goossens, A.; Inzé, D. Methyl jasmonate stimulates the de novo biosynthesis of vitamin C in plant cell suspensions. J. Exp. Bot. 2005, 56, 2527–2538. [Google Scholar] [CrossRef] [Green Version]
  15. Zhang, L.; Wang, Z.; Xia, Y.; Kai, G.; Chen, W.; Tang, K. Metabolic engineering of plant L–ascorbic acid biosynthesis: Recent trends and applications. Crit. Rev. Biotechnol. 2007, 27, 173–182. [Google Scholar] [CrossRef]
  16. Li, R.; Xin, S.; Tao, C.C.; Jin, X.; Li, H.B. Cotton Ascorbate Oxidase Promotes Cell Growth in Cultured Tobacco Bright Yellow-2 Cells through Generation of Apoplast Oxidation. Int. J. Mol. Sci. 2017, 18, 1346. [Google Scholar] [CrossRef] [Green Version]
  17. Foyer, C.H.; Halliwell, B. The presence of glutathione and glutathione reductase in chloroplasts: A proposed role in ascorbic acid metabolism. Planta 1976, 133, 21–25. [Google Scholar] [CrossRef]
  18. Potters, G.; Horemans, N.; Bellone, S.; Caubergs, R.J.; Trost, P.; Guisez, Y.; Asard, H. Dehydroascorbate influences the plant cell cycle through a glutathione independent reduction mechanism. Plant Physiol. 2004, 134, 1479–1487. [Google Scholar] [CrossRef] [Green Version]
  19. Green, M.A.; Fry, S.C. Vitamin C degradation in plant cells via enzymatic hydrolysis of 4-O-oxalyl-l-threonate. Nature 2005, 433, 83–87. [Google Scholar] [CrossRef]
  20. Gallie, D.R. The role of L-ascorbic acid recycling in responding to environmental stress and in promoting plant growth. J. Exp. Bot. 2013, 64, 433–443. [Google Scholar] [CrossRef] [Green Version]
  21. Gallie, D.R. L-ascorbic Acid: A multifunctional molecule supporting plant growth and development. Scientifica 2013, 2013, 795964. [Google Scholar] [CrossRef] [PubMed] [Green Version]
  22. Stevens, R.; Page, D.; Gouble, B.; Garchery, C.; Zamir, D.; Causse, M. Tomato fruit ascorbic acid content is linked with monodehydroascorbate reductase activity and tolerance to chilling stress. Plant Cell Environ. 2008, 31, 1086–1096. [Google Scholar] [CrossRef] [PubMed]
  23. Li, F.; Wu, Q.Y.; Sun, Y.L.; Wang, L.Y.; Yang, X.H.; Meng, Q.W. Overexpression of chloroplastic monodehydroascorbate reductase enhanced tolerance to temperature and methyl viologen-mediated oxidative stresses. Physiol. Plant. 2010, 139, 421–434. [Google Scholar] [CrossRef] [PubMed]
  24. Yeh, H.L.; Lin, T.H.; Chen, C.C.; Cheng, T.X.; Chang, H.Y.; Lee, T.M. Monodehydroascorbate Reductase Plays a Role in the Tolerance of Chlamydomonas Reinhardtii to Photooxidative Stress. Plant Cell Physiol. 2019, 60, 2167–2179. [Google Scholar] [CrossRef] [PubMed]
  25. Eltayeb, A.E.; Kawano, N.; Badawi, G.H.; Kaminaka, H.; Sanekata, T.; Shibahara, T.; Inanaga, S.; Tanaka, K. Overexpression of monodehydroascorbate reductase in transgenic tobacco confers enhanced tolerance to ozone, salt and polyethylene glycol stresses. Planta 2007, 225, 1255–1264. [Google Scholar] [CrossRef]
  26. Hossain, M.; Nakano, Y.; Asada, K. Monodehydroascorbate reductase in spinach chloroplasts and its participation in regeneration of ascorbate for scavenging hydrogen peroxide. Plant Cell Physiol. 1984, 25, 385–395. [Google Scholar]
  27. Jimenez, A.; Hernandez, J.; del Rio, L.; Sevilla, F. Evidence for the presence of the ascorbate-glutathione cycle in mitochondria and peroxisomes of pea leaves. Plant Physiol. 1997, 114, 275. [Google Scholar] [CrossRef] [Green Version]
  28. Mittova, V.; Tal, M.; Volokita, M.; Guy, M. Up-regulation of the leaf mitochondrial and peroxisomal antioxidative systems in response to salt-induced oxidative stress in the wild salt-tolerant tomato species Lycopersicon pennellii. Plant Cell Environ. 2003, 26, 845–856. [Google Scholar] [CrossRef]
  29. Eastmond, P.J. MONODEHYROASCORBATE REDUCTASE4 is required for seed storage oil hydrolysis and postgerminative growth in Arabidopsis. Plant Cell 2007, 19, 1376–1387. [Google Scholar] [CrossRef] [PubMed] [Green Version]
  30. Dalton, D.A.; Baird, L.M.; Langeberg, L.; Taugher, C.Y.; Anyan, W.R.; Vance, C.P.; Sarath, G. Subcellular Localization of Oxygen Defense Enzymes in Soybean (Glycine max [L.] Merr.) Root Nodules. Plant Physiol. 1993, 102, 481–489. [Google Scholar] [CrossRef] [PubMed] [Green Version]
  31. Obara, K.; Sumi, K.; Fukuda, H. The use of multiple transcription starts causes the dual targeting of Arabidopsis putative monodehydroascorbate reductase to both mitochondria and chloroplasts. Plant Cell Physiol. 2002, 43, 697–705. [Google Scholar] [CrossRef] [PubMed] [Green Version]
  32. Murthy, S.; Zilinskas, B. Molecular cloning and characterization of a cDNA encoding pea monodehydroascorbate reductase. J. Biol. Chem. 1994, 269, 31129–31133. [Google Scholar] [CrossRef]
  33. Grantz, A.A.; Brummell, D.A.; Bennett, A.B. Ascorbate free radical reductase mRNA levels are induced by wounding. Plant Physiol. 1995, 108, 411–418. [Google Scholar] [CrossRef] [PubMed] [Green Version]
  34. Sano, S.; Tao, S.; Endo, Y.; Inaba, T.; Hossain, M.A.; Miyake, C.; Matsuo, M.; Aoki, H.; Asada, K.; Saito, K. Purification and cDNA cloning of chloroplastic monodehydroascorbate reductase from spinach. Biosci. Biotechnol. Biochem. 2005, 69, 762–772. [Google Scholar] [CrossRef] [PubMed]
  35. Hossain, M.A.; Asada, K. Monodehydroascorbate reductase from cucumber is a flavin adenine dinucleotide enzyme. J. Biol. Chem. 1985, 260, 12920–12926. [Google Scholar] [CrossRef]
  36. Borracino, G.; Dipierro, S.; Arrigoni, O. Purification and properties of ascorbate free radical reductase from potato tubers. Planta 1986, 167, 521–526. [Google Scholar] [CrossRef]
  37. Dalton, D.A.; Langeberg, L.; Robbins, M. Purification and characterization of monodehydroascorbate reductase from soybean root nodules. Arch. Biochem. Biophys. 1992, 292, 281–286. [Google Scholar] [CrossRef]
  38. De Leonardis, S.; De Lorenzo, G.; Borraccino, G.; Dipierro, S. A specific ascorbate free radical reductase isozyme participates in the regeneration of ascorbate for scavenging toxic oxygen species in potato tuber mitochondria. Plant Physiol. 1995, 109, 847–851. [Google Scholar] [CrossRef] [Green Version]
  39. Lunde, C.; Baumann, U.; Shirley, N.J.; Drew, D.P.; Fincher, G.B. Gene structure and expression pattern analysis of three monodehydroascorbate reductase (Mdhar) genes in Physcomitrella patens: Implications for the evolution of the MDHAR family in plants. Plant Mol. Biol. 2006, 60, 259–275. [Google Scholar] [CrossRef] [Green Version]
  40. Lisenbee, C.S.; Lingard, M.J.; Trelease, R.N. Arabidopsis peroxisomes possess functionally redundant membrane and matrix isoforms of monodehydroascorbate reductase. Plant J. 2005, 43, 900–914. [Google Scholar] [CrossRef]
  41. Negi, B.; Salvi, P.; Bhatt, D.; Majee, M.; Arora, S. Molecular cloning, in-silico characterization and functional validation of monodehydroascorbate reductase gene in Eleusine coracana. PLoS ONE 2017, 12, e0187793. [Google Scholar] [CrossRef] [PubMed] [Green Version]
  42. Feng, H.; Liu, W.; Zhang, Q.; Wang, X.; Wang, X.; Duan, X.; Li, F.; Huang, L.; Kang, Z. TaMDHAR4, a monodehydroascorbate reductase gene participates in the interactions between wheat and Puccinia striiformis f. sp. tritici. Plant Physiol. Biochem. 2014, 76, 7–16. [Google Scholar] [CrossRef] [PubMed]
  43. Johnston, E.J.; Rylott, E.L.; Beynon, E.; Lorenz, A.; Chechik, V.; Bruce, N.C. Monodehydroascorbate reductase mediates TNT toxicity in plants. Science 2015, 349, 1072–1075. [Google Scholar] [CrossRef] [PubMed] [Green Version]
  44. Sakihama, Y.; Mano, J.; Sano, S.; Asada, K.; Yamasaki, H. Reduction of phenoxyl radicals mediated by monodehydroascorbate reductase. Biochem. Biophys. Res. Commun. 2000, 279, 949–954. [Google Scholar] [CrossRef] [PubMed]
  45. Kim, I.S.; Kim, Y.S.; Kim, Y.H.; Park, A.K.; Kim, H.W.; Lee, J.H.; Yoon, H.S. Potential Application of the Oryza sativa Monodehydroascorbate Reductase Gene (OsMDHAR) to Improve the Stress Tolerance and Fermentative Capacity of Saccharomyces cerevisiae. PLoS ONE 2016, 11, e0158841. [Google Scholar]
  46. Truffault, V.; Riqueau, G.; Garchery, C.; Gautier, H.; Stevens, R.G. Is monodehydroascorbate reductase activity in leaf tissue critical for the maintenance of yield in tomato? J. Plant Physiol. 2018, 222, 1–8. [Google Scholar] [CrossRef] [PubMed] [Green Version]
  47. Cruz-Rus, E.; Amaya, I.; Sánchez-Sevilla, J.F.; Botella, M.A.; Valpuesta, V. Regulation of L-ascorbic acid content in strawberry fruits. J. Exp. Bot. 2011, 62, 4191–4201. [Google Scholar] [CrossRef]
  48. Tao, C.; Jin, X.; Zhu, L.; Xie, Q.; Wang, X.; Li, H. Genome-wide investigation and expression profiling of APX gene family in Gossypium hirsutum provide new insights in redox homeostasis maintenance during different fiber development stages. Mol. Genet. Genom. 2018, 293, 685–697. [Google Scholar] [CrossRef] [Green Version]
  49. Yang, Z.; Qanmber, G.; Wang, Z.; Yang, Z.; Li, F. Gossypium Genomics: Trends, Scope, and Utilization for Cotton Improvement. Trends Plant. Sci. 2020, 25, 488–500. [Google Scholar] [CrossRef] [Green Version]
  50. Song, W.; Wang, F.; Chen, L.; Ma, R.; Zuo, X.; Cao, A.; Xie, S.; Chen, X.; Jin, X.; Li, H. GhVTC1, the Key Gene for Ascorbate Biosynthesis in Gossypium hirsutum, Involves in Cell Elongation Under Control of Ethylene. Cells 2019, 8, 1039. [Google Scholar] [CrossRef] [Green Version]
  51. Ma, R.; Song, W.; Wang, F.; Cao, A.; Xie, S.; Chen, X.; Jin, X.; Li, H. A Cotton (Gossypium hirsutum) Myo-Inositol-1-Phosphate Synthase (GhMIPS1D) Gene Promotes Root Cell Elongation in Arabidopsis. Int. J. Mol. Sci. 2019, 20, 1224. [Google Scholar] [CrossRef] [PubMed] [Green Version]
  52. Kavitha, K.; George, S.; Venkataraman, G.; Parida, A. A salt-inducible chloroplastic monodehydroascorbate reductase from halophyte Avicennia marina confers salt stress tolerance on transgenic plants. Biochimie 2010, 92, 1321–1329. [Google Scholar] [CrossRef] [PubMed]
  53. Foreman, J.; Demidchik, V.; Bothwell, J.H.F.; Mylona, P.; Miedema, H.; Torres, M.A.; Linstead, P.; Costa, S.; Brownlee, C.; Jones, J.D.G.; et al. Reactive oxygen species produced by NADPH oxidase regulate plant cell growth. Nature 2003, 422, 442–446. [Google Scholar] [CrossRef] [PubMed]
  54. Mei, W.; Qin, Y.; Song, W.; Li, J.; Zhu, Y. Cotton GhPOX1 encoding plant class III peroxidase may be responsible for the high level of reactive oxygen species production that is related to cotton fiber elongation. J. Genet. Genomics 2009, 36, 141–150. [Google Scholar] [CrossRef]
  55. Chen, Z.; Young, T.E.; Ling, J.; Chang, S.C.; Gallie, D.R. Increasing vitamin C content of plants through enhanced ascorbate recycling. Proc. Natl. Acad. Sci. USA 2003, 100, 3525–3530. [Google Scholar] [CrossRef] [PubMed] [Green Version]
  56. Bulley, S.; Laing, W. The regulation of ascorbate biosynthesis. Curr. Opin. Plant Biol. 2016, 33, 15–22. [Google Scholar] [CrossRef]
  57. Leterrier, M.; Corpas, F.J.; Barroso, J.B.; Sandalio, L.M.; del Río, L.A. Peroxisomal monodehydroascorbate reductase. Genomic clone characterization and functional analysis under environmental stress conditions. Plant Physiol. 2005, 138, 2111–2123. [Google Scholar] [CrossRef] [Green Version]
  58. Barba-Espin, G.; Diaz-Vivancos, P.; Clemente-Moreno, M.J.; Albacete, A.; Faize, L.; Faize, M.; Pérez-Alfocea, F.; Hernández, J.A. Interaction between hydrogen peroxide and plant hormones during germination and the early growth of pea seedlings. Plant Cell Environ. 2010, 33, 981–994. [Google Scholar] [CrossRef]
  59. Gest, N.; Garchery, C.; Gautier, H.; Jiménez, A.; Stevens, R. Light-dependent regulation of ascorbate in tomato by a monodehydroascorbate reductase localized in peroxisomes and the cytosol. Plant Biotechnol. J. 2013, 11, 344–354. [Google Scholar] [CrossRef]
  60. Sultana, S.; Khew, C.Y.; Morshed, M.M.; Namasivayam, P.; Napis, S.; Ho, C.L. Overexpression of monodehydroascorbate reductase from a mangrove plant (AeMDHAR) confers salt tolerance on rice. J. Plant Physiol. 2012, 169, 311–318. [Google Scholar] [CrossRef]
  61. Gong, Z.; Xiong, L.; Shi, H.; Yang, S.; Herrera-Estrella, L.R.; Xu, G.; Chao, D.Y.; Li, J.; Wang, P.Y.; Qin, F.; et al. Plant abiotic stress response and nutrient use efficiency. Sci. China Life Sci. 2020, 63, 635–674. [Google Scholar] [CrossRef] [PubMed]
  62. Guo, K.; Du, X.; Tu, L.; Tang, W.; Wang, P.; Wang, M.; Liu, Z.; Zhang, X. Fibre elongation requires normal redox homeostasis modulated by cytosolic ascorbate peroxidase in cotton (Gossypium hirsutum). J. Exp. Bot. 2016, 67, 3289–3301. [Google Scholar] [CrossRef] [PubMed] [Green Version]
  63. Pang, C.Y.; Wang, H.; Pang, Y.; Xu, C.; Jiao, Y.; Qin, Y.M.; Western, T.L.; Yu, S.X.; Zhu, Y.X. Comparative proteomics indicates that biosynthesis of pectic precursors is important for cotton fiber and Arabidopsis root hair elongation. Mol. Cell Proteomics 2010, 9, 2019–2033. [Google Scholar] [CrossRef] [PubMed] [Green Version]
  64. Tan, L.; Eberhard, S.; Pattathil, S.; Warder, C.; Glushka, J.; Yuan, C.; Hao, Z.; Zhu, X.; Avci, U.; Miller, J.S.; et al. An Arabidopsis cell wall proteoglycan consists of pectin and arabinoxylan covalently linked to an arabinogalactan protein. Plant Cell 2013, 25, 270–287. [Google Scholar] [CrossRef] [PubMed] [Green Version]
  65. Kavi Kishor, P.B.; Hima Kumari, P.; Sunita, M.S.; Sreenivasulu, N. Role of proline in cell wall synthesis and plant development and its implications in plant ontogeny. Front. Plant Sci. 2015, 6, 544. [Google Scholar] [CrossRef] [Green Version]
  66. Marzol, E.; Borassi, C.; Bringas, M.; Sede, A.; Rodríguez Garcia, D.R.; Capece, L.; Estevez, J.M. Filling the Gaps to Solve the Extensin Puzzle. Mol. Plant 2018, 11, 645–658. [Google Scholar] [CrossRef] [PubMed] [Green Version]
  67. Carol, R.J.; Dolan, L. The role of reactive oxygen species in cell growth: Lessons from root hairs. J. Exp. Bot. 2006, 57, 1829–1834. [Google Scholar] [CrossRef] [Green Version]
  68. Pitts, R.J.; Cernac, A.; Estelle, M. Auxin and ethylene promote root hair elongation in Arabidopsis. Plant J. 1998, 16, 553–560. [Google Scholar] [CrossRef]
  69. Achard, P.; Vriezen, W.H.; Van Der Straeten, D.; Harberd, N.P. Ethylene regulates Arabidopsis development via the modulation of DELLA protein growth repressor function. Plant Cell 2003, 15, 2816–2825. [Google Scholar] [CrossRef] [Green Version]
  70. Grauwe, L.D.; Vandenbussche, F.; Tietz, O.; Palme, K.; Straeten, D.V.D. Auxin, ethylene and brassinosteroids: Tripartite control of growth in the Arabidopsis hypocotyl. Plant Cell Physiol. 2005, 46, 827–836. [Google Scholar] [CrossRef]
  71. Shi, Y.H.; Zhu, S.W.; Mao, X.Z.; Feng, J.X.; Qin, Y.M.; Zhang, L.; Cheng, J.; Wei, L.P.; Wang, Z.Y.; Zhu, Y.X. Transcriptome profiling, molecular biological, and physiological studies reveal a major role for ethylene in cotton fiber cell elongation. Plant Cell 2006, 18, 651–664. [Google Scholar] [CrossRef] [PubMed] [Green Version]
  72. Qin, Y.M.; Hu, C.Y.; Pang, Y.; Kastaniotis, A.J.; Hiltunen, J.K.; Zhu, Y.X. Saturated very-long-chain fatty acids promote cotton fiber and Arabidopsis cell elongation by activating ethylene biosynthesis. Plant Cell 2007, 19, 3692–3704. [Google Scholar] [CrossRef] [PubMed] [Green Version]
  73. Strader, L.C.; Chen, G.L.; Bartel, B. Ethylene directs auxin to control root cell expansion. Plant J. 2010, 64, 874–884. [Google Scholar] [CrossRef] [PubMed] [Green Version]
  74. Zhang, M.; Zheng, X.; Song, S.; Zeng, Q.; Hou, L.; Li, D.; Zhao, J.; Wei, Y.; Li, X.; Luo, M.; et al. Spatiotemporal manipulation of auxin biosynthesis in cotton ovule epidermal cells enhances fiber yield and quality. Nat. Biotechnol. 2011, 29, 453–458. [Google Scholar] [CrossRef] [PubMed]
  75. Li, F.; Fan, G.; Lu, C.; Xiao, G.; Zou, C.; Kohel, R.J.; Ma, Z.; Shang, H.; Ma, X.; Wu, J.; et al. Genome sequence of cultivated Upland cotton (Gossypium hirsutum TM-1) provides insights into genome evolution. Nat. Biotechnol. 2015, 33, 524–530. [Google Scholar] [CrossRef] [PubMed] [Green Version]
  76. Feng, Y.; Xu, P.; Li, B.S.; Li, P.P.; Wen, X.; An, F.Y.; Gong, Y.; Xin, Y.; Zhu, Z.Q.; Wang, Y.C.; et al. Ethylene promotes root hair growth through coordinated EIN3/EIL1 and RHD6/RSL1 activity in Arabidopsis. Proc. Natl. Acad. Sci USA 2017, 114, 13834–13839. [Google Scholar] [CrossRef] [PubMed] [Green Version]
  77. Wang, Y.; Ji, Y.; Fu, Y.; Guo, H. Ethylene-induced microtubule reorientation is essential for fast inhibition of root elongation in Arabidopsis. J. Integr. Plant Biol. 2018, 60, 864–877. [Google Scholar] [CrossRef] [Green Version]
  78. Davey, M.W.; Van Montagu, M.; Inze, D.; Sanmartin, M.; Kanellis, A.; Smirnoff, N.; Benzie, I.J.J.; Strain, J.J.; Favell, D.; Fletcher, J. Plant l–ascorbic acid: Chemistry, function, metabolism, bioavailability and effects of processing. J. Sci. Food Agric. 2000, 80, 825–860. [Google Scholar] [CrossRef]
  79. Conklin, P.L. Recent advances in the role and biosynthesis of ascorbic acid in plants. Plant Cell Environ. 2001, 24, 383–394. [Google Scholar] [CrossRef]
  80. Arrigoni, O.; De Tullio, M.C. Ascorbic acid: Much more than an antioxidant. Biochim. Biophys. Acta. 2002, 1569, 1–9. [Google Scholar] [CrossRef]
  81. Li, F.; Fan, G.; Wang, K.; Sun, F.; Yuan, Y.; Song, G.; Li, Q.; Ma, Z.; Lu, C.; Zou, C.; et al. Genome sequence of the cultivated cotton Gossypium arboreum. Nat. Genet. 2014, 46, 567–572. [Google Scholar] [CrossRef] [PubMed] [Green Version]
  82. Wang, M.; Tu, L.; Yuan, D.; Zhu, D.; Shen, C.; Li, J.; Liu, F.; Pei, L.; Wang, P.; Zhao, G.; et al. Reference genome sequences of two cultivated allotetraploid cottons, Gossypium hirsutum and Gossypium barbadense. Nat. Genet. 2019, 51, 224–229. [Google Scholar] [CrossRef] [PubMed] [Green Version]
  83. Chen, Z.J.; Sreedasyam, A.; Ando, A.; Song, Q.; De Santiago, L.M.; Hulse-Kemp, A.M.; Schmutz, J. Genomic diversifications of five Gossypium allopolyploid species and their impact on cotton improvement. Nat. Genet. 2020, 52, 525–533. [Google Scholar] [CrossRef] [PubMed] [Green Version]
  84. Paterson, A.H.; Wendel, J.F.; Gundlach, H.; Guo, H.; Jenkins, J.; Jin, D.; Schmutz, J. Repeated polyploidization of Gossypium genomes and the evolution of spinnable cotton fibres. Nature 2012, 492, 423–427. [Google Scholar] [CrossRef] [PubMed] [Green Version]
  85. Trapnell, C.; Pachter, L.; Salzberg, S.L. TopHat: Discovering splice junctions with RNA-Seq. Bioinformatics 2009, 25, 1105–1111. [Google Scholar] [CrossRef] [PubMed]
  86. Trapnell, C.; Williams, B.A.; Pertea, G.; Mortazavi, A.; Kwan, G.; van Baren, M.J.; Salzberg, S.L.; Wold, B.J.; Pachter, L. Transcript assembly and quantification by RNA-Seq reveals unannotated transcripts and isoform switching during cell differentiation. Nat. Biotechnol. 2010, 28, 511–515. [Google Scholar] [CrossRef] [PubMed] [Green Version]
  87. Jones, P.; Binns, D.; Chang, H.Y.; Fraser, M.; Li, W.; McAnulla, C.; McWilliam, H.; Maslen, J.; Mitchell, A.; Nuka, G.; et al. InterProScan 5: Genome-scale protein function classification. Bioinformatics 2014, 30, 1236–1240. [Google Scholar] [CrossRef] [Green Version]
  88. Hu, B.; Jin, J.; Guo, A.; Zhang, H.; Luo, J.; Gao, G. GSDS 2.0: An upgraded gene feature visualization server. Bioinformatics 2015, 31, 1296–1297. [Google Scholar] [CrossRef] [Green Version]
  89. Tong, X.; Cao, A.; Wang, F.; Chen, X.; Xie, S.; Shen, H.; Jin, X.; Li, H. Calcium-Dependent Protein Kinase Genes in Glycyrrhiza Uralensis Appear to be Involved in Promoting the Biosynthesis of Glycyrrhizic Acid and Flavonoids under Salt Stress. Molecules 2019, 24, 1837. [Google Scholar] [CrossRef] [Green Version]
  90. Zhu, L.; Jin, X.; Xie, Q.; Yao, Q.; Wang, X.; Li, H. Calcium-Dependent Protein Kinase Family Genes Involved in Ethylene-Induced Natural Rubber Production in Different Hevea brasiliensis Cultivars. Int. J. Mol. Sci. 2018, 19, 947. [Google Scholar] [CrossRef] [Green Version]
  91. Yadav, C.B.; Bonthala, V.S.; Muthamilarasan, M.; Pandey, G.; Khan, Y.; Prasad, M. Genome-wide development of transposable elements-based markers in foxtail millet and construction of an integrated database. DNA Res. 2015, 22, 79–90. [Google Scholar] [CrossRef] [PubMed] [Green Version]
  92. Krzywinski, M.; Schein, J.; Birol, I.; Connors, J.; Gascoyne, R.; Horsman, D.; Jones, S.J.; Marra, M.A. Circos: An information aesthetic for comparative genomics. Genome Res. 2009, 19, 1639–1645. [Google Scholar] [CrossRef] [PubMed] [Green Version]
  93. Lescot, M.; Déhais, P.; Thijs, G.; Marchal, K.; Moreau, Y.; Van de Peer, Y.; Rouzé, P.; Rombauts, S. PlantCARE, a database of plant cis-acting regulatory elements and a portal to tools for in silico analysis of promoter sequences. Nucleic Acids Res. 2002, 30, 325–327. [Google Scholar] [CrossRef] [PubMed]
  94. Pan, Z.; Chen, L.; Wang, F.; Song, W.; Cao, A.; Xie, S.; Chen, X.; Jin, X.; Li, H. Genome-Wide Identification and Expression Analysis of the Ascorbate Oxidase Gene Family in Gossypium hirsutum Reveals the Critical Role of GhAO1A in Delaying Dark-Induced Leaf Senescence. Int. J. Mol. Sci. 2019, 20, 6167. [Google Scholar] [CrossRef] [Green Version]
  95. Livak, K.J.; Schmittgen, T.D. Analysis of relative gene expression data using real-time quantitative PCR and the 2(-Delta Delta C(T)) Method. Methods 2001, 25, 402–408. [Google Scholar] [CrossRef]
  96. Vanacker, H.; Guichard, M.; Bohrer, A.S.; Issakidis-Bourguet, E. Redox Regulation of Monodehydroascorbate Reductase by Thioredoxin y in Plastids Revealed in the Context of Water Stress. Antioxidants 2018, 7, 183. [Google Scholar] [CrossRef] [Green Version]
Figure 1. Chromosome distribution of MDHAR family genes in four Gossypium species. The chromosomal mapping of the MDHAR genes of A and D genome in diploid cotton of G. arboreum (A) and G. raimondii (B), and of A- and D subgenome in allotetraploid cotton of G. hirsutum (C) and G. barbadense (D), were illustrated. The red dashed lines indicate the segmentally duplicated gene pairs.
Plants 10 00227 g001
Figure 2. Phylogenetic analysis of MDHAR family genes in cotton and other plant species. A total of 70 MDHAR protein sequences from the four cotton species of G. arboreum (GaMDHARs), G. raimondii (GrMDHARs), G. hirsutum (GhMDHARs), and G. barbadense (GbMDHARs), and from another eight plant species including Glycine max (GmMDHARs), Oryza sativa (OsMDHARs), Sorghum bicolor (SbMDHARs), Zea mays (ZmMDHARs), Arabidopsis thaliana (AtMDHARs), Theobroma cacao (TcMDHARs), Vitis vinifera (VvMDHARs) and Cicer arietinum (CaMDHARs) were utilized for construction of a neighbor-joining (N—J) tree with 1000 bootstrap replicates, to generate three typical groups (Group A–C) that are indicated by different background colors. The different colored texts represent the distinct plant species, and the cotton MDHARs are marked with the diverse colored dots.
Plants 10 00227 g002
Figure 3. Gene organization and conserved motif analysis of the MDHAR gene family in four Gossypium species. (A) The cotton MDHARs were classified into three typical clusters which indicated the consistency with that in Figure 2. (B) Gene structures of the MDHARs are indicated with introns by black lines and the exons by red boxes. (C) A total of nine conserved motifs were discovered and indicated by different colored boxes with the specific distributions presented and the amino acid length displayed at the bottom. Both the intron/exon organizations and conserved motifs of the MDHARs demonstrated similar distributions in the same clusters.
Plants 10 00227 g003
Figure 4. Tissue-specific and fiber-developmental expression analyses of G. hirsutum GhMDHARs. (A) Heatmap of expression levels of GhMDHAR genes in different tissues. The fragments per kilobase of exon per million reads mapped (FPKM) values in different tissues including root, stem, leaf, petal, stamen, pistil, ovule and fiber were obtained from the public transcriptomic data released at the website of NCBI and used to generate the heatmap. The colors of blue, yellow, and red indicate the low, moderate and high expression levels respectively. (B) qRT-PCR-based heatmap of expression levels of GhMDHAR genes during fiber developmental stages. The 0-DPA ovules and fibers at different stages of 5, 10, 15, 18, 21 and 28 DPA, were collected and used for RNA extract to perform the qRT-PCR assay to analyze the expression levels of GhMDHAR genes. GhUBQ7 gene was utilized as the internal control for normalization. The expression level of 0-DPA ovule was artificially set to 1. The different color scale indicates the gene expression levels with the colors of yellow, orange, and red to present regular, moderate, and high expression abundances respectively. (C) MDHAR enzyme activity measurement during fiber development stages. The wild-type 0-DPA ovules and fibers at the stages of 5, 10, 15, 18, 21 and 28 DPA were collected for MDHAR enzyme activity analysis. The value of 0-DPA ovule was utilized as reference for statistical difference analysis through one-way ANOVA, with *, **, and *** to indicate the differences at 0.05, 0.01 and 0.001 levels, respectively. (D) AsA content and AsA/DHA ratio determinations during different fiber development stages. The materials of 0-DPA ovule and fibers at different development stages of 5, 10, 15, 18, 21 and 28 DPA were obtained for AsA content determination and AsA/DHA ratio calculation. The value of 0-DPA ovule was used as reference for statistical difference by One-way ANOVA. Asterisks indicate the significant differences, ** p < 0.01, *** p < 0.001.
Plants 10 00227 g004
Figure 5. Expression analysis of GhMDHARs under abiotic stress and hormone treatment. The cotton leaf materials under the stresses of polyethylene glycol (PEG) and NaCl and the hormone treatments of indole-3-acetic acid (IAA) and ethylene (ETH) were collected and used for analyses of qRT-PCR, enzyme activity and AsA content, and AsA/ratio. (A) qRT-PCR-based heatmap of expression levels of GhMDHARs. The presented cotton leaf materials, with or without the treatments, were collected and extracted for RNA samples that were then used for qRT-PCR assay. The results were normalized using GhUBQ7 gene as internal control. The expression levels of untreated 0-h materials were artificially set to 1. The different color scale represents the distinct expression abundances with the colors of yellow, orange, and red to indicate regular, moderate, and high expression respectively. The heatmap was generated by R package. (B) Enzyme activity determination of MDHAR. The leaves treated by the stress and hormone treatments were utilized for enzyme solution extract and then for activity measurement. (C) Analysis of AsA content and AsA/DHA ratio under the stress and hormone treatments. Significant difference test was performed by one-way ANOVA using the value of untreated materials (0 h) as reference, with *, **, and *** to represent the differences at 0.05, 0.01 and 0.001 levels, respectively.
Plants 10 00227 g005
Figure 6. Correlation analysis between GhMDHAR expression and fiber elongation development. The fiber materials of cotton cultivars that have different fiber lengths of short-fiber G2, moderate-fiber LO5R59 and X142, and long-fiber J12 and XH36, were selected for analysis of MDHAR activity, AsA content and AsA/DHA ratio. Phenotype (A) and fiber length statistics (B) of mature fibers of different fiber-length cotton cultivars. (C) MDHAR enzyme activity measurement of fibers of different fiber-length cotton cultivars. The 15-DPA fibers of presented different cotton cultivars were collected and used for MDHAR activity analysis. (D) Determination of AsA content and AsA/DHA ratio in fibers of different fiber-length cotton cultivars. The 15-DPA fibers of different cotton cultivars were utilized for AsA content and AsA/DHA ratio analysis. The values of the short-length cultivar G2 were selected as control for statistics difference analysis by one-way ANOVA. Asterisks indicate the significant differences, * p < 0.05, ** p < 0.01, *** p < 0.001.
Plants 10 00227 g006
Figure 7. Analyses of GhMDHAR expression and AsA antioxidant enzyme activity under H2O2 treatment. The cotton leaves treated by 100 μM H2O2 for 6, 12 and 24 h were applied for the determinations. (A) Heatmap of GhMDHARs expression levels detected by qRT-PCR. The colors of yellow, orange, and red indicate low, moderate, and high expression levels respectively. GhUBQ7 gene was used as internal control for normalization and the untreated 0-h expression level was artificially set to 1. R package was utilized to generate the heatmap. (B) MDHAR enzyme activity analysis. (C) Measurement of AsA content and AsA/DHA ratio. (D) Activity analysis of AsA antioxidant enzymes. The activities of enzymes of ascorbate peroxidase (APX), superoxide dismutase (SOD) and catalase (CAT) were measured. The values of untreated 0-h materials were used as reference for statistical difference analysis, with *, **, and *** to present the differences at 0.05, 0.01 and 0.001 levels, respectively.
Plants 10 00227 g007
Publisher’s Note: MDPI stays neutral with regard to jurisdictional claims in published maps and institutional affiliations.

