Article

Molecular Manipulation of the miR396 and miR399 Expression Modules Alters the Response of Arabidopsis thaliana to Phosphate Stress

by
Joseph L. Pegler
1,
Duc Quan Nguyen
1,2,
Jackson M. J. Oultram
1,
Christopher P. L. Grof
1,† and
Andrew L. Eamens
1,3,4,*,†
1
Centre for Plant Science, School of Environmental and Life Sciences, Faculty of Science, University of Newcastle, Callaghan, NSW 2308, Australia
2
Institute of Genome Research, Vietnam Academy of Research and Technology, 18 Hoang Quoc Viet Str., Cau Giay, Hanoi 100000, Vietnam
3
School of Science, Technology and Engineering, University of the Sunshine Coast, Maroochydore, QLD 4558, Australia
4
School of Chemistry and Molecular Biosciences, The University of Queensland, Brisbane, QLD 4072, Australia
*
Author to whom correspondence should be addressed.
These authors contributed equally to this work.
Plants 2021, 10(12), 2570; https://doi.org/10.3390/plants10122570
Submission received: 19 October 2021 / Revised: 16 November 2021 / Accepted: 22 November 2021 / Published: 24 November 2021

Abstract

:
In plant cells, the molecular and metabolic processes of nucleic acid synthesis, phospholipid production, coenzyme activation and the generation of the vast amount of chemical energy required to drive these processes relies on an adequate supply of the essential macronutrient, phosphorous (P). The requirement of an appropriate level of P in plant cells is evidenced by the intricately linked molecular mechanisms of P sensing, signaling and transport. One such mechanism is the posttranscriptional regulation of the P response pathway by the highly conserved plant microRNA (miRNA), miR399. In addition to miR399, numerous other plant miRNAs are also required to respond to environmental stress, including miR396. Here, we exposed Arabidopsis thaliana (Arabidopsis) transformant lines which harbor molecular modifications to the miR396 and miR399 expression modules to phosphate (PO4) starvation. We show that molecular alteration of either miR396 or miR399 abundance afforded the Arabidopsis transformant lines different degrees of tolerance to PO4 starvation. Furthermore, RT-qPCR assessment of PO4-starved miR396 and miR399 transformants revealed that the tolerance displayed by these plant lines to this form of abiotic stress most likely stemmed from the altered expression of the target genes of these two miRNAs. Therefore, this study forms an early step towards the future development of molecularly modified plant lines which possess a degree of tolerance to growth in a PO4 deficient environment.

1. Introduction

In plant cells, the molecular and metabolic processes of nucleic acid synthesis, phospholipid production, coenzyme activation, and the generation of considerable amounts of chemical energy in the form of ATP (adenosine triphosphate) and GTP (guanosine triphosphate), all rely on an adequate supply of the essential macronutrient, phosphorous (P) [1,2]. The requirement of an adequate supply of P in plant cells is readily evidenced by the intricately linked molecular mechanisms of P sensing, signaling and transport throughout plants [3,4], together with the severely impeded developmental progression of plants when cultivated in P limited or deplete conditions, including altered root architecture, inhibited shoot elongation, and the over-accumulation of the antioxidant pigment, anthocyanin [5]. Phosphate (PO4), in the form of inorganic phosphate (Pi), is the predominant form of P taken up from the soil by the plant root system; however, soil PO4 primarily exists in an organic or insoluble form which is largely inaccessible by the uptake mechanisms of plant roots [6]. Due to the limitation of available soil PO4, combined with the absolute requirement of an adequate concentration of P in all plant cells for normal growth and development, plants employ elegant mechanisms to spatially regulate the cellular concentration of P across their developmentally distinct tissues [7,8]. To achieve such spatial variance in cellular P concentration, plants continually modulate P homeostasis via constant regulation of the rate of acquisition of external PO4 from the soil, in combination with the parallel adjustment of the degree of remobilization of their existing internal stores of P [7,9].
It is predicted that up to 40% of the yield of the world’s most economically significant crop species is limited by poor soil P availability [10]. In modern agriculture, this is addressed via the application of P fertilizers, a practice which itself presents a serious environmental concern with such fertilizers generated from finite and rapidly depleting natural deposits of phosphorite, deposits predicted to be completely exhausted within the next 50 to 100 years [11,12,13]. Further compounding this issue is that the major crop species only take up 15 to 30% of the exogenously applied P within the first 12 months of application, with the remainder running off or leaching into the local terrestrial, and subsequently aquatic ecosystems, which can lead to the eutrophication of habitats proximal to agricultural land [14,15]. Of additional concern is the continual and ever more rapid expansion of the global population, population growth that is predicted to require approximately double the current crop production outputs by 2050 to meet consumer demands on agriculture [16,17,18]. One avenue being pursued to attempt to adequately address this growing demand is the use of a molecular engineering approach to improve P use efficiency and/or the rate of external Pi acquisition by plants to maximize productivity, growth and/or survival during growth conditions with access to minimal or no P. Such an alternate approach is also urgently required to dramatically reduce the use of P fertilizers, and therefore, to negate the current reliance of modern agriculture on the supply of exogenous P, a rapidly depleting natural resource.
One such molecular approach to provide crops with an enhanced tolerance to cultivation in a P limited environment, or for their growth in other environments where the plant is exposed to other forms of abiotic stress, is the identification of abiotic stress-responsive small non-protein-coding regulatory RNAs (sRNAs) which function at the posttranscriptional level to modulate gene expression [19,20,21,22,23]. In modern molecular research, the application of high throughput sequencing has made profiling of sRNA transcript abundance across plant species, and under altered growth conditions, including exposure of a plant to different abiotic stress regimes, a routine experimental procedure [24,25,26]. For the microRNA (miRNA) class of small regulatory RNA, transcript profiling has identified across multiple evolutionarily diverse plant species a common suite of miRNAs that change in their abundance when essential minerals such as P, copper (Cu), nitrogen (N) and sulfur (S) are lacking from the growth environment [25,26,27]. The responsiveness of a single miRNA to multiple forms of mineral nutrient stress is unsurprising considering the interrelatedness in the complexity of the regulation of mineral nutrient uptake and subsequent transport in plants [24,27,28,29]. In the genetic model plant species Arabidopsis thaliana (Arabidopsis) for example, the mechanisms of N and P uptake from the soil are reciprocally linked to one another. Therefore, a miRNA with a reduced accumulation profile during N stress, will usually be enhanced in abundance during the cultivation of Arabidopsis in a P-depleted environment [20,29,30].
One such miRNA is miR399, with altered miR399 abundance central to the molecular response of Arabidopsis to regulate PO4 uptake from the soil to maintain P homeostasis [19,20]. More specifically, when the internal supply of P becomes limited in Arabidopsis aerial tissues, the transcriptional activity of the five genomic loci (including MIR399A-MIR399D and MIR399E/F) that encode the precursor transcripts from which the miR399 sRNA is processed, is activated by the PO4 stress-responsive transcription factor, PHOSPHATE RESPONSIVE1 (PHR1) [31,32,33]. After precursor transcript processing, the now highly abundant miR399 is transported from the aerial tissues to the roots where it guides the protein machinery of the Arabidopsis miRNA pathway to specifically repress the transcript abundance of its target gene, PHOSPHATE2 (PHO2) [19,26,31,34]. PHO2 functions as a ubiquitin conjugating enzyme24 (UBC24), and in Arabidopsis roots, PHO2 targets the PO4 transporter proteins, PHOSPHATE TRANSPORTER1; 4 (PHT1;4), PHT1; 8 and PHT1; 9 for ubiquitin-mediated degradation [24,35]. The removal of PHT1; 4, PHT1; 8 and PHT1; 9 suppression via the loss of PHO2-mediated regulation, a posttranslational change which itself stems from the enhancement of miR399-directed repression of PHO2 transcript abundance, promotes root-to-shoot P transport in an attempt by Arabidopsis to maintain P homeostasis in its aerial tissues in P limited conditions [3,23,36,37].
In Arabidopsis, miR396-directed posttranscriptional regulation of six members of the GROWTH REGULATING FACTOR (GRF) family of transcription factors has been extensively documented to play a central role in all aspects of both the vegetative and reproductive phases of development [38,39,40,41,42,43]. More specifically, miR396-directed regulation of GRF1, GRF2, GRF3, GRF7, GRF8 and GRF9 gene expression is required for root [38,39], leaf [40,41] and floral organ growth and development [42,43], as well as to control the rate of cell proliferation and to mediate cell aging in Arabidopsis [40,41]. In addition to occupying its central role in the control of Arabidopsis development, the miR396/GRF expression module has also been associated with the adaptive response of Arabidopsis and of maize (Zea mays), rice (Oryza sativa) and wheat (Triticum aestivum) to the abiotic stressors, abscisic acid (ABA), cold, drought, heat, osmotic, salt, and ultraviolet light [44,45,46,47,48,49,50]. Alteration of the miR396/GRF expression module at the posttranscriptional level across this evolutionary diverse group of plant species, and to such an extensive range of environmental stressors, strongly suggests that this miRNA expression module plays an equally important role in the molecular response of plants to abiotic stress as it does in standard plant development.
Although the miR399/PHO2 expression module has been repeatedly demonstrated to direct a central role in modulating soil PO4 uptake to maintain P homeostasis [9,19,20,31,35], this miRNA/target gene expression module has only been implicated in a small number of other aspects of Arabidopsis growth and development. Namely, Arabidopsis plants molecularly modified to over-accumulate miR399, and as a direct consequence of this molecular alteration, to have highly reduced PHO2 expression levels, were also shown to have increased stomata numbers due to elevated stomatal density [51]. In addition, the miR399/PHO2 expression module has been associated with the early flowering phenotype expressed by Arabidopsis plants exposed to reduced ambient temperature during the seedling stage of development [52]. More recently, we demonstrated the requirement of alteration to the abundance of the miR399 sRNA, and of its PHO2 target transcript, as part of the molecular response of Arabidopsis seedlings exposed to salt stress [53]. In direct contrast to the miR399/PHO2 expression module and the response of Arabidopsis to PO4 stress, miR396-directed alterations to the abundance of its GRF target gene transcripts has been widely documented across an evolutionary diverse group of plant species and environmental stressors. For example, alteration of the abundance of the miR396 sRNA and/or the expression of its GRF target genes has been reported in Arabidopsis, rice, tobacco (Nicotiana tabacum), tomato (Solanum lycopersicum), cotton (Gossypium hirsutum L.) and creeping bentgrass (Agrostis stolonifera) following the exposure of these plant species to salt stress [54,55,56,57,58].
The Arabidopsis transformants, including the MIM396, MIR396, MIM399 and MIR399 plant lines, were generated to confirm our initial finding [50] that molecular alteration of the miR396/GRF and miR399/PHO2 expression modules forms part of the molecular response of Arabidopsis to salt stress [53,58]. In this study, we exposed 8-day-old MIM396, MIR396, MIM399 and MIR399 seedlings to a 7-day growth period in the absence of PO4 to (1) establish the requirement of the miR396/GRF expression module as part of the molecular response of Arabidopsis to PO4 starvation, and (2) confirm the central requirement of the miR399/PHO2 expression module for Arabidopsis to mount an adaptive response to this form of abiotic stress. This approach clearly demonstrated that during the seedling stage of Arabidopsis development, unmodified Col-0 plants were the most sensitive to cultivation in a growth environment that lacked P. Accordingly, the experimental approach used here also revealed that both sets of transformant lines which harbored molecular modifications to either the miR396 or miR399 expression module were less sensitive to the imposed stress than were Col-0 seedlings. More specifically, molecular alteration of the miR396 expression module afforded MIM396 and MIR396 seedlings a mild degree of tolerance to PO4 starvation, whereas the alteration of miR399 abundance via a molecular approach provided MIM399 and MIR399 seedlings with a further enhancement in tolerance to this form of abiotic stress. Subsequent quantification of GRF and PHO2 target gene expression strongly suggested that the tolerance displayed by the miR396 and miR399 transformant lines to PO4 starvation was the result of altered miRNA target gene expression in MIM396, MIR396, MIM399 and MIR399 seedlings. This study therefore forms an important early step in the future development of molecularly modified plant lines tolerant to cultivation in a growth environment deficient in the level of P required for normal plant growth and development.

2. Results

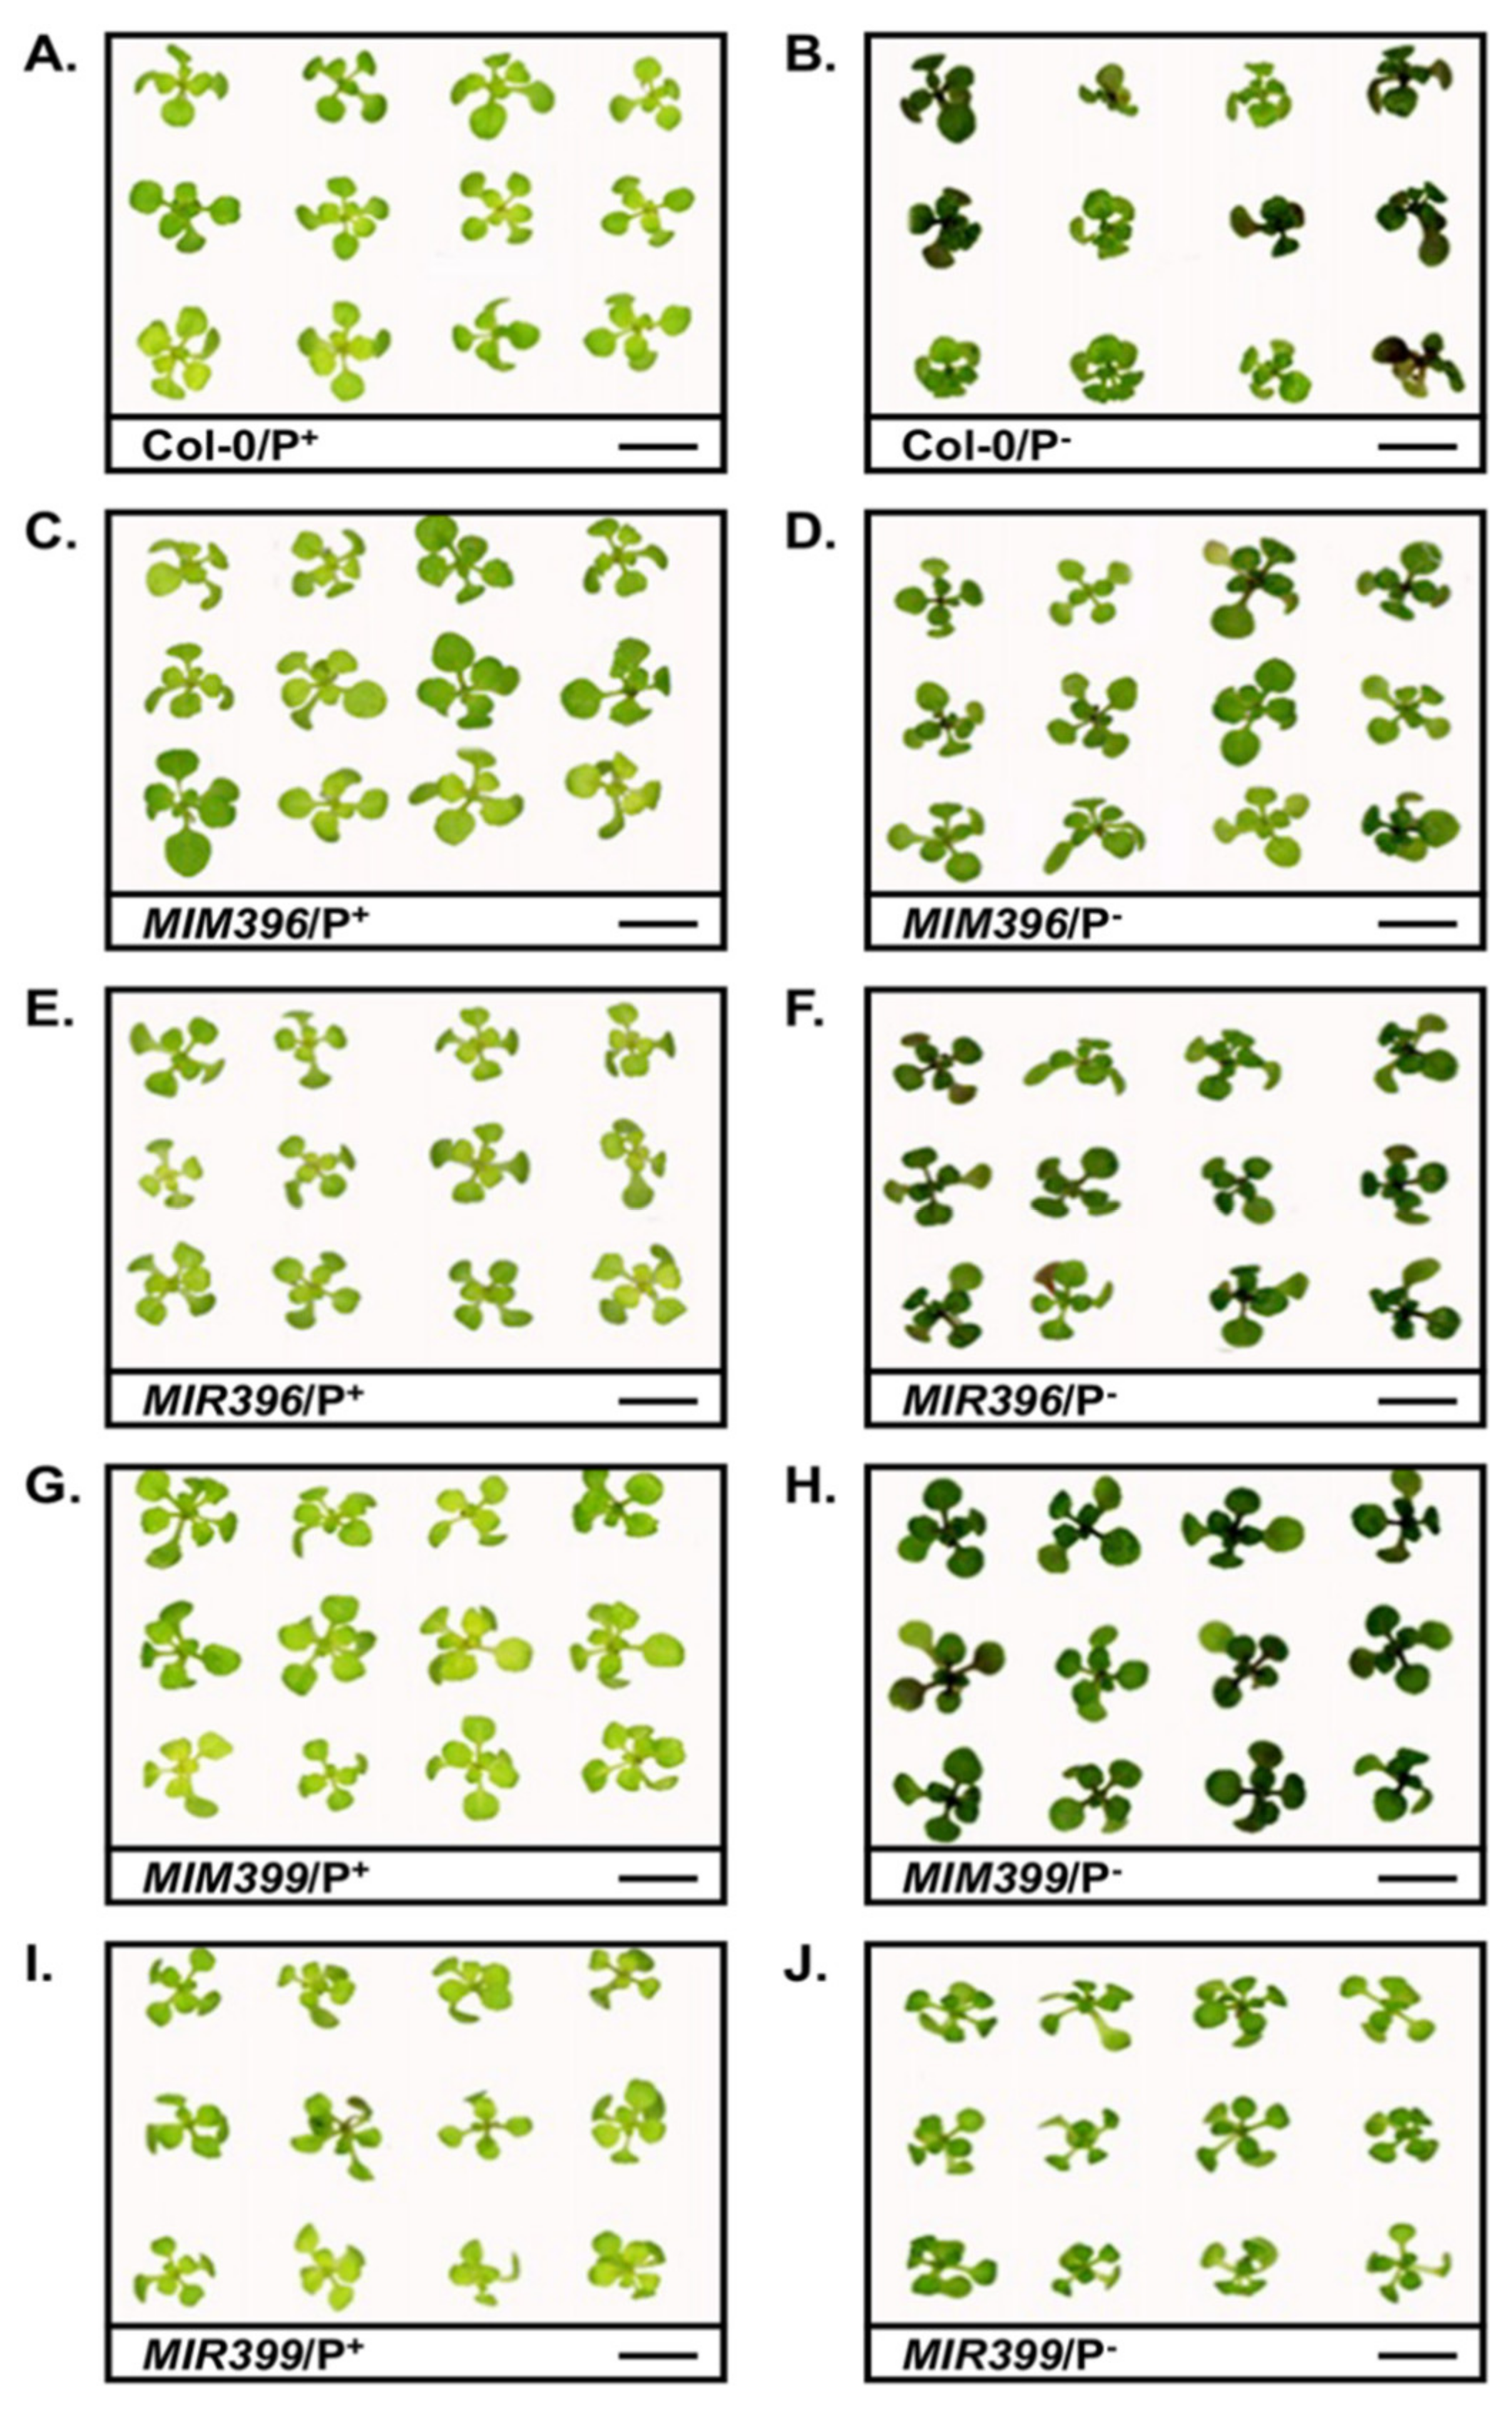
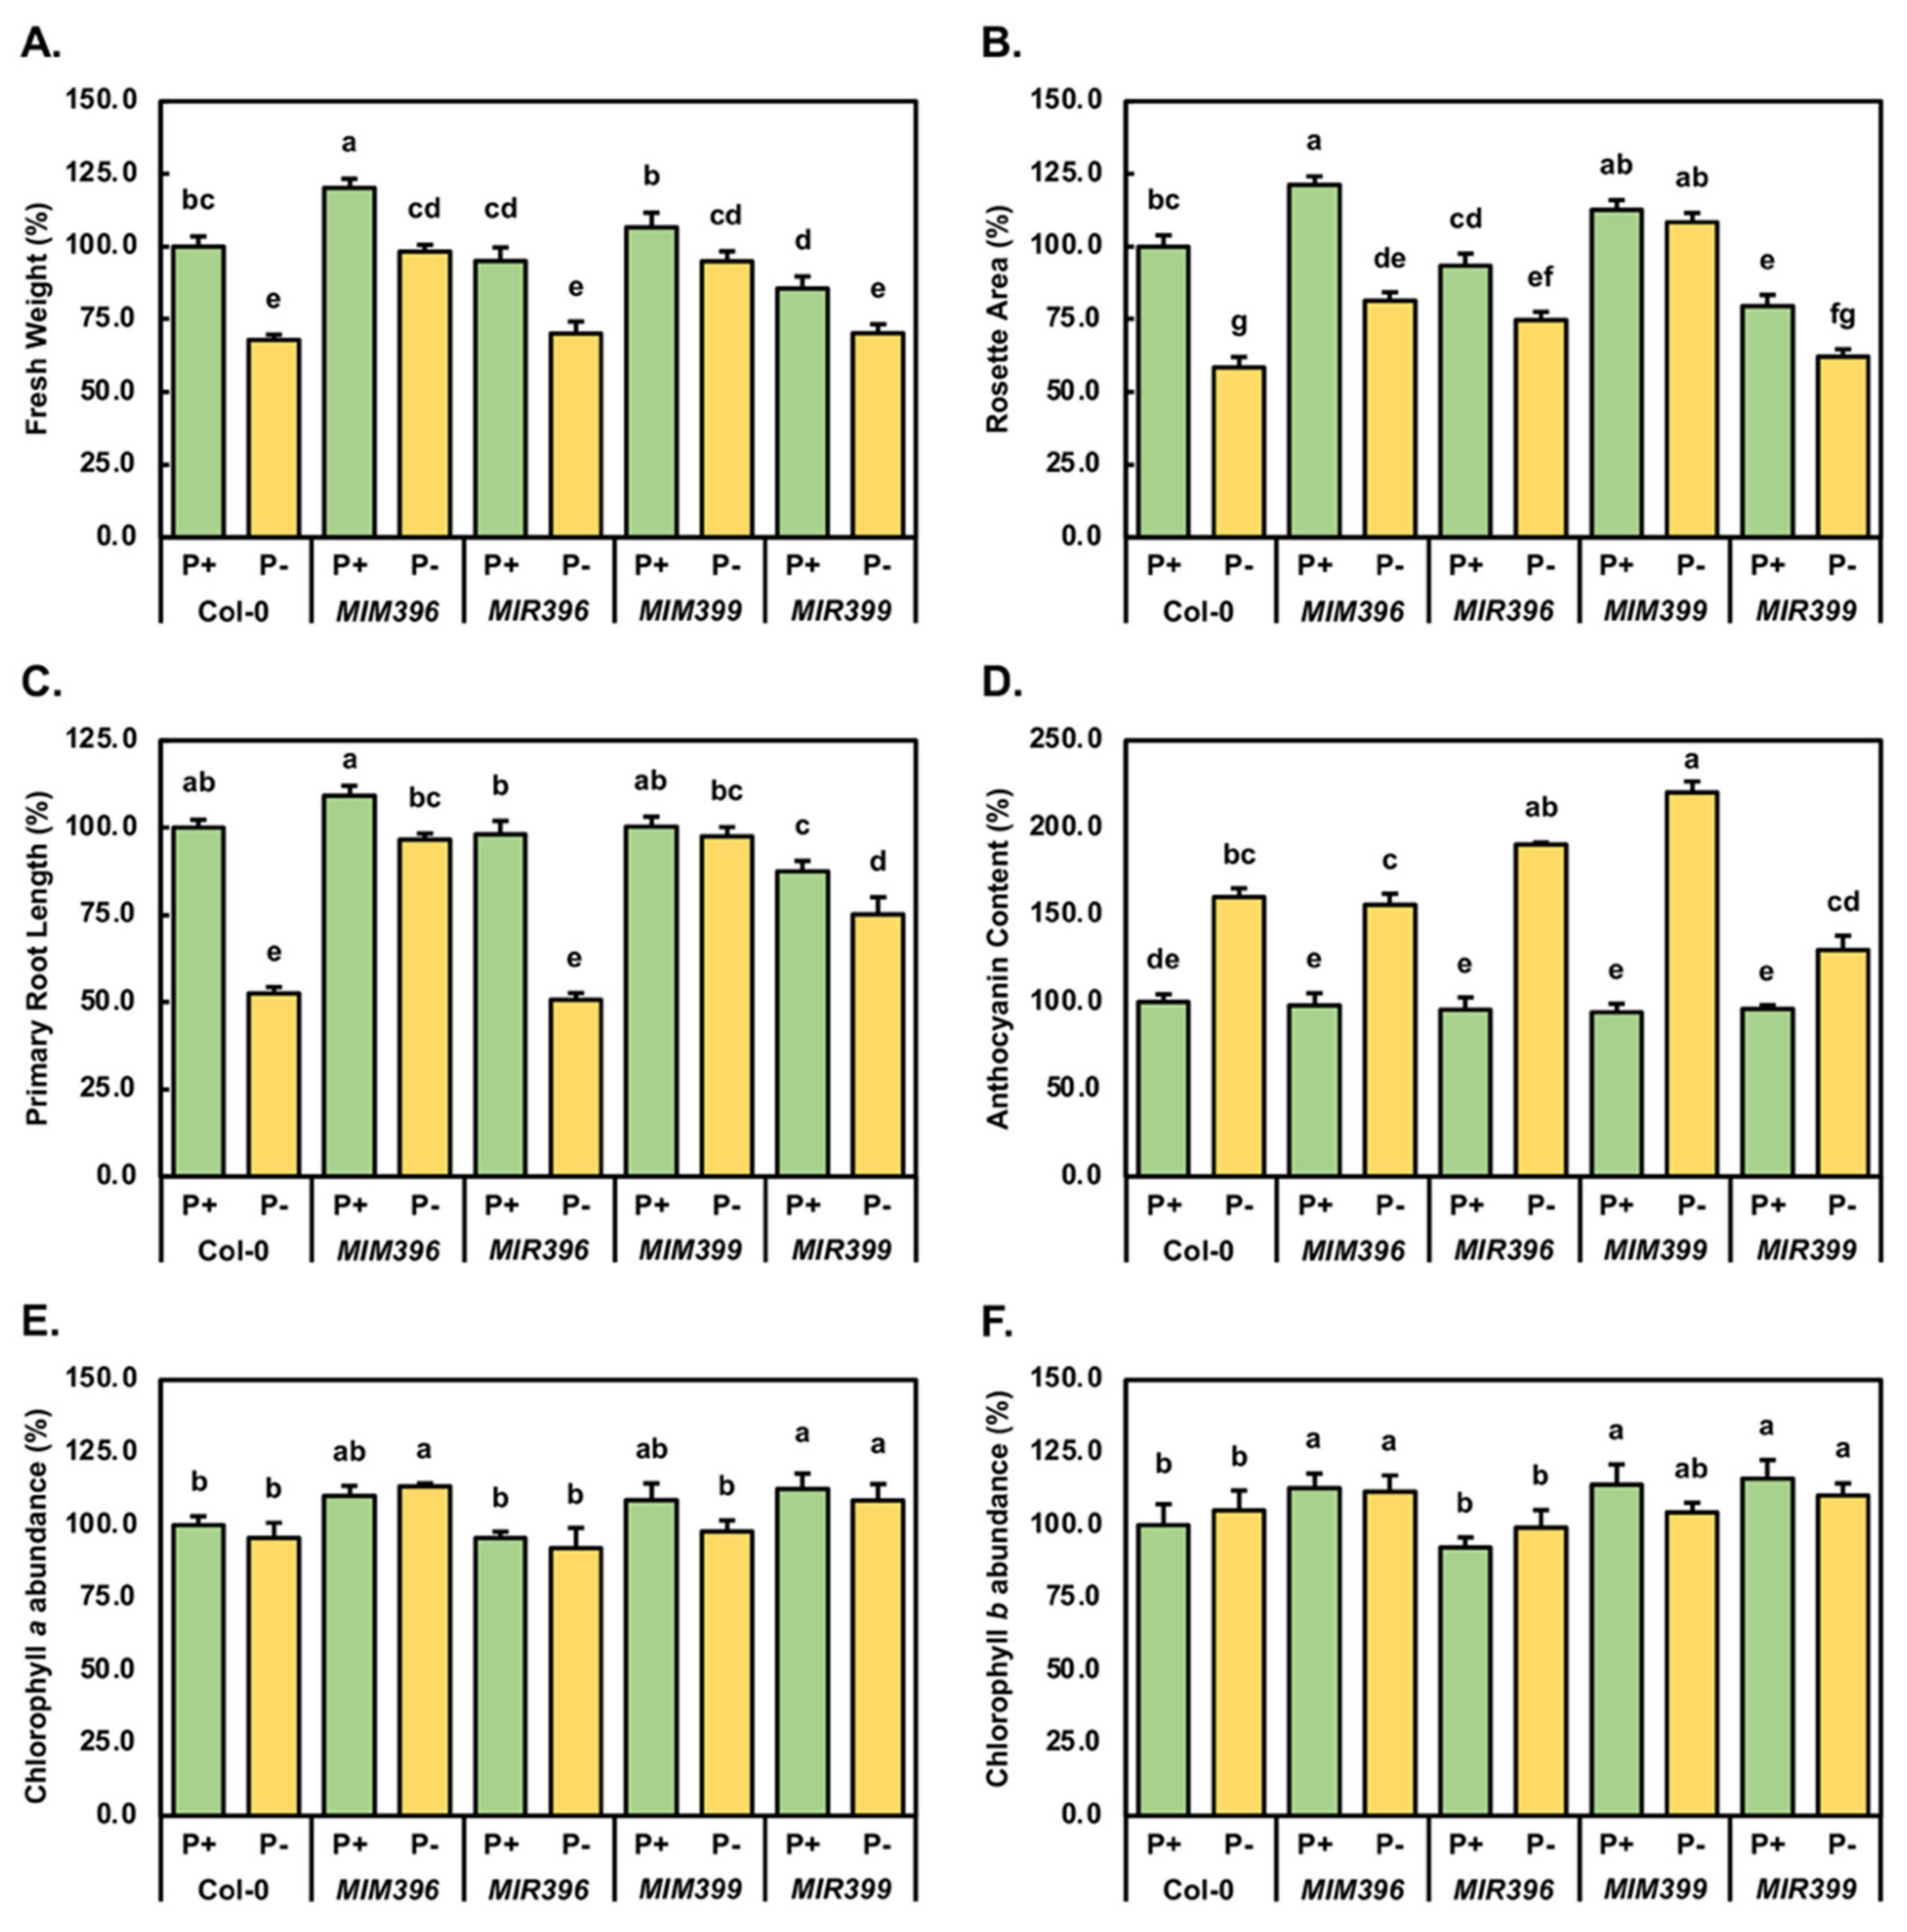
2.1. Phenotypic and Physiological Analysis of Control-Grown and Phosphate-Starved Col-0, MIM396, MIR396, MIM399 and MIR399 Seedlings

We have previously demonstrated that the abundance of miRNAs, miR396 and miR399, is significantly altered in 15-day-old Arabidopsis whole seedlings following their cultivation for 7 days on Arabidopsis growth medium supplemented with 150 millimolar sodium chloride (150 mM NaCl) [50]. In addition, the miR399/PHO2 expression module has been repeatedly demonstrated to occupy a central role in the molecular response of Arabidopsis to PO4 starvation [9,19,20,31,35]. We therefore used a molecular modification approach to generate Arabidopsis transformant lines with significantly altered miR396 and miR399 abundance. Following experimental verification that miR396 and miR399 abundance was reduced in MIM396 and MIR399 plants, respectively, and that the abundance of these two miRNAs was elevated in the MIR396 and MIR399 transformant lines [53,58], 8-day-old MIM396, MIR396, MIM399 and MIR399 seedlings, together with unmodified Col-0 seedlings of the same age, were exposed to a 7-day period of PO4 starvation. This approach was undertaken to attempt to establish a role for the miR396/GRF expression module in the molecular response of Arabidopsis to PO4 starvation, as well as to compare any established requirement of the miR396/GRF expression module to this form of abiotic stress to that of the well documented and central role occupied by the miR399/PHO2 expression module.
As previously described [53,58], when cultivated for the entire 15-day experimental period on standard Arabidopsis growth medium (referred to as P+ samples from herein), the growth of MIM396/P+ and MIM399/P+ seedlings was promoted (Figure 1C,E), while the developmental progression of the MIR396/P+ and MIR399/P+ transformant lines was mildly repressed (Figure 1G,I), compared to Col-0/P+ whole seedlings (Figure 1A). Figure 1B shows that the cultivation of 8-day-old Col-0 seedlings for a 7-day period on PO4 deficient Arabidopsis growth medium (referred to as P- samples from herein) was detrimental to the development of Col-0/P- seedlings. More specifically, the elongation of Col-0/P- rosette leaf petioles was repressed, and the distal tips of Col-0/P- rosette leaves curled down towards the growth medium. In addition, the healthy light-green coloration of Col-0/P+ rosette leaves (Figure 1A), was replaced by a dark green to brown coloration in Col-0/P- rosette leaves (Figure 1B). Comparison of Figure 1D to Figure 1C, and Figure 1F to Figure 1E, respectively, shows that the development of the MIM396 and MIR396 transformant lines was not impacted to the same degree as it was in 15-day-old Col-0 seedlings by the 7-day cultivation period in the absence of PO4. However, the dark green to brown colored pigment still accumulated to a higher level in MIM396/P- and MIR396/P- rosette leaves, than it did in the rosette leaves of MIM396/P+ and MIR396/P+ plants (Figure 1C–F). The developmental progression of the MIM399 transformant line also appeared to be impeded to a lesser degree by the applied stress (Figure 1G,H), than was the vegetative development of 15-day-old Col-0 seedlings (Figure 1A,B). Namely, the petioles of MIM399/P- rosette leaves expanded to the same length as those of MIM399/P+ rosette leaves, and the area of MIM399/P- rosette leaf blades was only slightly reduced compared to those of MIM399/P+ seedlings. However, the rosette leaves of all MIM399 seedlings exposed to the 7-day stress treatment period uniformly accumulated high levels of the dark green to brown colored pigment, versus the Col-0 line, where this pigment was observed to only accumulate in the aerial tissues of 50–60% of exposed seedlings (Figure 1B). Of the five Arabidopsis lines assessed in this study, the development of the MIR399 transformant line appeared to be impacted the least by the applied stress, with rosette leaf petiole length, and rosette leaf blade area, as well as the color of MIR399/P- rosette leaves, all highly similar to the corresponding phenotypic metrics displayed by MIR399/P+ plants (Figure 1I,J).
To determine the degree to which altered miR396 or miR399 abundance influenced the phenotypic or physiological response of the MIM396, MIR396, MIM399 or MIR399 transformants to PO4 starvation, the phenotypic metrics of fresh weight, rosette area, and primary root length, along with the physiological parameters of anthocyanin abundance and chlorophyll a and b content were quantitatively assessed (Figure 2). The fresh weight of a Col-0/P+ seedling was determined to be 28.1 mg (Figure 2A). As indicated by the developmental phenotypes displayed by 15-day-old control-grown MIM396 and MIM399 seedlings (Figure 1C,G), and when compared to Col-0/P+ seedlings, the fresh weight of these two transformants was significantly and mildly increased by 20.2% (33.8 mg) and 6.6% (30.0 mg), respectively (Figure 2A). Similarly, via comparison to Col-0/P+ seedlings, and as suggested by the developmental phenotypes displayed by MIR396/P+ and MIR399/P+ seedlings (Figure 1E,I), the fresh weight of a 15-day-old control-grown MIR396 and MIR399 seedling was determined to be mildly and significantly reduced by 4.9% (26.8 mg) and 14.2% (24.1 mg), respectively (Figure 2A). The average fresh weight metric was next used to determine the degree of response of each Arabidopsis line to the imposed stress. Compared to the Col-0/P+ sample, the average fresh weight of a Col-0/P- seedling was significantly reduced by 32.1% to 19.1 mg (Figure 1B and Figure 2A). Although not reduced to the same degree as determined for Col-0 seedlings, exposure of MIM396 and MIR396 seedlings to a 7-day PO4 starvation period significantly reduced the fresh weights of MIM396/P- (Figure 1D) and MIR396/P- (Figure 1F) seedlings by 21.9% (26.4 mg) and 25.0% (20.1 mg), respectively (Figure 2A). Figure 2A also clearly shows that alteration of miR399 abundance, be it either the enhancement or repression of the level of miR399, modulated the degree of response of the MIM399 and MIR399 transformants to the applied stress. More specifically, the fresh weight of a MIM399/P- or MIR399/P- seedling was moderately, yet significantly reduced by 11.6% (26.5 mg) and 10.4% (21.4 mg), respectively, compared to the fresh weight of a MIM399/P+ and MIR399/P+ seedling.
The rosette area of 15-day-old control-grown or PO4-starved Col-0, MIM396, MIR396, MIM399 and MIR399 whole seedlings was next assessed (Figure 2B) with this analysis revealing that the rosette area of a Col-0/P- seedling was 10.6 mm2, which represented a 41.6% reduction in the rosette area of a Col-0/P+ seedling at 18.2 mm2. Although the rosette area of a MIM396/P+ seedling was significantly increased by 21.3% to 22.1 mm2, compared to a Col-0/P+ seedling (Figure 2B), the 7-day stress period was shown to reduce the rosette area of a MIM396/P- seedling (14.8 mm2) by a similar degree (39.9%) as was determined for the Col-0 sample. The imposed stress induced a milder response in the miR396 and miR399 overexpression lines than it did in either Col-0 or MIM396 seedlings. More specifically, the rosette area of MIR396/P- and MIR399/P- seedlings was moderately, yet significantly reduced by 18.8% (13.6 mm2) and 17.4% (11.3 mm2), from 17.0 and 14.5 mm2 for MIR396/P+ and MIR399/P+ seedlings, respectively (Figure 1E,I and Figure 2B). Of the five Arabidopsis lines analyzed in this study, Figure 2B clearly shows that the lowest degree of negative impact on this phenotypic parameter was observed for the MIM399 transformant line. More specifically, when compared to Col-0/P+ seedlings, the rosette area of a control-grown MIM399 seedling was moderately increased by 12.6% to 20.5 mm2 (Figure 1A,G), however, the rosette area of a MIM399/P- seedling was revealed to remain largely unchanged compared to that of a MIM399/P+ seedling, down by 4.2% to 19.7 mm2.
Considering that altered root architecture is a well-documented consequence of the cultivation of Arabidopsis in the absence of an adequate supply of P [5,19,59], the primary root length of PO4-starved Col-0, MIM396, MIR396, MIM399 and MIR399 seedlings was determined for comparison to the control-grown counterpart of each plant line (Figure 2C). At 47.7 and 48.8 mm, the primary root lengths of MIR396/P+ and MIM399/P+ seedlings were highly similar to the primary root length of a 15-day-old control-grown Col-0 seedling at 48.6 mm. This analysis further revealed that compared to Col-0/P+ seedlings, the primary root length of a MIM396/P+ seedling was moderately increased by 9.3% to 53.1 mm, and that the length of the primary root of MIR399/P+ seedlings was significantly decreased by 12.4% to 42.6 mm (Figure 2C).
The 7-day PO4 starvation period had a severe negative impact on primary root elongation of Col-0 seedlings with the length of the primary root of a Col-0/P- seedling significantly reduced by 47.5% to 25.5 mm. Of the four transformant lines analyzed in this study, primary root development was revealed to only be impacted to a similar degree in the miR396 overexpression line, with the length of the primary root of a MIR396/P- seedling (24.6 mm) reduced by 47.4% compared to the primary root length of a MIR396/P+ seedling (Figure 2C). In comparison, primary root elongation was impacted to a much lesser degree in the MIM396 and MIR399 transformant lines by the imposed stress. More specifically, the primary root lengths of MIM396/P- and MIR399/P- seedlings were reduced by 12.7% and 13.5%, respectively, compared to the primary root lengths of their control-grown counterparts, MIM396/P+ and MIR399/P+ seedlings (Figure 2C). In contrast to the decreased elongation of the primary root of PO4-starved Col-0, MIM396, MIR396 and MIR399 seedlings, the imposed stress had little to no effect on MIM399 primary root development with only a very mild 2.5% reduction in primary root length documented for MIM399/P- seedlings (Figure 2C), compared to MIM399/P+ seedlings.
Visual analysis of the aerial tissue phenotypes presented in Figure 1 clearly shows that the most readily apparent variation to rosette development of PO4-starved Col-0, MIM396, MIR396, MIM399 and MIR399 seedlings (Figure 1; right hand side panels), compared to the corresponding control-grown counterpart of each Arabidopsis line (Figure 1; left hand side panels), was the degree to which a dark green to brown colored pigment accumulated in rosette leaves and rosette leaf petioles of PO4-starved seedlings. This prominent darkening in pigmentation was suspected to result from the elevated accumulation of the well-documented abiotic stress associated pigment, anthocyanin [5,60,61,62]. Therefore, spectrophotometry was employed to quantify the abundance of anthocyanin in each Arabidopsis line. In the rosette leaves, rosette leaf petioles, and the shoot apex of Col-0/P+ seedlings, anthocyanin was determined to accumulate to 2.2 micrograms per gram of fresh weight (µg/g FW). In 15-day-old control-grown MIM396, MIR396, MIM399 and MIR399 seedlings, anthocyanin accumulated to a level equivalent to its abundance in the aerial tissues of Col-0/P+ seedlings (Figure 2D). Spectrophotometry next revealed that in the aerial tissues of PO4-starved Col-0 seedlings, anthocyanin accumulation was promoted by 60.3% to 3.5 µg/g FW. Anthocyanin production was also promoted, albeit to quite different degrees, in the MIM396/P-, MIR396/P-, MIR399/P- and MIR399/P- samples (Figure 2D). Namely, compared to the control-grown counterpart of each transformant line, the abundance of anthocyanin in the aerial tissues of PO4-starved MIM396, MIR396, MIR399 and MIR399 seedlings was promoted by 57.6%, 94.8%, 126.2% and 33.7%, respectively.
As the photosynthetic capabilities of a plant have been demonstrated to be inhibited by exposure to abiotic stress [63], spectrophotometry was also applied to quantify the abundance of the two primary photosynthetic pigments, chlorophyll a (Figure 2E) and chlorophyll b (Figure 2F). The chlorophyll a content of Col-0/P+ seedlings was determined to be 0.73 milligrams per gram of fresh weight (mg/g FW). Similarly, and when compared to a Col-0/P+ seedling, the chlorophyll a content of a control-grown MIR396 seedling was only mildly reduced by 4.4% to 0.70 mg/g FW. In contrast, the chlorophyll a content of MIM396/P+ and MIM399/P+ seedlings was moderately elevated by 10.0% and 8.5%, respectively, and the chlorophyll a content of the MIR399/P+ sample was significantly increased by 12.4% (Figure 2E), when compared to the Col-0/P+ sample. The 7-day exposure period to PO4 starvation was revealed to only mildly alter the chlorophyll a content of Col-0/P- (down by 4.4% to 0.70 mg/g FW), MIR396/P- (down by 3.5% to 0.67 mg/g FW) and MIR399/P- (down by 3.9% to 0.79 mg/g FW) seedlings. In addition, the chlorophyll a content of MIM399/P- seedlings, when compared to MIM399/P+ seedlings, was significantly reduced by 10.7% to 0.71 mg/g FW (Figure 2E). In contrast to the reduced abundance of chlorophyll a in the PO4-starved Col-0, MIR396, MIM399 and MIR399 samples, the already elevated chlorophyll a content of MIM396/P+ seedlings (0.80 mg/g FW), was further mildly elevated by 3.3% to 0.83 mg/FW in MIM396/P- seedlings following the stress treatment period (Figure 2E).
Chlorophyll b was determined to accumulate to a much lower level, 0.18 mg/g FW, than chlorophyll a (0.73 mg/g FW), in the aerial tissues of 15-day-old Col-0/P+ seedlings. In comparison to the value determined for control-grown Col-0 seedlings, spectrophotometry next revealed that the abundance of chlorophyll b was significantly elevated by 12.8%, 13.8% and 16.0% in the aerial tissues of the MIM396/P+, MIM399/P+ and MIR399/P+ transformant lines, respectively (Figure 2F). In contrast, the chlorophyll b content of MIR396/P+ seedlings was moderately reduced by 7.6% to 0.17 mg/g FW. Comparison of Col-0/P- seedlings, to Col-0/P+ seedlings, showed that the content of chlorophyll b was only mildly increased by 5.1% to 0.19 mg/g FW by the applied stress. The content of chlorophyll b was elevated by a similar degree in PO4-starved MIR396 seedlings, up by 6.7%, to return the abundance of chlorophyll b in the MIR396/P- sample to a level equivalent to that originally determined for the Col-0/P+ sample at 0.18 mg/g FW (Figure 2F). In contrast to the Col-0/P- and MIR396/P- samples, the chlorophyll b content remained largely unchanged in the MIM396/P- sample, compared to the MIM396/P+ sample. Furthermore, the content of this primary photosynthetic pigment was revealed by spectrophotometry to be moderately reduced by 9.4% in MIM399/P- seedlings, and mildly decreased by 5.8% in MIR399/P- seedlings, when compared to its abundance in the MIM399/P- and MIR399/P+ samples, respectively (Figure 2F).

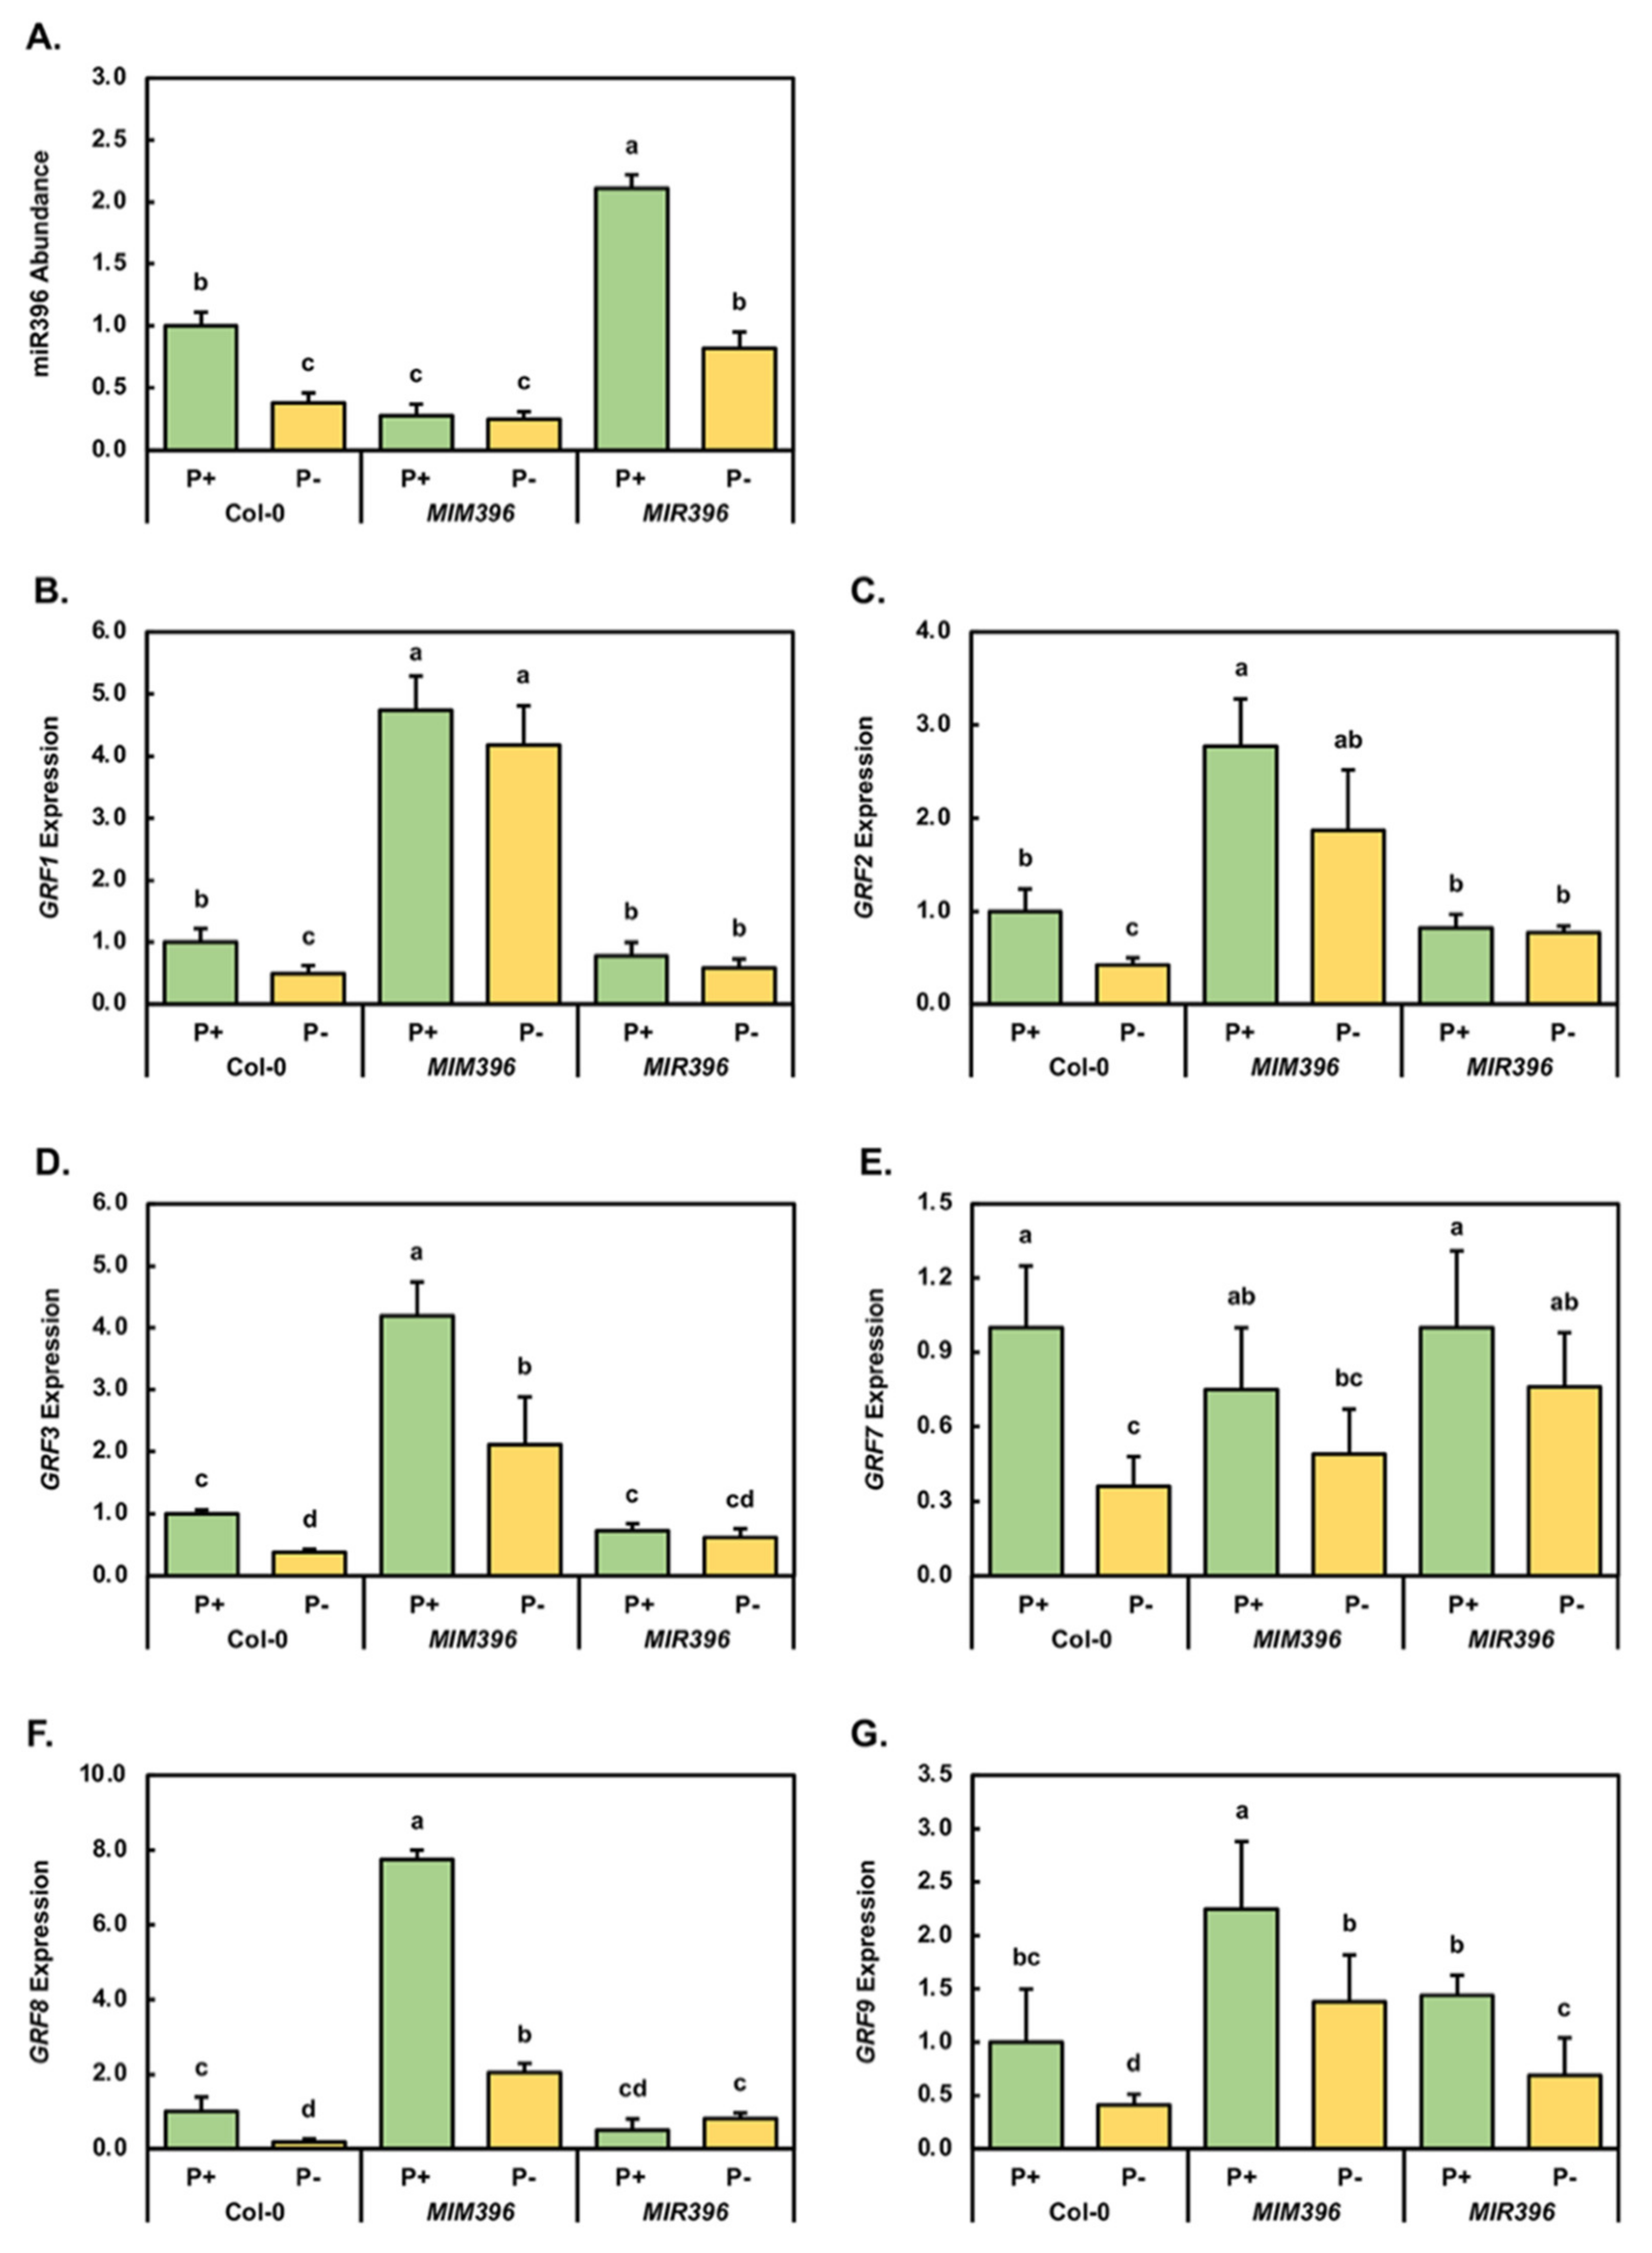
2.2. Molecular Profiling of the miR396/GRF Expression Module in Control-Grown and Phosphate-Starved Col-0, MIM396 and MIR396 Seedlings

In Arabidopsis, it is well established that the expression of six members of the plant specific GRF transcription factor gene family, including GRF1, GRF2, GRF3, GRF7, GRF8 and GRF9, are regulated at the posttranscriptional level by miR396 [38,39,40,41,42,43]. Furthermore, each of these miR396 target genes has been documented in Arabidopsis, and in other plant species, to play a role in all aspects of vegetative and reproductive development, or in the adaptive response of a plant to environmental stress [38,39,40,41,42,43,44,45,46,47,48,49,50]. Therefore, the RT-qPCR approach was employed to profile miR396 abundance and GRF target gene expression to attempt to uncover any change at the molecular level which could have potentially contributed to the unique phenotypic and/or physiological response of MIM396 and MIR396 seedlings to PO4 starvation. RT-qPCR revealed that compared to Col-0/P+ seedlings, miR396 accumulation was significantly reduced and elevated by 3.6- and 2.1-fold in MIM396/P+ and MIR396/P+ seedlings, respectively (Figure 3A). Furthermore, and in comparison to the control-grown counterpart of each plant line, PO4 starvation significantly decreased the level of the miR396 sRNA 2.6-fold in Col-0/P- and MIR396/P- seedlings, and induced a much more moderate decrease (1.1-fold) to the already significantly reduced abundance of the miR396 sRNA in MIM396/P- seedlings (Figure 3A).
In control-grown MIM396/P+ seedlings, reduced miR396 abundance was next revealed by RT-qPCR to result in the expression of the GRF1, GRF2, GRF3, GRF8 and GRF9 target genes being significantly elevated 4.7-, 2.8-, 4.2-, 7.8- and 2.3-fold, respectively (Figure 3B–D,F,G). In direct contrast, GRF7 expression was revealed to be mildly reduced by 1.3-fold in MIM396/P+ seedlings, compared to its level of expression in Col-0/P+ seedlings (Figure 3E). However, when considered together, RT-qPCR readily revealed that miRNA-directed mRNA cleavage was the predominant mode of RNA silencing directed by the miR396 sRNA in 15-day-old Arabidopsis whole seedlings to regulate the expression of its GRF target genes. In control-grown MIR396 seedlings, RT-qPCR revealed that elevated miR396 abundance (up by 2.1-fold) mildly decreased the expression level of GRF1, GRF2 and GRF3 by 1.3-, 1.2- and 1.4-fold, respectively (Figure 3B–D). In addition, the expression of GRF8 was highly reduced by 2.0-fold in response to the 2.1-fold elevated abundance of miR396 in MIR396/P+ seedlings (Figure 3A,F). In contrast to the reduced expression trend documented for the GRF1, GRF2, GRF3 and GRF8 target genes, GRF7 expression remained unchanged (Figure 3E), and the level of GRF9 expression was mildly elevated by 1.4-fold (Figure 3G) in MIR396/P+ seedlings, compared to the expression level of these two miR396 target genes in the Col-0/P+ sample.
The applied stress significantly decreased the accumulation level of miR396 by 2.6-fold in Col-0/P- seedlings, compared to its level in Col-0/P+ seedlings (Figure 3A). It was therefore surprising that reduced miR396 abundance in Col-0/P- seedlings resulted in a significant decrease in the level of expression of all six of its GRF target genes. More specifically, GRF1, GRF2, GRF3, GRF7, GRF8 and GRF9 transcript abundance was significantly reduced in Col-0/P- seedlings by 2.0-, 2.4-, 2.6-, 2.8-, 5.6- and 2.4-fold, respectively (Figure 3B–G), compared to the abundance of each transcript in Col-0/P+ seedlings. This unexpected target gene expression trend indicated that the transcriptional activity of all components of the miR396/GRF expression module were negatively influenced in 15-day-old Arabidopsis whole seedlings by the 7-day PO4 starvation treatment period.
When compared to the MIM396/P+ sample, the mild 1.1-fold decrease in miR396 abundance in MIM396/P- seedlings was revealed by RT-qPCR to (1) mildly reduce GRF1 expression by 1.1-fold (Figure 3B), (2) moderately reduce GRF2, GRF7 and GRF9 expression by 1.5-, 1.5- and 1.6-fold (Figure 3C,E,G), and (3) significantly decrease the abundance of the GRF3 and GRF8 transcripts by 2.0- and 3.8-fold (Figure 3D,F), respectively. As suggested by the expression trends noted in PO4-starved Col-0 seedlings, the global decrease in the abundance of all assessed components of the miR396/GRF expression module in PO4-starved MIM396 seedlings (Figure 3A–G) again suggested that the transcriptional activity of the entire miR396/GRF expression module is negatively impacted by this form of abiotic stress.
RT-qPCR next revealed that the significant decrease in miR396 abundance in MIR396/P- seedlings (down by 2.6-fold), compared to the MIR396/P+ sample (Figure 3A), resulted in a mild reduction in the level of expression of the GRF1 (1.3-fold), GRF2 (1.1-fold), GRF3 (1.2-fold) and GRF7 (1.3-fold) target transcripts (Figure 3B–E), and extended the expression repression (down by 2.1-fold) to GRF9 (Figure 3G). Only the GRF8 target gene showed an expected expression trend in the MIR396/P- sample with the abundance of the GRF8 target transcript moderately increased by 1.7-fold, when compared to the level of expression of GRF8 in the MIR396/P+ sample (Figure 3G). However, when taken together, the molecular profiling of the miR396/GRF expression module in Col-0, MIM396 and MIR396 plants repeatedly showed that the transcriptional activity of all components of this miRNA expression module were repressed by the 7-day PO4 starvation period.

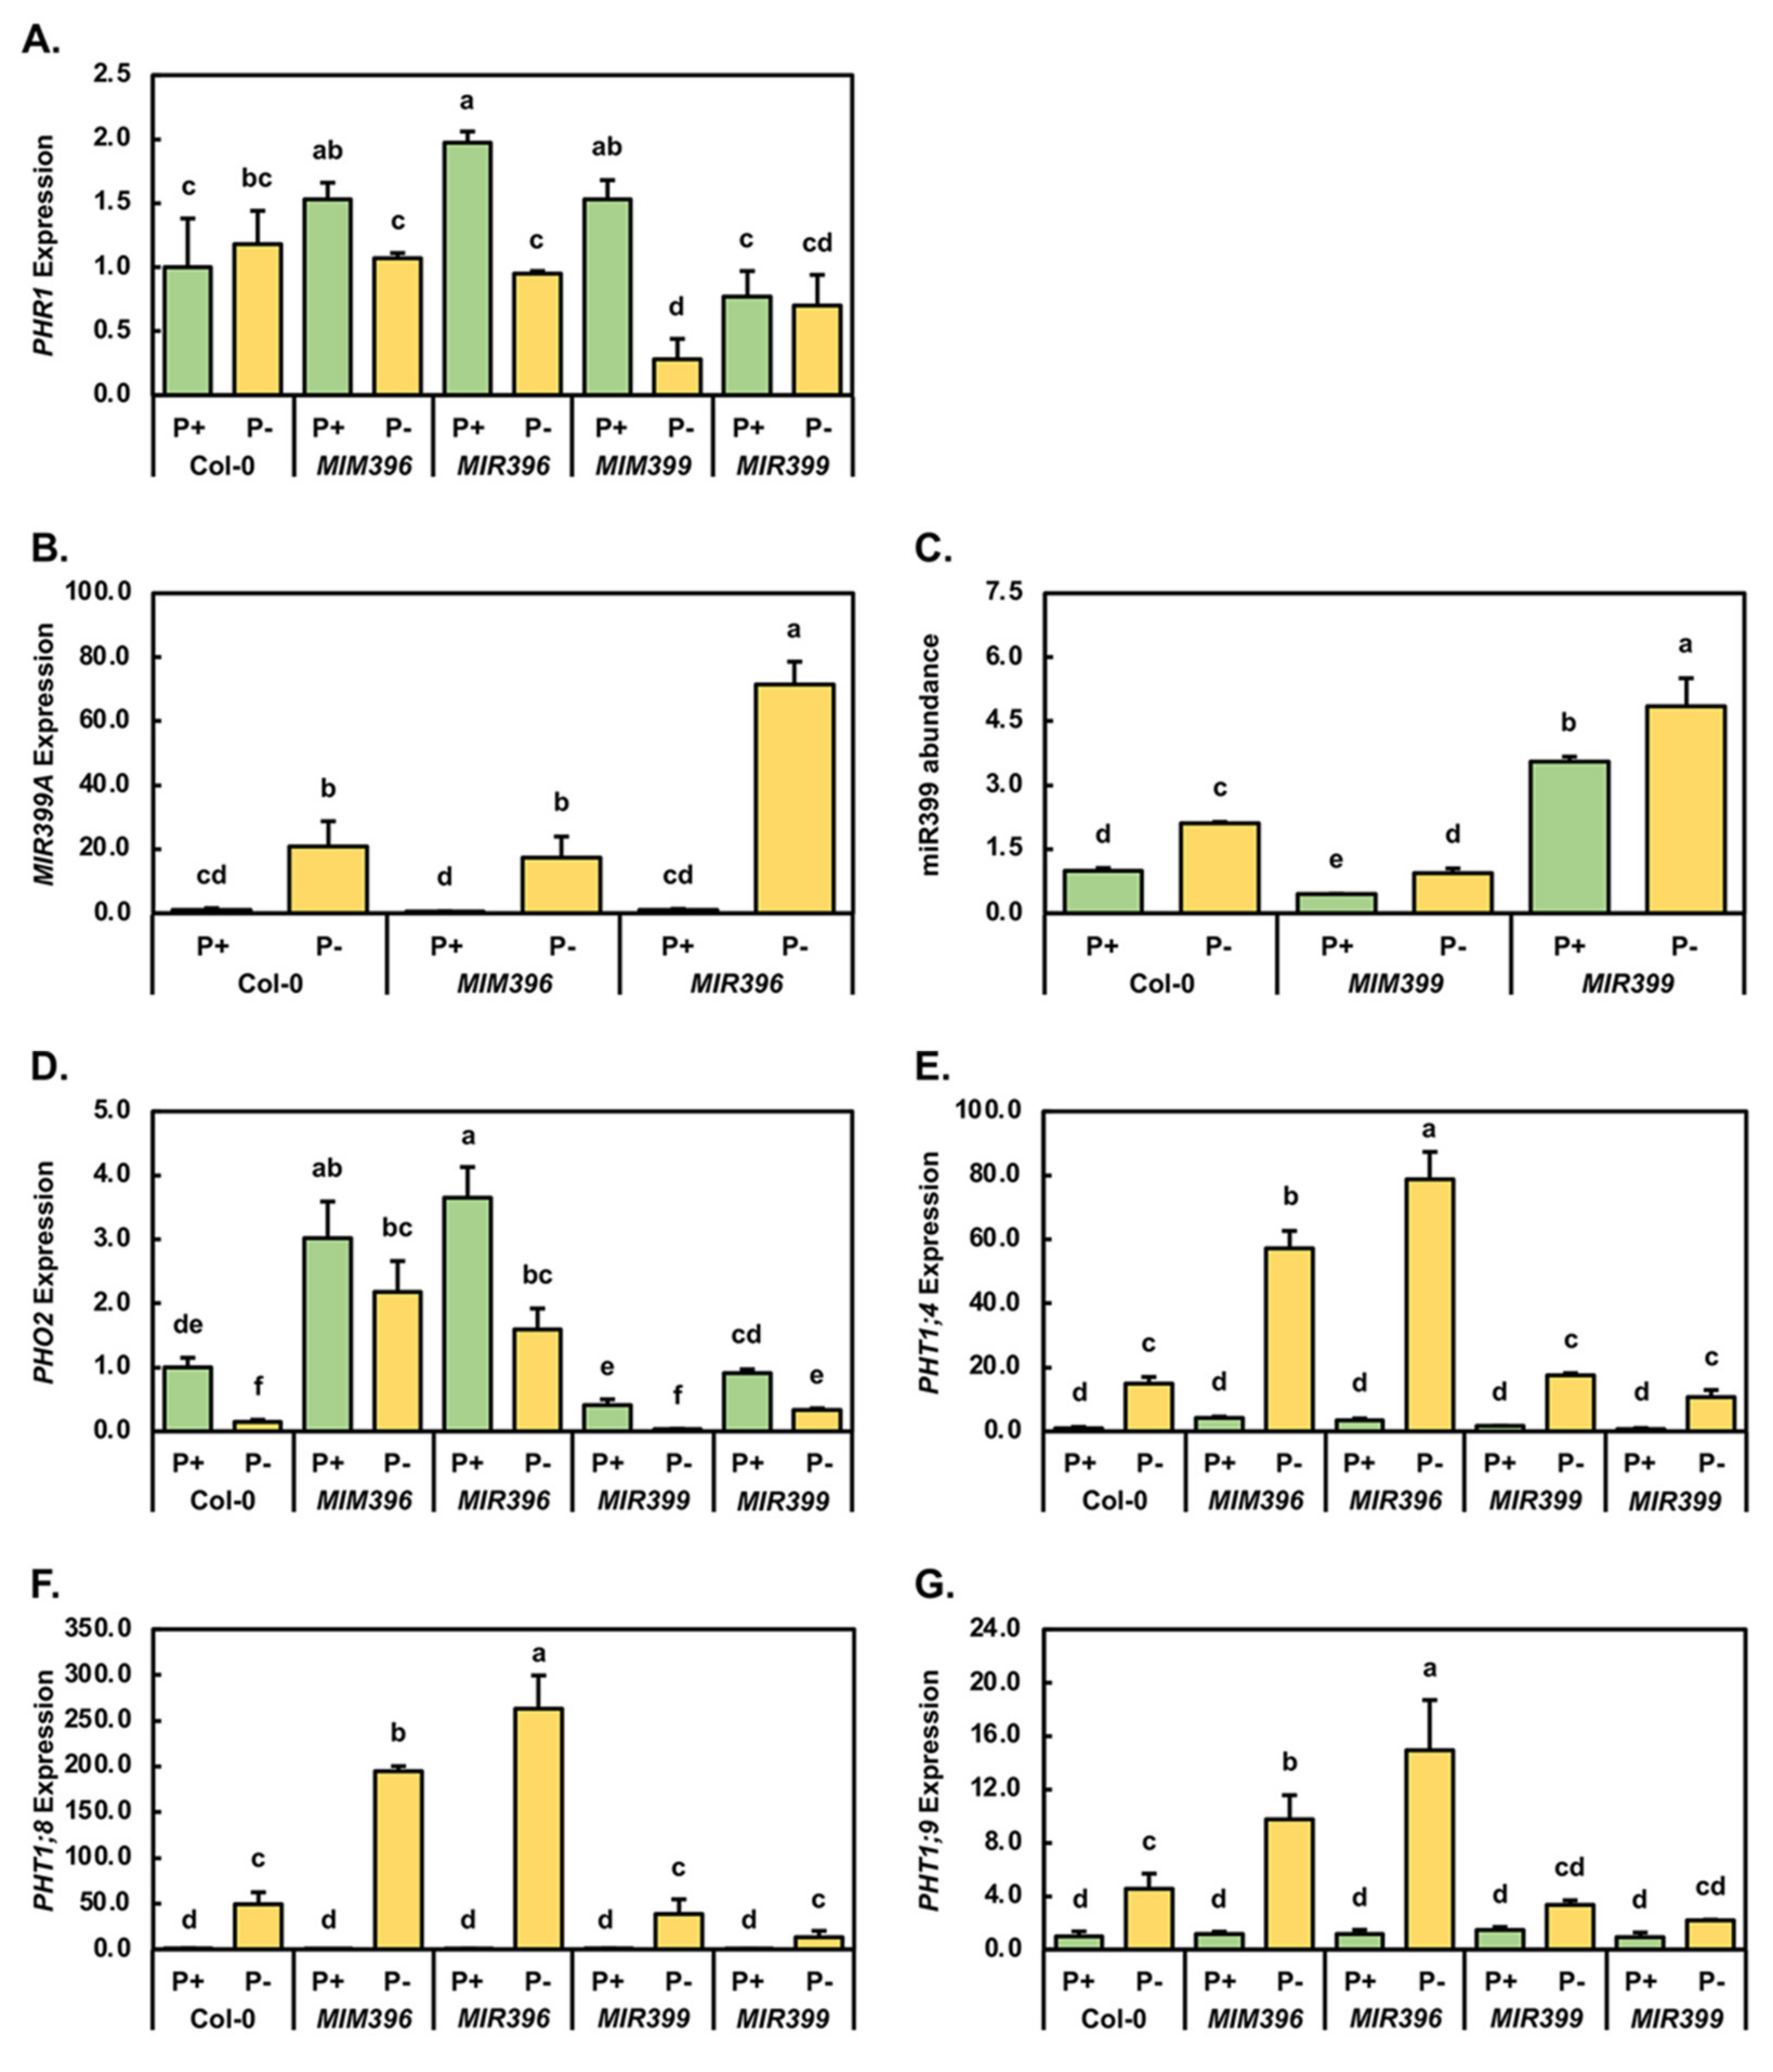
2.3. Molecular Profiling of the miR399/PHO2 Expression Module in Control-Grown and Phosphate-Starved Col-0, MIM396, MIR396, MIM399 and MIR399 Seedlings

As part of the molecular response of Arabidopsis to growth in a PO4-depleted environment, the expression of the locus which encodes transcription factor PHR1, has been demonstrated to be mildly promoted [28,31,32,33]. The level of expression of this PO4 stress-responsive transcription factor was therefore quantified by RT-qPCR in control-grown and PO4-starved Col-0, MIM396, MIR396, MIM399 and MIR399 seedlings. This expression analysis was performed to determine at which point in the PO4 starvation response pathway the miR396/GRF and miR399/PHO2 expression modules were potentially imposing their effects. Figure 4A shows that compared to the Col-0/P+ sample, PHR1 expression was moderately increased by 1.5-fold in both the miR396 and miR399 eTM (endogenous target mimic) transformant lines, and to be significantly elevated by 2.0-fold in the miR396 overexpression line following the cultivation of these four Arabidopsis lines for the entire 15-day experimental period under standard growth conditions. In contrast to elevated PHR1 expression in MIM396/P+, MIR396/P+ and MIM399/P+ seedlings, the expression of PHR1 was mildly repressed by 1.3-fold in the MIR399/P+ sample (Figure 4A). RT-qPCR next revealed that following PO4 starvation, PHR1 expression was mildly elevated by 1.3-fold in Col-0/P- seedlings. In the four assessed transformant lines, an opposing expression trend was observed. More specifically, PHR1 transcript abundance was reduced by 1.4-, 2.1-, 5.5- and 1.1-fold in MIM396/P-, MIR396/P-, MIM399/P- and MIR399/P- seedlings, respectively (Figure 4A).
The highly conserved plant miRNA, miR399, is a well-documented PO4-responsive miRNA that modulates the expression of PHO2 in response to an inadequate cellular concentration of P, with previous studies demonstrating that the miR399/PHO2 expression module plays an essential role in the uptake of Pi from the soil, as well as being required for the maintenance of P homeostasis in Arabidopsis shoot and root tissues: both essential processes needed to ensure that a plant can respond to an environment with either limited or deficient levels of P [9,19,20,26,31,34,35]. The expression of the miR399 precursor encoding locus MIR399A (Figure 4B), the abundance of the miR399 sRNA (Figure 4C), and that of its target transcript PHO2 (Figure 4D), were therefore next quantified by RT-qPCR in the MIM396, MIR396, MIM399 and MIR399 transformant lines for comparison to Col-0 seedlings.
The expression of the miR399 precursor encoding locus MIR399A (Figure 4B), the abundance of the miR399 sRNA (Figure 4C), and that of its target transcript PHO2 (Figure 4D), were therefore next quantified by RT-qPCR in the MIM396, MIR396, MIM399 and MIR399 transformant lines for comparison to Col-0 seedlings. When compared to the level of PRE-MIR399A expression in the Col-0/P+ sample, RT-qPCR revealed that the abundance of the miR399 precursor transcript, PRE-MIR399A, was significantly reduced by 2.1-fold in the MIM396/P+ sample, and remained unchanged in MIR396/P+ seedlings (Figure 4B). Figure 4B also clearly shows that the transcriptional activity of the MIR399A locus was highly induced by the 7-day PO4 starvation period, with the level of the PRE-MIR399A precursor transcript significantly elevated by 20.9-, 37.0- and 69.4-fold in Col-0/P-, MIM396/P- and MIR396/P- seedlings, respectively, when compared to the level of expression of this miR399 precursor transcript in Col-0/P+, MIM396/P+ and MIR396/P+ seedlings. RT-qPCR was next applied to quantify miR399 sRNA abundance in control-grown and PO4-starved Col-0, MIM399 and MIR399 seedlings (Figure 4C). When compared to the Col-0/P+ sample, miR399 abundance was shown to be significantly reduced by 2.2-fold in the MIM399/P+ sample, and to be significantly elevated by 3.6-fold in MIR399/P+ seedlings, respectively (Figure 4C). In PO4 starved seedlings, miR399 sRNA abundance was significantly elevated by an equivalent level, up by 2.1-fold, in the Col-0/P- and MIM399/P- samples, and to be induced by a more moderate, yet significant degree (up by 1.4-fold) in the MIR399/P- sample (Figure 4C).
Having assessed miR399 precursor transcript or sRNA abundance via RT-qPCR profiling, we next sought to determine what influence a change in the abundance of these transcripts had on the expression of the miR399 target gene, PHO2 (Figure 4D). This analysis showed that PHO2 expression was significantly elevated by 3.0- and 3.7-fold in control-grown MIM396 and MIR396 seedlings, respectively, compared to its abundance in Col-0/P+ seedlings (Figure 4D). In contrast to the PHO2 expression trend constructed for the two miR396 transformant lines, PHO2 abundance was revealed by RT-qPCR to be reduced by 2.4-fold in the MIM399/P+ sample, and to remain largely unchanged in the MIR399/P+ sample. The 7-day cultivation period on Arabidopsis growth medium which lacked PO4, repressed the degree of PHO2 gene expression in all five of the Arabidopsis lines assessed in this study. More specifically, RT-qPCR revealed that PHO2 expression was reduced by 6.7-, 1.4-, 2.3-, 13.7- and 2.8-fold in PO4-starved Col-0, MIM396, MIR396, MIM399 and MIR399 seedlings, respectively (Figure 4D).
Post documentation of the global reduction in PHO2 expression in PO4-starved Col-0, MIM396, MIR396, MIM399 and MIR399 seedlings, RT-qPCR was next employed to determine if reduced PHO2 transcript levels, and therefore reduced PHO2 protein abundance, in turn induced any change in the level of expression of the three loci known to encode the downstream targets of PHO2-mediated ubiquitination, specifically the PO4 transporter proteins PHT1;4, PHT1;8 and PHT1;9 [24,26,31,35,36,37]. Compared to its expression level in the Col-0/P+ sample, PHT1;4 transcript abundance was elevated by 4.1-, 3.5- and 1.7-fold in MIM396/P+, MIR396/P+ and MIM399/P+ seedlings, respectively. However, in the MIR399/P+ sample, PHT1;4 expression was mildly repressed by 1.2-fold (Figure 4E). When compared to the control-grown counterpart of each assessed line, PHT1;4 expression was revealed to be significantly elevated by 14.9-, 13.8-, 22.3-, 10.5- and 13.1-fold in PO4-starved Col-0, MIM396, MIR396, MIM399 and MIR399 seedlings, respectively (Figure 4E). The PO4 transporter PHT1;8 formed the second target of PHO2-mediated ubiquitination assessed at the posttranscriptional level via the RT-qPCR approach in 15-day-old control and PO4-starved Col-0, MIM396, MIR396, MIM399 and MIR399 seedlings. Compared to Col-0/P+ seedlings, PHT1;8 expression was mildly reduced in MIM396/P+, MIR396/P+ and MIR399/P+ seedlings by 1.6-, 2.1- and 1.4-fold, respectively, and in the MIM399/P+ sample, PHT1;8 transcript abundance remained at wild-type equivalent levels (Figure 4F). In striking contrast to the mild alterations to PHT1;8 expression observed in control-grown plants, the abundance of the PHT1;8 transcript was significantly elevated by 49.3-, 309.1-, 548.2-, 38.2- and 18.4-fold in PO4-starved Col-0, MIM396, MIR396, MIM399 and MIR399 seedlings, respectively (Figure 4F). RT-qPCR profiling next revealed that the transcript abundance of the PO4 transporter, PHT1;9, was mildly elevated in MIM396/P+ (1.2-fold), MIR396/P+ (1.2-fold) and MIM399/P+ (1.4-fold) seedlings, and to only be decreased in its abundance level (down by 1.4-fold) in the MIR399/P+ sample, when compared to the level of PHT1;9 expression observed in the Col-0/P+ sample (Figure 4G). As demonstrated by RT-qPCR for the PHT1;4 and PHT1;8 transcripts in 15-day-old Col-0, MIM396, MIR396, MIM399 and MIR399 seedlings post stress application, the abundance of the PHT1;9 transcript was elevated in all five assessed Arabidopsis lines. More specifically, PHT1;9 expression was determined to be significantly increased by 4.6-, 8.3- and 12.9-fold in Col-0/P-, MIM396/P- and MIR396/P- seedlings, and to be moderately elevated by 2.3- and 3.0-fold in the MIM396/P- and MIR399/P- samples, respectively (Figure 4G).

3. Discussion

Due to the major annual losses of up to 40% in total yield of the world’s most important crop species stemming from their cultivation on soils which lack an appropriate supply of P [10,11,12,13,14,15], an alternate approach is required to address limited P availability impacting global crop production to attempt to match agricultural outputs with the expanding consumer demands of an increasing world population [16,17,18]. One such approach is the generation of new crop lines that harbor molecular modifications that provide the plant with a heightened tolerance to abiotic stress. Towards this goal, here we report on the consequence of molecularly altering the abundance of the highly conserved miRNAs, miR396 and miR399, in the genetic model plant species, Arabidopsis. We have previously demonstrated that the abundance of these two miRNAs is significantly altered in Arabidopsis following the exposure of Arabidopsis seedlings to salt stress [50,53,58]. Therefore, considering the well-established requirement of the miR399/PHO2 expression module in the adaptive response of Arabidopsis to its cultivation in PO4-limited or depleted conditions [9,19,20,26,31,34,35], together with the knowledge that the miR396/GRF expression module forms part of the molecular response of Arabidopsis, and of other plant species to a vast array of abiotic stressors [38,39,40,41,42,43,44,45,46,47,48,49,50], here we exposed 8-day-old Col-0, MIM396, MIR396, MIM399 and MIR399 seedlings to a 7-day PO4 starvation period. Specifically, these two sets of transformant lines engineered to have altered miR396 and miR399 abundance, respectively, were exposed to this stress regime in parallel to each other to (1) attempt to establish the requirement of the miR396/GRF expression module in the molecular response of Arabidopsis to PO4 starvation, and to (2) compare the miR396 findings to those obtained for Arabidopsis transformant lines which harbored molecular alterations to the expression module of the well characterized PO4 stress responsive miRNA, miR399.
It was interesting to observe that when cultivated under a standard Arabidopsis growth regime for the entire experimental period, both of the eTM transformant lines displayed enhanced vegetative development (Figure 1A,C,G). More specifically, compared to 15-day-old Col-0/P+ seedlings, the fresh weight and rosette area of MIM396/P+ seedlings were significantly enhanced by 20.2% and 21.3%, respectively. Similarly, the fresh weight and rosette area of control-grown MIM399 seedlings were increased by 6.6% and 12.6%, respectively (Figure 2A,B). Enhanced vegetative development of the miR396-specific eTM transformant line most likely stemmed from reduced miR396 abundance, and therefore, deregulated GRF target gene expression, with Figure 3A showing that miR396 abundance was significantly reduced in MIM396/P+ seedlings compared to Col-0/P+ seedlings, and that the expression of its GRF1, GRF2, GRF3 and GRF9 target genes were significantly elevated (Figure 3B–D). Previous research has assigned roles in leaf growth and development in Arabidopsis, specifically the control of leaf morphology, to the GRF1, GRF2, GRF3 and GRF9 transcription factors [40,64,65,66]. Namely, GRF1, GRF2 and GRF3 have been shown to promote leaf development [40,64,65], while the GRF9 transcription factor acts as a negative regulator of leaf development [66]. Therefore, the effects of elevated GRF9 transcript abundance in control-grown MIM396 seedlings appeared to have been negated by the greater collective enhancement to the level of expression of the GRF1, GRF2 and GRF3 target genes, which in turn, promoted the vegetative development of 15-day-old MIM396/P+ seedlings. RT-qPCR also revealed that compared to the Col-0/P+ sample, the abundance of the miR399 sRNA and its PHO2 target transcript were reduced by 2.2- and 2.4-fold, (Figure 4C,D), and that the expression of the PO4 transporters, PHT1;4 and PHT1;9 were mildly elevated by 1.7- and 1.4-fold, respectively (Figure 4E,G), in the miR399-specific eTM transformant line. When these Figure 4 expression profiles are considered together with those results previously reported by others [35,37,67,68,69], the mild promotion of MIM399 vegetative development likely stemmed from reduced PHO2-directed ubiquitin-mediated repression of PHT1 transporter activity, thereby leading to the enhancement of Pi root-to-shoot translocation, where the now-abundant P was unloaded into the juvenile rosette leaves and utilized as an additional cellular resource for vegetative growth.
Compared to the developmental progression of 15-day-old control-grown Col-0 seedlings (Figure 1A), and in contrast to the two eTM transformant lines assessed in this study (Figure 1C,G), the development of the miR396 and miR399 overexpression lines when cultivated under a standard Arabidopsis growth regime was mildly inhibited (Figure 1E,I). The fresh weight and rosette area reductions recorded for the MIM396/P+ sample (Figure 2A,B), were most likely a consequence of enhanced miR396-directed repression of GRF1, GRF2 and GRF3 gene expression. More specifically, an elevated miR396 level in the MIR396/P+ sample resulted in mild reductions to the abundance of the GRF1, GRF2 and GRF3 transcripts (Figure 3A–D). In Arabidopsis, these three GRF transcription factors have been shown to act as positive regulators of leaf development [40,64,65,66]. Therefore, the RT-qPCR documented 1.3-, 1.2- and 1.4-fold reduction in the expression level of GRF1, GRF2 and GRF3, in response to the 2.1-fold elevation in miR396 abundance could, in part, account for the mildly reduced progression of the vegetative development of MIR396/P+ seedlings (Figure 1E). Further, our demonstration that the expression of the negative leaf development regulator, GRF9, was mildly elevated by 1.4-fold in control-grown MIR396 seedlings in response to an increased abundance of the miR396 sRNA, adds further weight to the proposal that the specific molecular modifications made to the miR396/GRF expression module as part of this study, modifications which were demonstrated to alter GRF target gene expression, were likely the direct cause of the developmental trajectory change observed for MIM396/P+ seedlings.
The repressed developmental progression of MIR399/P+ seedlings, compared to Col-0/P+ seedling development (Figure 1A), is clearly shown in Figure 1I, and further confirmed via quantification of the phenotypic metrics, fresh weight (Figure 2A) and rosette area (Figure 2B). Molecular profiling of miR399 abundance, the expression of the miR399 target gene, PHO2, and the expression of the targets of PHO2-directed ubiquitination, PHT1;4, PHT1;8 and PHT1;9, readily revealed the cause of the repression of the vegetative development of MIR399 seedlings. Namely, in response to the 3.6-fold elevation of miR399 accumulation (Figure 4C), PHO2 transcript abundance was mildly repressed by 1.1-fold (Figure 4D), as was the expression of the PO4 transporters, PHT1;4 (down 1.2-fold), PHT1;8 (down 1.4-fold) and PHT1;9 (down 1.4-fold) (Figure 4E–G). PHT1 PO4 transporter proteins are required for Pi acquisition from the soil and the subsequent translocation of Pi from the roots to the shoot tissues via the xylem [37,67,69]. Further, once the translocated Pi is unloaded from the xylem into photosynthetically active leaves, the P is either directly utilized by the source tissue or, alternatively, is loaded into the phloem for distribution to other non-photosynthetically active shoot organs such as juvenile leaves and the reproductive tissues [67,68,69]. Therefore, reduced PHT1 gene expression, which would result in repressed PHT1 PO4 transporter activity in the miR399 overexpression line, would likely reduce the availability of P in the aerial tissues of this transformant line, leading to the observed repression to the vegetative development of MIR399/P+ seedlings.
Comparison of the phenotypes displayed by 15-day-old control-grown and PO4-starved Col-0, MIM396, MIR396, MIM399 and MIR399 seedlings (Figure 1), when taken together with the quantified phenotypic metrics of fresh weight (Figure 2A), rosette area (Figure 2B), and primary root length (Figure 2C), clearly revealed Col-0 seedlings to be the most sensitive to the applied stress, and the MIM399 transformant line to be the least sensitive to cultivation for a 7-day period on Arabidopsis growth medium which lacked PO4. More specifically, the fresh weight, rosette area and primary root length of Col-0/P- seedlings were reduced by 32.1%, 41.6% and 47.5%, respectively, when compared to the corresponding phenotypic metrics of Col-0/P+ seedlings (Figure 2A–C). In contrast, the fresh weight, rosette area and primary root length of MIM399/P- seedlings only showed mild reductions of 11.6%, 4.2% and 2.5%, respectively, compared to the corresponding phenotypic metrics of the MIM399/P+ sample (Figure 2A–C). The expression of the PO4 stress responsive transcription factor, PHR1 [31,32,33], was revealed by RT-qPCR to be mildly elevated by 1.2-fold in Col-0/P- seedlings, and to be significantly reduced by 5.5-fold in MIM399/P- seedlings, compared to its level of expression in the control-grown counterpart of these two Arabidopsis lines (Figure 4A). Interestingly, although PHR1 was revealed to have an opposing expression trend in Col-0 and MIM399 seedlings post application of the stress treatment regime, miR399 abundance was elevated by the same degree, up by 2.1-fold, in these two Arabidopsis lines. This finding strongly suggests that the PHR1 transcription factor exerts little to no regulatory influence on the transcriptional activity of the miR399 encoding loci, MIR399A to MIR399F, in Arabidopsis seedlings at 15-days of age in response to PO4 starvation. Although miR399 abundance was increased in Col-0/P- and MIM399/P- seedlings by the same degree, it is important to note that comparison of the relative expression level of the miR399 sRNA in these two PO4-starved plant lines revealed that the level of miR399 was at a 2.4-fold lower abundance in the MIM399/P- sample (RE = 0.94 ± 0.11) than in the Col-0/P- sample (RE = 2.11 ± 0.03) (Figure 4C). Accordingly, PHO2 expression was found to be decreased by 6.7- and 13.7-fold in the Col-0/P- and MIM399/P- samples, respectively (Figure 4D), in response to elevated miR399 abundance (Figure 4C). Again, however, direct comparison of the level of relative expression of PHO2 further revealed that the abundance of the PHO2 transcript was 5.0-fold lower in the MIM399/P- sample (RE = 0.03 ± 0.01) than it was in the Col-0/P- sample (RE = 0.15 ± 0.03). Direct comparison of miR399 and PHO2 transcript abundance in PO4-starved Col-0 and MIM399 plants (Figure 4C,D), implied that the degree of release of PHO2-mediated posttranslational regulation of the activity of the PHT1 PO4 transporter proteins would be far greater in MIM399/P- seedlings than in the Col-0/P- sample.
The level of expression of the three loci that encode the PO4 transporter targets of PHO2-directed ubiquitination, namely PHT1;4, PHT1;8 and PHT1;9, was therefore subsequently assessed via RT-qPCR and revealed that the expression was higher for all three PO4 transporters in Col-0/P- seedlings than it was in MIM399/P- seedlings (Figure 4E–G), even though PHO2 expression was demonstrated to be lower in PO4-starved MIM399 seedlings than in Col-0/P- seedlings (Figure 4D). If enhanced P translocation from the roots to the aerial tissues to be used as an additional cellular resource was providing the miR399-specific eTM transformant line with the observed degree of tolerance to growth in a PO4 deplete environment, the RT-qPCR analyses conducted in this study failed to uncover such a direct causative link (Figure 4). Considering that PHT1;4, PHT1;8 and PHT1;9 form targets of PHO2-mediated ubiquitination at the posttranslational level [37,67,68,69], the Figure 4 findings indicate that additional analyses at the protein level are required to definitively identify the molecular mechanism that rendered Col-0 plants the most sensitive to the imposed stress, and the MIM399 transformant line the most tolerant to growth in a PO4-deficient environment. Alternatively, a recent study by Shukla et al. [70] demonstrated that the exogenous application of mild doses of P (i.e., 1.25 to 10.00 mM) promoted Arabidopsis seedlings to develop rosettes of significantly larger size. Therefore, a future avenue of research would be to repeat these analyses [70] on Col-0 and MIM399 seedlings to determine the degree to which the P response pathway is defective in the MIM399 transformant line that harbors a molecularly modified miR399/PHO2 expression module.
Further evidence which suggested that the promoted vegetative development of the MIM399 transformant line was masking the actual degree to which the P response pathway was defective in the miR399-specific eTM plant line was the demonstration that the well-characterized stress pigment, anthocyanin [5,60,61,62], accumulated to a much higher level in 15-day-old PO4-starved MIM399 seedlings than it did in either Col-0/P-, MIM396/P-, MIR396/P- or MIR399/P- seedlings (Figure 1). More specifically, comparison of the quantified abundance of anthocyanin in PO4-starved Col-0, MIM396, MIR396, MIM399 and MIR399 seedlings, to the control-grown counterpart of each Arabidopsis line (Figure 2D), revealed anthocyanin accumulation to be promoted by 60.3%, 57.6%, 94.8%, 126.2% and 33.7%, respectively. This finding directly opposes the phenotypic data presented in Figure 2A–C to suggest that the molecular modifications made to the miR399/PHO2 expression module in the MIM399 transformant line; that is, eTM transgene-directed repression of miR399 accumulation had indeed altered the ability of MIM399 seedlings to appropriately respond to growth in a PO4-deficient environment. This quantitative analysis also revealed that the accumulation of anthocyanin was promoted to the lowest degree in MIR399 seedlings post application of the 7-day stress treatment regime. In Arabidopsis, P stress induces the gibberellin-DELLA pathway which in turn promotes the anthocyanin biosynthesis pathway [71]. Therefore, the contrast of the level to which anthocyanin accumulated in MIM399/P- and MIR399/P- seedlings tentatively suggests that any molecular modification introduced into Arabidopsis which alters miR399 abundance, and therefore PHO2 target gene expression, interferes with the ability of Arabidopsis to appropriately respond to growth in a PO4-deficient environment.
The physiological assessments performed here also revealed another interesting result: the abundance of the two primary photosynthetic pigments, chlorophyll a and b, were significantly elevated by 12.4% and 16.0% in MIR399/P+ seedlings, respectively (Figure 2E,F), compared to their abundance in Col-0/P+ seedlings. An elevated chlorophyll content in 15-day-old MIR399/P+ seedlings formed a highly curious result considering that we [53] and others [19,23,35] have previously demonstrated that the overexpression of miR399, or conversely, the efficient repression of PHO2 expression (i.e., the pho2 mutant), is highly detrimental to the later stages of vegetative development of the Arabidopsis lines that harbor such modifications. Perturbed vegetative development in these lines is the result of the over-accumulation of P in the aerial tissues, leading to an overall reduction in rosette area and the development of areas of chlorosis and necrosis in mature rosette leaves [19,23,35,53]. Although chlorophyll a and b content were elevated to their highest levels in MIR399/P+ seedlings, when all five assessed Arabidopsis lines were cultivated under a standard Arabidopsis regime for the entire 15-day experimental period, the vegetative development of this transformant line was also repressed to the greatest extent (Figure 1 and Figure 2A–C). The molecular profiling of PO4 transporter expression in MIM396/P+, MIR396/P+, MIM399/P+ and MIR399/P+ seedlings for comparison to control-grown Col-0 seedlings (Figure 4E–G), revealed that PHT1;4 and PHT1;9 expression was only reduced in the MIR399/P+ sample (Figure 4E,G). Considering that the PHT1;4 and PHT1;9 PO4 transporters play a central role in P acquisition from the soil, and its subsequent translocation from the roots to the shoots via the xylem [37,67,68,69], reduced PHT1;4 and PHT1;9 expression would potentially limit the amount of P available for routine molecular functions to continue normally in the cells of MIR399/P+ rosette leaves. Therefore, the observed enhancement to the abundance of chlorophyll a and b in MIM399/P+ seedlings may be the result of a physiological response to combat any adverse effects stemming from a possible reduction in the content of available P in MIM399/P+ rosette leaves.
One of the most striking findings stemming from this study was the global repression of all assessed components of the miR396/GRF expression module following the cultivation of 8-day-old Col-0 seedlings for a 7-day period on Arabidopsis growth medium which lacked PO4 (Figure 3). More specifically, compared to Col-0/P+ seedlings, the abundance of miR396, and the expression of its six GRF target genes, including GRF1, GRF2, GRF3, GRF7, GRF8 and GRF9, were all demonstrated to be significantly reduced in Col-0/P- seedlings (Figure 3). As stated above, the GRF1, GRF2 and GRF3 transcription factors all play a positive regulatory role in Arabidopsis leaf development [40,64,65,66]. Therefore, reduced GRF1, GRF2 and GRF3 expression in Col-0/P- seedlings (Figure 3B–D) formed an expected result considering the severe impact to the vegetative development of 15-day-old Col-0 seedlings following the application of the 7-day stress treatment regime (Figure 1 and Figure 2). Furthermore, reduced GRF1, GRF2 and GRF3 expression, would most likely have also masked any positive influence on rosette leave development stemming from decreased GRF9 transcript abundance (Figure 3G), with GRF9 previously assigned a negative regulatory role in Arabidopsis leaf development [66]. Decreased GRF7 expression in Col-0/P- seedlings also formed an expected result, with previous research performed on the Arabidopsis grf7 single mutant associating defective GRF7 transcription factor activity with a heighten tolerance to a range of abiotic stresses [46]. The authors proposed that the abiotic stress tolerance displayed by the grf7 single mutant was likely to be the result of the elevated expression of a large and functionally diverse cohort of stress-responsive genes [46]. In addition to PO4-starved Col-0 seedlings, GRF7 transcript abundance was also reduced in the MIM396/P- and MIR396/P- samples; a finding that further supports the requirement of repressed GRF7 gene expression as part of the molecular response of Arabidopsis to P stress, as has been shown previously for other abiotic stressors such as drought and salt stress [46]. The expression of the sixth miR396 target gene profiled in this study, GRF8, was also reduced in Col-0/P- seedlings (Figure 3F). However, to date, a functional role in either Arabidopsis development, or the response of Arabidopsis to other forms of abiotic or biotic stress, has not been assigned to the GRF8 transcription factor. It is important to note here, that of the six miR396 target genes profiled in Col-0/P- seedlings, the expression of GRF8 was repressed by the greatest degree, a 5.6-fold reduction in transcript abundance (Figure 3F). This finding strongly implies that repressed GRF8 gene expression, in parallel to reduced GRF1, GRF2, GRF3, GRF7 and GRF9 transcript abundance, forms an important part of the molecular response of Arabidopsis to PO4 starvation during the seedling stage of vegetative development. It is important to note here that we have previously profiled all components of the miR396/GRF expression module in 15-day-old Col-0 seedlings post their 7-day exposure to two other forms of abiotic stress, specifically cadmium (Cd) and salt stress [58,72]. Exposure of 15-day-old Col-0 seedlings to either elevated levels of Cd or NaCl, revealed unique expression changes for each component of the miR396 expression module, including decreased, unchanged, or elevated miR396 accumulation or GRF target gene expression [58,72]. Transcript-specific expression alterations under conditions of elevated Cd or NaCl [58,72], versus the uniform decrease in the transcriptional activity of all components of the miR396/GRF expression module post PO4 starvation (Figure 3), strongly implies the absolute requirement of repressed expression module transcriptional activity for Arabidopsis to mount a molecular, and potentially adaptive response, to PO4 starvation.

4. Materials and Methods

4.1. Plant Expression Vector Construction and Transformant Line Generation

The construction of the plant expression vectors used to transform wild-type Arabidopsis plants (ecotype Columbia-0 (Col-0)) for the generation of the four transformant lines analyzed in this study has been described in detail previously [53,58]. In brief, the plant expression vectors, pAtMIM396, pAtMIR396, pAtMIM399 and pAtMIR399, were produced via the placement of artificially synthesized (Integrated DNA Technologies, Sydeny, Australia) DNA fragments behind the Cauliflower mosaic virus (CaMV) 35S promoter of the pBART plant expression vector. More specifically, for the construction of the pAtMIM396 target mimicry transgene, the endogenous non-cleavable miR399 target site of the Arabidopsis non-protein-coding RNA, INDUCED BY PHOSPHATE STARVATION1 (IPS1; AT3G09922), was replaced with a miR396a-specific non-cleavable target site according to the design method outlined in [73,74]. For the miR399-specific eTM transgene, the IPS1 sequence was artificially synthesized without any requirement for further design modification. To generate the miR396 and miR399 overexpression transgenes, pAtMIR396 and pAtMIR399 respectively, DNA fragments were artificially synthesized to exactly match the non-protein-coding RNA sequences of the Arabidopsis miRNA precursor transcripts, PRE-MIR396A (AT2G10606) and PRE-MIR399C (AT5G62162).
Post their generation, the resulting pAtMIM396, pAtMIR396, pAtMIM399 and pAtMIR399 plant expression vectors were subsequently introduced into Agrobacterium tumefaciens (Agrobacterium) strain GV3101 and these Agrobacterium cultures were used to transform wild-type Arabidopsis plants according to the protocol of [75]. In the T2 generation of transformants, the (1) transgene copy number, and the (2) zygosity of each transformant was determined via a standard PCR-based genotyping approach. Of the T2 transformants determined to be homozygous for a single chromosome insertion event, the ‘best performing’ transformant line was selected to represent the MIM396, MIR396, MIM399 and MIR399 transformant populations for subsequent phenotypic, physiological and molecular analyses, with all experimentation reported here conducted on the T3 transformant generation. It is important to note here that the best performing MIM396, MIR396, MIM399 and MIR399 transformant line was selected via RT-qPCR analysis of miRNA abundance in the T2 generation, that is; identification of the (1) MIM396 and MIM399 transformant lines with the greatest degree of reduced miR396 and miR399 abundance, and (2) MIR396 and MIR399 transformant lines with the highest degree of elevated miR396 and miR399 abundance.

4.2. Plant Material and Plant Growth

The seeds sourced from Col-0, MIM396, MIR396, MIM399 and MIR399 plants were surface sterilized via incubation in a sealed chamber for 90 min (min) at room temperature with chlorine gas. The sterilized seeds were plated out onto standard Arabidopsis growth medium (half-strength Murashige and Skoog (MS) salts), and post sealing each plate with gas permeable tape, the plates were transferred to 4 °C and incubated in the dark for 48 h for stratification. Post stratification, the plates were transferred to a temperature-controlled growth cabinet (A1000 Growth Chamber, Conviron®, Melbourne, Australia) and cultivated for an 8-day period under a standard Arabidopsis growth regime of 16 h light/8 h dark, and a day/night temperature of 22/18 °C. At 8 days of age, an equal number (n = 48) of Col-0, MIM396, MIR396, MIM399 and MIR399 seedlings were transferred to either (1) fresh standard Arabidopsis growth medium (P+ plants; control treatment), or (2) Arabidopsis growth medium where the PO4 had been replaced with an equivalent molar amount (1.0 millimolar (mM)) of potassium chloride (KCl) (P- plants; PO4 starvation treatment). Post seedling transfer, the control and PO4 starvation plates were sealed with gas permeable tape and returned to the temperature-controlled growth cabinet. The control and PO4 starved Col-0, MIM396, MIR396, MIM399 and MIR399 seedlings were then cultivated for an additional 7-day period under a standard Arabidopsis growth regime.

4.3. Phenotypic and Physiological Assessment of 15-Day-Old Control-Grown and PO4-Starved Col-0, MIM396, MIR396, MIM399 and MIR399 Seedlings

To allow for the direct comparison of the MIM396, MIR396, MIM399 and MIR399 transformant lines to 15-day-old Col-0 seedlings, each performed phenotypic and physiological assessment was converted to a percentage. Taking this approach, control-grown Col-0 seedlings were assigned a value of 100% for each assessed metric. Rosette area (millimeters squared (mm2)) was calculated via the analysis of photographic images of control-grown and PO4-starved Col-0, MIM396, MIR396, MIM399 and MIR399 seedlings grown on media plates which were orientated horizontally for the entire 15-day experimental period with the freely available software, ImageJ. Similarly, primary root length (millimeters (mm)) was determined via ImageJ analysis of photographic images of control-grown and PO4-starved 15-day-old Col-0, MIM396, MIR396, MIM399 and MIR399 seedlings which were grown on vertically orientated plates for the 7-day treatment period post the transfer of 8-day-old seedlings to fresh Arabidopsis growth medium. The fresh weight of 15-day-old control-grown or PO4-starved Col-0, MIM396, MIR396, MIM399 and MIR399 seedlings was determined via the transfer of 12 pooled seedlings of each assessed plant line into pre-weighed 1.5 mL microfuge tubes. Each sample tube was immediately capped post seedling transfer and then the weight of the sample tube was recalculated. The initial weight was then subtracted from the final weight of each 1.5 mL microfuge tube, and this value was subsequently divided by 12 to give the average fresh weights of 15-day-old control-grown or PO4-starved Col-0, MIM396, MIR396, MIM399 and MIR399 seedlings. This procedure was repeated four times for each plant line, and growth condition, and post calculation of the final weight of each tube, the tubes were immediately submerged in liquid nitrogen (LN2) followed by storage at −80 °C for future use as the four biological replicates for the RT-qPCR analyses reported here in Figure 3 and Figure 4.
The physiological parameters of anthocyanin abundance and chlorophyll a and b content were also calculated for the MIM396, MIR396, MIM399 and MIR399 transformant lines for their direct comparison to 15-day-old control-grown Col-0 seedlings. To determine the anthocyanin abundance of each Arabidopsis line, 100 mg of freshly harvested rosette leaves were ground into a fine powder in LN2. Once the powder had completely thawed, 1.0 milliliter (mL) of acidic methanol (1.0% (v/v) of 12 N hydrogen chloride (HCl)) was added to each sample. The samples were briefly vortexed to thoroughly mix the ground plant material into solution, and then incubated at 4 °C for 2 h. Any remaining cellular debris was pelleted out of solution via centrifugation at 15,000 × g for 5 min at room temperature. The absorbance (A) at 530 (A530) and 657 (A657) nanometers (nm) of each sample was then measured in a GENESYS 10S spectrophotometer (ThermoFisher Scientific, Brisbane, Australia) with acidic methanol used as the blanking solution. The abundance of anthocyanin in each sample, in units of milligrams per gram of fresh weight (mg/g FW), was calculated using the equation; A530 − 0.25 × A657/fresh weight (g), according to [76]. To determine the chlorophyll a and b content of control-grown and PO4-starved Col-0, MIM396, MIR396, MIM399 and MIR399 seedlings, 100 mg of freshly harvested rosette leaves was ground into a fine powder in LN2. To this powder, 1.0 mL of 80% (v/v) ice-cold acetone was added and each sample was thoroughly mixed by careful hand inversion. The samples were then incubated in the dark for 24 h at room temperature. Following this incubation period, any cellular debris that remained in solution was removed via centrifugation at 15,000 × g for 5 min at room temperature. The A at wavelengths 646 (A646) and 663 (A663) nm was then determined in a GENESYS 10S spectrophotometer with the resuspension agent, 80% (v/v) acetone, used as the blanking solution. The chlorophyll a and b content (micrograms per gram of fresh weight (μg/g FW)) of each sample was then determined using the Lichtenthaler’s equations exactly as outlined in [77].

4.4. RT-qPCR Assessment of miRNA Abundance and Target Gene Expression in 15-Day-Old Control-Grown and PO4-Starved Col-0, MIM396, MIR396, MIM399 and MIR399 Seedlings

To extract total RNA from control-grown and PO4-starved 15-day-old Col-0, MIM396, MIR396, MIM399 and MIR399 seedlings, TRIzol™ Reagent was used according to the manufacturer’s (Invitrogen™, Brisbane, Australia) protocol. A NanoDrop® spectrophotometer (NanoDrop® ND-1000, ThermoFisher Scientific, Brisbane Australia) was used to determine the concentration of each sample and the quality of each total RNA extraction was ensured via the use of a standard electrophoresis approach on a 1.2% (w/v) ethidium bromide-stained agarose gel. Four biological replicates consisting of pools of 12, 15-day-old control-grown and PO4-starved Col-0, MIM396, MIR396, MIM399 and MIR399 seedlings were subsequently used as templates to synthesize complementary DNA (cDNA). The synthesis of a cDNA product specific to either the miR396 or miR399 sRNA was conducted as previously reported in [50] using a protocol adapted from [78], and a corresponding high molecular weight (HMW) cDNA library was synthesized from the same set of samples as previously described in [79,80]. All RT-qPCR assessments of miRNA abundance or mRNA expression were conducted using the cycling conditions; (1) 1 × 95 °C for 10 min, and (2) 45 × 95 °C for 10 s and 60 °C for 15 s. In addition, the GoTaq® qPCR Master Mix (Promega, Sydney, Australia) was used as the fluorescent reagent for all performed RT-qPCR experiments. Following the RT-qPCR assessments, miRNA abundance or mRNA expression was quantified using the 2−ΔΔCT method. The small nucleolar RNA, snoR101, and the housekeeping gene, UBIQUITIN10 (UBI10; AT4G05320), were used to normalize miRNA abundance and mRNA expression, respectively, in control-grown or PO4-starved MIM396, MIR396, MIM399 and MIR399 transformants, for comparison to the Col-0/P+ sample. Supplementary Table S1 lists the sequence of each DNA oligonucleotide used in the RT-qPCR analyses reported in this study.

4.5. Statistical Analysis

As stated above, the phenotypic, physiological, and molecular data reported in this study were obtained from the analysis of four biological replicates with each biological replicate consisting of 12 pooled seedlings. Statistical analysis was performed using the one-way analysis of variance (ANOVA; RRID:SCR_002427) method while the Tukey’s post hoc test was performed using the SPSS program (IBM, Armonk, United States; RRID: SCR_002865). The results of the statistical analyses are presented as letters above the columns on the relevant histograms in Figure 2, Figure 3 and Figure 4. The same letter above a histogram column indicates a non-statistically significant difference (p > 0.05), whereas a different letter above a histogram column indicates a statistically significant difference (p < 0.05).

5. Conclusions

Considering that the molecular and metabolic processes of nucleic acid synthesis, phospholipid production, coenzyme activation and the generation of the vast volume of chemical energy required to drive these processes all rely on an adequate supply of the essential macronutrient, phosphorous (P), an alternate approach to develop new plant lines with a decreased reliance upon P is of extreme importance if agriculture is to continue to achieve the outputs required by an ever increasing population under less favorable environmental conditions in the future. One such approach is the use of molecular technologies to alter key steps in nutrient response pathways. At the posttranscriptional level, the highly conserved plant miRNAs, miR396 and miR399, have been repeatedly demonstrated to mediate central roles as part of the molecular response of a diverse range of evolutionarily diverse plant species to an array of environmental stressors. Here we demonstrate that Arabidopsis transformant lines molecularly modified to harbor alterations to the miR396 and miR399 expression modules are less sensitive to growth in a PO4 deficient environment than were unmodified wild-type Arabidopsis plants at the seedling stage of vegetative development. The global reduction in all assessed transcript components of the miR396/GRF expression module identified a previously unreported requirement for this miRNA, and potentially, all six of its GRF target genes as part of the molecular response of Arabidopsis to PO4 starvation. We also confirm that Arabidopsis transformant lines with a molecularly altered miR399/PHO2 expression module are more resistant to cultivation in a growth environment lacking PO4. More specifically, RT-qPCR suggested that the PO4 stress tolerance afforded to the Arabidopsis miR399 transformant lines was likely the result of decreased PHO2 transcript abundance, and therefore, defective PHO2-mediated ubiquitination of the PO4 transporters, PHT1;4, PHT1;8 and PHT1;9. In turn, enhanced activity of these three PO4 transporters would promote root-to-shoot P translocation, and subsequently; an elevated level of available P in Arabidopsis aerial tissues would enable enhanced cellular function. When taken together, the results presented in this study represent an early, yet important step in the use of molecular technologies to develop new Arabidopsis lines that are tolerant to growth in an environment where P is either in limited supply or is completely lacking. Furthermore, due to the high level of conservation of the miR396 and miR399 expression modules in plants, future advances made in Arabidopsis hold a degree of promise for their translation into agronomically important crop species as part of the development of new plant lines that can be cultivated in an environment that lacks an adequate supply of P.

Supplementary Materials

The following are available online at https://www.mdpi.com/article/10.3390/plants10122570/s1, Table S1: DNA sequence of the oligonucleotides used in the study for cDNA synthesis or RT-qPCR analysis.

Author Contributions

Conceptualization, J.L.P., C.P.L.G. and A.L.E.; methodology, J.L.P. and J.M.J.O.; formal analysis, J.L.P., D.Q.N. and J.M.J.O.; investigation, J.L.P. and J.M.J.O.; resources, C.P.L.G., J.L.P. and A.L.E.; writing—original draft preparation, J.L.P., C.P.L.G. and A.L.E.; writing—review and editing, J.L.P., D.Q.N., J.M.J.O., C.P.L.G. and A.L.E.; supervision, C.P.L.G. and A.L.E. All authors have read and agreed to the published version of the manuscript.

Funding

This research received no external funding.

Institutional Review Board Statement

Not applicable.

Informed Consent Statement

Not applicable.

Data Availability Statement

Available upon request to the authors. This includes the seeds from the generated MIM396, MIR396, MIM399 and MIR399 transformant lines.

Acknowledgments

The authors would like to thank fellow members of the Centre for Plant Science for their guidance with plant growth care and RT-qPCR experiments.

Conflicts of Interest

The authors declare no conflict of interest.

References

  1. Vance, C.P. Symbiotic nitrogen fixation and phosphorus acquisition. Plant nutrition in a world of declining renewable resources. Plant Physiol. 2001, 127, 390–397. [Google Scholar] [CrossRef] [PubMed]
  2. Raghothama, K.G. Phosphate transport and signaling. Curr. Opin. Plant Biol. 2000, 3, 182–187. [Google Scholar] [CrossRef]
  3. Rouached, H.; Arpat, A.B.; Poirier, Y. Regulation of phosphate starvation responses in plants: Signaling players and cross-talks. Mol. Plant 2010, 3, 288–299. [Google Scholar] [CrossRef]
  4. Wu, P.; Shou, H.; Xu, G.; Lian, X. Improvement of phosphorus efficiency in rice on the basis of understanding phosphate signaling and homeostasis. Curr. Opin. Plant Biol. 2013, 16, 205–212. [Google Scholar] [CrossRef] [PubMed] [Green Version]
  5. Raghothama, K.G. Phosphate acquisition. Annu. Rev. Plant Biol. 1999, 50, 665–693. [Google Scholar] [CrossRef]
  6. Abel, S.; Ticconi, C.A.; Delatorre, C.A. Phosphate sensing in higher plants. Physiol. Plant 2002, 115, 1–8. [Google Scholar] [CrossRef] [PubMed]
  7. Chiou, T.-J.; Lin, S.-I. Signaling network in sensing phosphate availability in plants. Annu. Rev. Plant Biol. 2011, 62, 185–206. [Google Scholar] [CrossRef] [Green Version]
  8. Wu, P.; Ma, L.; Hou, X.; Wang, M.; Wu, Y.; Liu, F.; Deng, X.W. Phosphate starvation triggers distinct alterations of genome expression in arabidopsis roots and leaves. Plant Physiol. 2003, 132, 1260–1271. [Google Scholar] [CrossRef] [Green Version]
  9. Müller, R.; Morant, M.; Jarmer, H.; Nilsson, L.; Nielsen, T.H. Genome-wide analysis of the Arabidopsis leaf transcriptome reveals interaction of phosphate and sugar metabolism. Plant Physiol. 2007, 143, 156–171. [Google Scholar] [CrossRef] [Green Version]
  10. Vance, C.P.; Uhde-Stone, C.; Allan, D.L. Phosphorus acquisition and use: Critical adaptations by plants for securing a nonrenewable resource. New Phytol. 2003, 157, 423–447. [Google Scholar] [CrossRef] [Green Version]
  11. Cordell, D.; Drangert, J.-O.; White, S. The story of phosphorus: Global food security and food for thought. Glob. Environ. Change 2009, 19, 292–305. [Google Scholar] [CrossRef]
  12. Elser, J.; Bennett, E. Phosphorus cycle: A broken biogeochemical cycle. Nature 2011, 478, 29. [Google Scholar] [CrossRef] [PubMed]
  13. Smil, V. Phosphorus in the environment: Natural flows and human interferences. Annu. Rev. Energy Environ. 2000, 25, 53–88. [Google Scholar] [CrossRef] [Green Version]
  14. Bennett, E.M.; Carpenter, S.R.; Caraco, N.F. Human impact on erodable phosphorus and eutrophication: A global perspective: Increasing accumulation of phosphorus in soil threatens rivers, lakes, and coastal oceans with eutrophication. BioScience 2001, 51, 227–234. [Google Scholar] [CrossRef]
  15. Huang, J.; Xu, C.-C.; Ridoutt, B.; Wang, X.-C.; Ren, P.-A. Nitrogen and phosphorus losses and eutrophication potential associated with fertilizer application to cropland in China. J. Clean. Prod. 2017, 159, 171–179. [Google Scholar] [CrossRef]
  16. Ray, D.K.; Mueller, N.D.; West, P.; Foley, J.A. Yield trends are insufficient to double global crop production by 2050. PLoS ONE 2013, 8, e66428. [Google Scholar] [CrossRef] [PubMed] [Green Version]
  17. Krausmann, F.; Erb, K.-H.; Gingrich, S.; Haberl, H.; Bondeau, A.; Gaube, V.; Lauk, C.; Plutzar, C.; Searchinger, T.D. Global human appropriation of net primary production doubled in the 20th century. Proc. Natl. Acad. Sci. USA 2013, 110, 10324–10329. [Google Scholar] [CrossRef] [Green Version]
  18. Hunter, M.C.; Smith, R.G.; Schipanski, M.E.; Atwood, L.W.; Mortensen, D.A. Agriculture in 2050: Recalibrating targets for sustainable intensification. Bioscience 2017, 67, 386–391. [Google Scholar] [CrossRef] [Green Version]
  19. Fujii, H.; Chiou, T.-J.; Lin, S.-I.; Aung, K.; Zhu, J.-K. A miRNA involved in phosphate-starvation response in Arabidopsis. Curr. Biol. 2005, 15, 2038–2043. [Google Scholar] [CrossRef] [Green Version]
  20. Hsieh, L.-C.; Lin, S.-I.; Shih, A.C.-C.; Chen, J.-W.; Lin, W.-Y.; Tseng, C.-Y.; Li, W.-H.; Chiou, T.-J. Uncovering small RNA-mediated responses to phosphate deficiency in Arabidopsis by deep sequencing. Plant Physiol. 2009, 151, 2120–2132. [Google Scholar] [CrossRef] [Green Version]
  21. Sunkar, R.; Zhu, J.-K. Novel and stress-regulated MicroRNAs and other small RNAs from Arabidopsis. Plant Cell 2004, 16, 2001–2019. [Google Scholar] [CrossRef] [PubMed] [Green Version]
  22. Sunkar, R.; Kapoor, A.; Zhu, J.-K. Posttranscriptional induction of Two Cu/Zn superoxide dismutase genes in Arabidopsis is mediated by downregulation of miR398 and important for oxidative stress tolerance. Plant Cell 2006, 18, 2051–2065. [Google Scholar] [CrossRef] [PubMed] [Green Version]
  23. Chiou, T.-J. The role of microRNAs in sensing nutrient stress. Plant Cell Environ. 2007, 30, 323–332. [Google Scholar] [CrossRef]
  24. Park, B.S.; Seo, J.S.; Chua, N.-H. Nitrogen limitation adaptation recruits Phosphate2 to target the phosphate transporter PT2 for degradation during the regulation of Arabidopsis phosphate homeostasis. Plant Cell 2014, 26, 454–464. [Google Scholar] [CrossRef] [PubMed] [Green Version]
  25. Buhtz, A.; Springer, F.; Chappell, L.; Baulcombe, D.; Kehr, J. Identification and characterization of small RNAs from the phloem of Brassica napus. Plant J. 2007, 53, 739–749. [Google Scholar] [CrossRef]
  26. Pant, B.D.; Buhtz, A.; Kehr, J.; Scheible, W.-R. MicroRNA399 is a long-distance signal for the regulation of plant phosphate homeostasis. Plant J. 2008, 53, 731–738. [Google Scholar] [CrossRef] [Green Version]
  27. Kant, S.; Peng, M.; Rothstein, S.J. Genetic regulation by NLA and MicroRNA827 for maintaining nitrate-dependent phosphate homeostasis in Arabidopsis. PLoS Genet. 2011, 7, e1002021. [Google Scholar] [CrossRef] [Green Version]
  28. Wang, Y.-H.; Garvin, D.F.; Kochian, L. Rapid induction of regulatory and transporter genes in response to phosphorus, potassium, and iron deficiencies in tomato roots. evidence for cross talk and root/rhizosphere-mediated signals. Plant Physiol. 2002, 130, 1361–1370. [Google Scholar] [CrossRef] [PubMed] [Green Version]
  29. Shin, R.; Berg, R.H.; Schachtman, D.P. Reactive oxygen species and root hairs in Arabidopsis root response to nitrogen, phosphorus and potassium deficiency. Plant Cell Physiol. 2005, 46, 1350–1357. [Google Scholar] [CrossRef] [PubMed]
  30. Liang, G.; He, H.; Yu, D. Identification of nitrogen starvation-responsive MicroRNAs in Arabidopsis thaliana. PLoS ONE 2012, 7, e48951. [Google Scholar] [CrossRef] [PubMed] [Green Version]
  31. Bari, R.; Pant, B.D.; Stitt, M.; Scheible, W.-R. PHO2, MicroRNA399, and PHR1 define a phosphate-signaling pathway in plants. Plant Physiol. 2006, 141, 988–999. [Google Scholar] [CrossRef] [PubMed] [Green Version]
  32. Nilsson, L.; Müller, R.; Nielsen, T.H. Increased expression of the MYB-related transcription factor, PHR1, leads to enhanced phosphate uptake in Arabidopsis thaliana. Plant Cell Environ. 2007, 30, 1499–1512. [Google Scholar] [CrossRef] [PubMed]
  33. Rubio, V.; Linhares, F.; Solano, R.; Martín, A.C.; Iglesias, J.; Leyva, A.; Paz-Ares, J. A conserved MYB transcription factor involved in phosphate starvation signaling both in vascular plants and in unicellular algae. Genes Dev. 2001, 15, 2122–2133. [Google Scholar] [CrossRef] [PubMed] [Green Version]
  34. Lin, S.-I.; Chiang, S.-F.; Lin, W.-Y.; Chen, J.-W.; Tseng, C.-Y.; Wu, P.-C.; Chiou, T.-J. Regulatory network of MicroRNA399 andPHO2by systemic signaling. Plant Physiol. 2008, 147, 732–746. [Google Scholar] [CrossRef] [PubMed] [Green Version]
  35. Aung, K.; Lin, S.-I.; Wu, C.-C.; Huang, Y.-T.; Su, C.-L.; Chiou, T.-J. pho2, a Phosphate overaccumulator, is caused by a nonsense mutation in a MicroRNA399 target gene. Plant Physiol. 2006, 141, 1000–1011. [Google Scholar] [CrossRef] [Green Version]
  36. Berkowitz, O.; Jost, R.; Kollehn, D.O.; Fenske, R.; Finnegan, P.M.; O’Brien, P.A.; Hardy, G.; Lambers, H. Acclimation responses of Arabidopsis thaliana to sustained phosphite treatments. J. Exp. Bot. 2013, 64, 1731–1743. [Google Scholar] [CrossRef] [Green Version]
  37. Huang, T.-K.; Han, C.-L.; Lin, S.-I.; Chen, Y.-J.; Tsai, Y.-C.; Chen, Y.-R.; Chen, J.-W.; Lin, W.-Y.; Chen, P.-M.; Liu, T.-Y.; et al. Identification of downstream components of ubiquitin-conjugating enzyme PHOSPHATE2 by quantitative membrane proteomics in Arabidopsis roots. Plant Cell 2013, 25, 4044–4060. [Google Scholar] [CrossRef] [Green Version]
  38. Bao, M.; Bian, H.; Zha, Y.; Li, F.; Sun, Y.; Bai, B.; Chen, Z.; Wang, J.; Zhu, M.; Han, N. miR396a-Mediated basic helix–loop–helix transcription factor bHLH74 repression acts as a regulator for root growth in Arabidopsis seedlings. Plant Cell Physiol. 2014, 55, 1343–1353. [Google Scholar] [CrossRef] [PubMed] [Green Version]
  39. Hewezi, T.; Baum, T.J. Complex feedback regulations govern the expression of miRNA396 and its GRF target genes. Plant Signal. Behav. 2012, 7, 749–751. [Google Scholar] [CrossRef] [PubMed] [Green Version]
  40. Kim, J.H.; Choi, D.; Kende, H. The AtGRF family of putative transcription factors is involved in leaf and cotyledon growth in Arabidopsis. Plant J. 2003, 36, 94–104. [Google Scholar] [CrossRef]
  41. Horiguchi, G.; Kim, G.-T.; Tsukaya, H. The transcription factor AtGRF5 and the transcription coactivator AN3 regulate cell proliferation in leaf primordia of Arabidopsis thaliana. Plant J. 2005, 43, 68–78. [Google Scholar] [CrossRef] [PubMed]
  42. Liang, G.; He, H.; Li, Y.; Wang, F.; Yu, D. Molecular mechanism of microRNA396 mediating pistil development in Arabidopsis. Plant Physiol. 2014, 164, 249–258. [Google Scholar] [CrossRef] [PubMed] [Green Version]
  43. Pajoro, A.; Madrigal, P.; Muiño, J.M.; Matus, J.T.; Jin, J.; Mecchia, M.A.; Debernardi, J.M.; Palatnik, J.F.; Balazadeh, S.; Arif, M.; et al. Dynamics of chromatin accessibility and gene regulation by MADS-domain transcription factors in flower development. Genome Biol. 2014, 15, R41. [Google Scholar] [CrossRef] [PubMed]
  44. Casati, P. Analysis of UV-B regulated miRNAs and their targets in maize leaves. Plant Signal. Behav. 2013, 8, e26758. [Google Scholar] [CrossRef] [PubMed] [Green Version]
  45. Kantar, M.; Lucas, S.J.; Budak, H. miRNA expression patterns of Triticum dicoccoides in response to shock drought stress. Planta 2011, 233, 471–484. [Google Scholar] [CrossRef]
  46. Kim, J.-S.; Mizoi, J.; Kidokoro, S.; Maruyama, K.; Nakajima, J.; Nakashima, K.; Mitsuda, N.; Takiguchi, Y.; Ohme-Takagi, M.; Kondou, Y.; et al. Arabidopsis GROWTH-REGULATING FACTOR7 functions as a transcriptional repressor of Abscisic acid– and osmotic stress–responsive genes, including DREB2A. Plant Cell 2012, 24, 3393–3405. [Google Scholar] [CrossRef] [Green Version]
  47. Liu, D.; Song, Y.; Chen, Z.; Yu, D. Ectopic expression of miR396 suppresses GRF target gene expression and alters leaf growth in Arabidopsis. Physiol. Planta. 2009, 136, 223–236. [Google Scholar] [CrossRef]
  48. Liu, H.-H.; Tian, X.; Li, Y.-J.; Wu, C.-A.; Zheng, C.-C. Microarray-based analysis of stress-regulated microRNAs in Arabidopsis thaliana. RNA 2008, 14, 836–843. [Google Scholar] [CrossRef] [Green Version]
  49. Shen, J.; Xie, K.; Xiong, L. Global expression profiling of rice microRNAs by one-tube stem-loop reverse transcription quantitative PCR revealed important roles of microRNAs in abiotic stress responses. Mol. Genet. Genom. 2010, 284, 477–488. [Google Scholar] [CrossRef]
  50. Pegler, J.L.; Oultram, J.M.J.; Grof, C.P.L.; Eamens, A.L. Profiling the Abiotic stress responsive microRNA landscape of Arabidopsis thaliana. Plants 2019, 8, 58. [Google Scholar] [CrossRef] [PubMed] [Green Version]
  51. Zhu, J.; Park, J.-H.; Lee, S.; Lee, J.H.; Hwang, D.; Kwak, J.M.; Kim, Y.J. Regulation of stomatal development by stomatal lineage miRNAs. Proc. Natl. Acad. Sci. USA 2020, 117, 6237–6245. [Google Scholar] [CrossRef] [Green Version]
  52. Kim, W.; Ahn, H.J.; Chiou, T.-J.; Ahn, J.H. The role of the miR399-PHO2 module in the regulation of flowering time in response to different ambient temperatures in Arabidopsis thaliana. Mol. Cells 2011, 32, 83–88. [Google Scholar] [CrossRef]
  53. Pegler, J.L.; Oultram, J.M.J.; Grof, C.P.L.; Eamens, A.L. Molecular manipulation of the miR399/PHO2 expression module alters the salt stress response of Arabidopsis thaliana. Plants 2020, 10, 73. [Google Scholar] [CrossRef] [PubMed]
  54. Chen, L.; Luan, Y.; Zhai, J. Sp-miR396a-5p acts as a stress-responsive genes regulator by conferring tolerance to abiotic stresses and susceptibility to Phytophthora nicotianae infection in transgenic tobacco. Plant Cell Rep. 2015, 34, 2013–2025. [Google Scholar] [CrossRef] [PubMed]
  55. Wang, M.; Wang, Q.; Zhang, B. Response of miRNAs and their targets to salt and drought stresses in cotton (Gossypium hirsutum L.). Gene 2013, 530, 26–32. [Google Scholar] [CrossRef] [PubMed]
  56. Gao, P.; Bai, X.; Yang, L.; Lv, D.; Li, Y.; Cai, H.; Ji, W.; Guo, D.; Zhu, Y. Over-expression of osa-MIR396c decreases salt and alkali stress tolerance. Planta 2010, 231, 991–1001. [Google Scholar] [CrossRef]
  57. Yuan, S.; Zhao, J.; Li, Z.; Hu, Q.; Yuan, N.; Zhou, M.; Xia, X.; Noorai, R.; Saski, C.; Li, S.; et al. MicroRNA396-mediated alteration in plant development and salinity stress response in creeping bentgrass. Hortic. Res. 2019, 6, 1–13. [Google Scholar] [CrossRef] [PubMed] [Green Version]
  58. Pegler, J.L.; Oultram, J.M.J.; Nguyen, D.Q.; Grof, C.P.L.; Eamens, A.L. Molecular manipulation of the miR396/GRF expression module alters the salt stress response of Arabidopsis thaliana. Agronomy 2021, 11, 1751. [Google Scholar] [CrossRef]
  59. Aroca, R.; Porcel, R.; Lozano, J.M.R. Regulation of root water uptake under abiotic stress conditions. J. Exp. Bot. 2011, 63, 43–57. [Google Scholar] [CrossRef]
  60. Chalker-Scott, L. Environmental significance of anthocyanins in plant stress responses. Photochem. Photobiol. 1999, 70, 1–9. [Google Scholar] [CrossRef]
  61. Akula, R.; Ravishankar, G.A. Influence of abiotic stress signals on secondary metabolites in plants. Plant Signal. Behav. 2011, 6, 1720–1731. [Google Scholar] [CrossRef] [PubMed]
  62. Kovinich, N.; Kayanja, G.; Chanoca, A.; Otegui, M.S.; Grotewold, E. Abiotic stresses induce different localizations of anthocyanins in Arabidopsis. Plant Signal Behav. 2015, 10, e1027850. [Google Scholar] [CrossRef] [PubMed] [Green Version]
  63. Sudhir, P.; Murthy, S. Effects of salt stress on basic processes of photosynthesis. Photosynthetica 2004, 42, 481–486. [Google Scholar] [CrossRef]
  64. Kim, J.H.; Kende, H. A transcriptional coactivator, AtGIF1, is involved in regulating leaf growth and morphology in Arabidopsis. Proc. Natl. Acad. Sci. USA 2004, 101, 13374–13379. [Google Scholar] [CrossRef] [Green Version]
  65. Beltramino, M.; Ercoli, M.F.; Debernardi, J.M.; Goldy, C.; Rojas, A.M.L.; Nota, F.; Alvarez, M.E.; Vercruyssen, L.; Inzé, D.; Palatnik, J.F.; et al. Robust increase of leaf size by Arabidopsis thaliana GRF3-like transcription factors under different growth conditions. Sci. Rep. 2018, 8, 13447. [Google Scholar] [CrossRef]
  66. Omidbakhshfard, M.A.; Proost, S.; Fujikura, U.; Mueller-Roeber, B. Growth-regulating factors (GRFs): A small transcription factor family with important functions in plant biology. Mol. Plant 2015, 8, 998–1010. [Google Scholar] [CrossRef] [Green Version]
  67. Hamburger, D.; Rezzonico, E.; Somerville, C.; Poirier, Y. Identification and characterization of the Arabidopsis PHO1 gene involved in phosphate loading to the Xylem. Society 2002, 14, 889–902. [Google Scholar] [CrossRef] [Green Version]
  68. Liu, T.Y.; Lin, W.Y.; Huang, T.K.; Chiou, T.J. MicroRNA-mediated surveillance of phosphate transporters on the move. Trends Plant Sci. 2014, 19, 647–655. [Google Scholar] [CrossRef] [PubMed]
  69. Poirier, Y.; Thoma, S.; Somerville, C.; Schiefelbein, J. Mutant of Arabidopsis deficient in Xylem loading of phosphate. Plant Physiol. 1991, 97, 1087–1093. [Google Scholar] [CrossRef] [Green Version]
  70. Shukla, D.; Rinehart, C.A.; Sahi, S.V. Comprehensive study of excess phosphate response reveals ethylene mediated signaling that negatively regulates plant growth and development. Sci. Rep. 2017, 7, 3074. [Google Scholar] [CrossRef] [Green Version]
  71. Jiang, C.; Gao, X.; Liao, L.; Harberd, N.P.; Fu, X. Phosphate starvation root architecture and anthocyanin accumulation responses are modulated by the gibberellin-DELLA signaling pathway in Arabidopsis. Plant Physiol. 2007, 145, 1460–1470. [Google Scholar] [CrossRef] [Green Version]
  72. Pegler, J.L.; Oultram, J.M.J.; Nguyen, D.Q.; Grof, C.P.L.; Eamens, A.L. MicroRNA-mediated responses to cadmium stress in Arabidopsis thaliana. Plants 2021, 10, 130. [Google Scholar] [CrossRef]
  73. Franco-Zorrilla, J.M.; Valli, A.; Todesco, M.; Mateos, I.; Puga, M.I.; Somoza, I.R.; Leyva, A.; Weigel, D.; Garcia, J.A.; Paz-Ares, J. Target mimicry provides a new mechanism for regulation of microRNA activity. Nat. Genet. 2007, 39, 1033–1037. [Google Scholar] [CrossRef]
  74. Todesco, M.; Rubio-Somoza, I.; Paz-Ares, J.; Weigel, D. A collection of target mimics for comprehensive analysis of MicroRNA function in Arabidopsis thaliana. PLoS Genet. 2010, 6, e1001031. [Google Scholar] [CrossRef] [Green Version]
  75. Clough, S.J.; Bent, A.F. Floral dip: A simplified method for Agrobacterium-mediated transformation of Arabidopsis thaliana. Plant J. 1998, 16, 735–743. [Google Scholar] [CrossRef] [Green Version]
  76. Laby, R.J.; Kincaid, M.S.; Kim, D.; Gibson, S.I. The Arabidopsis sugar-insensitive mutants sis4 and sis5 are defective in abscisic acid synthesis and response. Plant J. 2000, 23, 587–596. [Google Scholar] [CrossRef]
  77. Lichtenthaler, H.K.; Wellburn, A.R. Determinations of total carotenoids and chlorophylls a and b of leaf extracts in different solvents. Biochem. Soc. Trans. 1983, 11, 591–592. [Google Scholar] [CrossRef] [Green Version]
  78. Varkonyi-Gasic, E.; Wu, R.; Wood, M.; Walton, E.F.; Hellens, R.P. Protocol: A highly sensitive RT-PCR method for detection and quantification of microRNAs. Plant Methods 2007, 3, 12. [Google Scholar] [CrossRef] [Green Version]
  79. Eamens, A.L.; Smith, N.A.; Curtin, S.J.; Wang, M.-B.; Waterhouse, P.M. The Arabidopsis thaliana double-stranded RNA binding protein DRB1 directs guide strand selection from microRNA duplexes. RNA 2009, 15, 2219–2235. [Google Scholar] [CrossRef] [PubMed] [Green Version]
  80. Eamens, A.L.; Kim, K.W.; Curtin, S.J.; Waterhouse, P.M. DRB2 is required for MicroRNA biogenesis in Arabidopsis thaliana. PLoS ONE 2012, 7, e35933. [Google Scholar] [CrossRef] [Green Version]
Figure 1. Phenotypes displayed by 15-day-old control-grown and PO4-starved Col-0, MIM396, MIR396, MIM399 and MIR399 seedlings. Phenotypes displayed by 15-day-old (A) Col-0/P+, (B) Col-0/P-, (C) MIM396/P+, (D) MIM396/P-, (E) MIR396/P+, (F) MIR396/P-, (G) MIM399/P+, (H) MIM399/P-, (I) MIR399/P+, and (J) MIR399/P- seedlings. (AJ) Scale bar = 1.0 cm.
Plants 10 02570 g001
Figure 2. Phenotypic and physiological assessment of 15-day-old control-grown and PO4-starved Col-0, MIM396, MIR396, MIM399 and MIR399 seedlings. Quantification of the phenotypic parameters of (A) fresh weight (mg), (B) rosette area (mm2) and (C) primary root length (mm) for control-grown and PO4-starved 15-day-old Col-0, MIM396, MIR396, MIM399 and MIR399 seedlings. Quantification of the physiological parameters of (D) anthocyanin content (µg/g FW), (E) chlorophyll a and (F) chlorophyll b abundance (mg/g FW), for control-grown and PO4-starved 15-day-old Col-0, MIM396, MIR396, MIM399 and MIR399 seedlings. All phenotypic and physiological metrics are presented as a percentage (%) post comparison to the respective values obtained for Col-0/P+ plants which were assigned a value of 100% for each assessed growth characteristic. (AF) Error bars represent the standard deviation of four biological replicates. The statistical data were analyzed with the use of the one-way ANOVA and Tukey’s post hoc tests and a statistically significant difference (p-value < 0.05) is denoted by a different letter above a histogram column.
Plants 10 02570 g002
Figure 3. Molecular profiling of the miR396/GRF expression module in 15-day-old control-grown and PO4-starved Col-0, MIM396 and MIR396 seedlings. (A) Quantification of miR396 abundance by RT-qPCR in control-grown (P+) and PO4-starved (P-) Col-0, MIM396 and MIR396 plants. RT-qPCR quantification of the expression of the six members of the Arabidopsis GRF gene family targeted by miR396 for expression regulation, including GRF1 (B), GRF2 (C), GRF3 (D), GRF7 (E), GRF8 (F) and GRF9 (G), in the Col-0/P+, Col-0/P-, MIM396/P+, MIM396/P-, MIR396/P+ and MIR396/P- samples. (AG) Error bars represent the standard deviation of four biological replicates. All statistical data were analyzed via the use of the one-way ANOVA and Tukey’s post hoc tests. A statistically significant difference (p-value < 0.05) is represented by a different letter above a histogram column.
Plants 10 02570 g003
Figure 4. Molecular profiling of upstream and downstream components of the miR399/PHO2 expression module in 15-day-old control-grown and PO4-starved Col-0, MIM396, MIR396, MIM399 and MIR399 seedlings. RT-qPCR quantification of PHR1 expression (A), MIR399A gene expression (B), miR399 abundance (C), PHO2 expression (D) and the level of gene expression of the PO4 transporters, PHT1;4 (E), PHT1;8 (F) and PHT1;9 (G) in Col-0/P+, Col-0/P-, MIM396/P+, MIM396/P-, MIR396/P+, MIR396/P-, MIM399/P+, MIM399/P-, MIR399/P+ and MIR399/P- seedlings. (AG) The error bars above histogram columns represent the standard deviation of four biological replicates and all statistical data were analyzed using the one-way ANOVA and Tukey’s post hoc tests. A different letter above a histogram column represents a statistically significant difference (p-value < 0.05).
Plants 10 02570 g004
Publisher’s Note: MDPI stays neutral with regard to jurisdictional claims in published maps and institutional affiliations.

