
Trait Variations and Probability Grading Index System on Leaf-Related Traits of Eucommia ulmoides Oliver Germplasm

Abstract
:1. Introduction
2. Materials and Methods
2.1. Plant Materials
2.2. Studied Traits
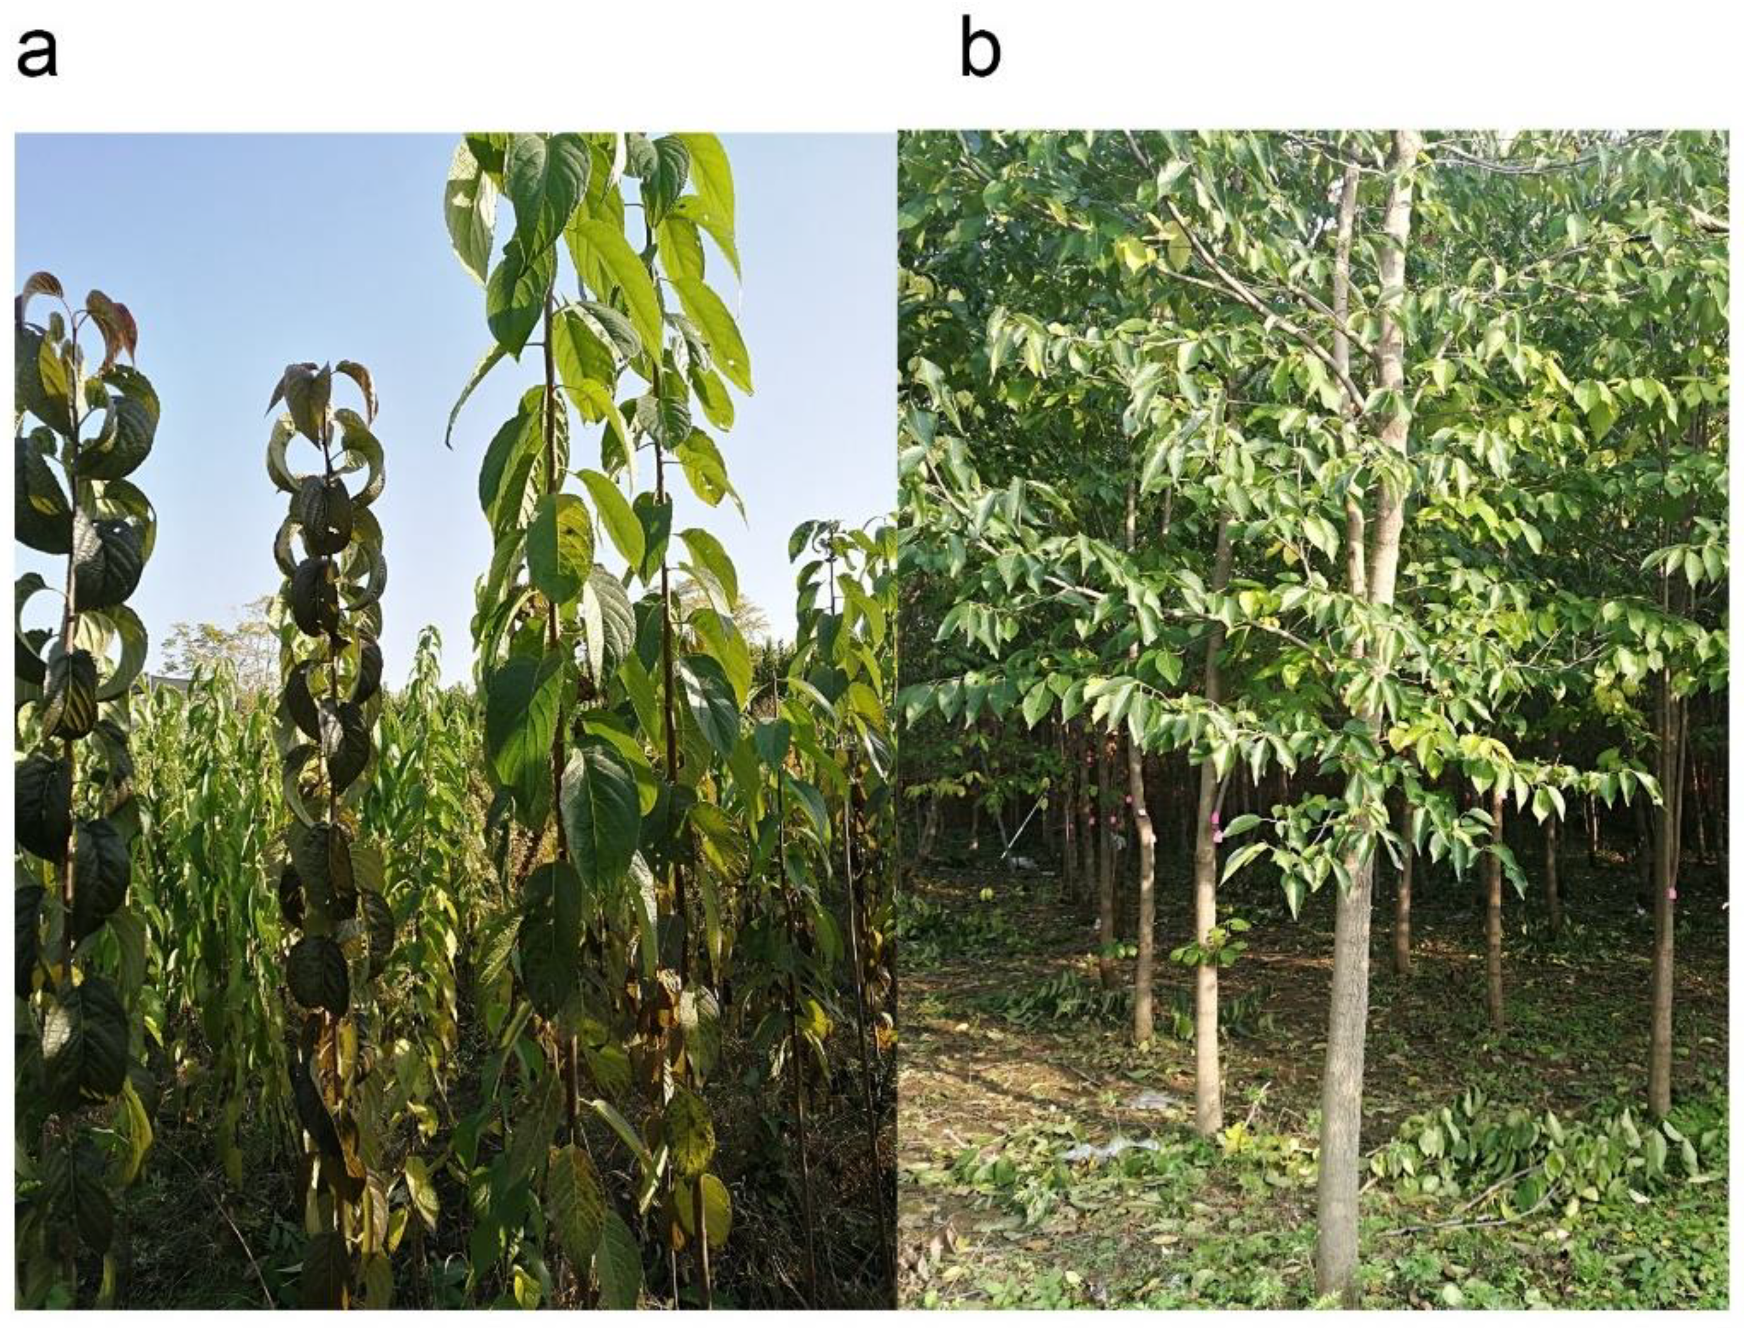
2.3. Planting Models
2.4. Measurement of Leaf Water Status
2.5. Sample Collections and Measurement of Leaf Morphological Traits
2.6. Sample Processing and Measurement of the Secondary Metabolite Content in Leaves
2.7. Data Analyses
2.7.1. Chlorogenic Acid Content Determination
2.7.2. Calculation of Water Status Parameters
- V’: Water content of osmotic at turgor loss;
- V0: Water content of osmotic at full turgor;
- Vt: Tissue-saturated water content.
2.7.3. Variance Analyses and Multiple Comparisons
2.7.4. Normal Distribution Test and Grading Standard
3. Results
3.1. Leaf-Related Trait Variations
3.2. Variance Analyses and Multiple Comparisons of Leaf-Related Traits
3.3. Association Analyses among Leaf-Related Traits
3.4. Distribution Type of Leaf-Related Traits
3.5. Probability Classification of Leaf-Related Traits
4. Conclusions
Supplementary Materials
Author Contributions
Funding
Data Availability Statement
Acknowledgments
Conflicts of Interest
References
- Tippo, O. The comparative anatomy of the secondary xylem and the phylogeny of the Eucommiaceae. Am. J. Bot. 1940, 27, 832–838. [Google Scholar] [CrossRef]
- Zhu, M.; Wen, J.; Zhu, Y.; Su, Y.; Sun, R. Isolation and analysis of four constituents from barks and leaves of Eucommia ulmoides Oliver by a multi-step process. Ind. Crops Prod. 2016, 83, 124–132. [Google Scholar] [CrossRef]
- Ouyang, D.; Wang, L.; Tang, T.; Feng, H. Genomic-Wide Identification and Characterization of the Uridine Diphosphate Glycosyltransferase Family in Eucommia ulmoides Oliver. Plants 2021, 10, 1934. [Google Scholar] [CrossRef] [PubMed]
- Xing, Y.; He, D.; Wang, Y.; Zeng, W.; Zhang, C.; Lu, Y.; Su, N.; Kong, Y.; Xing, X. Chemical constituents, biological functions and pharmacological effects for comprehensive utilization of Eucommia ulmoides Oliver. Food Sci. Hum. Wellness 2019, 8, 177–188. [Google Scholar] [CrossRef]
- He, X.; Wang, J.; Li, M.; Hao, D.; Yang, Y.; Zhang, C.; He, R.; Tao, R. Eucommia ulmoides Oliv.: Ethnopharmacology, phytochemistry and pharmacology of an important traditional Chinese medicine. J. Ethnopharmacol. 2014, 151, 78–92. [Google Scholar] [CrossRef] [PubMed]
- China Pharmacopoeia Committee. Chinese Pharmacopoeia of People’s Republic of China; Chemical Industry: Beijing, China, 2005. [Google Scholar]
- Sun, Z.; Li, F.; Du, H.; Zhu, J.; Wang, Y.P. A novel silvicultural model for increasing biopolymer production from Eucommia ulmoides Oliver trees. Ind. Crops Prod. 2013, 42, 216–222. [Google Scholar] [CrossRef]
- Bamba, T.; Fukusaki, E.; Nakazawa, Y.; Kobayashi, A. In-situ chemical analyses of trans-polyisoprene by histochemical staining and Fourier transform infrared microspectroscopy in a rubber-producing plant, Eucommia ulmoides Oliver. Planta 2002, 215, 934–939. [Google Scholar] [CrossRef]
- Chen, R.; Namimatsu, S.; Nakadozono, Y.; Bamba, T.; Nakazawa, Y.; Gyokusen, K. Efficient regeneration of Eucommia ulmoides from hypocotyl explant. Biol. Plant. 2008, 52, 713–717. [Google Scholar] [CrossRef]
- Wuyun, T.N.; Wang, L.; Liu, H.; Wang, X.; Zhang, L.; Bennetzen, J.L.; Li, T.; Yang, L.; Liu, P.; Du, L.; et al. The Hardy Rubber Tree Genome Provides Insights into the Evolution of Polyisoprene Biosynthesis. Mol. Plant 2018, 11, 429–442. [Google Scholar] [CrossRef] [Green Version]
- Du, H. China Eucommia Pictorial; China Forestry Publishing House: Beijing, China, 2014. [Google Scholar]
- Li, Y.; Wei, H.; Yang, J.; Du, K.; Li, J.; Zhang, Y.; Qiu, T.; Liu, Z.; Ren, Y.; Song, L.; et al. High-quality de novo assembly of the Eucommia ulmoides haploid genome provides new insights into evolution and rubber biosynthesis. Hortic. Res. 2020, 7, 183. [Google Scholar] [CrossRef]
- Zhang, K. Eucommia ulmoides Oliver; China Forestry Publishing House: Beijing, China, 1990. [Google Scholar]
- Zhang, K.; Dong, J.; Ma, B.; Gao, J.; Han, X. Studies on the distribution differences of the secondary metabolites in Eucommia ulmoides. Sci. Silvae Sin. 2002, 38, 12–16. [Google Scholar]
- Zhu, M.; Sun, R. Eucommia ulmoides Oliver: A Potential Feedstock for Bioactive Products. J. Agric. Food Chem. 2018, 66, 5433–5438. [Google Scholar] [CrossRef]
- Du, Q.; Wang, L.; Liu, P.; Qing, J.; Sun, C.; Sun, Z.; Du, H. Fatty Acids Variation in Seed of Eucommia ulmoides Populations Collected from Different Regions in China. Forests 2018, 9, 505. [Google Scholar] [CrossRef] [Green Version]
- Wei, X.; Peng, P.; Peng, F.; Dong, J. Natural Polymer Eucommia Ulmoides Rubber: A Novel Material. J. Agric. Food Chem. 2021, 69, 3797–3821. [Google Scholar] [CrossRef]
- Liu, P.; Liu, M.; Zhou, J.; Bi, P. Distribution and probability grading index system of quantitative character of Chinese Jujube. Sci. Silvae Sin. 2003, 39, 77–82. [Google Scholar]
- Cui, H.; Zhang, Y.; Shi, X.; Gong, F.; Xiong, X.; Kang, X.; Xing, G.; Li, S. The numerical classification and grading standards of daylily (Hemerocallis) flower color. PLoS ONE 2019, 14, e0216460. [Google Scholar]
- Chen, L.; Yang, Y.; Ge, J.; Cui, X.; Xiong, Y. Study on the grading standard of Panax notoginseng seedlings. J. Ginseng Res. 2018, 42, 208–217. [Google Scholar] [CrossRef]
- Su, W.; Song, Y.; Qi, M.; Du, F. Leaf morphological characteristics of section Quercus based on geometric morphometric analysis. Chin. J. Appl. Ecol. 2021, 32, 2309–2315. [Google Scholar]
- Shi, P.; Yu, K.; Niinemets, U.; Gielis, J. Can Leaf Shape be Represented by the Ratio of Leaf Width to Length? Evidence from Nine Species of Magnolia and Michelia (Magnoliaceae). Forests 2021, 12, 41. [Google Scholar] [CrossRef]
- Liu, M. Study on probability grading of quantitative characters of Chinese Jujube. Acta Hortic. Sin. 1996, 23, 105–109. [Google Scholar]
- Liu, M. Intraspecific variation of some economic traits in peach trees and its classification standard research. J. Beijing Agric. Coll. 1992, 7, 98–104. [Google Scholar]
- Ni, Z.; Zhang, L.; Xie, D.; Luo, X.; Liu, C.; Wen, D.; Yu, Y. Variation and probability grading of main quantitative characteristics of mango germplasm resource in Nujiang Valley, Yunnan province. J. Fruit Sci. 2009, 26, 492–497. [Google Scholar]
- Zhao, H.; Liu, W.; Liu, N.; Zhang, Y.; Zhang, Q.; Liu, S. Variation and probability grading of main quantitative traits of apricot (Armeniaca vulgaris) germplam. J. Fruit Sci. 2013, 30, 37–42. [Google Scholar]
- Ma, X.; Zhao, Q.; Dong, Z.; Tang, X.; Wang, M.; Ren, R. Variation and Probability Grading of Main Quantitative Traits of Table Grape Resources. J. Plant Genom. Resour. 2013, 14, 1185–1189. [Google Scholar]
- Lang, B.; Zhu, B.; Xie, M.; Zhang, W.; Seyrek, U.A.; Huang, C.; Xu, X. Variation and probability grading of the main quantitative characteristics of wild Actinidia eriantha germplasm resources. J. Fruit Sci. 2016, 33, 8–15. [Google Scholar]
- Yan, Z.; Zheng, L.; Nie, J.; Li, Z.; Cheng, Y. Evaluation indices of sour flavor for apple fruit and grading standards. J. Integr. Agric. 2018, 17, 994–1002. [Google Scholar] [CrossRef] [Green Version]
- Song, X.; Gao, K.; Fan, G.; Zhao, X.; Liu, Z.; Dai, S. Quantitative Classification of the Morphological Traits of Ray Florets in Large-flowered Chrysanthemum. Hortscience 2018, 53, 1258–1265. [Google Scholar] [CrossRef] [Green Version]
- Du, Q.; Liu, P.; Qing, J.; Wei, Y.; Du, H. Variation and probability grading of main quantitative traits of male flowers for Eucommia ulmoides germplasm. J. Beijing For. Univ. 2016, 38, 42–49. [Google Scholar]
- Du, Q.; Qing, J.; Wang, L.; Liu, P.; He, F.; Zhu, L.; Du, H. Variation and Probability Grading of Main Quantitative Traits of Fruits for Eucommia ulmoides Germplasm. Bull. Bot. Res. 2019, 39, 387–394. [Google Scholar]
- Wei, Y.; Liu, P.; Du, Q.; Du, H. Comparison in Contents of Polyphenol and Flavonoid in Leaves of Eucommia ulmoides Germplasm. For. Res. 2016, 29, 529–535. [Google Scholar]
- Qing, J.; Wei, Y.; Wang, D.; Wang, L.; Liu, P.; Du, H.; Du, Q. Study on Genetic Variation of Main Active Components in Leaves of Eucommia ulmoides. Acta Bot. Boreali-Occident. Sin. 2018, 38, 316–323. [Google Scholar]
- Du, H. Eucommia ulmoides Silviculture; China Forestry Press: Beijing, China, 1996. [Google Scholar]
- Du, H.; Du, L.; Xie, B.; Wuyun, T. Dynamic Accumulation of Gutta-percha Content in Eucommia ulmoides Oliv. Leaves. J. Central South For. Univ. 2006, 26, 1–6. [Google Scholar]
- Yang, L.; Zhang, Z.; Mo, K.; Fu, Z. A Study of Variation Characteristics of Chlorogenic Acid Content in Eucommia ulmoides Leaves Under the Different Influence Factors. J. Sichuan For. Sci. Technol. 2012, 33, 50–52. [Google Scholar]
- Zhang, W.; Zhu, W.; Zhang, L.; Fu, D.; Zhang, Z.; Zhang, L.; Zu, Y. Contents of main active ingredients and correlation with different ages and parts of Eucommia ulmoides Oliv. Non-Wood For. Res. 2020, 38, 46–57. [Google Scholar]
- Li, J.; Li, Y.; Zhao, L.; Zuo, L. Effects of site conditions and tree age on Robinia pseudoacacia and Populus simonii leaf hydraulic traits and drought resistance. Chin. J. Appl. Ecol. 2012, 23, 2397–2403. [Google Scholar]
- Li, Y.; Kong, D.; Huang, R.; Liang, H.; Xu, C.; Wu, H. Variations in essential oil yields and compositions of Cinnamomum cassia leaves at different developmental stages. Ind. Crops Prod. 2013, 47, 92–101. [Google Scholar] [CrossRef]
- Damián, X.; Fornoni, J.; Domínguez, C.A.; Boege, K.; Baltzer, J. Ontogenetic changes in the phenotypic integration and modularity of leaf functional traits. Funct. Ecol. 2017, 32, 234–246. [Google Scholar] [CrossRef] [Green Version]
- Zhu, M.; Xu, W.; Wen, J.; Zhu, Y.; Li, Y.; Su, Y.; Zhang, Q.; Sun, R. Dynamic changes of photosynthetic properties and chemical compositions of Eucommia ulmoides Oliver under two planting models. Ind. Crops Prod. 2017, 96, 46–56. [Google Scholar] [CrossRef]
- Li, Y.; Wang, S.; Li, Z.; Jin, C.; Liu, M. Genetic diversity and relationships among Chinese Eucommia ulmoides cultivars revealed by sequence-related amplified polymorphism, amplified fragment length polymorphism, and inter-simple sequence repeat markers. Genet. Mol. Res. 2014, 13, 8704–8713. [Google Scholar] [CrossRef] [PubMed]
- Wu, H.; Li, C.; Chen, D.; Li, J.; Huang, H.; Qiao, X.; Zuo, C. Clustering analysis of ancient tea plants in Yunnan Baiying Mountain based on morphological identification and leaf anatomical structure. Chin. Agric. Sci. Bull. 2014, 30, 114–121. [Google Scholar]
- Kaplan, D.R. The science of plant morphology: Definition, history, and role in modern biology. Am. J. Bot. 2001, 88, 1711–1741. [Google Scholar] [CrossRef] [PubMed]
- Samatadze, T.E.; Yurkevich, O.Y.; Hazieva, F.M.; Konyaeva, E.A.; Morozov, A.I.; Zoshchuk, S.A.; Amosova, A.V.; Muravenko, O.V. Agro-Morphological, Microanatomical and Molecular Cytogenetic Characterization of the Medicinal Plant Chelidonium majus L. Plants 2020, 9, 1396. [Google Scholar] [CrossRef]
- He, X.; Cong, P.; Guo, Y.; Lu, J.; Wang, H.; Xue, P.; Zhang, X. Study on drought resistance of four herbs using pressure-volume curve. Acta Sci. Nat. Univ. Nankaiensis 2006, 39, 16–22. [Google Scholar]
- Sun, Q.; Hu, J. Research Technology of Plant Physiology; Northwest Agricultural and Forestry University Press: Yangling, China, 2006. [Google Scholar]
- Wang, A.; Di, B.; Repo, T.; Roitto, M.; Zhang, G. Responses of Parameters for Electrical Impedance Spectroscopy and Pressure- Volume Curves to Drought Stress in Pinus bungeana Seedlings. Forests 2020, 11, 359. [Google Scholar] [CrossRef] [Green Version]
- Ma, B.; Wang, L.; Zhang, K.; Zhang, Y. Study on extraction method of Eucommia ulmoides rubber in laboratory. J. Northwest For. Coll. 1994, 9, 67–69. [Google Scholar]
- Dong, J.; Ma, X.; Wei, Q.; Peng, S.; Zhang, S. Effects of growing location on the contents of secondary metabolites in the leaves of four selected superior clones of Eucommia ulmoides. Ind. Crops Prod. 2011, 34, 1607–1614. [Google Scholar] [CrossRef]
- Ye, J.; Han, W.; Deng, P.; Jiang, Y.; Liu, M.; Li, L.; Li, Z. Comparative transcriptome analysis to identify candidate genes related to chlorogenic acid biosynthesis in Eucommia ulmoides Oliv. Trees 2019, 33, 1373–1384. [Google Scholar] [CrossRef]
- Jing, S.; Li, B. Studies on description system of Hawthorn germplasm resources. Acta Hortic. Sin. 1990, 17, 81–88. [Google Scholar]


| No. | Traits | Abbreviation |
|---|---|---|
| T1 | Leaf length (mm) | LL |
| T2 | Leaf width (mm) | LW |
| T3 | Leaf area (mm2) | LA |
| T4 | Leaf length–width ratio | LWR |
| T5 | Thickness of a single leaf (mm) | TL |
| T6 | Petiole length (mm) | PL |
| T7 | Number of veins | NV |
| T8 | Single leaf weight (g) | WL |
| T9 | Total number of leaves | TNL |
| T10 | Content of gutta-percha (%) | GP |
| T11 | Content of chlorogenic acid (%) | CA |
| T12 | Osmotic potential at turgor loss | ψπ0 |
| T13 | Osmotic potential at full turgor | ψπ100 |
| T14 | Critical water saturation deficit | RWD0 |
| T15 | Relative bound water content at full turgor | Ma |
| Traits | Planting Models a | Tree Ages | Germplasm Number | Min. | Max. | Range | Mean b | SDc | CV d (%) | p Value e |
|---|---|---|---|---|---|---|---|---|---|---|
| LL | L | 1 | 48 | 192.4 | 272.7 | 80.3 | 232.8 A | 17.0 | 7.3 | 0.7236 |
| A | 8 | 56 | 92.7 | 221.3 | 128.6 | 147.1 B | 27.3 | 18.5 | 0.2640 | |
| A | 9 | 56 | 107.0 | 160.3 | 53.3 | 134.5 C | 11.4 | 8.5 | 0.9305 | |
| A | 10 | 56 | 120.7 | 209.3 | 88.6 | 147.6 B | 14.7 | 10.0 | 0.1863 | |
| LW | L | 1 | 48 | 93.0 | 138.2 | 45.2 | 115.2 A | 11.3 | 9.8 | 0.6942 |
| A | 8 | 56 | 39.0 | 94.9 | 55.9 | 63.8 B | 12.5 | 19.6 | 0.1102 | |
| A | 9 | 56 | 46.2 | 80.1 | 33.9 | 60.8 B | 8.3 | 13.7 | 0.0507 | |
| A | 10 | 56 | 51.2 | 93.3 | 42.1 | 66.9 B | 8.0 | 12.0 | 0.1963 | |
| LA | L | 1 | 48 | 12,314.8 | 22,737.1 | 10,422.3 | 17,877.1 A | 2691.1 | 15.1 | 0.3470 |
| A | 8 | 56 | 1971.4 | 12,558.9 | 10,587.5 | 5348.2 B | 1664.0 | 31.1 | 0.1853 | |
| A | 9 | 56 | 3023.0 | 8191.3 | 5168.3 | 4893.3 B | 1002.8 | 20.5 | 0.1302 | |
| A | 10 | 56 | 3383.1 | 11,749.5 | 8366.4 | 5905.9 B | 1054.2 | 17.8 | 0.8026 | |
| LWR | L | 1 | 48 | 1.62 | 2.46 | 0.84 | 2.07 B | 0.19 | 9.1 | 0.9412 |
| A | 8 | 56 | 1.61 | 3.21 | 1.60 | 2.35 A | 0.29 | 12.3 | 0.2370 | |
| A | 9 | 56 | 1.80 | 2.84 | 1.03 | 2.24 A | 0.24 | 10.7 | 0.3822 | |
| A | 10 | 56 | 1.60 | 2.81 | 1.21 | 2.25 A | 0.26 | 11.4 | 0.3881 | |
| TL | L | 1 | 48 | 0.43 | 0.59 | 0.16 | 0.51 A | 0.04 | 7.7 | 0.6184 |
| A | 8 | 56 | 0.14 | 0.40 | 0.26 | 0.25 C | 0.05 | 18.9 | 0.0749 | |
| A | 9 | 56 | 0.18 | 0.36 | 0.18 | 0.26 BC | 0.04 | 15.5 | 0.3698 | |
| A | 10 | 56 | 0.21 | 0.38 | 0.16 | 0.28 B | 0.04 | 13.2 | 0.1244 | |
| PL | L | 1 | 48 | 16.67 | 33.11 | 16.44 | 25.15 A | 1.87 | 7.5 | 0.8569 |
| A | 8 | 56 | 11.51 | 32.73 | 21.22 | 18.27 B | 3.92 | 21.5 | 0.0681 | |
| A | 9 | 56 | 12.32 | 28.48 | 16.16 | 17.82 B | 2.57 | 14.4 | 0.2036 | |
| A | 10 | 56 | 13.26 | 29.51 | 16.25 | 18.77 B | 2.55 | 13.6 | 0.7481 | |
| NV | L | 1 | 48 | 16.2 | 20.1 | 4.0 | 18.2 A | 1.0 | 5.7 | 0.3619 |
| A | 8 | 56 | 12.3 | 19.0 | 6.7 | 15.0 B | 1.4 | 9.1 | 0.1447 | |
| A | 9 | 56 | 12.3 | 18.0 | 5.7 | 15.2 B | 1.3 | 8.7 | 0.4919 | |
| A | 10 | 56 | 13.0 | 18.7 | 5.7 | 15.4 B | 1.0 | 6.6 | 0.0721 | |
| WL | L | 1 | 48 | 1.2328 | 2.6245 | 1.3918 | 1.8318 A | 0.3144 | 17.2 | 0.3674 |
| A | 9 | 56 | 0.1450 | 0.9157 | 0.7707 | 0.3766 B | 0.1081 | 28.7 | 0.5583 | |
| A | 10 | 56 | 0.2027 | 0.9515 | 0.7488 | 0.4275 B | 0.1110 | 26.0 | 0.5641 | |
| TNL | L | 1 | 48 | 24 | 50 | 26 | 35 B | 5 | 15.1 | 0.6885 |
| A | 9 | 56 | 562 | 4060 | 3498 | 1656 A | 550 | 33.2 | 0.1808 | |
| A | 10 | 56 | 347 | 3815 | 3468 | 1878 A | 750 | 39.9 | 0.0843 | |
| GP | L | 1 | 48 | 0.71 | 1.62 | 0.90 | 1.10 B | 0.22 | 19.87 | 0.1229 |
| A | 8 | 55 | 0.87 | 3.20 | 2.33 | 1.75 A | 0.45 | 25.49 | 0.4512 | |
| A | 9 | 56 | 0.90 | 3.29 | 2.40 | 1.79 A | 0.43 | 24.09 | 0.1148 | |
| A | 10 | 56 | 0.67 | 2.95 | 2.28 | 1.92 A | 0.41 | 21.13 | 0.2740 | |
| CA | L | 1 | 48 | 0.56 | 2.79 | 2.22 | 1.62 A | 0.54 | 33.14 | 0.7486 |
| A | 9 | 56 | 0.32 | 2.28 | 1.96 | 1.20 B | 0.41 | 34.49 | 0.5308 | |
| A | 10 | 56 | 0.30 | 2.35 | 2.04 | 1.29 B | 0.48 | 37.49 | 0.5547 | |
| ψπ0 | L | 1 | 48 | 13.06 | 16.81 | 3.75 | 15.09 A | 0.92 | 6.07 | 0.1170 |
| A | 10 | 50 | 12.08 | 16.91 | 4.83 | 14.55 B | 0.79 | 5.46 | 0.0754 | |
| ψπ100 | L | 1 | 48 | 7.98 | 9.99 | 2.01 | 9.09 A | 0.51 | 5.64 | 0.0647 |
| A | 10 | 50 | 7.20 | 9.77 | 2.57 | 8.44 B | 0.56 | 6.62 | 0.9538 | |
| RWD0 | L | 1 | 48 | 6.32 | 14.27 | 7.94 | 9.66 A | 1.71 | 17.69 | 0.2198 |
| A | 10 | 50 | 4.33 | 11.50 | 7.17 | 7.63 B | 1.65 | 21.59 | 0.4522 | |
| Ma | L | 1 | 48 | 0.61 | 0.85 | 0.24 | 0.75 B | 0.05 | 6.25 | 0.3185 |
| A | 10 | 50 | 0.71 | 0.89 | 0.18 | 0.82 A | 0.04 | 5.52 | 0.2169 |
| Traits | Planting Model | Genotype | ||||||
|---|---|---|---|---|---|---|---|---|
| Df | MS | F Value | p Value | Df | MS | F Value | p Value | |
| LL | 1 | 828,917.83 | 1499.442 | 0.000 | 55 | 1855.53 | 3.356 | 0.000 |
| LW | 1 | 264,342.54 | 2093.847 | 0.000 | 55 | 588.84 | 4.664 | 0.000 |
| LA | 1 | 15,420,000,000 | 3019.958 | 0.000 | 55 | 16,918,968.05 | 3.314 | 0.000 |
| LWR | 1 | 3.030 | 35.737 | 0.000 | 55 | 0.359 | 4.229 | 0.000 |
| TL | 1 | 4.667 | 1089.642 | 0.000 | 55 | 0.004 | 0.899 | 0.678 |
| PL | 1 | 5023.425 | 495.826 | 0.000 | 55 | 91.702 | 9.051 | 0.000 |
| NV | 1 | 922.112 | 244.045 | 0.000 | 55 | 8.953 | 2.370 | 0.000 |
| WL | 1 | 117.398 | 1819.325 | 0.000 | 55 | 0.167 | 2.586 | 0.000 |
| TNL | 1 | 309,741,032.2 | 742.662 | 0.000 | 55 | 1,541,740.43 | 3.697 | 0.000 |
| GP | 1 | 43.648 | 415.807 | 0.000 | 55 | 0.857 | 8.162 | 0.000 |
| CA | 1 | 8.455 | 36.671 | 0.000 | 55 | 0.968 | 4.198 | 0.000 |
| ψπ0 | 1 | 17.075 | 7.829 | 0.006 | 46 | 2.296 | 1.053 | 0.391 |
| ψπ100 | 1 | 26.263 | 33.707 | 0.000 | 46 | 1.015 | 1.303 | 0.107 |
| RWD0 | 1 | 815.416 | 44.351 | 0.000 | 46 | 16.858 | 0.917 | 0.627 |
| Ma | 1 | 0.635 | 50.352 | 0.000 | 46 | 0.012 | 0.913 | 0.634 |
| LL | LW | LA | LWR | PL | NV | WL | TNL | GP | CA | |
|---|---|---|---|---|---|---|---|---|---|---|
| LL | 1 | 0.498 ** | 0.724 ** | 0.196 | 0.110 | 0.178 | 0.457 ** | −0.296 * | 0.277 | −0.449 ** |
| LW | 0.701 ** | 1 | 0.933 ** | −0.740 ** | 0.215 | 0.187 | 0.801 ** | −0.211 | 0.006 | −0.399 ** |
| LA | 0.873 ** | 0.940 ** | 1 | −0.496 ** | 0.185 | 0.213 | 0.797 ** | −0.279 | 0.125 | −0.467 ** |
| LWR | 0.133 | −0.604 ** | −0.333 * | 1 | −0.151 | −0.111 | −0.545 ** | −0.019 | 0.191 | 0.090 |
| PL | 0.387 ** | 0.127 | 0.234 | 0.289 * | 1 | 0.218 | 0.229 | −0.134 | 0.057 | −0.168 |
| NV | 0.356 ** | 0.413 ** | 0.426 ** | −0.155 | 0.236 | 1 | 0.055 | 0.026 | 0.108 | −0.017 |
| WL | 0.447 ** | 0.462 ** | 0.524 ** | −0.132 | 0.071 | 0.200 | 1 | −0.080 | 0.153 | −0.363 * |
| TNL | −0.023 | 0.118 | 0.062 | −0.233 | −0.201 | 0.078 | −0.035 | 1 | 0.267 | 0.289 * |
| GP | −0.226 | −0.223 | −0.204 | 0.050 | −0.152 | 0.139 | −0.011 | 0.137 | 1 | −0.315 * |
| CA | −0.174 | −0.203 | −0.181 | 0.068 | −0.219 | −0.015 | −0.079 | 0.157 | 0.240 | 1 |
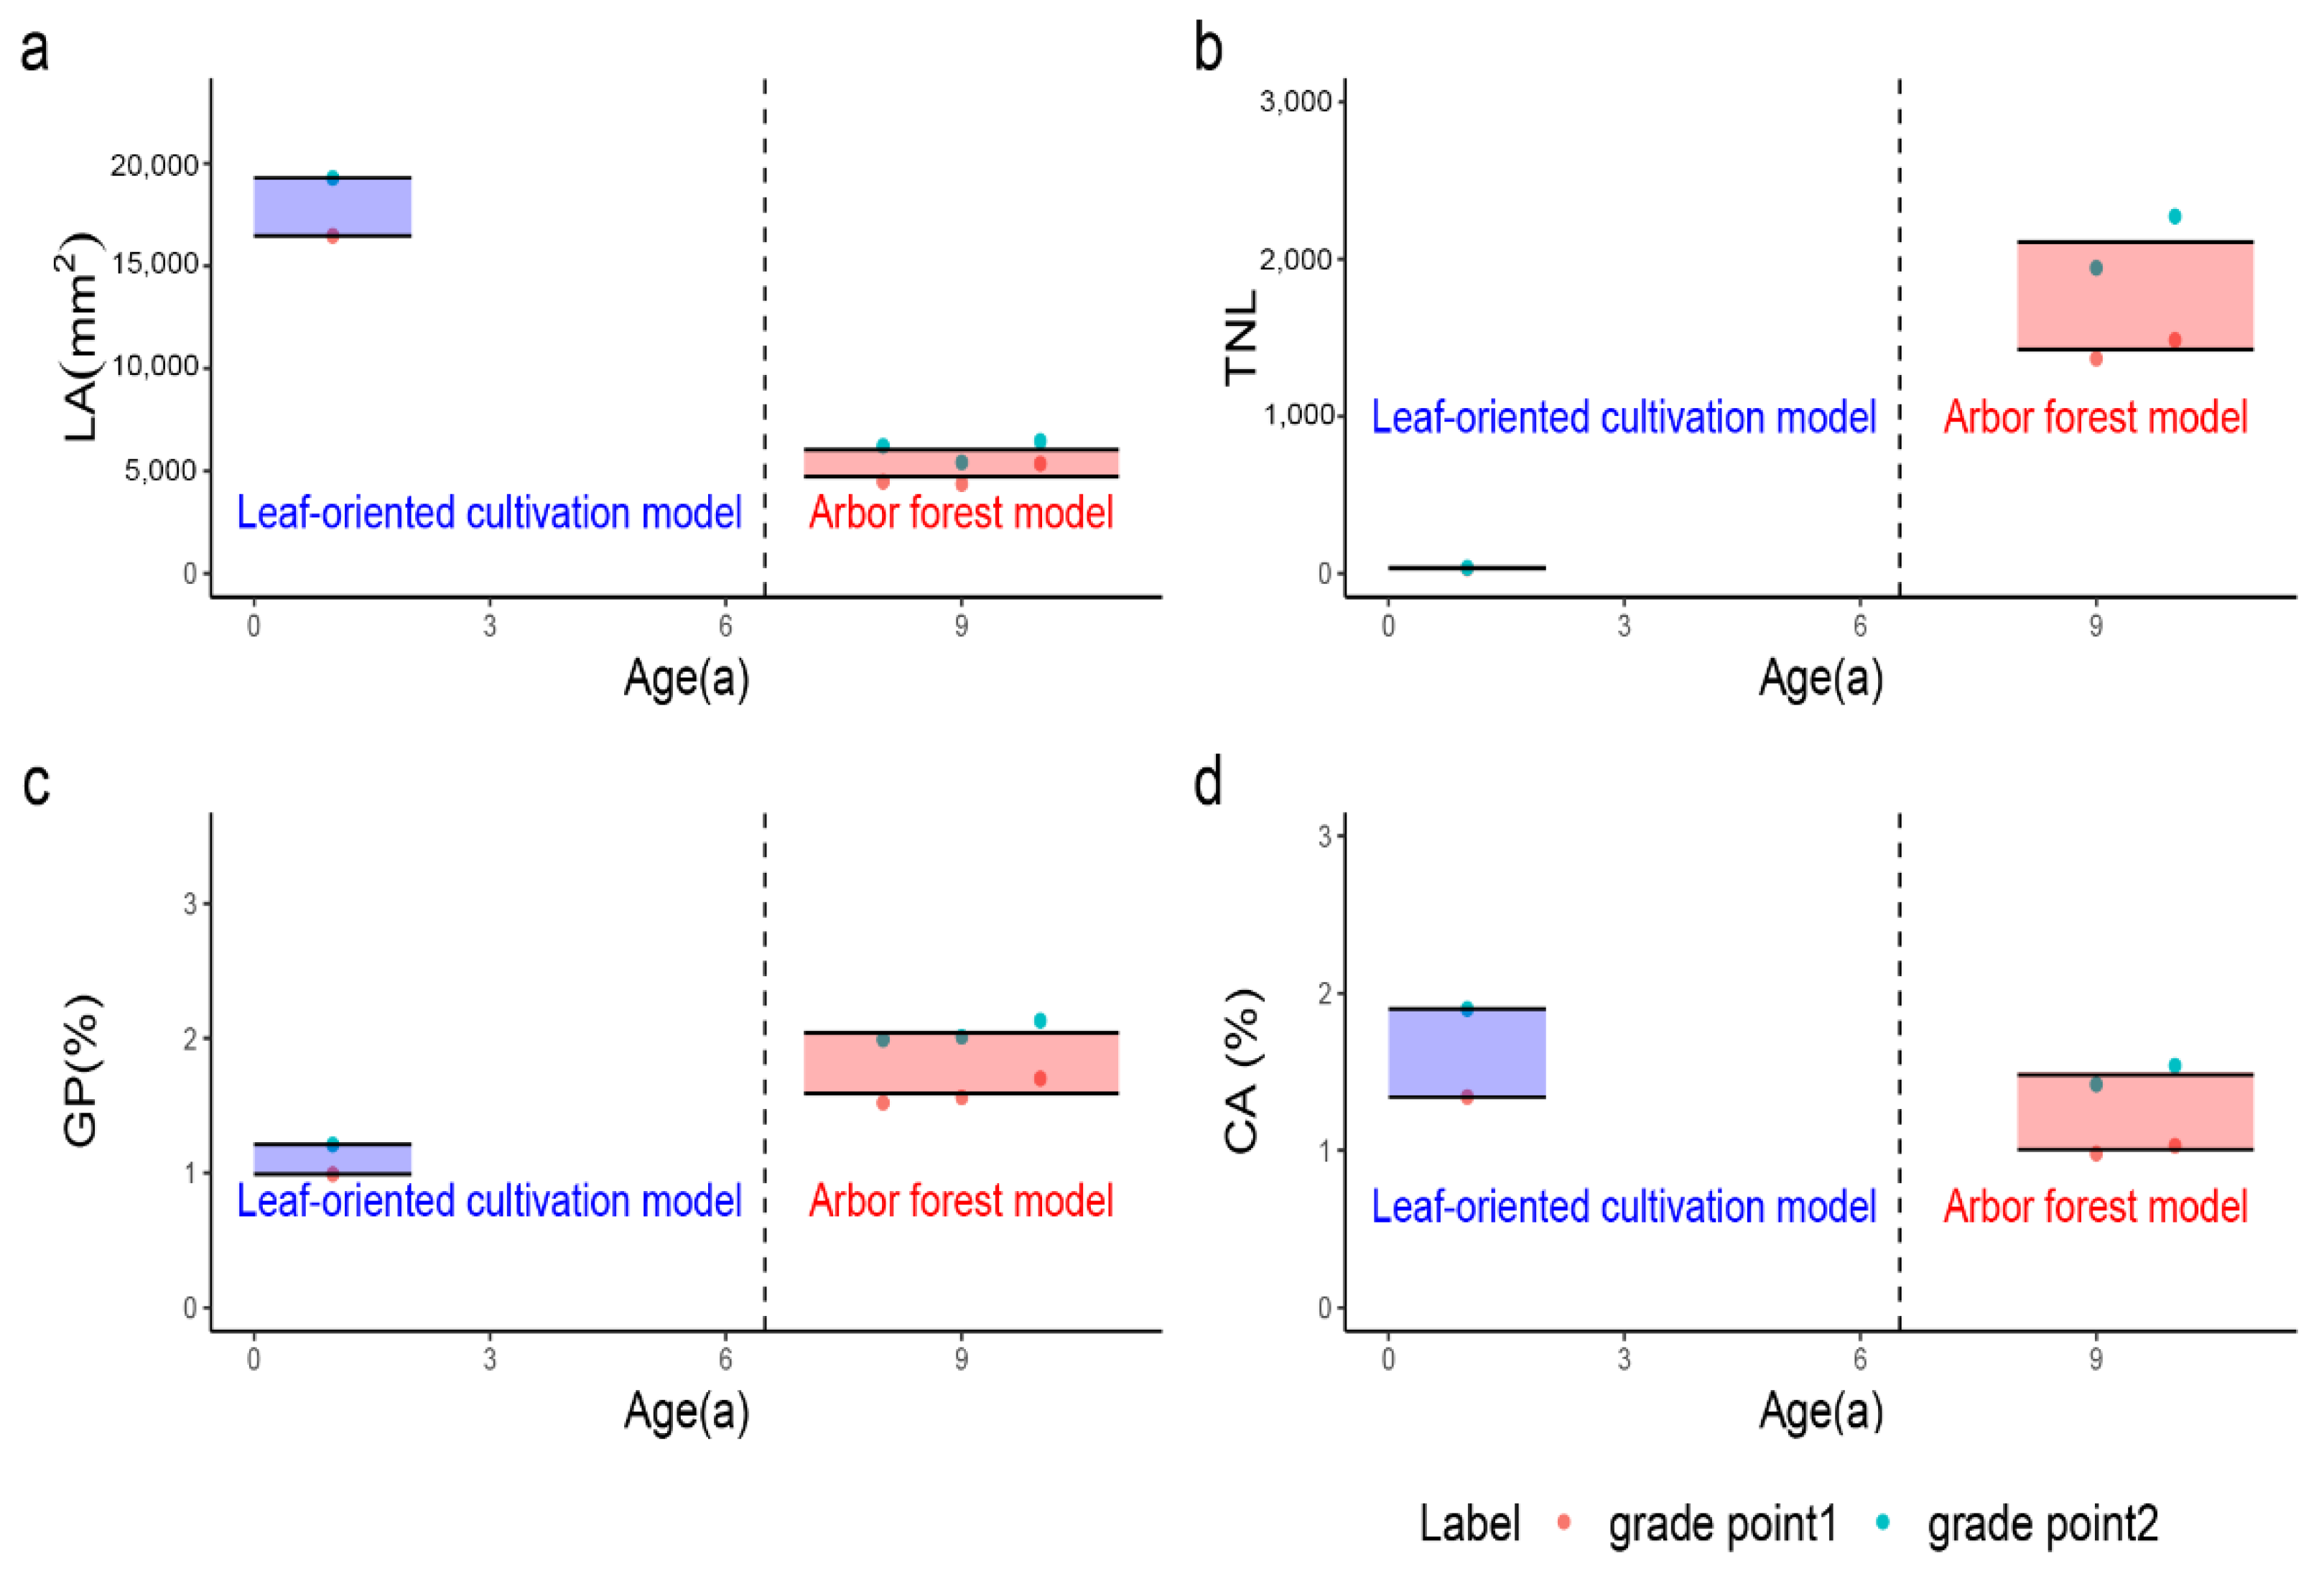
| Traits | Planting Models | Grade | ||
|---|---|---|---|---|
| 1 (Worse) | 2 (Medium) | 3 (Better) | ||
| LA (mm2) | L | ≤16,465 | 16,465–19,230 | ≥19,230 |
| A | ≤4730 | 4730–6035 | ≥6035 | |
| TNL | L | <32 | 32–37 | ≥37 |
| A | <1430 | 1430–2100 | >2100 | |
| GP (%) | L | <1.00 | 1.00–1.20 | >1.20 |
| A | <1.60 | 1.60–2.05 | ≥2.05 | |
| CA (%) | L | <1.35 | 1.35–1.90 | ≥1.90 |
| A | ≤1.00 | 1.00–1.50 | ≥1.50 | |
Publisher’s Note: MDPI stays neutral with regard to jurisdictional claims in published maps and institutional affiliations. |
© 2021 by the authors. Licensee MDPI, Basel, Switzerland. This article is an open access article distributed under the terms and conditions of the Creative Commons Attribution (CC BY) license (https://creativecommons.org/licenses/by/4.0/).
Share and Cite
Deng, P.; Xie, X.; Long, F.; Zhang, L.; Li, Y.; Zhao, Z.; Yang, S.; Wang, Y.; Fan, R.; Li, Z. Trait Variations and Probability Grading Index System on Leaf-Related Traits of Eucommia ulmoides Oliver Germplasm. Plants 2021, 10, 2280. https://doi.org/10.3390/plants10112280
Deng P, Xie X, Long F, Zhang L, Li Y, Zhao Z, Yang S, Wang Y, Fan R, Li Z. Trait Variations and Probability Grading Index System on Leaf-Related Traits of Eucommia ulmoides Oliver Germplasm. Plants. 2021; 10(11):2280. https://doi.org/10.3390/plants10112280
Chicago/Turabian StyleDeng, Peng, Xiangchen Xie, Feiyu Long, Liang Zhang, Yonghang Li, Zhangxu Zhao, Shiyao Yang, Yiran Wang, Ruishen Fan, and Zhouqi Li. 2021. "Trait Variations and Probability Grading Index System on Leaf-Related Traits of Eucommia ulmoides Oliver Germplasm" Plants 10, no. 11: 2280. https://doi.org/10.3390/plants10112280
APA StyleDeng, P., Xie, X., Long, F., Zhang, L., Li, Y., Zhao, Z., Yang, S., Wang, Y., Fan, R., & Li, Z. (2021). Trait Variations and Probability Grading Index System on Leaf-Related Traits of Eucommia ulmoides Oliver Germplasm. Plants, 10(11), 2280. https://doi.org/10.3390/plants10112280