Article

Growth and Physiological Performance of a Coastal Species Trifolium fragiferum as Affected by a Coexistence with Trifolium repens, NaCl Treatment and Inoculation with Rhizobia

1
Department of Plant Physiology, Faculty of Biology, University of Latvia, 1 Jelgavas Str., LV-1004 Riga, Latvia
2
Department of Botany and Ecology, Faculty of Biology, University of Latvia, 1 Jelgavas Str., LV-1004 Riga, Latvia
*
Author to whom correspondence should be addressed.
Plants 2021, 10(10), 2196; https://doi.org/10.3390/plants10102196
Submission received: 12 September 2021 / Revised: 9 October 2021 / Accepted: 13 October 2021 / Published: 16 October 2021
(This article belongs to the Special Issue Plant Physiology and Environmental Stresses)

Abstract

:
The aim of the present study was to analyze the growth and physiological performance of two coexisting species, Trifolium fragiferum, and Trifolium repens, under the effect of NaCl and rhizobial symbiosis. Seeds of T. fragiferum and T. repens were collected from populations in the wild, and plants were cultivated in an automated greenhouse, two plants per container. Three basic types of planting were performed: (1) both plants were T. fragiferum (single species), (2) one T. fragiferum and one T. repens (species coexistence), (3) both plants were T. repens (single species). For every basic type, three subtypes were made: (1) non-inoculated, (2) inoculated with rhizobia taken from T. fargiferum, (3) inoculated with rhizobia taken from T. repens. For every subtype, half of the containers were used as control, and half were treated with NaCl. Shoot fresh mass of plants was significantly (p < 0.001) affected by species coexistence, inoculant, and NaCl. Three significant two-way interactions on plant shoot growth were found: between species coexistence and NaCl (p < 0.001), inoculant and species (p < 0.05), and NaCl and species (p < 0.001). A significant three-way interaction between inoculant, NaCl, and species (p < 0.001) indicated different responses of shoot growth of the two species to inoculant type and NaCl. NaCl treatment was an important factor for T. fragiferum, resulting in better growth in conditions of species coexistence, but the positive effect of bacterial inoculant was significantly more pronounced. A decrease in peroxidase activity in leaves was a good indicator of relative NaCl tolerance, while the absence/presence of rhizobial inoculation was reflected by changes in leaf chlorophyll concentration and photochemical activity of photosystem II. It can be concluded that interaction between biotic and abiotic factors affected the outcome of the coexistence of the two Trifolium species. Distribution of T. fragiferum in sea-affected habitats seems to be related to a higher competitive ability with allied species at increased substrate salinity, based on better physiological salinity tolerance.

1. Introduction

Species rarity is a complex ecological problem [1]. Considering species habitat specificity and geographical range of distribution, functional aspects of plant species’ rarity are extremely important. One promising approach can be the comparison of closely related species growing in the same habitat [2]. However, competition between closely related plant species often is a neglected aspect in ecophysiological studies. When differences in rarity between the coexisting species are evident, more rare species most likely represent a reflection of less competitive and/or adaptive ability in comparison to the more common ones. In particular, it is argued that species on the border of distribution have suppressed adaptive potential resulting in decreased fitness [3]. From a physiological point of view, competitive ability and adaptive potential can be assessed not only through measuring differences in persistence and growth, but also by means of determining variation in physiological and biochemical parameters of adaptive nature.
Trifolium fragiferum L. (strawberry clover) is a perennial stoloniferous clonal legume (Fabaceae) species native to Europe, Asia, and Africa. The species is relatively tolerant to flooding and moderate soil salinity [4], it is sometimes classified as mesohydrohalophilic euhalophyte [5]. In Northern Europe, T. fragiferum is relatively rare and exclusively associated with an endangered habitat Baltic coastal meadow [6]. As an endangered species, T. fragiferum is included in the Regulations of the Cabinet of Ministers of Latvia No. 396, 2000 [7]. Another perennial clover species, Trifolium repens L. (white clover), is more widely distributed within the moist temperate, Mediterranean, and cool subtropical zones. The species has been characterized as possessing relatively low tolerance to salinity [8] together with a good frost tolerance allowing for distribution in cold climates [9]. Both species have commercial importance as forage legumes.
In Latvia, both T. fragiferum and T. repens are present in a salt-affected wet meadow near Lake Liepajas, which is Natura 2000 birds and habitats directives site (“Liepajas ezers” LV0507500) pointing to the interaction between the two species in natural conditions. A relationship between T. repens and T. fragiferum was assessed a relatively long time ago in natural field conditions [10]. It was found that T. repens developed a larger leaf area than T. fragiferum due to the higher number of leaves produced. More recently, clonal growth performance as an evolutionary priority over flowering was studied in non-competitive experiments with T. repens and T. fragiferum [11].
Environmental factors can affect the physiological performance of plants directly or through the interactive effects on plant competition. Increased soil salinity due to inundation with seawater is a significant environmental factor in coastal meadows and coastal marshes [12]. Therefore, it is logical to assume that substrate salinity can be viewed as a main putative abiotic factor modifying the interaction between individuals of T. fragiferum and T. repens. In addition, symbiosis with nitrogen-fixing rhizobia has been described as an important constituent in the mineral nutrition of Trifolium species [13]. The outcome of the interaction between closely related species in conditions of high substrate salinity could be affected by the efficiency of symbiotic nitrogen fixation [14]. Resistance of rhizobial bacteria to soil salinity may differ from that of their host, moreover, the response of symbiotic nodule to salinity can be different from both individual responses [15,16].
Plant physiological performance as a putative indication to adaptations to environmental constraints or competitive ability can be characterized by analysis of a wide range of plant responses, including growth, photosynthesis-related parameters, enzymatic oxidative, and antioxidative processes, as well as biochemical indicators of cellular damage. Non-destructive characterization of the physiological performance of wild plants has been a challenge within the last decades. Thus, fast continuous chlorophyll a fluorescence analysis has been successfully used as a reliable and sensitive method in salinity response studies of coastal marsh species [17] or drought stress tolerance assessment [18]. Other photosynthesis-related traits, including leaf chlorophyll concentration, have become useful characteristics for overall plant responses to various environmental factors [19,20]. Non-respirative enzymatic oxidative activity in plants is often characterized by means of peroxidase and/or polyphenol oxidase activity. It can be related to plant defense responses both through the synthesis of antioxidants and protective substances as well as contribution to enzymatic antioxidative as well as prooxidative systems [21,22,23]. Measurement of electrolyte leakage from plant tissues has been frequently used to assess the degree of damage to cell membranes [24,25]. Another characteristic of oxidative stress-related peroxidative membrane damage is tissue malondialdehyde (MDA) concentration, usually measured by means of analyzing the concentration of thiobarbituric acid-reactive substances (TBARS) [26].
Ion relationships are especially important for salinity-affected plants, as differences in ion compartmentation can result in significant differences in salinity tolerance [27]. For example, K, the only non-structural essential mineral nutrient in plants, is involved in the activation and stabilization of enzymes, membrane functioning, osmotic maintenance [28]. Most importantly, K has been shown to be involved in the mediation of plant adaptive responses to a range of environmental factors, including salinity, through the maintenance of cellular K homeostasis [29,30]. Chemical similarity between Na and K allows predicting the utilization of Na instead of K for several important metabolic functions [31]. For example, it was shown that Na can near completely replace the osmotic function of K in the vacuole in beet plants [31] and several halophyte species [32].
Species interactions have been assessed in field conditions through some experimental manipulation leading to changes in resource availability, and usually comparing responses in respect to the natural gradient of certain environmental factors [33,34] as well as through studies in controlled conditions [35,36]. Recently, more information has become available on the role of soil microorganisms in predicting the outcome of plant species coexistence through multifaceted interactions [37,38] and this also gained a broader theoretical perspective [39]. As field experiments are not suitable for rare plant species in specially protected sites, the aim of the present study was to assess the growth and physiological performance of two coexisting species, T. fragiferum and T. repens, in controlled conditions, as affected by NaCl and rhizobial symbiosis. The hypothesis tested was that T. fragiferum could outcompete T. repens only in conditions of increased substrate salinity. In addition, it was asked: what is the role of nitrogen-fixing rhizobial symbiosis in the outcome of the coexistence between the species, performing artificial inoculation of plants grown in sterile soil with rhizobia?

2. Materials and Methods

2.1. Field Measurements

Field measurements and sampling were performed in a salt-affected wet meadow near Lake Liepajas (Natura 2000 birds and habitats directives site “Liepajas ezers” LV0507500). Three plots with coexisting genets of T. fragiferum and T. repens were selected approximately 200 m from a coastline within a diameter of 50 m (56°29′37″ N, 21°01′40″ E). Soil salinity was measured as electrical conductivity (EC) at each plot in triplicate using an HH2 moisture meter equipped with a WET-2 sensor (Delta-T Devices, Burwell, UK). Lake water EC, Na+, and K+ concentrations were measured in triplicate using LAQUAtwin (Horiba, Kyoto, Japan) compact meters B-771, B-722, and B-731, respectively. Small tissue samples consisting of randomly selected plant parts (stolons, leaf petioles, leaves, flower stalks, flowers) of both species were collected at each plot. The samples were taken to the laboratory, dried in an oven at 60 °C for 72 h, and used for the analysis of Na+ and K+ concentrations as described further (2.5).

2.2. Plant Material, Growth Conditions and Treatments

Seeds of T. fragiferum and T. repens were collected at the end of August 2016 from plants growing in a salt-affected wet meadow near Lake Liepajas, Latvia. The study was performed during the winter season in partially controlled conditions. After drying at room temperature for two weeks, the seeds were stored at 4 °C. Seeds were scarified by hand using a scalpel and imbibed in sterile deionized water for 4 h, then they were sown in sterile plastic tissue culture containers filled with 1 cm autoclaved commercial garden soil (Biolan, Eura, Finland) mixed with sterile deionized water. Containers were placed in a growth cabinet with a 16 h photoperiod (100 µmol m−2 s−1) at 23 °C. After the appearance of the first two true leaves, seedlings were transplanted to sterilized 200 mL plastic containers filled with autoclaved commercial garden soil (Biolan, Eura, Finland) mixed with sterile deionized water (200 mL water per 1 L soil). Containers were kept in sterilized 48 L plastic boxes closed with lids in an experimental automated greenhouse (HortiMax, Maasdijk, Netherlands) with supplemented light from Master SON-TPIA Green Power CG T 400 W (Philips, Amsterdam, Netherlands) and Powerstar HQI-BT 400 W/D PRO (Osram, Munich, Germany) lamps (380 µmol m−2 s−1 at the plant level), 16 h photoperiod, day/night temperature 23/15 °C, relative air humidity 60 to 70% to ensure optimum growth conditions of plants.
After three weeks, plants were transplanted in 1.2 L plastic containers filled with autoclaved commercial garden soil (Biolan, Eura, Finland), two plants per container. Three basic types of planting were performed: (1) both plants were T. fragiferum (single species, TFss), (2) one T. fragiferum and one T. repens (species coexistence, TFsc and TRsc), (3) both plants were T. repens (single species, TRss). For every basic type, three subtypes were made: (1) non-inoculated (−i), (2) inoculated with rhizobia taken from T. fargiferum (+iTF), (3) inoculated with rhizobia taken from T. repens (+iTR). For every subtype, half of the containers were used as control, and half were treated with NaCl as described further. As a result, 18 treatments were established (Table 1) with five containers per treatment.
Bacterial inoculant was prepared from single individual plants of the respective species found at the same site where the seeds were collected. Plant roots were surface sterilized in 50% commercial bleach (ACE, Procter & Gamble, Warszawa, Poland) for 15 min and rinsed thoroughly with sterile deionized water four times. Nodules were detached and bacterial cells were isolated from the nodules according to the standard procedure on yeast-mannitol agar [40]. For inoculation, 6 mL per container of the respective bacterial suspension (about 109 bacterial cells per mL) was used, supplying 1 mL of bacterial suspension in six points evenly over the surface of the substrate. All procedures were performed in a laminar box using sterilized instruments and material.
After transplanting and bacterial inoculation, plants were cultivated for two weeks in the greenhouse in conditions as described above. Individual containers were randomly placed in a greenhouse and were repositioned twice a week. Plants were irrigated with deionized water twice a week not allowing a decrease in substrate moisture lower than 60% water holding capacity. An individual watering system of containers was used to decrease possible contamination with rhizobial bacteria in the early stages of the experiment, where each container had a plastic plate under it for accumulation of excessive water. Substrate water content was monitored with an HH2 moisture meter equipped with a WET-2 sensor (Delta-T Devices, Burwell, UK). Starting from the third week after transplanting, respective containers (treatment +NaCl) were irrigated with an increasing concentration of NaCl. Once a week, +NaCl containers were treated with 50 mL NaCl solution (starting with 25 mM, followed by 50, 100, 200, 300, and 400 mM), but –NaCl plants received 50 mL deionized water.
Plants were irrigated with deionized water when necessary and were fertilized biweekly with a Kristalon Green Label fertilizer (NPK 18-18-18 with micronutrients; Yara International, Oslo, Norway) solubilized in deionized water (150 g L−1), with 5 mL of stock solution per L, 120 mL of the final fertilizer per container. Nitrogen was present both in the form of nitrate-N (9.8%) and ammonia-N (8.2%).

2.3. Assessment of Substrate Electrical Conductivity and Physiological Measurements

Substrate electrical conductivity was measured three times during the plant cultivation (on week 2, 4, and 6) with an HH2 moisture meter equipped with a WET-2 sensor (Delta-T Devices, Burwell, UK). For every container, four separate measurements were performed.
Measurements of leaf chlorophyll concentration and chlorophyll a fluorescence in leaves were started one week after the start of the NaCl treatment (week 1) and were performed weekly for the next five weeks (week 6). Three containers per treatment were randomly selected for analysis each week. For every individual, three fully grown leaves were selected for chlorophyll concentration analysis and another three for analysis of chlorophyll a fluorescence. Chlorophyll concentration was measured by a chlorophyll meter CCM-300 (Opti-Sciences, Hudson, NH, USA). Chlorophyll a fluorescence was measured in leaves dark-adapted for at least 20 min by Handy PEA fluorometer (Hansatech Instruments, King’s Lynn, UK). For characterization of photochemical activity, chlorophyll a fluorescence parameter Performance Index (total) was used. Performance Index is a complex indicator of photochemical efficiency combining three function-related (trapping of absorbed exciton, electron transport between the photosystems, reduction of end-electron acceptors) and structure-related (antenna chlorophyll per reaction center chlorophyll) parameters [41].

2.4. Plant Harvest

The effect of, as described below. The experiment was terminated on week 7. Plant shoots were cut and T. fragiferum and T. repens individuals from treatment combinations with species coexistence were separated according to leaf morphological features. Roots were not used and root parameters were not measured as it would be technically impossible to separate roots of both individuals from different species in species coexistence conditions. Total shoot biomass was measured and samples were collected for biochemical analyses (except for ion measurement). Each sample consisted of several leaf blades or petioles per species per treatment. Plant material from different containers were pooled to obtain the necessary amount (about 1 g fresh mass) per treatment per replication. Except for material for electrolyte leakage measurement, plant tissues were frozen in liquid N2 and stored at –20 °C until analysis.
Plant shoots were dried in an oven at 60 °C for 72 h and then dry mass was measured. The dried material was used for the analysis of ion concentration in different plant parts.

2.5. Measurement of Electrolyte Leakage and Biochemical Parameters

Three replicates per treatment per species were used for the analysis of all biochemical parameters and electrolyte leakage. Plant material from every two containers were pooled, and material from the last fifth container was used as a third replicate.
Dried tissue samples (0.2 g) were used for estimation of Na+ and K+ concentration [42]. Tissues were ground with mortar and pestle to a fine powder and 10 mL of deionized water was added. After filtration through nylon mesh cloth (No. 80) homogenate was used for measurement of ion concentration by LAQUAtwin (Horiba, Kyoto, Japan) compact meters B-722 (Na+) and B-731 (K+).
Malondialdehyde (MDA) content was estimated by measurement of the concentration of thiobarbituric acid-reactive substances (TBARS) according to Aref et al. (2016) [43]. Briefly, frozen plant material was ground with mortar and pestle to a fine powder and extracted with 0.1% trichloroacetic acid (10 mL g−1 FM), centrifuged at 12,000× g at 4 °C. To 1 mL of supernatant 4 mL of 0.5% thiobarbituric acid in 20% trichloroacetic acid was added and heated for 30 min at 90 °C. After rapid cooling in an ice bath, the mixture was centrifuged at 10,000× g for 5 min at room temperature and absorbance was measured at 532 and 600 nm. Results were expressed on a dry mass basis.
Relative electrolyte leakage was measured as described previously [44]. Leaf discs (15 per analysis, 0.5 cm2 each) were prepared from fresh leaves, rinsed with deionized water three times, and immersed in tubes with 10 mL deionized water for 22 h at room temperature. Then, the electrical conductivity of the solution was measured using LAQUAtwin compact conductivity meter B-771 (Horiba Scientific, Kyoto, Japan). Tubes were incubated in a water bath at 80 °C for 2 h, cooled to room temperature, and the final conductivity was measured.
Enzyme activities were measured using a frozen plant material [45]. Briefly, for preparation of extracts, plant tissue was frozen in liquid nitrogen, ground with mortar and pestle to a fine powder, and extracted with 25 mM HEPES/KOH buffer (pH 7.2) containing 1 mM EDTA, 3% polyvinylpolypirrolidone, 0.8% Triton X-100 (5 mL of buffer per g FM) for 15 min. After centrifugation at 15,000× g at 4 °C for 20 min, the supernatant was used for measurement of enzyme activity. Peroxidase activity was measured using guaiacol and H2O2 as substrates, and polyphenol oxidase activity using catechol.

2.6. Data Analysis

For all dependent variables, homogeneity of variance was tested using the Levene test. If a violation was observed then variables were log-transformed. Analysis of variance (ANOVA) was used to test the main effects as well as all two-, three-, and four-way interactions of factors: species, NaCl, inoculant, and species coexistence, if there were enough observations in each combination. A separate ANOVA model was developed for each dependent variable. To estimate the effect size on shoot biomass, bias-corrected estimator ω2 was used. For significant variables, Tukey HSD tests were used as a post hoc test to determine significant differences between factor levels. All analyses were performed using software R 3.4.1 [46].

3. Results

3.1. Field Measurements

Average soil EC in plots with coexisting T. fragiferum un T. repens plants was 238.7 ± 8.8 mS m−1. The EC of the lake water near the sampling site was 4.3 ± 0.6 mS cm−1, and it contained 2.13 ± 0.03 g L−1 Na+ and 0.095 ± 0.003 g L−1 K+.
Coexisting plants of the two allied Trifolium species showed significant differences in Na+ accumulation when growing in a natural saline-affected wetland habitat (Figure 1A). All parts of T. fragiferum plants had significantly more Na+ than these of T. repens. For both species, the highest Na+ concentration was in leaf petioles, significantly decreasing in stolons, flower stalks, and leaves; it was lowest in flowers. The K+ concentration in different parts of the two species was relatively similar (Figure 1B). Leaf petioles and leaves of T. repens had significantly higher K+ concentrations than the respective parts of T. fragiferum. The K+ concentration was significantly lower in flowers of both species in comparison to other parts. In general, the K+:Na+ concentration ratio was significantly higher in respective parts of T. repens in comparison to T. fragiferum (Figure 1C). However, the concentration ratio in flowers of T. fragiferum was significantly higher than in other parts.

3.2. Substrate Salinity

In controlled conditions, substrate electrical conductivity was monitored to document changes in soluble salt concentration due to mineral uptake and fertilization during growth as well as the rise in substrate NaCl concentration due to the gradual increase in salt concentration in a watering solution (Table 2). As expected, the gradual decrease in substrate EC in treatments without NaCl reflected the general depletion of mineral elements in spite of regular fertilization indicating that plants indeed were in nutrient-limiting conditions. According to the results of ANOVA, substrate EC was significantly affected by all single experimental factors (species coexistence, bacterial inoculant, NaCl, and time), as well as by interaction between species coexistence and inoculant, species coexistence, and NaCl, inoculant and NaCl, inoculant and time, as well as NaCl and time (Table 3).

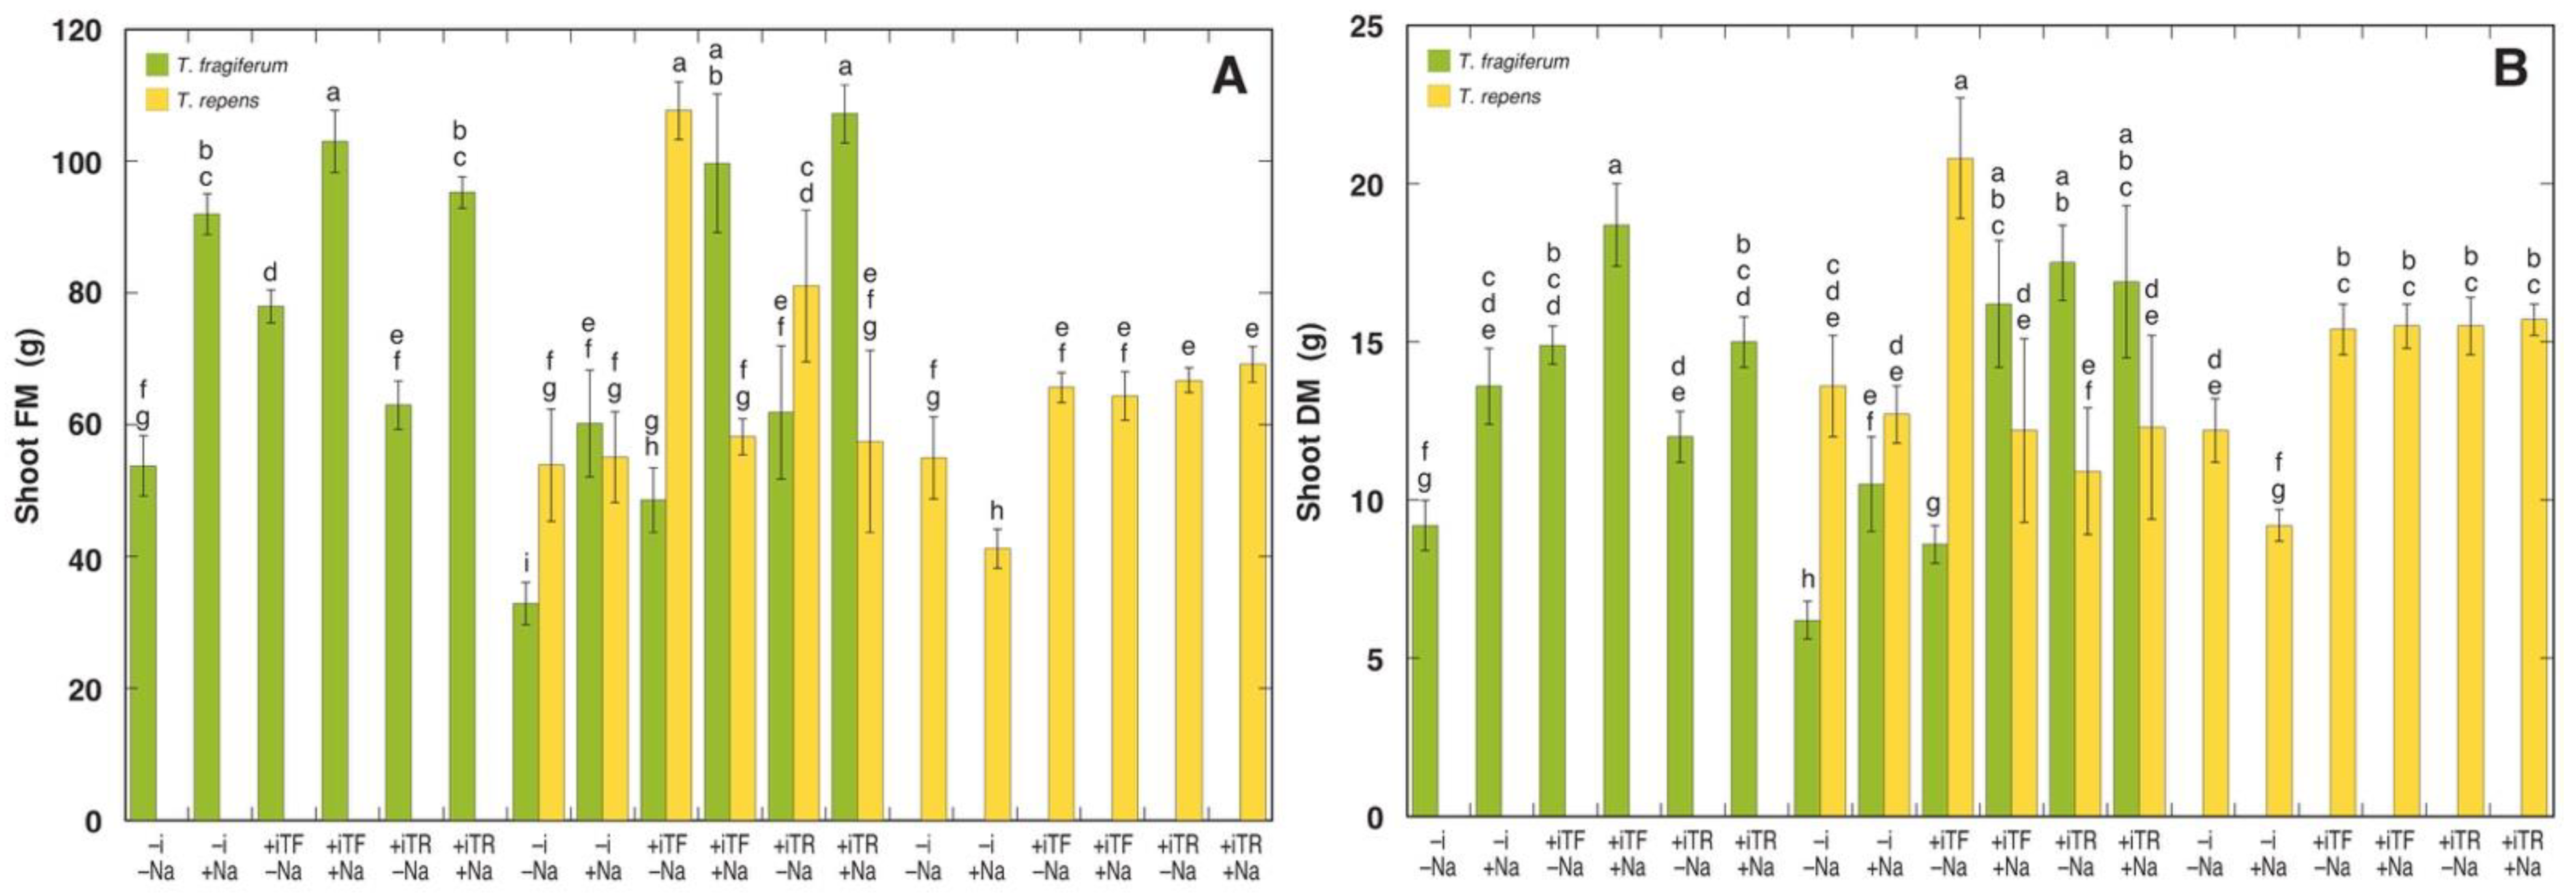
3.3. Morphological Parameters

The main morphological characteristics of plants of the two Trifolium species as affected by the experimental variables are shown in Figure 2 and Table 4. A fresh shoot mass of individual plants of T. fragiferum ranged from 32.9 (species coexistence without inoculant without NaCl) to 107.2 g (species coexistence with inoculant from T. repens and NaCl treatment), and for T. repens it ranged from 41.2 (single species without inoculant with NaCl treatment) to 107.7 g (species coexistence with inoculant from T. fragiferum without NaCl treatment) (Figure 2A). The lowest shoot dry mass for T. fragiferum was also for the treatment with species coexistence without inoculant without NaCl (6.2 g) but the highest was in the case of single species with inoculant from T. fragiferum with NaCl treatment (18.7 g) (Figure 2B). For T. repens, the lowest and highest shoot dry mass values were for the same treatments as in the case of shoot fresh mass (9.2 and 20.8 g, respectively). The lowest and highest number of leaves were in treatments with respectively lower and higher shoot fresh mass for both species (Table 4). The same relationship was evident for total stolon length in T. fragiferum, while in T. repens the highest stolon length corresponded to the highest shoot mass and number of leaves, but the lowest length was in the treatment with species coexistence with inoculant from T. repens and with NaCl treatment. The number of stolons varied from 32.5 (species coexistence with inoculant from T. repens without NaCl) to 77.0 (species coexistence with inoculant from T. repens with NaCl) for T. fragiferum and from 26.8 (single species with inoculant from T. fragiferum without NaCl) to 70.5 (single species with inoculant from T. repens with NaCl) for T. repens. The average stolon length was the less variable morphological trait for T. fragiferum, with values from 21.5 to 37.5 cm; but for T. repens it varied from 14.0 (species coexistence with inoculant from T. repens with NaCl) to 40.5 cm (the treatment with the lowest number of stolons).
In general, tissue water content had a tendency to be lower in T. repens in comparison to T. fragiferum (Table 4). The striking difference was in the case of species coexistence in the presence of inoculant from T. repens, where this combination resulted in low water content in T. fragiferum concomitant with increased water content in T. repens. However, NaCl treatment reversed this effect. There was a tendency for all NaCl treatments to induce higher tissue water content for T. fragfierum, but that was not the case for T. repens.
In respect to shoot fresh mass, ANOVA results indicated a significant effect of species coexistence, inoculant, and NaCl, but for shoot dry mass a significant effect was by inoculant and species (Table 5). Three significant two-way interactions were found: between species coexistence and NaCl, inoculant and species, and NaCl and species, for both fresh mass and dry mass. A significant three-way interaction between inoculant, NaCl, and species indicated different responses of T. fragiferum and T. repens shoot growth on inoculant type and NaCl treatment. Details on the relative effect of NaCl, inoculation, and species coexistence on shoot fresh and dry mass are shown in Table 6, Table 7 and Table 8.
For T. fragiferum, NaCl treatment had a significant stimulative effect for both fresh and dry mass, except in the treatment with species coexistence and inoculant from T. repens where it had no effect (Table 6). The highest positive effect from NaCl treatment was for T. fragiferum plants with species coexistence, inoculated with bacteria isolated from the same species, reaching 205 and 188% for fresh mass and dry mass, respectively, as compared to respective controls without NaCl. For non-inoculated T. repens plants in single species conditions, NaCl treatment had a significant negative effect, but it was fully reversed by species coexistence. Inoculation of T. repens plants in single species conditions with bacteria isolated from either species also fully reversed the negative consequences of NaCl treatment on shoot growth. However, when T. repens plants inoculated with rhizobia from T. fragiferum were cultivated together with T. fragiferum plants, NaCl treatment led to a dramatic decrease in shoot growth. The results for growth of T. repens in species coexistence conditions, when plants were inoculated with rhizobia from the same species, were somehow contradictory, as no recovery from NaCl treatment was evident in respect to fresh mass but there was full recovery for a dry mass.
Inoculation of single species NaCl non-treated T. fragiferum plants with rhizobia from the same species resulted in significant growth stimulation (Table 7). The effect of rhizobia from T. repens was less pronounced and non-significant for fresh mass. When T. fragiferum plants without species coexistence were treated with NaCl, which itself stimulated shoot growth, the stimulative effect of inoculation was less pronounced for rhizobia from T. fragiferum with a non-significant effect for fresh mass, while in the case of rhizobia from T. repens it was stimulated for fresh mass and smoothed out for dry mass. For T. fragiferum plants in species coexistence conditions, the stimulative effect of rhizobial inoculation was less pronounced in the case of bacteria from T. fragiferum without NaCl treatment, but clearly more pronounced for all other treatment combinations. The highest positive effect was caused by inoculation with rhizobia from T. repens without NaCl treatment, where relative growth reached 188 and 280%, for fresh and dry mass, respectively, as compared to the respective controls without inoculant. Inoculation of T. repens plants with either inoculant without NaCl treatment resulted in a more pronounced stimulation of fresh mass accumulation than dry mass accumulation, while for NaCl-treated plants only dry mass accumulation was stimulated. Inoculation of T. repens plants in species coexistence conditions, in general, showed opposite effects on fresh and dry mass accumulation to those evident in single species conditions. There was no significant effect of inoculation on shoot dry mass accumulation except in treatment with rhizobia from T. fragiferum without NaCl. Shoot fresh mass increased in all treatment combinations, but the effect was not statistically significant for inoculation with rhizobia from T. fragiferum without NaCl.
Species coexistence had negative consequences for the growth of T. fragiferum without inoculation in treatment combinations both with and without NaCl as evident by the significant decrease in both fresh and dry mass (Table 8). The same level of growth inhibition of T. fragiferum by species coexistence was seen for the plants inoculated with rhizobia from T. fragiferum and without NaCl treatment, but NaCl treatment eliminated this negative effect. In the case of inoculation of T. fragiferum plants with rhizobia from T. repens, species coexistence had no effect on growth, or it was positive in the case of dry mass in the treatment without NaCl. For non-inoculated T. repens plants without NaCl treatment, species coexistence had no effect on growth, but the effect was positive in the case of NaCl treatment. T. repens plants inoculated with rhizobia from T. fragiferum positively responded to species coexistence when there was no NaCl addition, but in NaCl-treated plants there was no effect of species interaction for fresh mass, but the effect was negative for dry mass. In the case of T. repens plants inoculated with rhizobia from T. repens, species coexistence had no significant stimulative effect on shoot growth. Moreover, for dry mass in plants without NaCl treatment the effect was significantly negative.

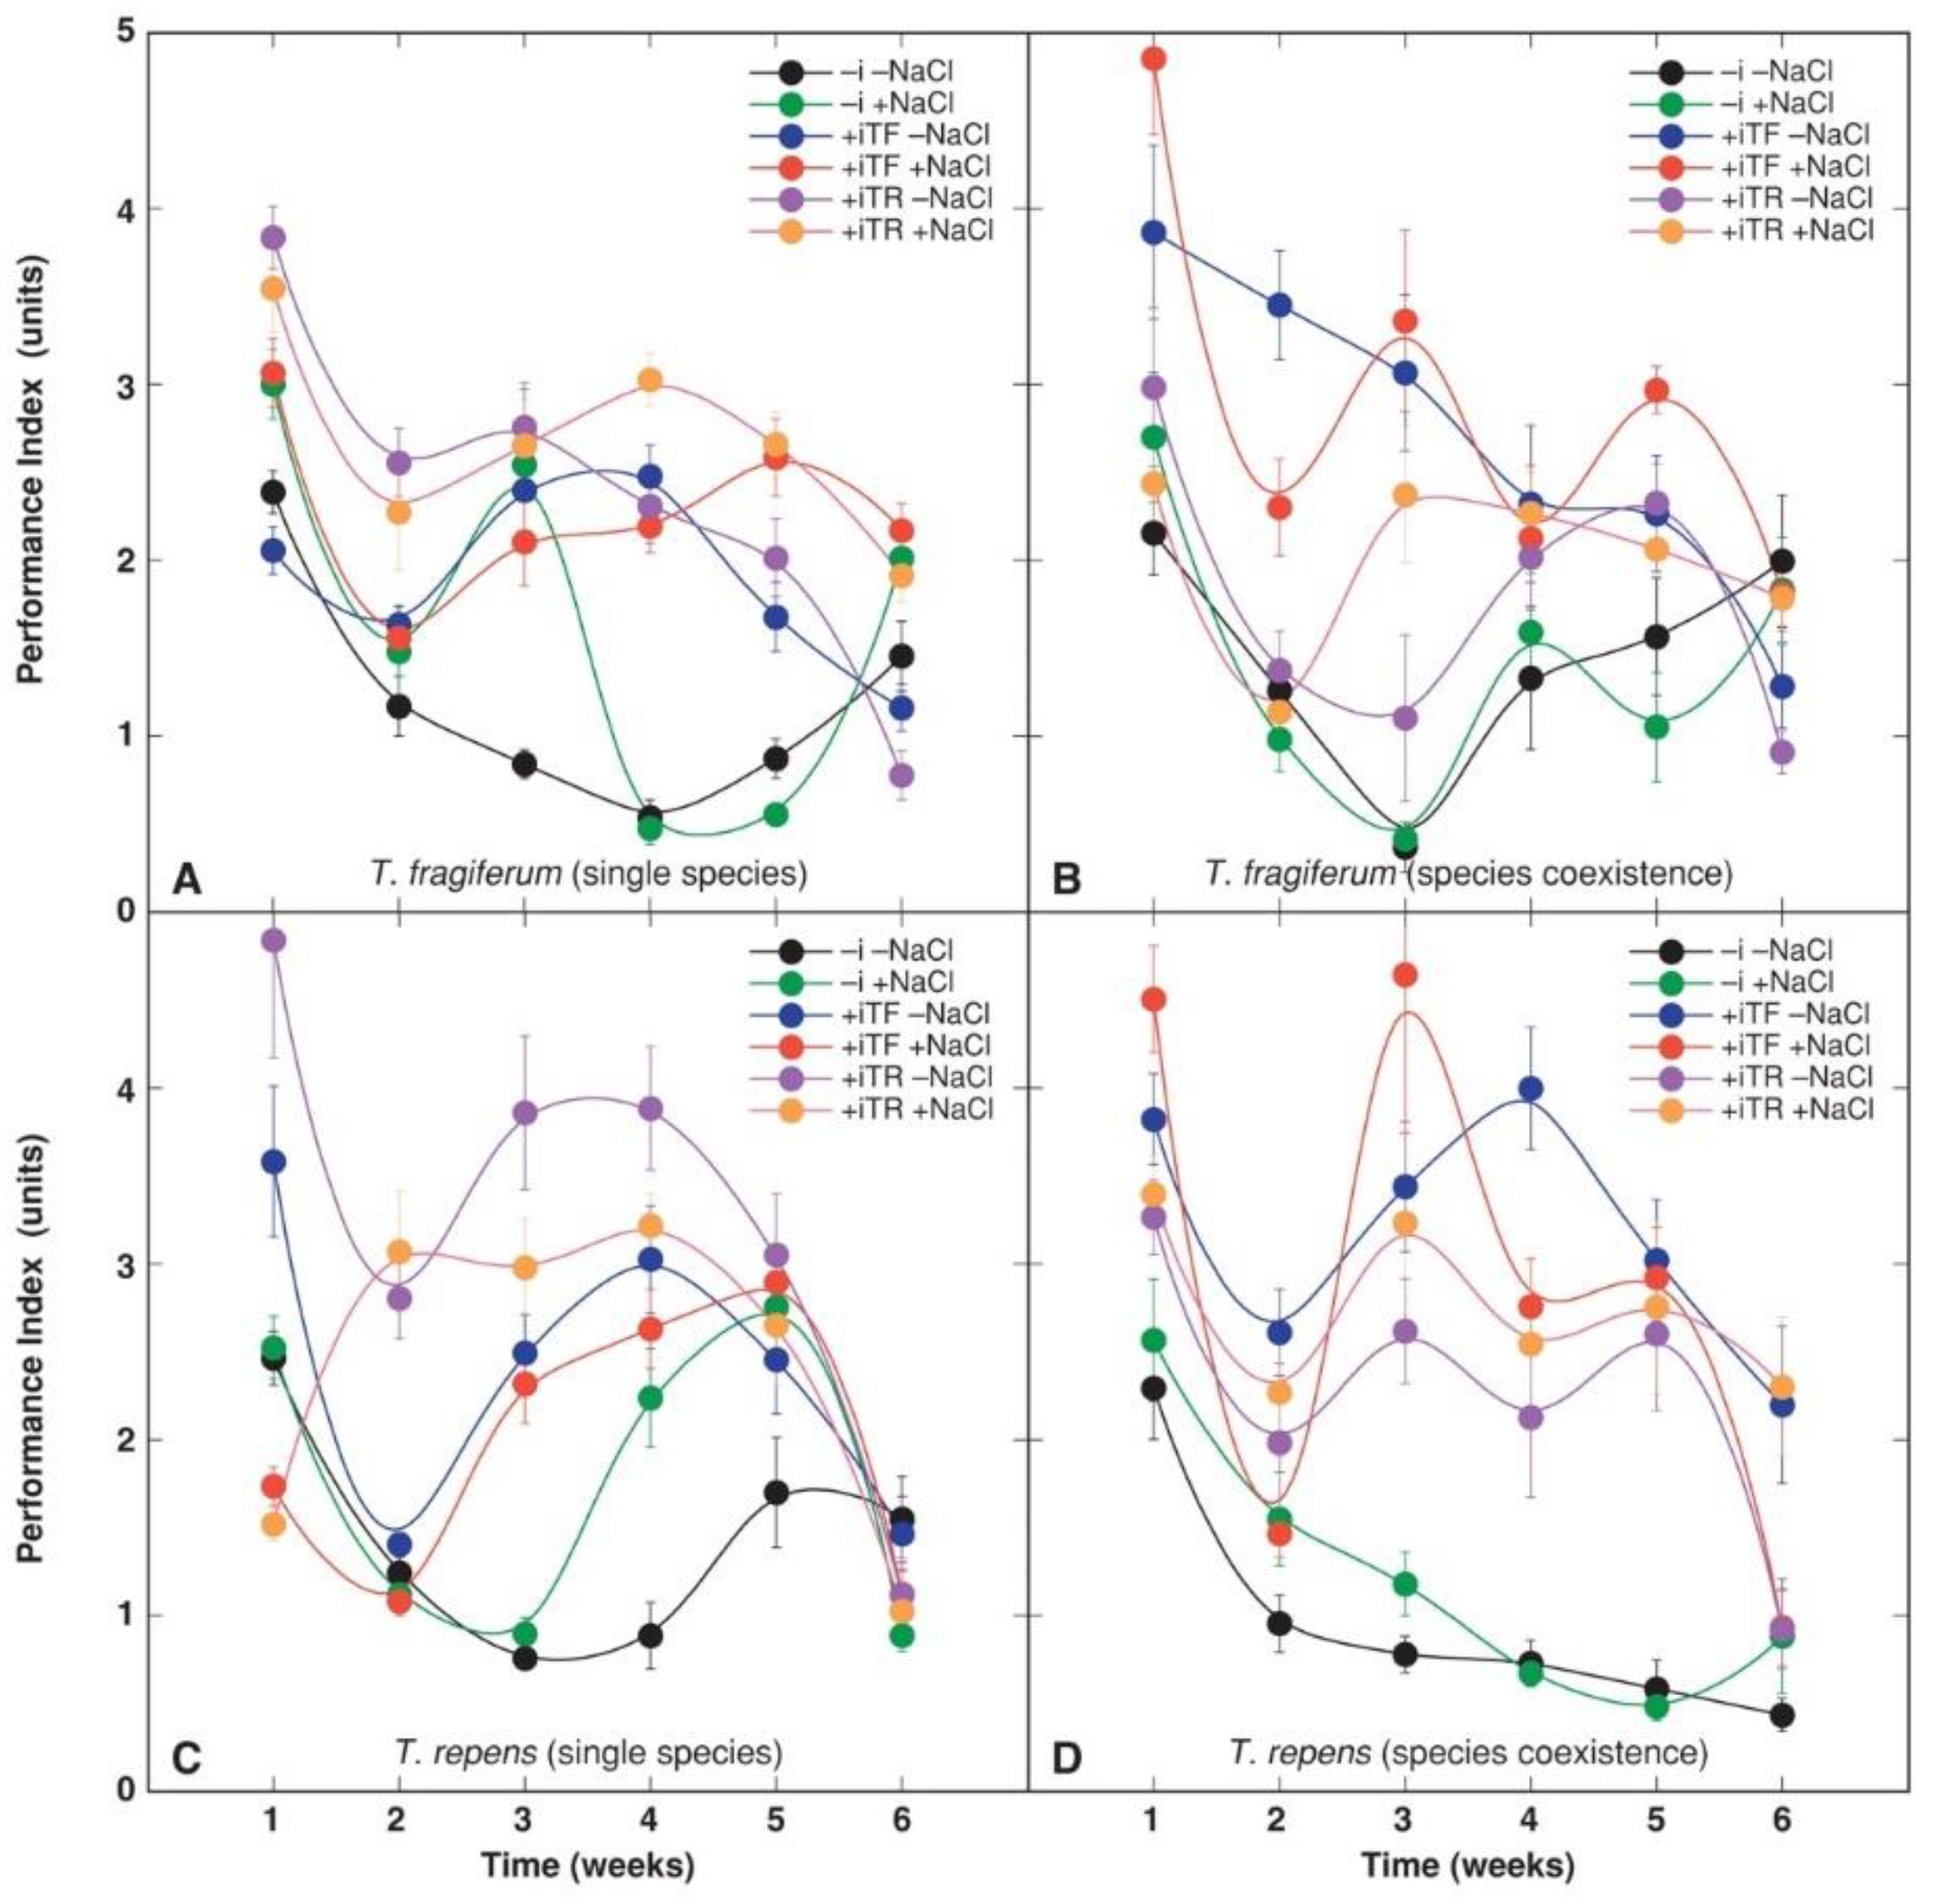
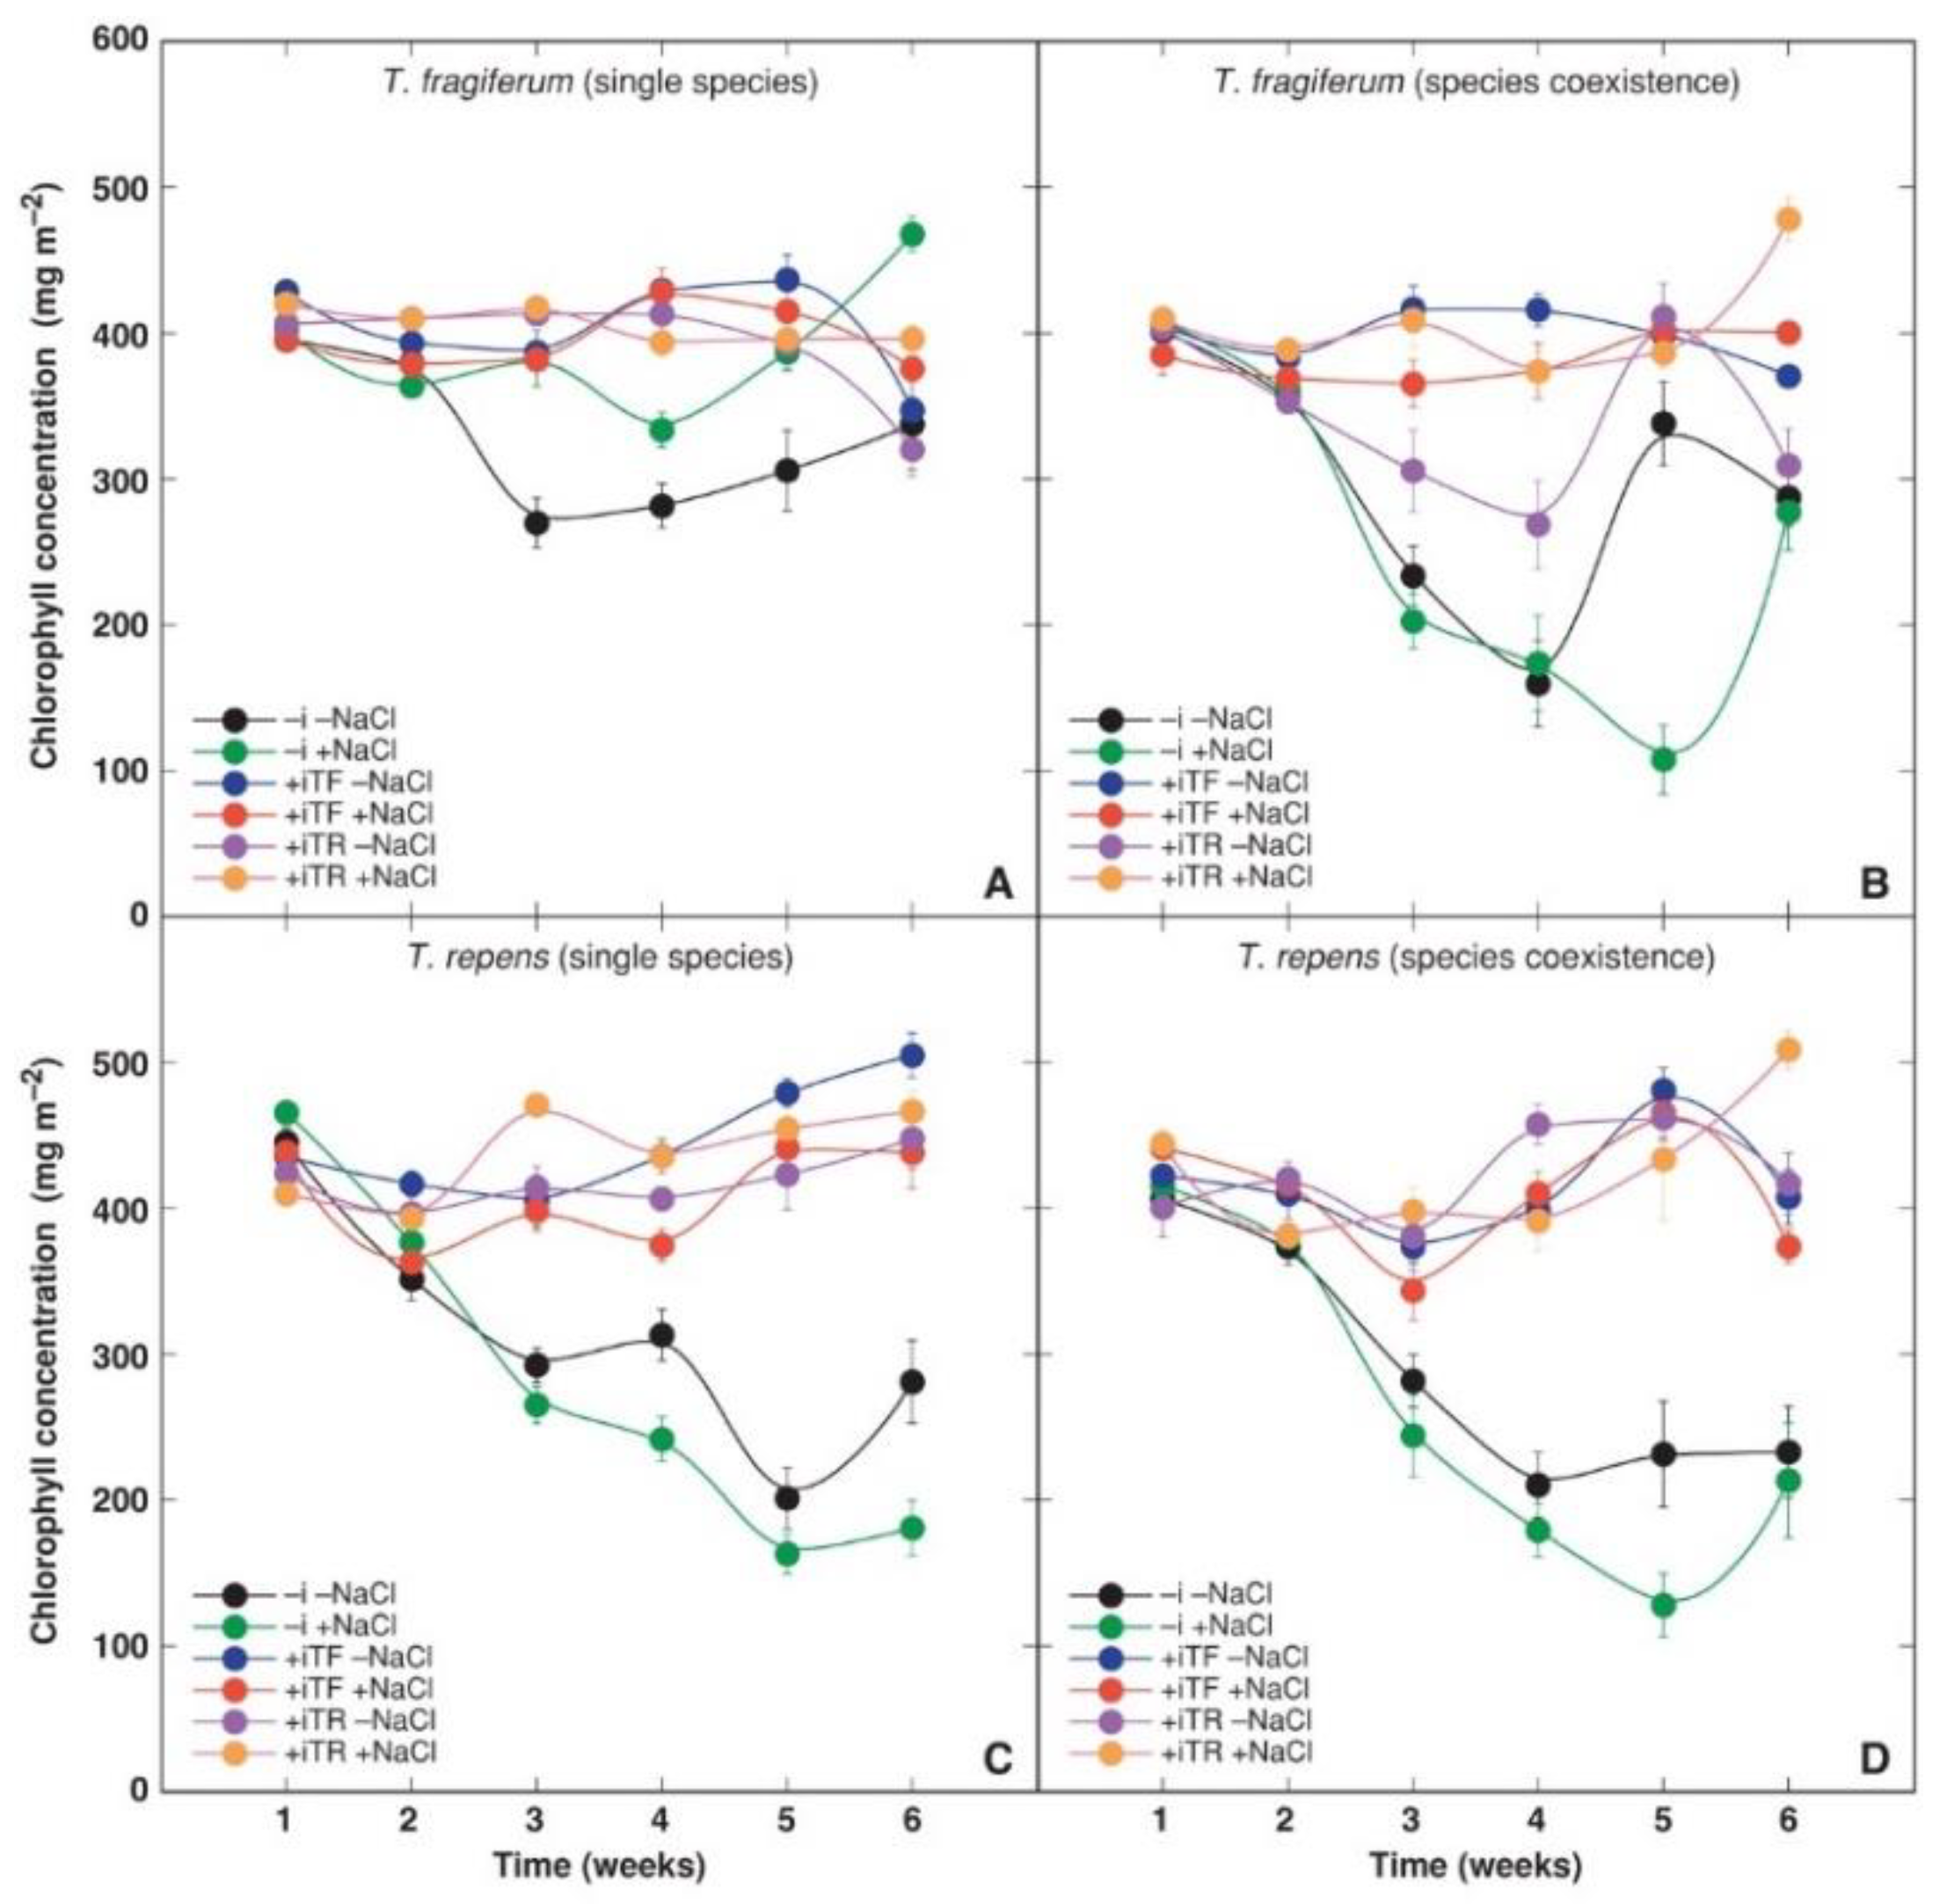
3.4. Physiological Parameters

Photosynthesis-related parameters leaf chlorophyll concentration and chlorophyll a fluorescence-related Performance Index were measured non-destructively during the experiment to follow physiological changes in plants due to various treatment combinations. Leaf chlorophyll concentration seemed to be a relatively stable parameter (Figure 3). ANOVA results indicated that leaf chlorophyll concentration was significantly affected by species coexistence and inoculant but not by NaCl (Table 9). Moreover, the parameter was species-specific and significantly changed with time. A number of significant two-way interactions were found: between species coexistence and inoculant, species coexistence and NaCl, inoculant and NaCl, inoculant and species, NaCl and time, species coexistence and time, and inoculant and time (Table 9). Highly significant three-way interactions were evident between species coexistence, inoculant, and NaCl; inoculant, NaCl, and species indicated that NaCl modified the effects of other factors and their interactions.
The negative effect of the absence of inoculant on leaf chlorophyll concentration was less pronounced in T. fragiferum plants in single species conditions, with NaCl treatment partially abolishing this effect (Figure 3A). A more pronounced decrease in chlorophyll concentration in T. fragiferum plants due to the absence of bacterial inoculation was evident in conditions of species coexistence (Figure 3B). For these plants, also treatment with inoculant from T. repens resulted in a temporary decrease in chlorophyll concentration, but NaCl treatment completely abolished this effect. Recovery of chlorophyll concentration during the final part of the experiment indicated possible contamination of plants with rhizobia. In T. repens, the chlorophyll concentration was also negatively affected by the absence of rhizobia and this effect was relatively similar for plants grown in single species (Figure 3C) and species coexistence conditions (Figure 3D).
The time course of the Performance Index showed more variability in respect to species, timing, and different treatments (Figure 4). According to the results of ANOVA, Performance Index was significantly affected by inoculant, was species-specific, and changed with time (Table 9). As in the case of chlorophyll concentration, also for Performance Index, several two-way interactions were significant: between species coexistence and inoculant, species coexistence and NaCl, inoculant and NaCl, inoculant and species, NaCl and time, species coexistence and time, inoculant and time, and species and time. Among the three-way interactions, the one between species coexistence, inoculant, and time was more significant.
For T. fragiferum plants in single species conditions, all rhizobial inoculation treatments showed an increased level of Performance Index, while the timing of the effect differed in dependence on the inoculant used (Figure 4A). NaCl treatment significantly increased the Performance Index in non-inoculated plants only for 3 weeks, but the effect was longer in the case of inoculation with rhizobia from T. fragiferum (4 weeks) and T. repens (5 weeks). Under species coexistence, inoculation with rhizobia from T. repens did not initially stimulate the Performance Index, but further, some positive effect was evident in NaCl-treated plants (Figure 4B). In contrast, plants responded positively to inoculation with rhizobia from T. fragiferum. In general, NaCl treatment had no significant effect on the Performance Index in species coexistence conditions.
Inoculation of T. repens plants with rhizobia had a significant initial stimulative effect on the Performance Index that was more pronounced in the case of inoculants from T. repens (Figure 4C). At this stage, NaCl treatment resulted in a significant decrease in the Performance Index of inoculated plants even below the level found in non-inoculated plants. With increasing substrate salinity, Performance Index values recovered up to the level found in respective treatments without NaCl addition. A positive effect of rhizobial inoculation was significant during the middle part of the experiment, after some pronounced decline of the parameter at week 2. Species coexistence had similar initial effects on the Performance Index of T. repens plants (Figure 4D) similar to those in T. fragiferum in species coexistence conditions. Plants inoculated with rhizobia from T. fragiferum and treated with NaCl had a higher level of Performance Index in the middle part of the experiment, but these inoculated with rhizobia from T. repens had a lower value, in comparison to conditions without species coexistence.

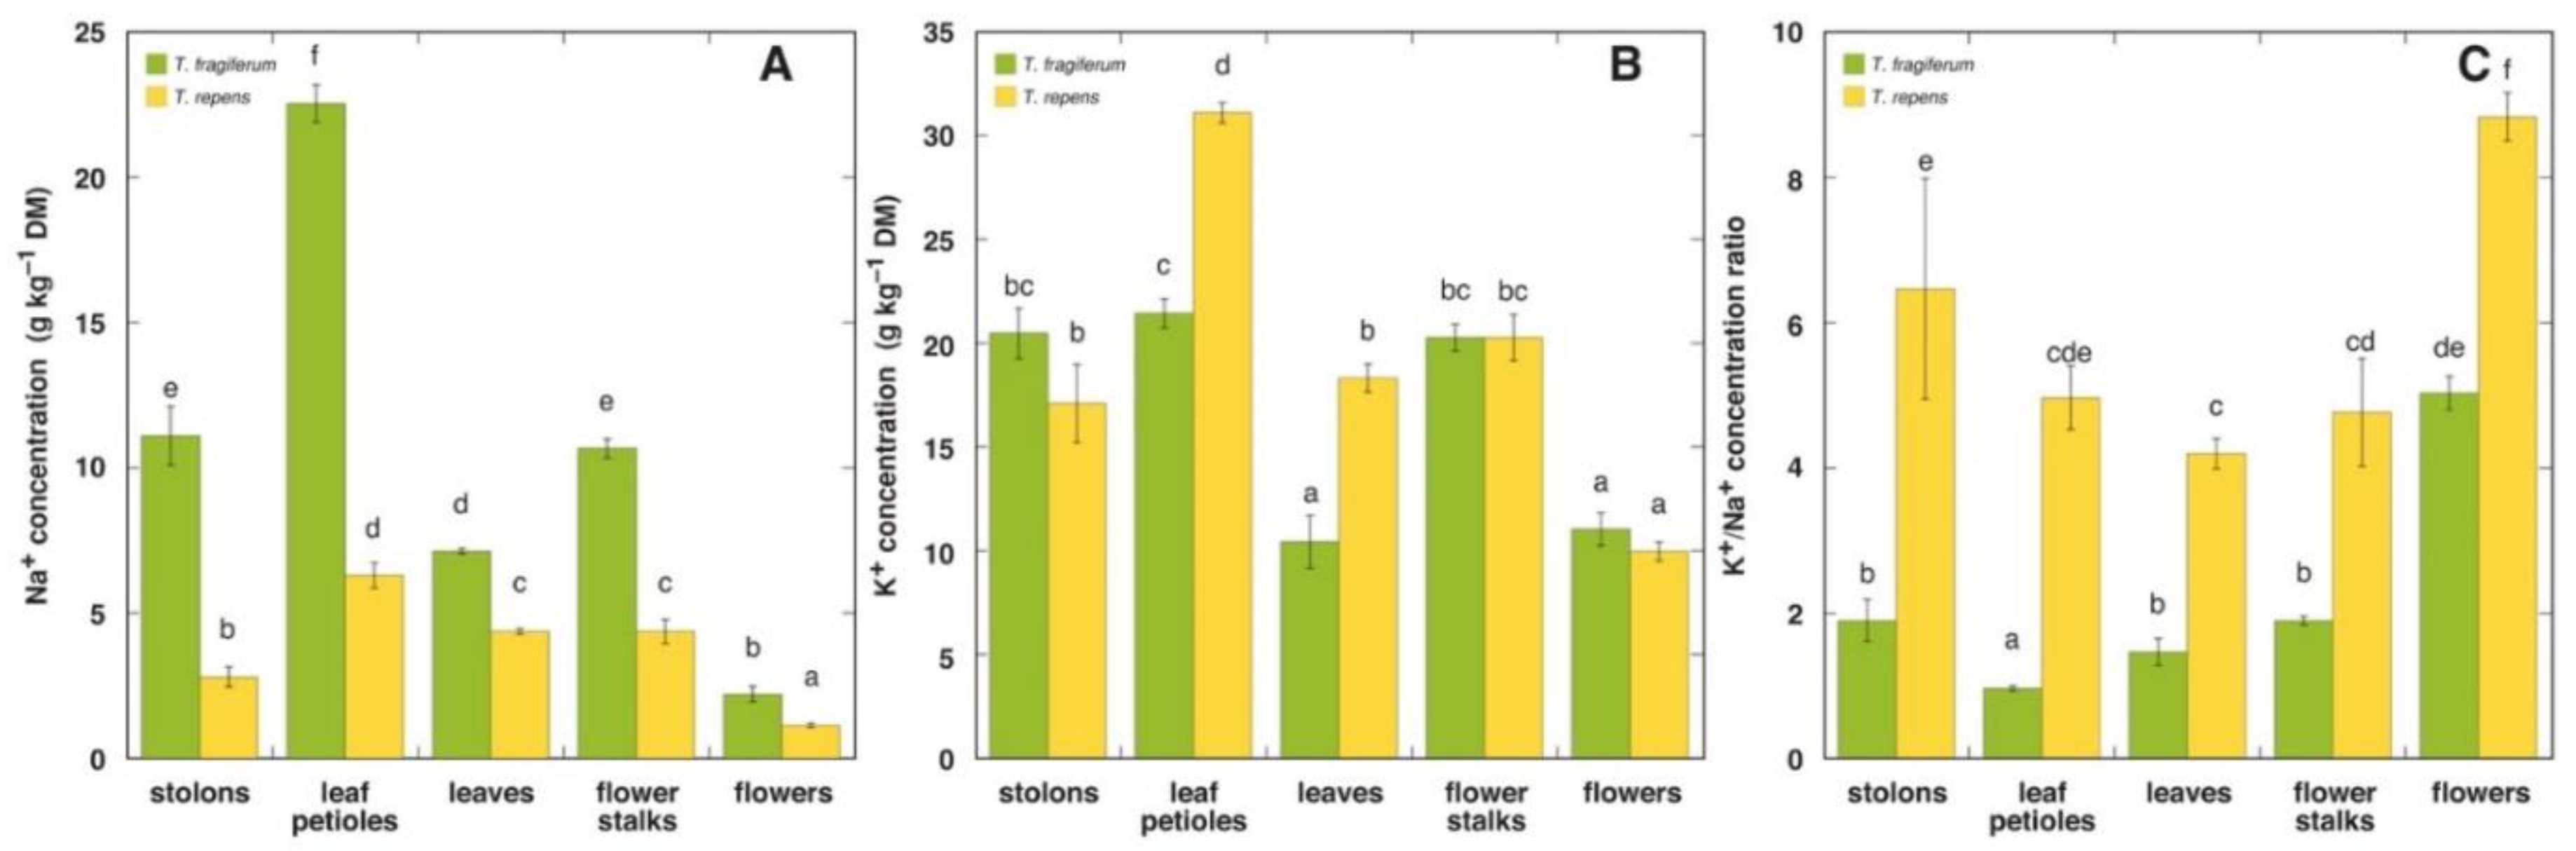
3.5. Ion Concentration

In T. fragiferum plants, treated with NaCl, the highest average concentration of Na+ accumulated in petioles, followed by stolons and leaves (Table 5). In NaCl-treated T. repens plants, the highest concentration of Na+ was found in petioles, followed by flower stalks, leaves, stolons and flowers. According to results of ANOVA, species had significant effect on Na+ concentration in all plant parts (Table 10). Concentration of Na+ was significantly lower in parts of T. repens, with a relative concentration of 38, 49 and 41%, in comparison to stolons, leaves and petioles, respectively, of T. fragiferum. Species coexistence significantly affected Na+ concentration only in stolons and petioles (Table 10). The effect in general was negative in all parts of T. fragiferum, but not always statistically significant. However, negative effect of species coexistence on accumulation of Na+ was less pronounced in T. repens.
The highest average K+ concentration in T. fragiferum was found in petioles, followed by leaves and stolons (Table 11). For T. repens plants, K+ concentration decreased in the order: flowers > petioles > leaves > flower stalks > stolons. ANOVA results showed that no factor had a significant effect on K+ concentration in stolons and petioles, but in leaves, it was significantly affected by species coexistence and species (Table 12). T. fragiferum in single species conditions had a higher K+ concentration in leaves in comparison to that in T. repens in single species conditions. In several combinations, there was a significant effect of NaCl treatment on K+ concentration (Table 11). In leaves of T. fragiferum, K+ decreased in NaCl-treated plants with species coexistence (72 to 80% relative to respective NaCl non-treated plants) and in plants inoculated with rhizobia from T. repens in single species conditions (75%). In petioles of T. fragiferum negative effect of NaCl treatment on K+ concentration was found in plants in single species conditions (72 to 80%) and in plants without inoculant (73%) or inoculated with rhizobia from T. repens (74%) in species coexistence conditions. In contrast, a positive effect of NaCl treatment on K+ concentration prevailed in T. repens plants. The effect was especially pronounced in petioles and flower stalks, where NaCl treatment increased tissue K+ concentration in all combinations except plants without species coexistence, inoculated with rhizobia from T. repens. The effect ranged from 129 to 223% in flower stalks and 113 to 164% in petioles, in comparison to K+ concentration in non-treated plants.
The leaf K+:Na+ concentration ratio, in general, was higher for T. repens than that for T. fragiferum, both in NaCl-treated and non-treated plants (Table 11).

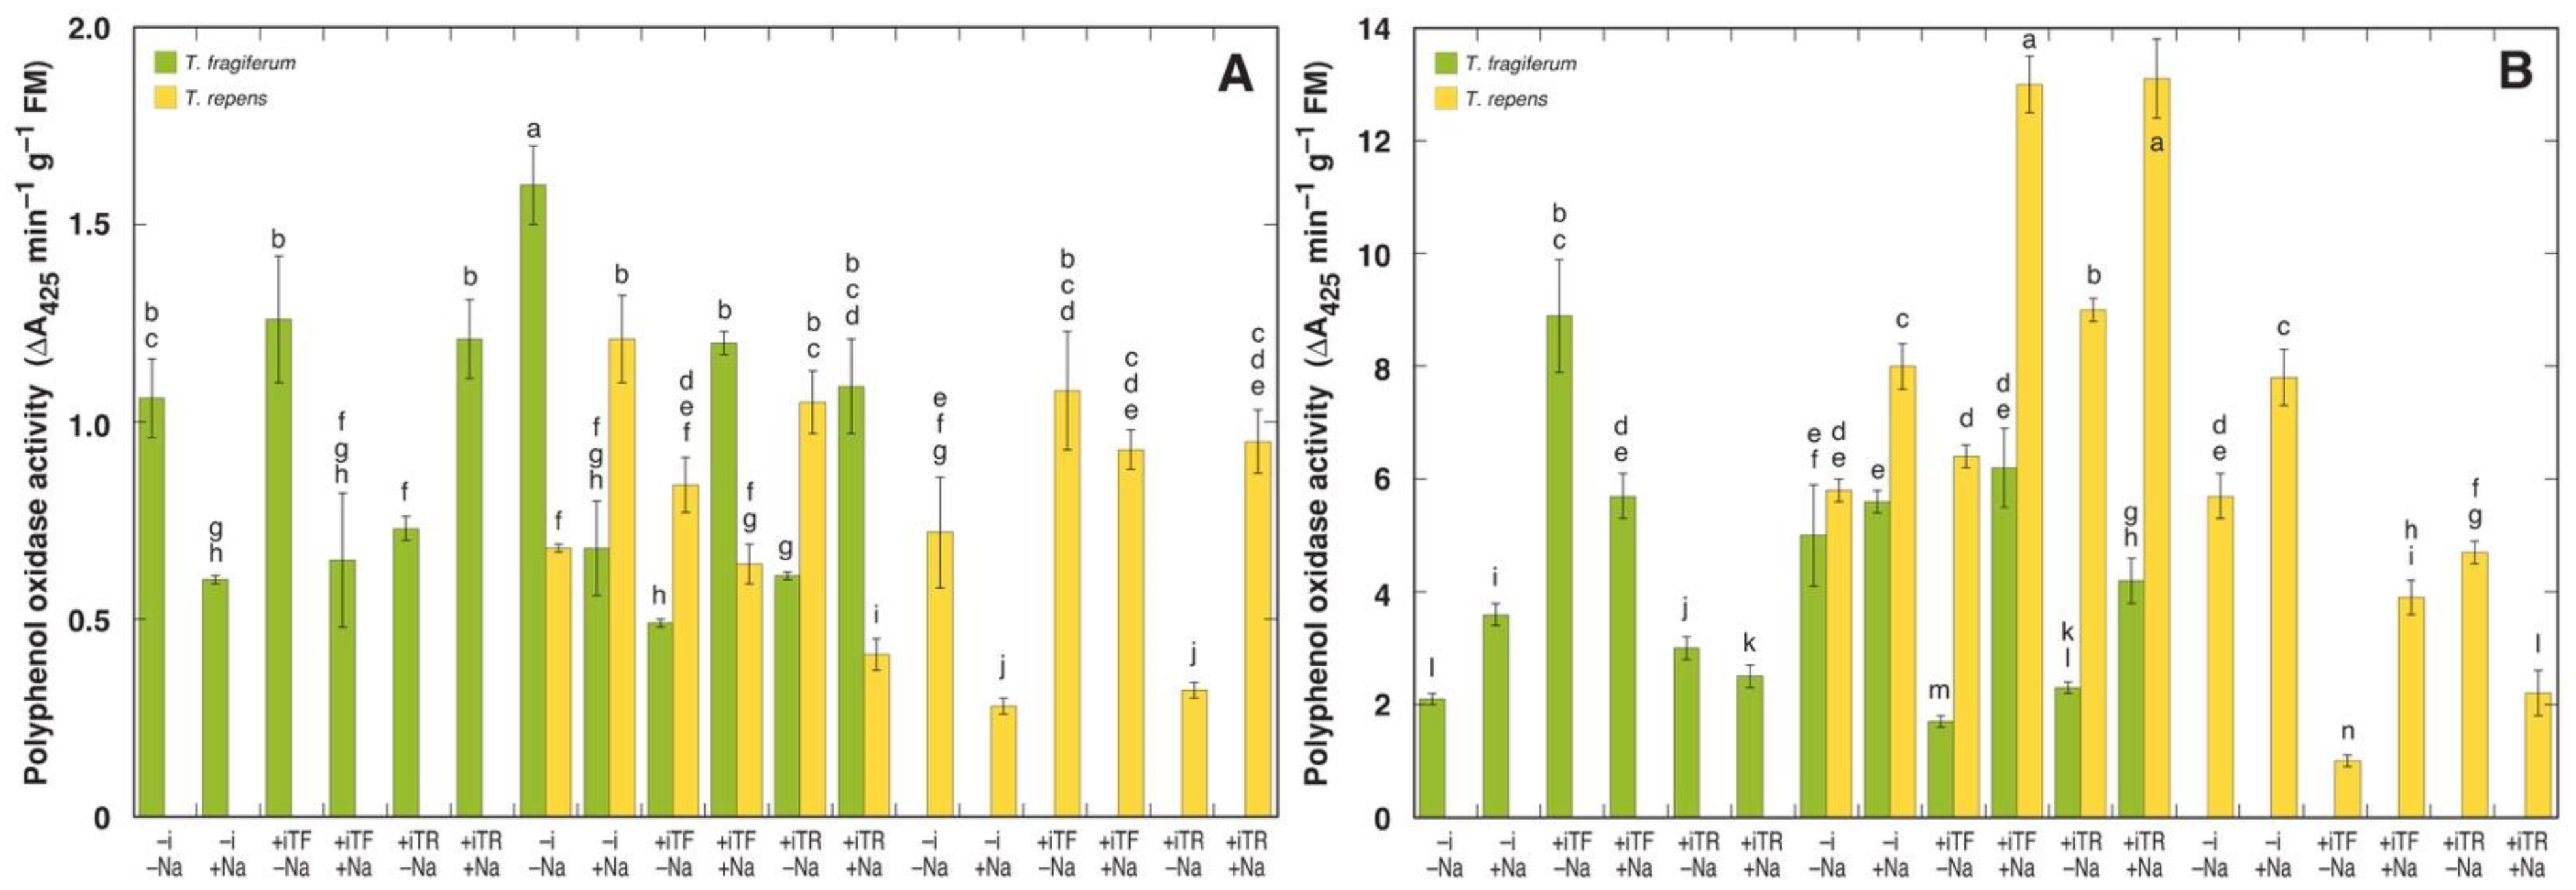
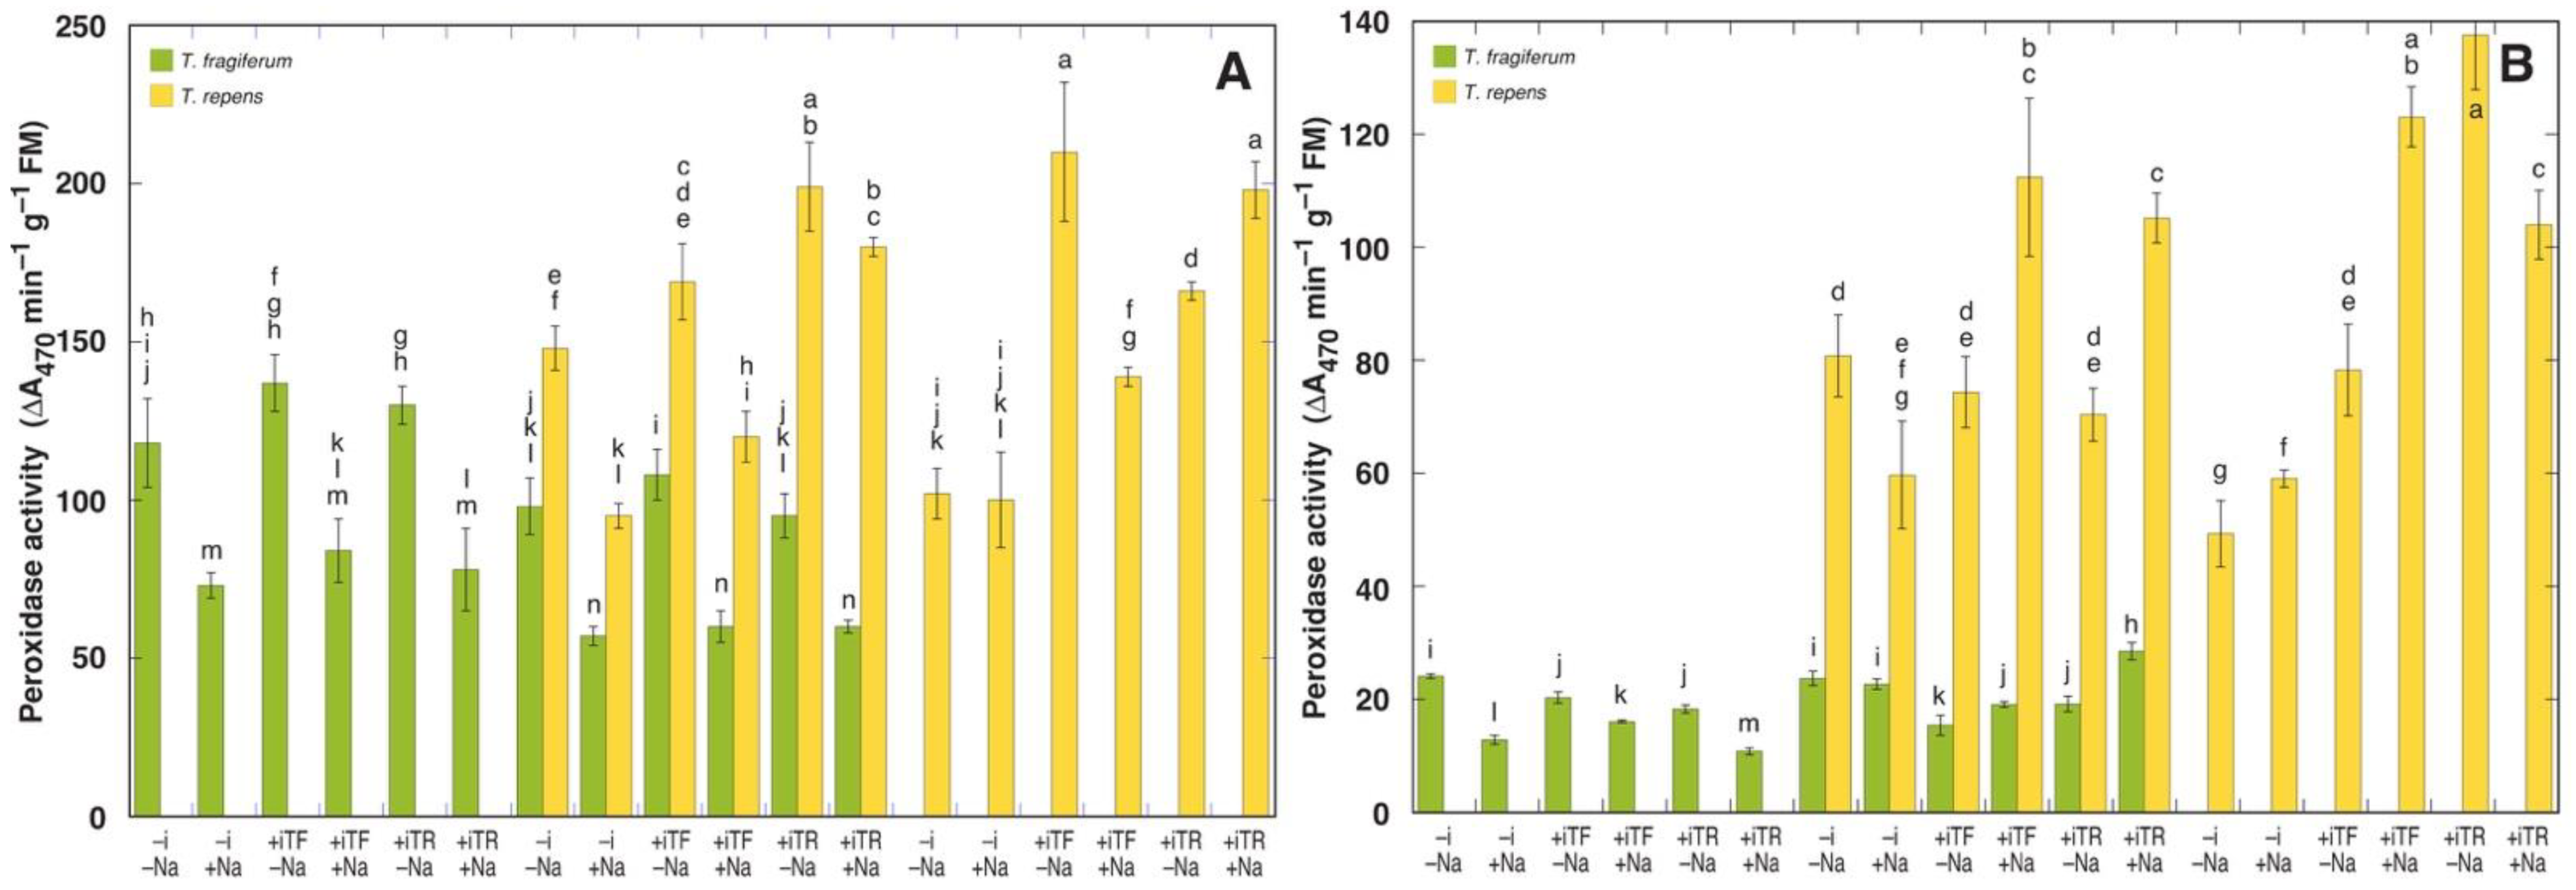
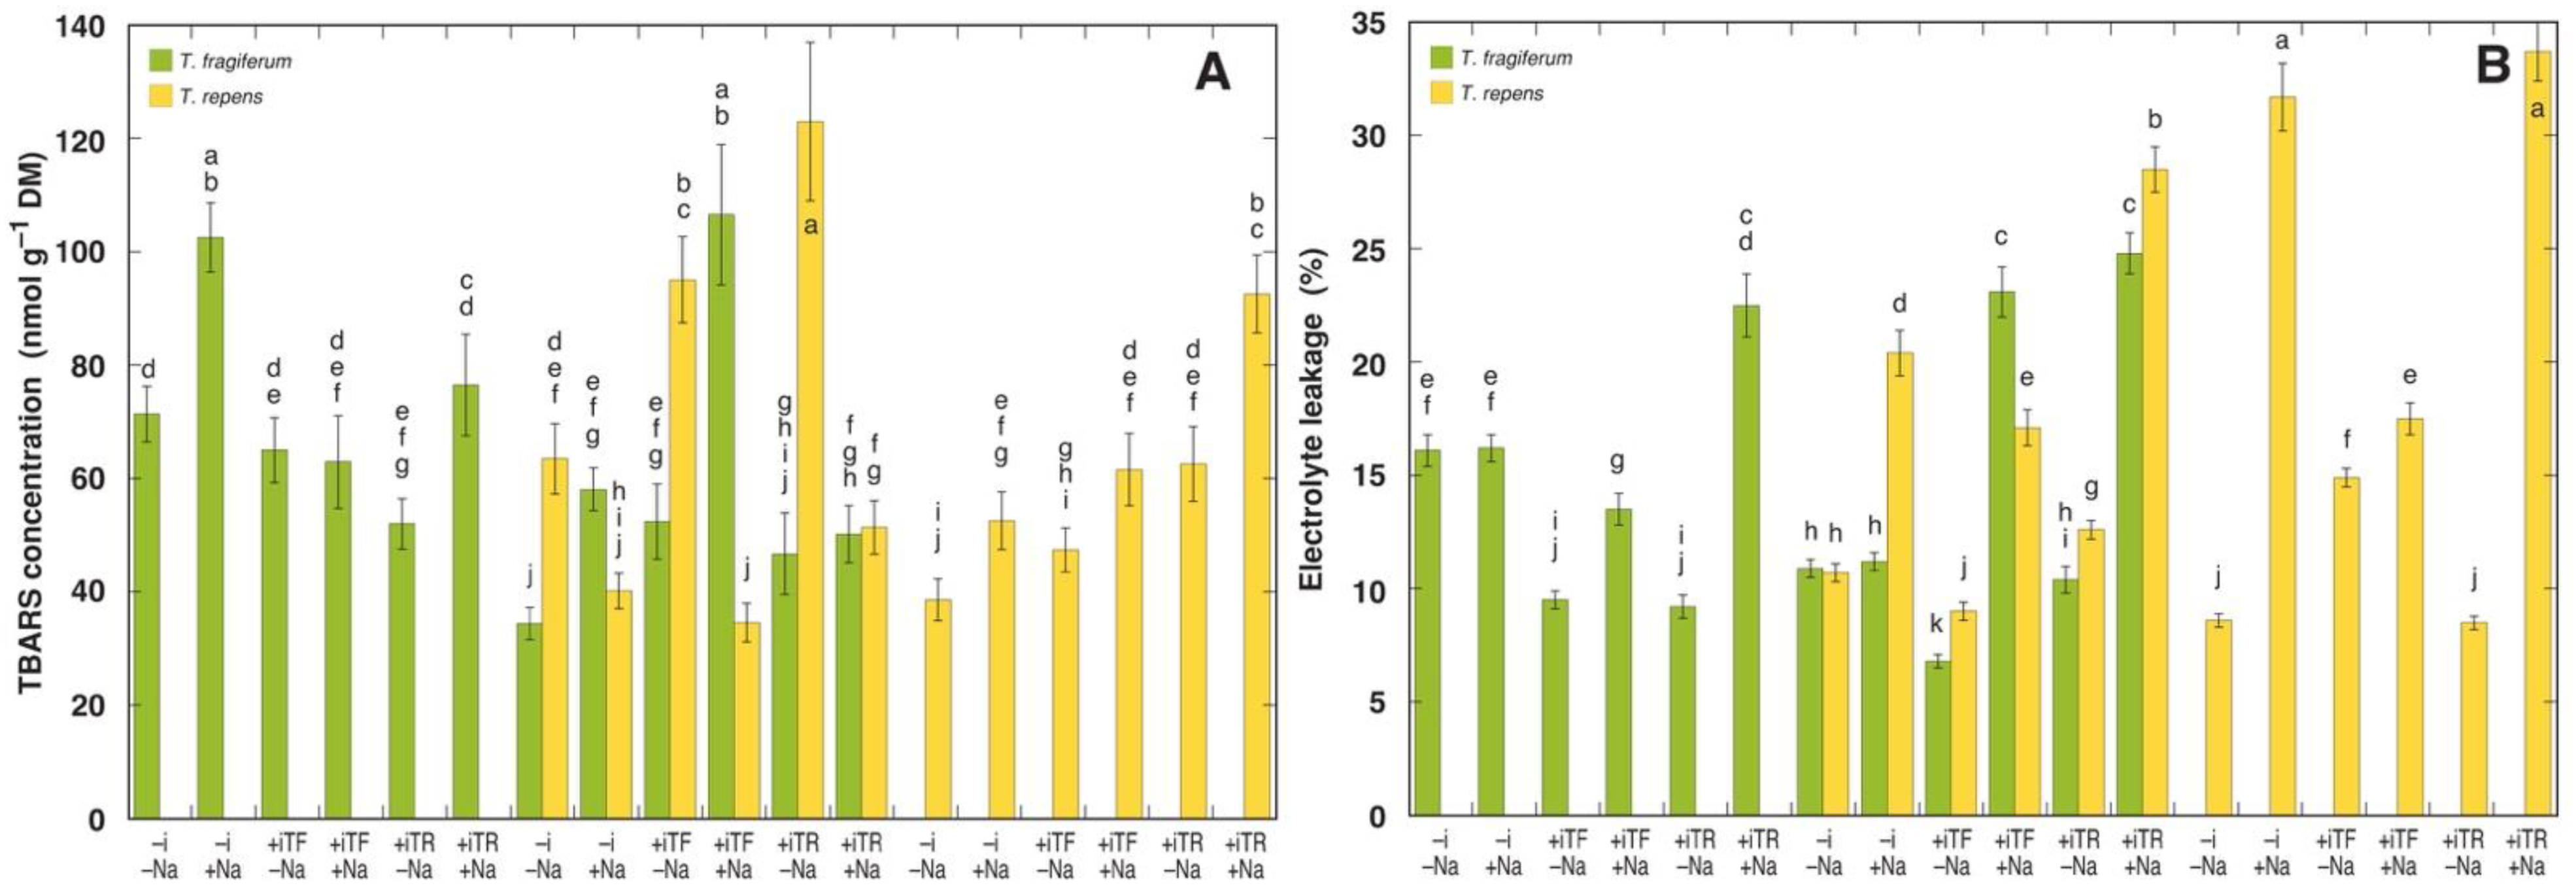
3.6. Oxidative Processes and Tissue Damage

The relative intensity of enzymatic oxidative processes was assessed by means of measuring peroxidase (Figure 5) and polyphenol oxidase (Figure 6) activity in leaves and petioles of T. fragiferum and T. repens plants. In T. fragiferum, peroxidase activity in petioles was significantly lower than that in leaves, but this was not the case for T. repens. According to the results of ANOVA, peroxidase activity in leaves was significantly affected by all experimental factors, but the activity in petioles only by species coexistence and species (Table 13). When peroxidase activity in leaves was expressed on a dry mass basis, it was significantly affected only by inoculant and species (data not shown). The effect of NaCl treatment on peroxidase activity was significantly negative in leaves and petioles of T. fragiferum plants in single species conditions (Figure 5), with relative activity from 53 to 70 units, in comparison to respective non-treated plants. In conditions of species coexistence, leaf peroxidase activity of T. fragiferum also decreased by NaCl treatment (56 to 63%), but increased in petioles of plants inoculated with rhizobia (124 to 148%). In T. repens, NaCl treatment had a variable effect on peroxidase activity both in leaves and petioles. Without NaCl treatment, peroxidase activity in leaves of T. fragiferum was higher in single species conditions. Inoculation with rhizobia increased leaf peroxidase activity in T. fragiferum in single species conditions, but with species coexistence, this effect was seen only for rhizobia from T. fragiferum. Inoculation increased also leaf peroxidase activity in T. repens, but the effect was not statistically significant for rhizobia from T. fragiferum.
Polyphenol oxidase activity in both species was variably affected by NaCl treatment in leaves as well as petioles (Figure 6). A significant effect was evident only in the case of the activity in petioles, which was affected by species.
Biochemical indicator of peroxidative membrane damage, TBARS concentration, showed relatively moderate variability between experimental treatments (Figure 7A). According to the ANOVA, no factor significantly affected TBARS concentration and no consistent effect of NaCl treatment was evident. However, TBARS concentration was significantly increased by NaCl in several treatment combinations: in T. fragiferum in single species conditions without rhizobial inoculation (by 44%) and with inoculant from T. repens (47%), in species coexistence without inoculation (69%) and with inoculant from T. fragiferum (103%); in T. repens in single species conditions without rhizobial inoculation (36%) and with inoculant from T. fragiferum (30%) and T. repens (48%). Species coexistence completely prevented an NaCl-induced increase in TBARS in leaves of T. repens (Figure 7A). TBARS concentration showed a relatively tight positive correlation with leaf Na+ concentration (R2 = 0.6053) when two treatments were excluded, where high TBARS concentration was evident in T. repens plants inoculated with both types of rhizobia in species coexistence conditions but not treated with NaCl. When only NaCl-treated plants were considered, the tightness of the correlation increased (R2 = 0.6815).
Electrolyte leakage from plant tissues varied from 6.8 to 24.8% in T. fragiferum and from 8.5 to 33.7% in T. repens (Figure 7B). According to the results of ANOVA, the parameter was significantly affected only by NaCl treatment (Table 13). There was a significant increase in electrolyte leakage by NaCl in T. fragiferum plants inoculated by rhizobia, but no effect was seen in non-inoculated plants (Figure 7B). The highest increase in electrolyte leakage due to NaCl treatment was for T. fragiferum plants in species coexistence conditions, inoculated with rhizobia from T. fragiferum (340% in comparison to respective NaCl non-treated plants). NaCl treatment resulted in a significant increase in electrolyte leakage in all treatment combinations in T. repens, with the highest increase in plants in single species conditions, non-inoculated with rhizobia (369%) or inoculated with rhizobia from T. repens (397%). No significant correlation was found between TBARS concentration and tissue electrolyte leakage.

4. Discussion

4.1. Experimental System

In experiments where rhizobial symbiosis is excluded, special care must be considered as bacteria can easily disperse from inoculated containers and contaminate control containers [14]. In the present study, the use of sterilized substrate and materials—as well as individual watering system for containers—were precautions to minimize possible initial contamination. However, no particular actions were performed in the second part of the experiment to prevent touching between plant shoots. As a result, exclusion of rhizobial symbiosis was only temporal, as indicated by the presence of nodules on roots of non-inoculated plants at the end of the experiment (Ievinsh et al., unpublished results) as well as by characteristic increase in photosynthesis-related parameters 6–8 weeks after the start of the experiment (Figure 3 and Figure 4). Consequently, it is possible to suggest that differences in physiological responses of non-inoculated vs. inoculated plants at least during the first 5 weeks of the experiment can be considered as a result of the absence/presence of rhizobial symbiosis.
Salinity level due to the application of increasing concentration of NaCl up to 400 mM in the present study was 230 to 290 mS m−1 (2.3 to 2.9 dS m−1), similar values were found in natural habitat (239 mS m−1). However, this is relatively low when compared to seasonal variation of electrical conductivity found in salinity-affected wetland soil where the two Trifolium species grow (1.3 to 25.5 dS m−1) [47]. In natural conditions, the salinity level has high temporal heterogeneity as a result of interaction between inundation with saline water and rain-dependent washing out of salts.
With respect to the possibilities and limitations of the model system used, it is important to emphasize that it was more realistic in respect to the multitude of interactions in natural conditions. Besides the already mentioned putative problems with rhizobial contamination during the experiment, the results obtained reflected a high degree of experimental complexity and were difficult to analyze. Therefore, substantial knowledge of physiology was necessary to discuss the outcome of the present experiment.

4.2. Species Coexistence and Response to Salinity

Interaction between plant species has been assessed mostly from the point of resource (light, water, nutrients) availability [33] sometimes analyzing also the effect of other environmental factors [48]. It is usually found that in relatively optimal conditions plants have a stronger tendency for competition due to faster resource acquisition, while in less optimal conditions cooperation will prevail [49,50]. However, in the case of interaction between individuals belonging to different species, self/non-self recognition can be an important additional factor [51]. Therefore, in the present study, we tried to find out how physiological characteristics are affected by the cocultivation of two individuals from different species in comparison to those of individuals from a single species, with a substrate salinity acting as a main environmental factor.
The coexistence of species in natural conditions, including salt marshes, is manifested by both positive and negative interactions [52]. Within biotic interactions, competition is likely the most important factor for the establishment of zonation in salt marshes [53]. Moreover, it was demonstrated that a trade-off between the competitive ability of a species and its stress tolerance contributes to plant zonation in salt marshes and other plant communities [33], but physiological mechanisms of the competition are far from clear [54]. If two species have different tolerance to some environmental factor, a change of intensity of this factor could result in a shift of competition-related balance between the species. Therefore, it is logical to assume that the competitive ability of more salt-tolerant (or halophytic) species increases with an increase in soil salinity in further positively affecting its distribution [53]. In the present study, it was hypothesized that plants of potentially more salt-tolerant clover species T. fragiferum will have better physiological performance and growth in comparison to T. repens only if coexisting in conditions of elevated soil salinity.
Based on the literature analysis, it was expected that T. fragiferum will show better salinity tolerance [5,55] as compared to T. repens [8]. Both plant species indeed differentially responded to NaCl treatment. For T. fragiferum, NaCl treatment significantly increased shoot biomass both in single species and species coexistence conditions except for dry mass in plants inoculated with rhizobia from T. repens in species coexistence (Figure 2). Increased shoot fresh mass in T. fragiferum by NaCl treatment was partially due to increased tissue water content (Table 4). It is well known that enhanced tissue water content as a result of salinity is a characteristic adaptive response of both halophytes and glycophytes [56] and could be related to increased salinity tolerance. In contrast, NaCl treatment resulted in a significant decrease in shoot biomass of T. repens in non-inoculated plants in single species conditions and, most severely, in plants inoculated with rhizobia from T. fragiferum during species coexistence (Figure 2). A contradictory effect of NaCl treatment was evident in respect to shoot fresh mass (decrease) and dry mass (no significant effect) for T. repens plants in species coexistence conditions inoculated with rhizobia from T. repens, showing that salinity induced a decrease in tissue water content in this treatment combination. Experiments with more realistic NaCl treatment, mimicking short-term seawater flooding conditions, have revealed that T. repens plants are negatively affected by soil flooding with saline water, but also indicated that the response may be ecotype-specific [57].
Species coexistence had a significant negative relative effect on the growth of T. fragiferum for non-inoculated plants and plants inoculated with rhizobia from T. fragiferum but only without NaCl (Table 4). Significant coexistence-dependent growth stimulation of T. fragiferum was evident only for dry mass in plants inoculated with rhizobia from T. repens and cultivated without NaCl. In contrast, species coexistence benefited T. repens plants under NaCl treatment without bacterial inoculation and plants without NaCl treatment but inoculated with rhizobia from T. fragiferum (Table 4). A significant negative effect of species coexistence on the growth of T. repens was evident for plants inoculated with rhizobia from T. repens without NaCl and for plants inoculated with rhizobia from T. fragiferum with NaCl. Both morphological and physiological data confirmed that T. repens is a more dominant species than T. fragiferum, but the dominance was significantly decreased by NaCl treatment and inoculation with rhizobia that in part could be related to nitrogen-dependent changes in competition characteristics between legume species [14]. Besides competition for resources, the negative effect of species coexistence could be related also to the production and release of allelopathic compounds [58].
The most striking effect of species coexistence as affected by rhizobial inoculant was seen in the presence of rhizobia from T. repens, where shoot water content decreased in T. fragiferum and increased for T. repens (Table 4). The effect was clearly due to species coexistence, as it was not evident in single species conditions. The addition of NaCl fully reversed this hydration-related effect. No similar relationship was seen in the case of inoculant from T. fragiferum, pointing to some specific characteristics of rhizobial isolates, disappearing in conditions of salinity.
Returning to the initial hypothesis, namely, that rare species T. fragiferum can outcompete more common species T. repens only in conditions of increased substrate salinity, it appeared that NaCl treatment indeed had a higher positive effect on the growth of T. fragiferum in conditions of species coexistence, but the positive effect of bacterial inoculant in coexisting species, especially by rhizobia isolated from T. repens, was significantly more pronounced. We did not directly compare responses of single individual plants with those of two individuals of either species (species coexistence). However, preliminary experiments showed that single individuals of either T. fragiferum or T. repens responded to substrate salinity differentially in comparison to two individuals of the same species (Ievinsh et al., unpublished results). Thus, the physiological response of the individual changed in respect to the identity of the coexisting individual; e.g., the outcome of the response of the individual to environmental cues is predicted by the interaction between species.
Possible physiological mechanisms of more pronounced salinity tolerance in T. fragiferum, based on the present results, need to be discussed in more detail. The reduction in root to shoot transport of Na+ is described as one of the mechanisms related to increased NaCl tolerance, at least, for glycophytic species [59]. In the present study, the compartmentation of Na+ in different parts of shoots of T. fragiferum and T. repens was evident, with a higher accumulation of the ion in leaf petioles. For T. repens, Na+ was excluded from flowers, accumulating in flower stalks. NaCl-treated T. fragiferum plants had significantly higher concentrations of Na+ in all studied plant parts in comparison to T. repens (Table 10). Consequently, T. repens exhibited a typical feature of partial Na+ exclusion from shoots, while T. fragiferum accumulated Na+ in shoots, representing a higher degree of cellular tolerance possibly due to efficient Na+ compartmentation in cell vacuoles [60] and by means of the active antioxidant system [61].
K+:Na+ homeostasis is considered to be one of the major traits for salinity tolerance, at least, for glycophyte species [62]. In the present study, NaCl treatment had a significant effect on K+ concentration in leaves in some treatment combinations, but in general, variation in the K+:Na+ concentration ratio between treatments was not associated with observed differences in plant growth. It seems that at least T. fragiferum can efficiently replace K+ with Na+ for maintenance of cellular osmotic functions, as already noted in previous studies with potential halophytic species [32].
The decrease in leaf chlorophyll concentration and photosynthesis, including photochemical efficiency of photosystem II, is a well-documented response of plants to suboptimal NaCl treatment [63,64]. In a study with T. repens, it was found that no decrease in maximum quantum yield of photosystem II (Fv/Fm) by NaCl treatment up to 100 mM was evident [65]. No general direct effect of NaCl on photosynthesis-related characteristics was found in the present study but NaCl treatment significantly affected the effect of other factors on these parameters (Table 9).
In a study with a halophytic plant species Cakile maritima, it was shown that salinity-induced a decrease in plant photosynthetic activity that further led to decreased growth and reproduction [66]. Quantum yield of photosystem II of C. maritima increased at optimum salinity (100 mM NaCl) but was significantly decreased at 300 and 500 mM NaCl. In the present study, the Performance Index was not much affected by the gradual NaCl increase in the substrate. For rhizobia-inoculated T. fragiferum plants under single species conditions, the Performance Index significantly increased by NaCl treatment only at the end of the experiment, but this effect was not evident under species coexistence (Figure 2). For T. repens under single species conditions, non-inoculated plants exhibited a temporal increase in the Performance Index by NaCl treatment, but for plants inoculated with rhizobia from T. repens, the Performance Index level temporarily decreased in NaCl-treated plants.
While biological factors are a less studied type of environmental influence, it is logical to presume that for legume species symbiosis with nitrogen-fixing rhizobial bacteria is a critical factor in interspecific interactions. In a microcosm study with a number of dune grassland species, it was established that three of the four studied legume species require rhizobial symbiosis for successful coexistence with non-legume species [14]. This aspect will be discussed further (Section 4.3).
It should be noted also that in natural conditions of a salt-affected meadow, T. fragiferum plants have a significant level of arbuscular mycorrhizal colonization in roots, reaching both high frequency (99%) and intensity (68%) [47]. In experiments with T. repens, it has been shown that the presence of arbuscular mycorrhizal symbiosis can modify how clonal integration affects plant performance in heterogeneous environmental conditions [67]. Arbuscular mycorrhizal symbiosis is shown to be important also for salinity tolerance [68]. Consequently, in natural conditions, not only rhizobial symbiosis but also mycorrhiza can have a significant impact on the result of the coexistence of allied species.

4.3. Bacterial Inoculation

Inoculation with native symbiosis-forming N2-fixing bacteria was a significant factor in the present study affecting the outcome of the interaction between T. fragiferum and T. repens. In nutrient-limiting conditions, rhizobial inoculation usually has a positive effect on the growth of clover species and other legume plants, depending on both the compatibility and efficiency of used bacterial strains [69]. Indeed, both fresh and dry mass of Trifolium plant shoots increased in all treatment combinations inoculated with rhizobia (Figure 2). However, it is difficult to unequivocally interpret the mineral availability status of plants in the present experiments. First, both nitrate-N and ammonia-N in equal amounts were present in the fertilizer used here. Both total amount and balance between different chemical forms of N can significantly affect plant growth and development in a species-specific manner [70,71], as well as the rhizobial symbiosis of legume species including clover [72]. At least, the use of equal proportions of both forms of N allowed to exclude any specific effects associated with the use of a particular chemical form of N. Second, nitrogen availability and its chemical forms itself regulates salt tolerance in plants [73].
Direct comparison of nitrogen-fixation efficiency of different Trifolium species by the two specific isolates of rhizobia was outside the scope of the present study. However, based solely on growth data, it is possible to assume that general specificity to a particular rhizobial isolate was comparably low. In single species conditions, the accumulation of shoot dry matter of both T. fragiferum and T. repens was not statistically different between treatments with either rhizobia (Figure 2B). The identity of bacterial isolate could affect the fate of species interaction, as, in contrast to what was expected, inoculation with rhizobia from T. repens in T. fragiferum plants in species coexistence conditions without NaCl treatment resulted in a two-fold increase in shoot dry matter in comparison to inoculation with rhizobia from T. fragiferum (Figure 2B). In the respective treatments, T. repens plants exhibited a two-fold decrease in shoot dry matter. In conditions of coexistence of different legume species, an individual of one species can benefit from nitrogen fixed by an individual from another species due to more efficient rhizobial symbiosis of the latter, similar to what has been described for interaction between legume and non-legume species [74]; or due to more salt-tolerant symbiotic bacteria. It is important to note that the presence of NaCl completely abolished the mentioned effect. It is usually thought that nodule-forming rhizobia are more salinity tolerant than their host plants [75], but it is clear from the present results that differences in salinity tolerance of rhizobial strains can have a significant effect on the outcome of species coexistence in conditions of a salt marsh. Yet, functional aspects of rhizobial symbiosis are highly sensitive to salinity, with nitrogen fixation being more vulnerable in comparison to ammonium assimilation [76].
It appears that the nitrogen-fixing ability of rhizobia isolated from T. repens was significantly more pronounced in comparison to that from T. fragiferum, allowing T. fragiferum plants to benefit from rhizobial symbiosis in T. repens plants in conditions of species coexistence, but this needs to be examined further. Specificity of rhizobia could be a less important aspect in rhizobia–clover interaction in natural conditions, as compared to differences in the efficiency of particular strains and by different bacteria–clover combinations [69]. A comparative study from a subtropical region showed a large diversity in respect to nodule-forming species in roots of T. fragiferum un T. repens: both plants can form nodules with bacterial species from genera Bradyrhizobium and Rhizobium (predominantly strains of Rhizobium leguminosarum), but T. repens plants can also have symbiosis with Sinrhizobium species, while T. fragiferum with Mesorhizobium species [77]. Moreover, it is not clear whether the particular inoculant consisted only of one rhizobial strain.
Several mechanisms have been proposed for the beneficial effect of bacterial inoculants in conditions of increased soil salinity. Tissue-specific regulation of the Na+ transporter by a soil bacterium Bacillus subtilis has been shown to represent a critical mechanism for the maintenance of low Na+ in Arabidopsis thaliana in further conferring increased NaCl tolerance [78]. This mechanism is likely to be effective also in the case of B. subtilis-induced salt tolerance of wheat [79]. Inoculation of T. repens with Azospirillum brasilense, a free-living soil bacterium, increased the leaf chlorophyll concentration of plants both in control (by 62%) and low salinity (64, 75, and 61%, in 40, 80, and 120 mM NaCl, respectively) conditions [80]. In addition, inoculation of T. repens with A. brasilense significantly reduced Na+ accumulation in shoots and roots in low salinity conditions [80]. In the present study, tissue Na+ concentration decreased by rhizobial inoculation in leaves and stolons of NaCl-treated T. fragiferum plants in single species conditions but increased by inoculation in leaves and stolons of T. repens plants except in leaves of single species plants inoculated with rhizobia from T. fragiferum (Table 10). A relatively close correlation between Na+ concentration and a potential indicator of peroxidative membrane damage, TBARS concentration, was evident, indicating that a decrease in tissue Na+ concentration could be associated with less tissue damage.
Some additional evidence for rhizobial symbiosis-dependent protection against NaCl could be derived from analysis of peroxidase activity in leaves where bacterial inoculation with either rhizobia resulted in a significant increase in relative peroxidase activity. This increase was relatively higher for T. repens in single species conditions.

4.4. Evaluation of Cellular Damage and Physiological Performance

Among biochemical indicators of cellular damage, measurement of malondialdehyde (MDA) concentration in tissues by means of the analysis of TBARS concentration has been widely used as an indicator of the relative degree of lipid peroxidation due to unfavorable conditions leading to endogenous oxidative stress [81]. In particular, salinity usually increases tissue MDA concentration in sensitive species and cultivars but not in resistant ones [82]. For a halophytic species Atriplex portulacoides, no significant increase in leaf MDA concentration was seen even at 1000 mM NaCl salinity [63]. During the comparison of two accessions of halophyte Cakile maritima, it was found that growth stimulation of the more salt-tolerant accession occurred at 100 mM NaCl, together with decreased MDA concentration, 66% lower than that of control plants [61]. In the present study, there were statistically significant differences in TBARS concentration in leaves of both Trifolium species between different treatments (Figure 7). While, according to the ANOVA results, there was no general trend of effect on TBARS concentration by any of the experimental factors, this parameter was significantly increased by NaCl treatment in several treatment combinations. Moreover, when only NaCl-treated plants were considered, the leaf TBARS concentration relatively tightly positively correlated with leaf Na+ concentration. Most interestingly, the coexistence of T. repens with T. fragiferum completely eliminated the stimulative effect of NaCl treatment on TBARS concentration in T. repens, which was evident in single species conditions (Figure 7). In T. repens plants not treated with NaCl, high TBARS concentration in leaves was evidently caused by other factors, i.e., coexistence with T. fragiferum together with rhizobial inoculation.
Relative electrolyte leakage in leaves of a legume Glycine soja plants (10%) increased up to 30% by 150 mM NaCl treatment [44], which is in a range of changes documented also in the present study. Electrolyte leakage was highly significantly affected by NaCl treatment in the present study (Table 13). It is usually thought that electrolyte leakage in NaCl-treated plants is a direct consequence of the effect of Na on membrane permeability [64], but no significant correlation between TBARS concentration and electrolyte leakage was evident. During the comparison of MDA concentration and degree of membrane leakage in Zea mays plants subjected to salinity, it was concluded that permeability characteristics of membranes could be affected by factors other than lipid peroxidation [83]. Furthermore, it was argued that electrolyte leakage from senescing leaves does not represent a reliable characteristic of cell membrane damage [84]. As no inhibition of photochemical efficiency of photosystem II was caused by NaCl treatment in spite of the significant increase in TBARS concentration in several treatment combinations, it seems that in the conditions of the present experiment NaCl treatment did not result in a significant increase in oxidative damage to chloroplastic macromolecular structures over some basal level. Consequently, recorded changes in growth between different treatment combinations were not associated with deleterious effects at the level of tissue damage but rather were reflections of physiological changes due to species coexistence, NaCl treatment, rhizobial inoculation, and interactions between them.
It is usually found that salinity-induced increase in peroxidase activity is a characteristic response of more tolerant species indicating activation of defense mechanisms [85]. Thus, salt-tolerant species Plantago maritima showed a significant increase in leaf peroxidase activity at 100 mM NaCl (no decrease in growth), while salt-sensitive species Plantago media (53% decrease in dry matter) had no response at this salinity [86]. However, when time-course analysis was performed, it became evident that peroxidase activity increases in salt-tolerant species occurred only at early stages after the start of the treatment (reflecting induction of defense responses), but for sensitive species, more late increase reflects an enzymatic response to cellular damage [87]. In the present study, peroxidase activity was significantly affected by NaCl treatment, decreasing in leaves of T. fragiferum, but the particular effect of treatment on peroxidase activity in T. repens plants depended on the combination of factors (presence or absence of particular rhizobial inoculant as well as single species conditions vs. species coexistence; Figure 5). It is possible that the effect of NaCl on peroxidase activity was at least partially due to stimulation of increased tissue water content by the treatment, which was more pronounced in T. fragiferum (Table 1). According to ANOVA analysis, when leaf peroxidase activity was expressed on a dry mass basis, it was significantly affected only by inoculant and species, in comparison to the significant effect of all factors in the case when the activity was expressed on a fresh mass basis (Table 13).
However, while NaCl resulted in decreased activity of polyphenol oxidase in several treatment combinations, there was no uniform response of the enzyme activity to NaCl treatment that might be attributed to indirect (or interactive) effects of salinity on this enzyme. Studies on the effect of abiotic factors besides tissue wounding on polyphenol oxidase activity are relatively scarce. It was shown that an increase in polyphenol oxidase activity in leaves of Trifolium pratense correlated with the degree of cell damage due to cattle grazing [88].
Decreased growth in the absence of rhizobial inoculation occurred together with a decrease in leaf chlorophyll concentration (Figure 3) as well as a lowered photochemical capacity of photosystem II as indicated by chlorophyll a fluorescence measurements (Figure 4). Total leaf chlorophyll concentration is often correlated to N nutrition, as a decrease in N tissue availability can result in inhibited chlorophyll synthesis [89]. It seems that the characteristic decrease in leaf chlorophyll concentration in both T. fragiferum and T. repens plants in the absence of rhizobial inoculation reflects some common adaptive mechanism of clover species to nitrogen-fixing rhizobia, where active symbiosis is necessary to maintain high rates of chlorophyll synthesis. Similar to the present results, inoculation with rhizobia of Phaseolus lunatus plants led to a higher leaf chlorophyll content in comparison to uninoculated, nitrogen-supplied plants [90]. Inoculation with both types of rhizobia resulted in the early increase in the Performance Index in both studied species (Figure 4). The highest initial increase for both Trifolium species was caused by rhizobia from T. repens in single species conditions and that from T. fragiferum in species coexistence conditions. It is not known though to what extent depression of photochemical activity in non-inoculated plants in the present study can be a consequence of possible N shortage.

5. Conclusions

During the coexistence of allied species, the interaction between biotic and abiotic factors can affect the outcome of the species coexistence, as significant two-way interactions (between species coexistence and NaCl, inoculant and species, and NaCl and species) and a significant three-way interaction (between inoculant, NaCl and species) on plant shoot growth of Trifolium species were found in the present study. NaCl treatment was an important positive factor for T. fragiferum, resulting in better growth in conditions of species coexistence, but the positive effect of bacterial inoculant, especially, by rhizobia isolated from T. repens, was significantly more pronounced. A decrease in peroxidase activity in leaves was a good indicator of relative NaCl tolerance, while the absence/presence of rhizobial inoculation was reflected by changes in leaf chlorophyll concentration, and, more importantly, by characteristics of the photochemical activity of photosystem II. For NaCl-treated plants, leaf TBARS concentration relatively tightly positively correlated with leaf Na+ concentration. Consequently, one of the reasons why T. fragiferum is exclusively associated with the sea coast in its Northern range of distribution is related to a higher competitive ability with allied species in conditions of increased substrate salinity, based on better physiological salinity tolerance. Though it remains to be an open question as to why the competitive ability or adaptive capacity of T. fragiferum is higher in its main range of distribution where no specific relationship with saline habitats is found.

Author Contributions

K.D., I.S., D.E. and G.I. conceived and designed the study; K.D., U.A.-O., I.S. and G.I. performed experiments and gathered data; K.D., D.E. and G.I. analyzed and interpreted the data; K.D., D.E. and G.I. wrote the manuscript. G.I. take responsibility for the integrity of the work as a whole. All authors have read and agreed to the published version of the manuscript.

Funding

This study was supported by the Latvian State Research programme “The value and dynamic of Latvia’s ecosystems under changing climate” (EVIDEnT) project, the University of Latvia project “Biological diversity—impacts, functions and protection”, and by the Latvian Science Council project lzp-2020/2-0349 “Molecular, physiological and ecological evaluation of Latvian genetic resources of valuable wild legume species, Trifolium fragiferum, in a context of sustainable agriculture”. Funding source had no involvement in any phase of the study.

Institutional Review Board Statement

Not applicable.

Informed Consent Statement

Not applicable.

Data Availability Statement

All data reported here is available from the authors upon request.

Acknowledgments

We would like to thank Māra Vikmane for fruitful physiological discussions and Jevgenija Ņečajeva for help with plant harvests.

Conflicts of Interest

The authors declare no conflict of interest. The funders had no role in the design of the study; in the collection, analyses, or interpretation of data; in the writing of the manuscript, or in the decision to publish the results.

References

  1. Cunningham, R.B.; Lindenmayer, D.B. Modeling count data of rare species: Some statistical issues. Ecology 2005, 86, 1135–1142. [Google Scholar] [CrossRef]
  2. Münzbergova, Z. Determinants of species rarity: Population growth rates of species sharing the same habitat. Am. J. Bot. 2005, 92, 1987–1994. [Google Scholar] [CrossRef]
  3. Ievinsh, G. Biological basis of biological diversity: Physiological adaptations of plants to heterogeneous habitats along a sea coast. Acta Univ. Latv. 2006, 710, 53–79. [Google Scholar]
  4. Townsend, C.E. Miscellaneous perennial clovers. In Clover Science and Technology; Taylor, J.L., Ed.; ASA/CSSA/SSSA: Madison, WI, USA, 1985; pp. 563–578. [Google Scholar]
  5. Ciocârlan, V.; Georgescu, M.I.; Sǎvulescu, E.; Anastasiu, P. Plopul salt marshes (Tulcea County)—An unique area for halophytes in Romania. Acta Horti Bot. Bucurest. 2013, 40, 27–32. [Google Scholar] [CrossRef]
  6. Janssen, J.A.M.; Rodwell, J.S. European Red List of Habitats: Part 2—Terrestrial and Freshwater Habitats; European Union: Brussels, Belgium, 2016. [Google Scholar]
  7. Cabinet of Ministers of Latvia. Provisions on the List of Specially Protected Species and Species of restricted Use. Regulations of the Cabinet of Ministers of Latvia No. 396. 2000. Available online: https://likumi.lv/ta/id/12821-noteikumi-par-ipasi-aizsargajamo-sugu-un-ierobezoti-izmantojamo-ipasi-aizsargajamo-sugu-sarakstu (accessed on 9 October 2021).
  8. Burdon, J.J. Biological flora of the British Isles. Trifolium repens. L. J. Ecol. 1983, 71, 307–330. [Google Scholar] [CrossRef]
  9. Svenning, M.M.; Gudmundsson, J.; Fagerli, I.-L.; Leinonen, P. Competition for nodule occupancy between introduced strains of Rhizobium leguinnosarum biovar trifolii and its influence on plant production. Ann. Bot. 2001, 88, 781–787. [Google Scholar] [CrossRef]
  10. Harper, J.L.; Clatworthy, J.N. The comparative biology of closely related species: VI. Analysis of the growth of Trifolium repens and T. fragiferum in pure and mixed populations. J. Exp. Bot. 1963, 14, 172–190. [Google Scholar] [CrossRef]
  11. Huber, H.; During, H.J. No long-term costs of meristem allocation to flowering in stoloniferous Trifolium species. Evol. Ecol. 2001, 14, 731–748. [Google Scholar] [CrossRef]
  12. Baldwin, A.H.; Mendelssohn, I.A. Effects of salinity and water level on coastal marshes: An experimental test of disturbance as a catalyst for vegetation change. Aquat. Bot. 1998, 61, 255–268. [Google Scholar] [CrossRef]
  13. Burchill, W.; James, E.K.; Li, D.; Lanigan, G.J.; Williams, M.; Iannetta, P.P.M.; Humphreys, J. Comparisons of biological nitrogen fixation in association with white clover (Trifolium repens L.) under four fertiliser nitrogen inputs as measured using two 15N techniques. Plant Soil 2014, 385, 287–302. [Google Scholar] [CrossRef]
  14. Van der Heijden, M.G.A.; Bakker, R.; Verwaal, J.; Scheublin, T.R.; Rutten, M.; van Logtestijn, R.; Staehelin, C. Symbiotic bacteria as a determinant of plant community structure and plant productivity in dune grassland. FEMS Microbiol. Ecol. 2006, 56, 178–187. [Google Scholar] [CrossRef] [PubMed]
  15. Cabot, C.; Sibole, J.V.; Barceló, J.; Poschenrieder, C. Lessons from crop plants struggling with salinity. Plant Sci. 2014, 226, 2–13. [Google Scholar] [CrossRef] [PubMed]
  16. Kaushal, M.; Wani, S.P. Rhizobacterial-plant interactions: Strategies ensuring plant growth promotion under drought and salinity stress. Agric. Ecosyst. Environ. 2016, 231, 68–78. [Google Scholar] [CrossRef]
  17. Touchette, B.W.; Adams, E.C.; Laimbeer, P. Age-specific responses to elevated salinity in the coastal marsh plant black needlerush (Juncus roemerianus Scheele) as determined through polyphasic chlorophyl a fluorescence transients (OJIP). Mar. Biol. 2012, 159, 2137–2147. [Google Scholar] [CrossRef]
  18. Badr, A.; Brüggemann, W. Comparative analysis of drought stress response of maize genotypes using chlorophyll fluorescence measurements and leaf relative water content. Photosynthetica 2020, 58, 638–645. [Google Scholar] [CrossRef] [Green Version]
  19. Carter, G.A.; Knapp, A.K. Leaf optical properties in higher plants: Linking spectral characteristics to stress and chlorophyll concentration. Am. J. Bot. 2001, 88, 677–684. [Google Scholar] [CrossRef] [PubMed] [Green Version]
  20. Samsone, I.; Andersone, U.; Vikmane, M.; Ieviņa, B.; Pakarna, G.; Ievinsh, G. Nondestructive methods in plant biology: An accurate measurement of chlorophyll content by a chlorophyll meter. Acta Univ. Latv. 2007, 723, 145–154. [Google Scholar]
  21. Mayer, A.M. Polyphenol oxidases in plants and fungi: Going places? A review. Phytochemistry 2006, 67, 2318–2331. [Google Scholar] [CrossRef] [PubMed]
  22. Cosio, C.; Dunand, C. Specific functions of individual class III peroxidase genes. J. Exp. Bot. 2009, 60, 391–408. [Google Scholar] [CrossRef]
  23. Mathé, C.; Barre, A.; Jourda, C.; Dunand, C. Evolution and expression of class III peroxidases. Arch. Biochem. Biophys. 2010, 500, 58–65. [Google Scholar] [CrossRef]
  24. Whitlow, T.H.; Bassuk, N.L.; Ranney, T.G.; Reichert, D.L. An improved method for using electrolyte leakage to assess membrane competence in plant tissues. Plant Physiol. 1992, 98, 198–205. [Google Scholar] [CrossRef] [Green Version]
  25. Bajji, M.; Kinet, J.-M.; Lutts, S. The use of the electrolyte leakage method for assessing cell membrane stability as a water stress tolerance test in durum wheat. Plant Growth Reg. 2002, 36, 61–70. [Google Scholar] [CrossRef]
  26. Hodges, D.M.; DeLong, J.M.; Forney, C.F.; Prange, R.K. Improving the thiobarbituric acid-reactive-substances assay for estimating lipid peroxidation in plant tissues containing anthocyanin and other interfering compounds. Planta 1999, 207, 604–611. [Google Scholar] [CrossRef]
  27. Shabala, S.; Cuin, T.A. Potassium transport and plant salt tolerance. Physiol. Plant. 2007, 133, 651–669. [Google Scholar] [CrossRef]
  28. Szczerba, M.W.; Britto, D.T.; Kronzucker, H.J. K+ transport in plants: Physiology and molecular biology. J. Plant Physiol. 2008, 166, 447–466. [Google Scholar] [CrossRef] [PubMed]
  29. Cakmak, I. The role of potassium in alleviating detrimental effects of abiotic stresses in plants. J. Plant Nutr. Soil Sci. 2005, 168, 521–530. [Google Scholar] [CrossRef]
  30. Anschütz, U.; Becker, D.; Shabala, S. Going beyond nutrition: Regulation of potassium homeostasis as a common denominator of plant adaptive responses to environment. J. Plant Physiol. 2014, 171, 670–687. [Google Scholar] [CrossRef] [PubMed]
  31. Subbarao, G.V.; Ito, O.; Berry, W.L.; Wheeler, R.M. Sodium—A functional plant nutrient. Crit. Rev. Plant Sci. 2003, 22, 391–416. [Google Scholar]
  32. Glenn, E.P.; Fister, R.P.; Brown, J.J.; Thompson, T.L.; O’Leary, J. Na and K accumulation and salt tolerance of Atriplex canescens (Chenopodiaceae) genotypes. Am. J. Bot. 1996, 83, 997–1005. [Google Scholar] [CrossRef]
  33. Levine, J.M.; Brewer, J.S.; Bertness, M.D. Nutrients, competition and plant zonation in a New England salt marsh. J. Ecol. 1998, 86, 285–292. [Google Scholar] [CrossRef]
  34. Trinder, C.J.; Brooker, R.W.; Davidson, H.; Robinson, D. Directly quantifying multiple interacting influences on plant competition. Plant Cell Environ. 2020, 144, 1268–1277. [Google Scholar] [CrossRef]
  35. Pennings, S.C.; Grant, M.-B.; Bertness, M.D. Plant zonation in low-latitude salt marshes: Disentangling the roles of flooding, salinity and competition. J. Ecol. 2005, 93, 139–167. [Google Scholar] [CrossRef]
  36. Schofield, E.J.; Rowntree, J.K.; Paterson, E.; Brewer, M.J.; Price, E.A.C.; Brearley, F.Q.; Brooker, R.W. Cultivar differences and impact on plant–plant competition on temporal patterns of nitrogen and biomass accumulation. Front. Plant Sci. 2019, 10, 215. [Google Scholar] [CrossRef] [Green Version]
  37. Hortal, S.; Lozano, Y.M.; Bastida, F.; Armas, C.; Moreno, J.L.; Garcia, C.; Pugnaire, F.I. Plant-plant competition outcomes are modulated by plant effects on the soil bacterial community. Sci. Rep. 2017, 7, 17756. [Google Scholar] [CrossRef]
  38. Xi, N.; Bloor, J.M.G.; Chu, C. Soil microbes alter seedling performance and biotic interactions under plant competition and contrasting light conditions. Ann. Bot. 2020, 126, 1089–1098. [Google Scholar] [CrossRef]
  39. Ke, P.-J.; Wan, J. Effects of soil microbes on plant competition: A perspective from modern coexistence theory. Ecol. Monogr. 2020, 90, e01391. [Google Scholar] [CrossRef]
  40. Vincent, J.M. The cultivation, isolation and maintenance of rhizobia. In A Manual for the Practical Study of the Root-Nodule Bacteria; Vincent, J.M., Ed.; Blackwell Scientific: Oxford, UK, 1970; pp. 1–13. [Google Scholar]
  41. Tsimilli-Michael, M. Revisiting JIP-test: An educative review on concepts, assumptions, approximations, definitions and terminology. Photosynthetica 2020, 58, 275–292. [Google Scholar] [CrossRef] [Green Version]
  42. Ievinsh, G.; Ieviņa, S.; Andersone-Ozola, U.; Samsone, I. Leaf sodium, potassium and electrolyte accumulation capacity of plant species from salt-affected coastal habitats of the Baltic Sea: Towards a definition of Na hyperaccumulation. Flora 2021, 274, 151748. [Google Scholar] [CrossRef]
  43. Aref, I.M.; Khan, P.R.; Khan, S.; El-Atta, H.; Ahmed, A.I.; Iqbal, M. Modulation of antioxidant enzymes in Juniperus procera needles in relation to habitat environment and dieback incidence. Trees 2016, 30, 1669–1681. [Google Scholar] [CrossRef]
  44. Luo, Q.; Yu, B.; Liu, Y. Differential sensitivity to chloride and sodium ions in seedlings of Glycine max and G. soja under NaCl stress. J. Plant Physiol. 2005, 162, 1003–1012. [Google Scholar] [CrossRef]
  45. Andersone, U.; Ievinsh, G. Changes of morphogenic competence in mature Pinus sylvestris L. in vitro. Ann. Bot. 2002, 90, 293–298. [Google Scholar] [CrossRef] [Green Version]
  46. R Core Team. R: A Language and Environment for Statistical Computing; R Foundation for Statistical Computing: Vienna, Austria, 2021; Available online: https://www.R-project.org/ (accessed on 15 October 2021).
  47. Karlsons, A.; Druva-Lusite, I.; Necajeva, J.; Andersone-Ozola, U.; Samsone, I.; Osvalde, A.; Ievinsh, G. Adaptation strategies of rare plant species to heterogeneous soil conditions on a coast of a lagoon lake as revealed by analysis of mycorrhizal symbiosis and mineral constituent dynamics. Environ. Exp. Biol. 2017, 15, 113–126. [Google Scholar]
  48. Wright, A.; Schnitzer, S.A.; Reich, P.B. Daily environmental conditions determine the competition–facilitation balance for plant water status. J. Ecol. 2015, 103, 648–656. [Google Scholar] [CrossRef]
  49. Callaway, R.M.; Walker, L.R. Competition and facilitation: A synthetic approach to interactions in plant communities. Ecology 1997, 78, 1958–1965. [Google Scholar] [CrossRef]
  50. Brooker, R.W.; Maestre, F.T.; Callaway, R.M.; Lortie, C.L.; Lohengrin, A.; Cavieres, L.A.; Kunstler, G.; Liancourt, P.; Tielbörger, K.; Travis, J.M.J.; et al. Facilitation in plant communities: The past, the present and the future. J. Ecol. 2008, 96, 18–34. [Google Scholar] [CrossRef] [Green Version]
  51. Biedrzycki, M.L.; Bais, H.P. Kin recognition in plants: A mysterious behaviour unsolved. J. Exp. Bot. 2010, 61, 4123–4128. [Google Scholar] [CrossRef] [PubMed] [Green Version]
  52. Bertness, M.D.; Shumway, S.W. Competition and facilitation in marsh plants. Am. Nat. 1993, 142, 716–724. [Google Scholar] [CrossRef] [PubMed]
  53. Ungar, I.A. Are biotic factors significant in influencing the distribution of halophytes in saline habitats? Bot. Rev. 1998, 64, 176–199. [Google Scholar] [CrossRef]
  54. Craine, J.M.; Dybzinski, R. Mechanisms of plant competition for nutrients, water and light. Funct. Ecol. 2013, 27, 833–840. [Google Scholar] [CrossRef]
  55. Rumbaugh, M.D.; Pendery, B.M.; James, D.W. Variation in the salinity tolerance of strawberry clover (Trifolium fragiferum L.). Plant Soil 1993, 153, 265–271. [Google Scholar] [CrossRef]
  56. Agarie, S.; Shimoda, T.; Shimizu, Y.; Baumann, K.; Sunagawa, H.; Kondo, A.; Ueno, O.; Nakahara, T.; Nose, A.; Cushman, J.C. Salt tolerance, salt accumulation, and ionic homeostasis in a epidermal bladder-cell-less mutant of the common ice plant Mesembryanthemum srystallinum. J. Exp. Bot. 2007, 58, 1957–1967. [Google Scholar] [CrossRef]
  57. White, A.C.; Colmer, T.D.; Cawthray, G.R.; Hanley, M.E. Variable response of three Trifolium repens ecotypes to soil flooding by seawater. Ann. Bot. 2014, 114, 347–355. [Google Scholar] [CrossRef] [Green Version]
  58. Lankau, R.A. Coevolution between invasive and native plants driven by chemical competition and soil biota. Proc. Nat. Acad. Sci. USA 2012, 109, 11240–11245. [Google Scholar] [CrossRef] [Green Version]
  59. García-Abellan, J.O.; Egea, I.; Pineda, B.; Sanchez-Bel, P.; Belver, A.; Garcia-Sogo, B.; Flores, F.B.; Atares, A.; Moreno, V.; Bolarin, M.C. Heterologous expression of the yeast HAL5 gene in tomato enhances salt tolerance by reducing shoot Na+ accumulation in the long term. Physiol. Plant. 2014, 152, 700–713. [Google Scholar] [CrossRef]
  60. Staal, M.; Maathuis, F.J.; Elzenga, J.T.M.; Overbeek, J.H.M.; Prins, H. Na+/H+ antiport activity in tonoplast vesicles from roots of the salt-tolerant Plantago maritima and the salt-sensitive Plantago media. Physiol. Plant. 1991, 82, 179–184. [Google Scholar] [CrossRef]
  61. Ksouri, R.; Megdiche, W.; Debez, A.; Falleh, H.; Grignon, C.; Abdelly, C. Salinity effects on polyphenol content and antioxidant activities in leaves of the halophyte Cakile maritima. Plant Physiol. Biochem. 2007, 45, 244–249. [Google Scholar] [CrossRef]
  62. Wang, S.; Zheng, W.; Ren, J.; Zhang, C. Selectivity of various types of salt-resistant plants for K+ over Na+. J. Arid Envrion. 2002, 52, 457–472. [Google Scholar] [CrossRef]
  63. Benzarti, M.; Rejeb, K.B.; Debez, A.; Messedi, D.; Abdelly, C. Photosynthetic activity and leaf antioxidative responses of Atriplex portulacoides subjected to extreme salinity. Acta Physiol. Plant. 2012, 34, 1679–1688. [Google Scholar] [CrossRef]
  64. Liu, S.; Dong, Y.; Xu, L.; Kong, J. Effects of foliar applications of nitric oxide and salicylic acid on salt-induced changes in photosynthesis and antioxidative metabolism of cotton seedlings. Plant Growth Reg. 2014, 73, 67–78. [Google Scholar] [CrossRef]
  65. Cekstere, G.; Karlsons, A.; Grauda, D. Salinity-induced responses and resistance in Trifolium repens L. Urban For. Urban Green. 2015, 14, 225–236. [Google Scholar] [CrossRef]
  66. Debez, A.; Koyro, H.-W.; Grignon, C.; Abdelly, C.; Huchzermeyer, B. Relationship between the photosynthetic activity and the performance of Cakile maritima after long-term salt treatment. Physiol. Plant. 2008, 133, 373–385. [Google Scholar] [CrossRef]
  67. Du, J.; Yu, F.-H.; Alpert, P.; Dong, M. Arbuscular mycorrhizal fungi reduce effects of physiological integration in Trifolium repens. Ann. Bot. 2009, 104, 335–343. [Google Scholar] [CrossRef] [PubMed] [Green Version]
  68. Talaat, N.B.; Shawky, B.T. Protective effects of arbuscular mycorrhizal fungi on wheat (Triticum aestivum L.) plants exposed to salinity. Environ. Exp. Bot. 2014, 98, 20–31. [Google Scholar] [CrossRef]
  69. Melino, V.J.; Drew, E.A.; Ballard, R.A.; Reeve, W.G.; Thomson, G.; White, R.G.; O’hara, G.W. Identifying abnormalities in symbiotic development between Trifolium spp. and Rhizobium leguminosarum bv. trifolii leading to sub-optimal and ineffective nodule phenotypes. Ann. Bot. 2012, 110, 1559–1572. [Google Scholar] [CrossRef] [PubMed] [Green Version]
  70. Ruan, J.; Gerendás, J.; Härdter, R.; Sattelmacher, B. Effect of nitrogen form and root-zone pH on growth and nitrogen uptake of tea (Camellia sinensis) plants. Ann. Bot. 2007, 99, 301–310. [Google Scholar] [CrossRef] [Green Version]
  71. Piwpuan, N.; Zhai, X.; Brix, H. Nitrogen nutrition of Cyperus laevigatus and Phormium tenax: Effects of ammonium versus nitrate on growth, nitrate reductase activity and N uptake kinetics. Aquat. Bot. 2013, 106, 42–51. [Google Scholar] [CrossRef]
  72. Crush, J.R.; Cosgrove, G.P.; Brougham, R.W. The effect of nitrogen fertiliser on clover nitrogen fixation in an intensively grazed Manawatu pasture. N. Z. J. Exp. Agric. 1982, 10, 395–399. [Google Scholar] [CrossRef] [Green Version]
  73. Iqbal, N.; Umar, S.; Khan, N.A. Nitrogen availability regulates proline and ethylene production and alleviates salinity stress in mustard (Brassica juncea). J. Plant Physiol. 2015, 178, 84–91. [Google Scholar] [CrossRef]
  74. Chanway, C.P.; Holl, F.B.; Turkington, R. Effect of Rhizobium leguminosarum biovar trifolii genotype on specificity between Trifolium repens and Lolium perenne. J. Ecol. 1989, 77, 1150–1160. [Google Scholar] [CrossRef]
  75. Zahran, H.H. Rhizobum-legume symbiosis and nitrogen fixation under severe conditions and in arid climate. Microbiol. Mol. Biol. Rev. 1999, 63, 968–989. [Google Scholar] [CrossRef] [Green Version]
  76. Cordovilla, M.P.; Ligero, F.; Lluch, C. The effect of salinity on N fixation and assimilation in Vicia faba. J. Exp. Bot. 1994, 45, 1483–1488. [Google Scholar] [CrossRef]
  77. Liu, X.Y.; Wang, E.T.; Li, Y.; Chen, W.X. Diverse bacteria isolated from root nodules of Trifolium, Crotalaria and Mimosa grown in the subtropical regions of China. Arch. Microbiol. 2007, 188, 1–14. [Google Scholar] [CrossRef] [PubMed]
  78. Zhang, H.; Kim, M.-S.; Sun, Y.; Dowd, S.E.; Shi, H.; Paré, P.W. Soil bacteria confer plant salt tolerance by tissue-specific regulation of the sodium transporter HKT1. Mol. Plant Microbe Interact. 2008, 21, 737–744. [Google Scholar] [CrossRef] [PubMed] [Green Version]
  79. Zhang, J.-L.; Aziz, M.; Qiao, Y.; Han, Q.-Q.; Li, J.; Wang, Y.-Q.; Shen, X.; Wang, S.-M.; Paré, P.W. Soil microbe Bacillus subtilis (GB03) induces biomass accumulation and salt tolerance with lower sodium accumulation in wheat. Crop Pasture Sci. 2014, 65, 423–427. [Google Scholar] [CrossRef]
  80. Khalid, M.; Bilal, M.; Hassani, D.; Iqbal, H.M.N.; Wang, H.; Huang, D. Mitigation of salt stress in white clover (Trifolium repens) by Azospirillum brasilense and its inoculation effect. Bot. Stud. 2017, 58, 5. [Google Scholar] [CrossRef] [PubMed] [Green Version]
  81. Yamauchi, Y.; Furutera, A.; Seki, K.; Toyoda, Y.; Tanaka, K.; Sugimoto, Y. Malondialdehyde generated from peroxidized linolenic acid causes protein modification in heat-stressed plants. Plant Physiol. Biochem. 2008, 46, 786–793. [Google Scholar] [CrossRef]
  82. Demiral, T.; Türkan, I. Comparative lipid peroxidation, antioxidant defense systems and proline content in roots of two rice cultivars differing in salt tolerance. Environ. Exp. Bot. 2005, 53, 247–257. [Google Scholar] [CrossRef]
  83. Bernstein, N.; Shoresh, M.; Xu, Y.; Huang, B. Involvement of the plant antioxidative response in the differential growth sensitivity to salinity of leaves vs roots during cell development. Free Radic. Biol. Med. 2010, 49, 1161–1171. [Google Scholar] [CrossRef]
  84. Rolny, N.; Costa, L.; Carrión, C.; Guiamet, J.J. Is the electrolyte leakage assay an unequivocal test of membrane deterioration during leaf senescence? Plant Physiol. Biochem. 2011, 49, 1220–1227. [Google Scholar] [CrossRef]
  85. Bor, M.; Ozdemir, F.; Türkan, I. The effect of salt stress on lipid peroxidation and antioxidants in leaves of sugar beet Beta vulgaris L. and wild beet Beta maritima L. Plant Sci. 2003, 164, 77–84. [Google Scholar] [CrossRef]
  86. Sekmen, A.H.; Türkan, I.; Takio, S. Differential responses of antioxidative enzymes and lipid peroxidation to salt stress in salt-tolerant Plantago maritima and salt-sensitive Plantago media. Physiol. Plant. 2007, 131, 399–411. [Google Scholar] [CrossRef] [PubMed]
  87. Ellouzi, H.; Hamed, K.B.; Cela, J.; Munné-Bosch, S.; Abdelly, C. Early effects of salt stress on the physiological and oxidative sstatus of Cakile maritima (halophyte) and Arabidopsis thaliana (glycophyte). Physiol. Plant. 2011, 142, 128–143. [Google Scholar] [CrossRef]
  88. Lee, M.R.F.; Tweed, J.K.S.; Minchin, F.R.; Winters, A.L. Red clover polyphenol oxidase: Activation, activity and efficacy under grazing. Anim. Feed Sci. Technol. 2009, 149, 250–264. [Google Scholar] [CrossRef]
  89. Evans, J.R. Photosynthesis and nitrogen relationships in leaves of C3 plants. Oecologia 1989, 78, 9–19. [Google Scholar] [CrossRef] [PubMed]
  90. Da Costa Neto, V.P.; Mendes, J.B.S.; de Araújo, A.S.F.; de Alcântra Neto, F.; Bonifacio, A.; Rodrigues, A.C. Symbiotic performance, nitrogen flux and growth of lima bean (Phaseolus lunatus L.) varieties inoculated with different indigenous strains of rhizobia. Symbiosis 2017, 73, 117–124. [Google Scholar] [CrossRef]
Figure 1. Na+ (A) and K+ (B) concentration, and K+/Na+ concentration ratio (C) in different parts of coexisting T. fragiferum and T. repens plants in field conditions of a salt-affected wetland. Different letters indicate significant differences between the treatments (p < 0.05).
Plants 10 02196 g001
Figure 2. Shoot fresh mass (A) and dry mass (B) of T. fragiferum and T. repens plants grown in initially sterile soil. Data are the means from five replicates ± SE, the results are expressed on a single plant basis. –i, without inoculant; +iTF, with inoculant isolated from T. fragiferum; +iTR, with inoculant isolated from T. repens; –Na, no NaCl added; +Na, NaCl up to 400 mM. Different letters indicate significant differences between the treatments (p < 0.05).
Plants 10 02196 g002
Figure 3. Time course of chlorophyll concentration in leaves of T. fragiferum in single species conditions (A), T. fragiferum in species coexistence conditions (B), T. repens in single species conditions (C), T. repens in species coexistence conditions (D). Each data point represents the mean from three randomly selected containers per treatment with three measurements per container ±SE. –i, without rhizobial inoculation; +iTF, inoculated with rhizobia from T. fragiferum; +TR, inoculated with rhizobia from T. repens.
Plants 10 02196 g003
Figure 4. Time course of chlorophyll a fluorescence parameter Performance Index in leaves of T. fragiferum in single species conditions (A), T. fragiferum in species coexistence conditions (B), T. repens in single species conditions (C), T. repens in species coexistence conditions (D). Each data point represents the mean from three randomly selected containers per treatment with three measurements per container ±SE. –i, without rhizobial inoculation; +iTF, inoculated with rhizobia from T. fragiferum; +TR, inoculated with rhizobia from T. repens.
Plants 10 02196 g004
Figure 5. Peroxidase activity in leaves (A) and leaf petioles (B) of T. fragiferum and T. repens at the harvest. Data are the means from three replicates ± SE, the results are expressed on fresh mass basis. –i, without inoculant; +iTF, with inoculant isolated from T. fragiferum; +iTR, with inoculant isolated from T. repens; −Na, no NaCl added; +Na, NaCl up to 400 mM. Different letters indicate significant differences between the treatments (p < 0.05).
Plants 10 02196 g005
Figure 6. Polyphenol oxidase activity in leaves (A) and leaf petioles (B) of T. fragiferum and T. repens at the harvest. Data are the means from three replicates ± SE, the results are expressed on fresh mass basis. −i, without inoculant; +iTF, with inoculant isolated from T. fragiferum; +iTR, with inoculant isolated from T. repens; −Na, no NaCl added; +Na, NaCl up to 400 mM. Different letters indicate significant differences between the treatments (p < 0.05).
Plants 10 02196 g006
Figure 7. TBARS concentration in leaves (A) and electrolyte leakage (B) of T. fragiferum and T. repens at the harvest. Data are the means from three replicates ± SE, the results for TBARS are expressed on dry mass basis. −i, without inoculant; +iTF, with inoculant isolated from T. fragiferum; +iTR, with inoculant isolated from T. repens; −Na, no NaCl added; +Na, NaCl up to 400 mM. Different letters indicate significant differences between the treatments (p < 0.05).
Plants 10 02196 g007
Table 1. Experimental treatments used in the present study.
TreatmentT. fragiferumT. repensiTFiTRNaCl
TFss–i–NaCl+++
TFss–i+NaCl+++
TFss+iTF–NaCl+++
TFss+iTF+NaCl++++
TFss+iTR–NaCl+++
TFss+iTR+NaCl++++
TFTR–i–NaCl++
TFTR–i+NaCl+++
TFTR+iTF–NaCl+++
TFTR+iTF+NaCl++++
TFTR+iTR–NaCl+++
TFTR+iTR+NaCl++++
TRss–i–NaCl++
TRss–i+NaCl+++
TRss+iTF–NaCl+++
TRss+iTF+NaCl++++
TRss+iTR–NaCl+++
TRss+iTR+NaCl++++
ss, single species; –i, without bacterial inoculant; +iTF, with inoculant from T. fragiferum; +iTR, with inoculant from T. repens; –NaCl, no NaCl added; +NaCl, NaCl up to 400 mM.
Table 2. Changes of substrate electrical conductivity (EC, mS m−1) during the experiment.
TreatmentWeek 2Week 4Week 6
TFss–i–NaCl89.5 ± 5.7 ef71.4 ± 2.7 e53.3 ± 3.6 gh
TFss–i+NaCl119.9 ± 10.3 abc163.9 ± 14.6 bcd252.4 ± 8.8 cd
TFss+iTF–NaCl107.0 ± 5.4 cd68.3 ± 4.9 ef53.5 ± 8.8 gh
TFss+iTF+NaCl132.6 ± 4.4 a148.1 ± 8.0 d235.7 ± 9.1 de
TFss+iTR–NaCl87.4 ± 6.8 ef70.1 ± 2.4 e50.1 ± 1.8 h
TFss+iTR+NaCl112.3 ± 5.5 bcd145.9 ± 8.9 d230.8 ± 9.2 e
TFTR–i–NaCl81.7 ± 6.6 f58.1 ± 2.3 g50.1 ± 2.1 h
TFTR–i+NaCl115.3 ± 3.0 bc183.6 ± 6.3 ab270.7 ± 8.1 abc
TFTR+iTF–NaCl129.8 ± 11.8 a76.6 ± 3.6 e71.4 ± 5.4 f
TFTR+iTF+NaCl121.5 ± 7.4 ab181.1 ± 5.3 ab255.7 ± 24.4 abcd
TFTR+iTR–NaCl94.9 ± 3.7 ef65.7 ± 3.3 efg58.2 ± 1.1 g
TFTR+iTR+NaCl105.7 ± 3.8 cd156.5 ± 7.4 cd262.7 ± 5.0 bc
TRss–i–NaCl93.8 ± 5.0 ef60.6 ± 2.3 fg55.2 ± 4.2 gh
TRss–i+NaCl103.9 ± 4.9 de190.7 ± 11.0 a289.5 ± 6.6 a
TRss+iTF–NaCl113.5 ± 6.1 bcd56.6 ± 2.9 g55.1 ± 1.5 gh
TRss+iTF+NaCl123.5 ± 6.4 ab173.5 ± 6.6 abc264.7 ± 12.7 abc
TRss+iTR–NaCl105.2 ± 8.2 cd61.3 ± 2.0 fg52.7 ± 2.5 h
TRss+iTR+NaCl133.5 ± 4.9 a177.5 ± 8.0 ab273.3 ± 7.4 ab
Data are the means from five replicates with four measurements per container per treatment in each time point. Different letters within a column indicate significant differences between the treatments (p < 0.05). ss, single species; –i, without bacterial inoculant; +iTF, with inoculant from T. fragiferum; +iTR, with inoculant from T. repens; −NaCl, no NaCl added; +NaCl, NaCl up to 400 mM.
Table 3. ANOVA analysis of substrate electrical conductivity.
Source of VariationdfMean SquareF
Species coexistence2339412.81 ***
Inoculant210463.95 *
NaCl1797 7953012.24 ***
Time259684225.35 ***
Species coexistence × inoculant48043.04 *
Species coexistence × NaCl2350613.24 ***
Inoculant × NaCl221658.18 ***
Species coexistence × time44891.85
Inoculant × time416616.27 ***
NaCl × time2193 783731.67 ***
Species coexistence × inoculant × NaCl44141.56
Residuals240265
* p < 0.05, *** p < 0.001.
Table 4. Morphological characteristics of T. fragiferum and T. repens plants grown in initially sterile soil.
TreatmentH2O Content (g g−1 DM)Number of LeavesNumber of StolonsTotal Stolon Length (mm)Average Stolon Length (mm)
T. fragiferum
TFss–i–NaCl4.9736 ± 92 bcd44.3 ± 5.7 def1097 ± 136 ef25.0 ± 2.3 defg
TFss–i+NaCl5.8829 ± 89 abc55.3 ± 6.4 cd1465 ± 122 b27.5 ± 2.3 cdef
TFss+iTF–NaCl4.2607 ± 75 def52.0 ± 6.0 cde1516 ± 174 b30.0 ± 3.5 bcd
TFss+iTF+NaCl4.5835 ± 99 ab57.5 ± 5.0 bc2084 ± 189 a36.5 ± 3.8 ab
TFss+iTR–NaCl4.3725 ± 13 cd42.3 ± 4.8 efg1087 ± 32 ef23.3 ± 1.8 fg
TFss+iTR+NaCl5.4697 ± 77 cd37.0 ± 5.6 f1352 ± 151 bcd37.5 ± 2.5 a
TFsc–i–NaCl4.3345 ± 37 i33.5 ± 5.5 g714 ± 31 g21.5 ± 2.5 gh
TFsc–i+NaCl4.7585 ± 5 ef34.5 ± 3.5 f1111 ± 83 def33.0 ± 3.0 abc
TFsc+iTF–NaCl4.7539 ± 20 fg54.5 ± 2.5 cd1456 ± 48 b26.5 ± 1.5 defg
TFsc+iTF+NaCl5.2478 ± 11 gh42.0 ± 5.0 efg1363 ± 156 bcd32.5 ± 0.5 bc
TFsc+iTR–NaCl2.5510 ± 75 fg32.5 ± 4.5 g1097 ± 95 ef34.0 ± 2.7 ab
TFsc+iTR+NaCl5.3939 ± 130 ab77.0 ± 11.0 a2255 ± 182 a29.5 ± 0.5 cd
T. repens
TRss–i–NaCl3.5599 ± 48 def27.0 ± 3.4 h656 ± 75 g24.0 ± 2.2 efg
TRss–i+NaCl3.5385 ± 16 hj31.8 ± 2.8 h775 ± 71 g25.0 ± 3.5 defg
TRss+iTF–NaCl3.3652 ± 16 de26.8 ± 2.8 h1049 ± 98 ef40.5 ± 5.5 a
TRss+iTF+NaCl3.2687 ± 69 cd40.3 ± 4.3 fg1106 ± 96 def27.5 ± 0.5 def
TRss+iTR–NaCl3.3556 ± 49 efg45.0 ± 3.9 def1176 ± 102 cde26.0 ± 2.8 defg
TRss+iTR+NaCl3.4861 ± 77 ab70.5 ± 6.9 ab1560 ± 112 b22.0 ± 2.9 fgh
TRsc–i–NaCl3.0435 ± 78 ghi38.5 ± 4.5 fgh641 ± 78 g16.0 ± 3.0 hi
TRsc–i+NaCl3.3486 ± 68 fgh27.5 ± 2.5 h776 ± 12 g29.0 ± 3.0 cde
TRsc+iTF–NaCl4.2962 ± 108 a57.5 ± 6.5 bc1626 ± 178 b27.5 ± 3.8 cdef
TRsc+iTF+NaCl3.8817 ± 94 abc63.5 ± 6.6 abc1478 ± 172 b22.0 ± 3.5 fgh
TRsc+iTR–NaCl6.4773 ± 79 abc40.5 ± 3.5 fg957 ± 12 f24.0 ± 2.0 efg
TRsc+iTR+NaCl3.7394 ± 31 hi39.0 ± 4.6 fgh516 ± 98 g14.0 ± 2.5 i
Data are the means from five replicates ± SE, the results are expressed on a single plant basis. TF, T. fragiferum; TR, T. repens; ss, single species; sc, species coexistence; –i, without inoculant; +iTF, with inoculant isolated from T. fragiferum; +iTR, with inoculant isolated from T. repens; –NaCl, no NaCl added; +NaCl, NaCl up to 400 mM. Different letters within a column indicate significant differences between the treatments (p < 0.05).
Table 5. ANOVA analysis of shoot mass parameters.
Source of VariationdfShoot Fresh MassShoot Dry Mass
Mean SquareFω2Mean SquareFω2
Species coexistence
Inoculant
NaCl
2305313.58 ***0.0788.220.73–0.002
2623327.73 ***0.165243.1621.68 ***0.188
1368016.37 ***0.04825.102.240.006
Species
Species coexistence × inoculant
160.03–0.00372.276.44 *0.025
43751.370.00810.000.89–0.002
Species coexistence × NaCl
Inoculant × NaCl
Inoculant × species
NaCl × species
2238510.61 ***0.05943.393.87 *0.026
21840.82–0.0010.040.00–0.009
29164.08 *0.019225.4620.10 ***0.174
11613371.79 ***0.21971.096.34 *0.024
Species coexistence × inoculant × NaCl41730.77–0.035.350.48–0.009
Inoculant × NaCl × species
Residuals
217187.64 ***0.04152.354.67 *0.033
96225 11.22
* p < 0.05, *** p < 0.001.
Table 6. Relative effect of NaCl (values from the respective treatment combinations without NaCl were indicated as 100%) on total fresh and dry mass of shoots of the two Trifolium species.
TreatmentRelative Mass (%)
T. fragiferumT. repens
Single SpeciesSpecies CoexistenceSingle SpeciesSpecies Coexistence
FMDMFMDMFMDMFM
–i171 ± 6 *147 ± 13 *183 ± 28 *168 ± 24 *75 ± 6 *75 ± 4 *102 ± 1393 ± 6
+iTF132 ± 6 *125 ± 9 *205 ± 22 *188 ± 23 *98 ± 6100 ± 554 ± 3 *59 ± 4 *
+iTR151 ± 4 *125 ± 6 *176 ± 19 *96 ± 14104 ± 4101 ± 571 ± 17 *112 ± 27
The data are derived from Table 4. Significant differences (p < 0.05) from the respective control without NaCl are indicated by *.
Table 7. Relative effect of inoculation with two types of rhizobia (values from the respective treatment combinations without inoculant were indicated as 100%) on total fresh and dry mass of shoots of the two Trifolium species.
TreatmentRelative Mass (%)
T. fragiferumT. repens
Single SpeciesSpecies CoexistenceSingle SpeciesSpecies Coexistence
FMDMFMDMFMDMFM
–NaCl, iTF145 ± 5 *161 ± 7 *148 ± 15 *138 ± 10 *200 ± 8 * 126 ± 7 *119 ± 4207 ± 14 *
+NaCl, iTF114 ± 5138 ± 10 *166 ± 17 *155 ± 19 *106 ± 5168 ± 8 *156 ± 9 *96 ± 7
–NaCl, iTR117 ± 7130 ± 9 *188 ± 31 *280 ± 19 *151 ± 21 *127 ± 8 *121 ± 4 *81 ± 14
The data are derived from Table 4. Significant differences (p < 0.05) from the respective control without inoculant are indicated by *.
Table 8. Relative effect of species coexistence (values from the respective treatment combinations in single species conditions were indicated as 100%) on total fresh and dry mass of shoots of the two Trifolium species.
TreatmentRelative Mass (%)
T. fragiferumT. repens
–NaCl+NaCl–NaCl+NaCl
FMDMFMDMFMDMFM
–i61 ± 6 *67 ± 6 *65 ± 9 *77 ± 11 *98 ± 15111 ± 13134 ± 17 *138 ± 9 *
+iTF62 ± 6 *58 ± 4 *97 ± 1087 ± 11164 ± 7 *134 ± 13 *91 ± 479 ± 6 *
+iTR98 ± 16145 ± 10 *112 ± 13112 ± 16122 ± 1771 ± 13 *83 ± 1978 ± 19
The data are derived from Table 4. Significant differences (p < 0.05) from the respective control without species coexistence are indicated by *.
Table 9. ANOVA analysis of leaf chlorophyll concentration and Performance Index.
Source of VariationdfChlorophyll ConcentrationPerformance Index
Mean SquareFMean SquareF
Species coexistence218635764.96 ***1.021.40
Inoculant21594961555.991 ***179.57247.36 ***
NaCl112110.421.582.18
Species18955931.22 ***3.024.16 *
Time513910348.49 ***64.5388.89 ***
Species coexistence × inoculant411612640.48 ***29.4340.53 ***
Species coexistence × NaCl2224397.82 ***18.6325.66 ***
Inoculant × NaCl25226518.22 ***2.863.94 *
Inoculant × species23457012.05 ***12.8517.70 ***
NaCl × species182782.890.020.03
NaCl × time5230328.03 ***2.653.66 **
Species coexistence × time10171785.99 ***2.613.59 ***
Inoculant × time1015353953.52 ***12.3717.04 ***
Species × time553821.884.245.84 ***
Species coexistence × inoculant × NaCl43166811.04 ***3.614.98 ***
Inoculant × NaCl × species2238688.32 ***2.733.76 *
Residuals12372869 0.73
* p < 0.05, ** p < 0.01, *** p < 0.001.
Table 10. Tissue Na+ concentration (g kg−1 DM) in different parts of T. fragiferum and T. repens at the harvest.
TreatmentStolonsLeavesPetiolesFlowersFlower Stalks
T. fragiferum
TFss–i–NaCl0.93 ± 0.16 d0.49 ± 0.06 f0.71 ± 0.11 de
TFss–i+NaCl12.75 ± 0.25 a10.08 ± 0.08 a19.83 ± 1.33 b
TFss+iTF–NaCl0.78 ± 0.05 e0.56 ± 0.01 f0.61 ± 0.04 e
TFss+iTF+NaCl9.75 ± 1.42 b9.92 ± 0.92 ab19.17 ± 0.83 b
TFss+iTR–NaCl0.99 ± 0.33 d0.66 ± 0.06 e0.88 ± 0.15 d
TFss+iTR+NaCl10.25 ± 1.08 b8.58 ± 0.42 bc23.25 ± 0.42 a
TFsc–i–NaCl0.80 ± 0.35 e0.73 ± 0.23 e0.73 ± 0.21 de
TFsc–i+NaCl7.38 ± 0.71 c6.41 ± 1.36 d17.22 ± 0.94 c
TFsc+iTF–NaCl0.96 ± 0.24 d0.82 ± 0.19 e0.99 ± 0.17 d
TFsc+iTF+NaCl7.13 ± 1.70 c7.92 ± 0.25 cd17.17 ± 0.94 c
TFsc+iTR–NaCl1.04 ± 0.01 d0.67 ± 0.07 e0.83 ± 0.07 d
TFsc+iTR+NaCl9.58 ± 0.42 b7.08 ± 0.25 d19.08 ± 0.08 b
T. repens
TRss–i–NaCl0.19 ± 0.02 e0.41 ± 0.08 f0.42 ± 0.10 d0.40 ± 0.07 d0.27 ± 0.08 g
TRss–i+NaCl3.63 ± 1.37 ab6.08 ± 0.58 a11.33 ± 1.83 a0.70 ± 0.12 c2.12 ± 0.74 d
TRss+iTF–NaCl0.25 ± 0.08 e0.49 ± 0.08 ef0.51 ± 0.01 d0.37 ± 0.06 d0.45 ± 0.05 f
TRss+iTF+NaCl4.32 ± 0.92 a3.09 ± 1.71 bc5.87 ± 1.24 b1.57 ± 0.88 b5.24 ± 0.74 b
TRss+iTR–NaCl0.32 ± 0.07 e0.45 ± 0.08 f0.44 ± 0.08 d0.32 ± 0.12 de0.37 ± 0.18 fg
TRss+iTR+NaCl4.97 ± 0.53 a7.02 ± 1.65 a14.92 ± 1.92 a1.83 ± 0.10 a7.83 ± 0.76 a
TRsc–i–NaCl0.65 ± 0.17 d1.09 ± 0.44 d0.25 ± 0.05 e0.20 ± 0.04 e0.27 ± 0.05 g
TRsc–i+NaCl1.47 ± 0.27 c0.69 ± 0.12 e2.08 ± 0.75 c0.49 ± 0.17 d1.31 ± 0.28 e
TRsc+iTF–NaCl0.27 ± 0.12 e0.41 ± 0.13 f0.41 ± 0.13 d0.34 ± 0.06 d0.52 ± 0.08 f
TRsc+iTF+NaCl2.72 ± 0.38 b2.56 ± 0.64 c6.03 ± 0.93 b0.80 ± 0.12 bc3.60 ± 0.44 c
TRsc+iTR–NaCl0.14 ± 0.03 f0.28 ± 0.02 g0.27 ± 0.07 e0.27 ± 0.05 e0.23 ± 0.04 g
TRsc+iTR+NaCl4.17 ± 0.30 ab5.19 ± 1.14 ab7.42 ± 0.92 b1.89 ± 0.21 a6.13 ± 0.53 b
Data are the means from three replicates ± SE. TF, T. fragiferum; TR, T. repens; ss, single species; sc, species coexistence; −i, without inoculant; +iTF, with inoculant isolated from T. fragiferum; +iTR, with inoculant isolated from T. repens; −NaCl, no NaCl added; +NaCl, NaCl up to 400 mM. Different letters within a column indicate significant differences between the treatments (p < 0.05).
Table 11. Tissue K+ concentration (g kg−1 DM) in different parts of T. fragiferum and T. repens at the harvest and leaf K+/Na+ concentration ratio.
TreatmentStolonsLeavesPetiolesFlowersFlower StalksLeaf K+:Na+ Ratio
T. fragiferum
TFss–i–NaCl6.24 ± 1.93 a5.33 ± 0.17 c10.50 ± 1.00 ab10.88
TFss–i+NaCl4.38 ± 0.41 ab6.00 ± 0.30 ab8.42 ± 0.25 d0.60
TFss+iTF–NaCl2.33 ± 0.10 d5.83 ± 0.33 abc9.92 ± 0.92 bc10.41
TFss+iTF+NaCl2.71 ± 0.51 cd5.23 ± 0.27 c8.33 ± 0.35 d0.53
TFss+iTR–NaCl3.95 ± 1.22 ab6.67 ± 0.33 a11.08 ± 0.42 ab10.11
TFss+iTR+NaCl3.46 ± 0.16 bc4.99 ± 0.18 cd7.92 ± 0.42 d0.58
TFsc–i–NaCl4.11 ± 1.72 ab5.42 ± 0.75 bc8.22 ± 1.28 cd7.43
TFsc–i+NaCl2.84 ± 0.34 cd4.20 ± 0.65 d6.02 ± 0.48 e0.66
TFsc+iTF–NaCl3.11 ± 0.15 bcd6.89 ± 0.95 ab8.61 ± 0.39 cd7.18
TFsc+iTF+NaCl3.22 ± 0.92 bcd4.96 ± 0.04 cd8.58 ± 0.08 d0.63
TFsc+iTR–NaCl3.83 ± 1.06 ab6.25 ± 0.25 ab11.67 ± 0.50 a9.33
TFsc+iTR+NaCl3.34 ± 0.18 bc5.00 ± 0.83 cd8.58 ± 0.92 cd0.71
T. repens
TRss–i–NaCl4.07 ± 0.35 bc6.92 ± 0.79 ab7.75 ± 0.08 c9.50 ± 0.56 ab4.15 ± 0.10 e16.88
TRss–i+NaCl3.73 ± 0.58 bc7.67 ± 0.67 a10.08 ± 0.92 a9.00 ± 0.68 bc7.00 ± 0.14 c1.26
TRss+iTF–NaCl2.58 ± 0.48 def6.17 ± 0.17 c8.33 ± 0.33 b10.42 ± 0.42 a4.88 ± 0.34 d12.59
TRss+iTF+NaCl1.74 ± 0.40 f6.89 ± 0.49 abc9.39 ± 0.78 ab8.25 ± 0.08 bcd6.83 ± 0.67 c2.23
TRss+iTR–NaCl2.48 ± 0.27 def6.75 ± 0.58 abc6.92 ± 0.25 d8.67 ± 0.67 bcd5.15 ± 0.68 d15.00
TRss+iTR+NaCl2.37 ± 0.27 def7.58 ± 0.08 a6.67 ± 0.67 d7.67 ± 0.43 d4.88 ± 0.67 d1.08
TRsc–i–NaCl4.87 ± 0.81 ab7.26 ± 0.71 ab6.71 ± 0.63 d8.17 ± 0.56 cd8.00 ± 7.25 b6.67
TRsc–i+NaCl2.72 ± 0.30 de6.51 ± 0.58 bc9.00 ± 0.67ab9.35 ± 0.60 bc10.29 ± 1.48 ab9.44
TRsc+iTF–NaCl2.20 ± 0.40 ef6.69 ± 0.50 abc6.29 ± 0.44 d8.08 ± 0.96 cd3.18 ± 0.35 f16.32
TRsc+iTF+NaCl3.30 ± 0.51 cd6.50 ± 0.38 bc10.33 ± 0.89 a7.67 ± 0.44 d4.98 ± 0.22 d2.54
TRsc+iTR–NaCl2.08 ± 0.36 ef6.17 ± 0.50 c5.05 ± 0.28 e8.00 ± 0.65 cd4.49 ± 0.06 de22.04
TRsc+iTR+NaCl4.92 ± 0.22 a7.36 ± 0.14 a9.75 ± 0.58 a7.83 ± 0.42 d10.00 ± 0.77 a1.42
Data are the means from three replicates ± SE. TF, T. fragiferum; TR, T. repens; ss, single species; sc, species coexistence; –i, without inoculant; +iTF, with inoculant isolated from T. fragiferum; +iTR, with inoculant isolated from T. repens; −NaCl, no NaCl added; +NaCl, NaCl up to 400 mM. Different letters within a column indicate significant differences between the treatments (p < 0.05).
Table 12. ANOVA analysis of tissue Na+ and K+ concentration.
Source of VariationdfNa+ ConcentrationK+ Concentration
StolonsLeavesPetiolesLeaves
Mean SquareFMean SquareFMean SquareFMean SquareF
Species Coexistence21.9113.07 ***0.401.330.818.17 **0.0725.04 *
Inoculant20.020.170.040.130.171.680.0030.20
NaCl134.93239.22 ***30.00 ***100.78 ***55.90564.71 ***0.0211.50
Species13.9426.99 ***1.95 *6.55 *4.3143.52 ***0.1510.56 **
Residuals170.15 0.30 0.10 0.014
The data were log-transformed before analysis. * p < 0.05, ** p < 0.01, *** p < 0.001.
Table 13. ANOVA analysis of oxidative enzyme activity and tissue electrolyte leakage.
Peroxidase ActivityPolyphenol Oxidase ActivityElectrolyte Leakage
LeavesPetiolesPetiolesLeaves
Mean SquareFMean SquareFMean SquareFMean SquareF
Species Coexistence240906.53 **4.1442.71 ***17.882.7138.01.44
Inoculant233435.34 *0.090.891.120.1748.11.82
NaCl1799512.77 **0.000.0017.022.61737.027.87 ***
Species11558624.89 ***5.5457.20 ***76.6011.74 **10.30.39
Residuals17626 0.10 6.53 26.4
* p < 0.05, ** p < 0.01, *** p < 0.001.
Publisher’s Note: MDPI stays neutral with regard to jurisdictional claims in published maps and institutional affiliations.

