
Physiological and Molecular Responses of ‘Dusa’ Avocado Rootstock to Water Stress: Insights for Drought Adaptation

 , , , and
Abstract
:1. Introduction
2. Results and Discussion
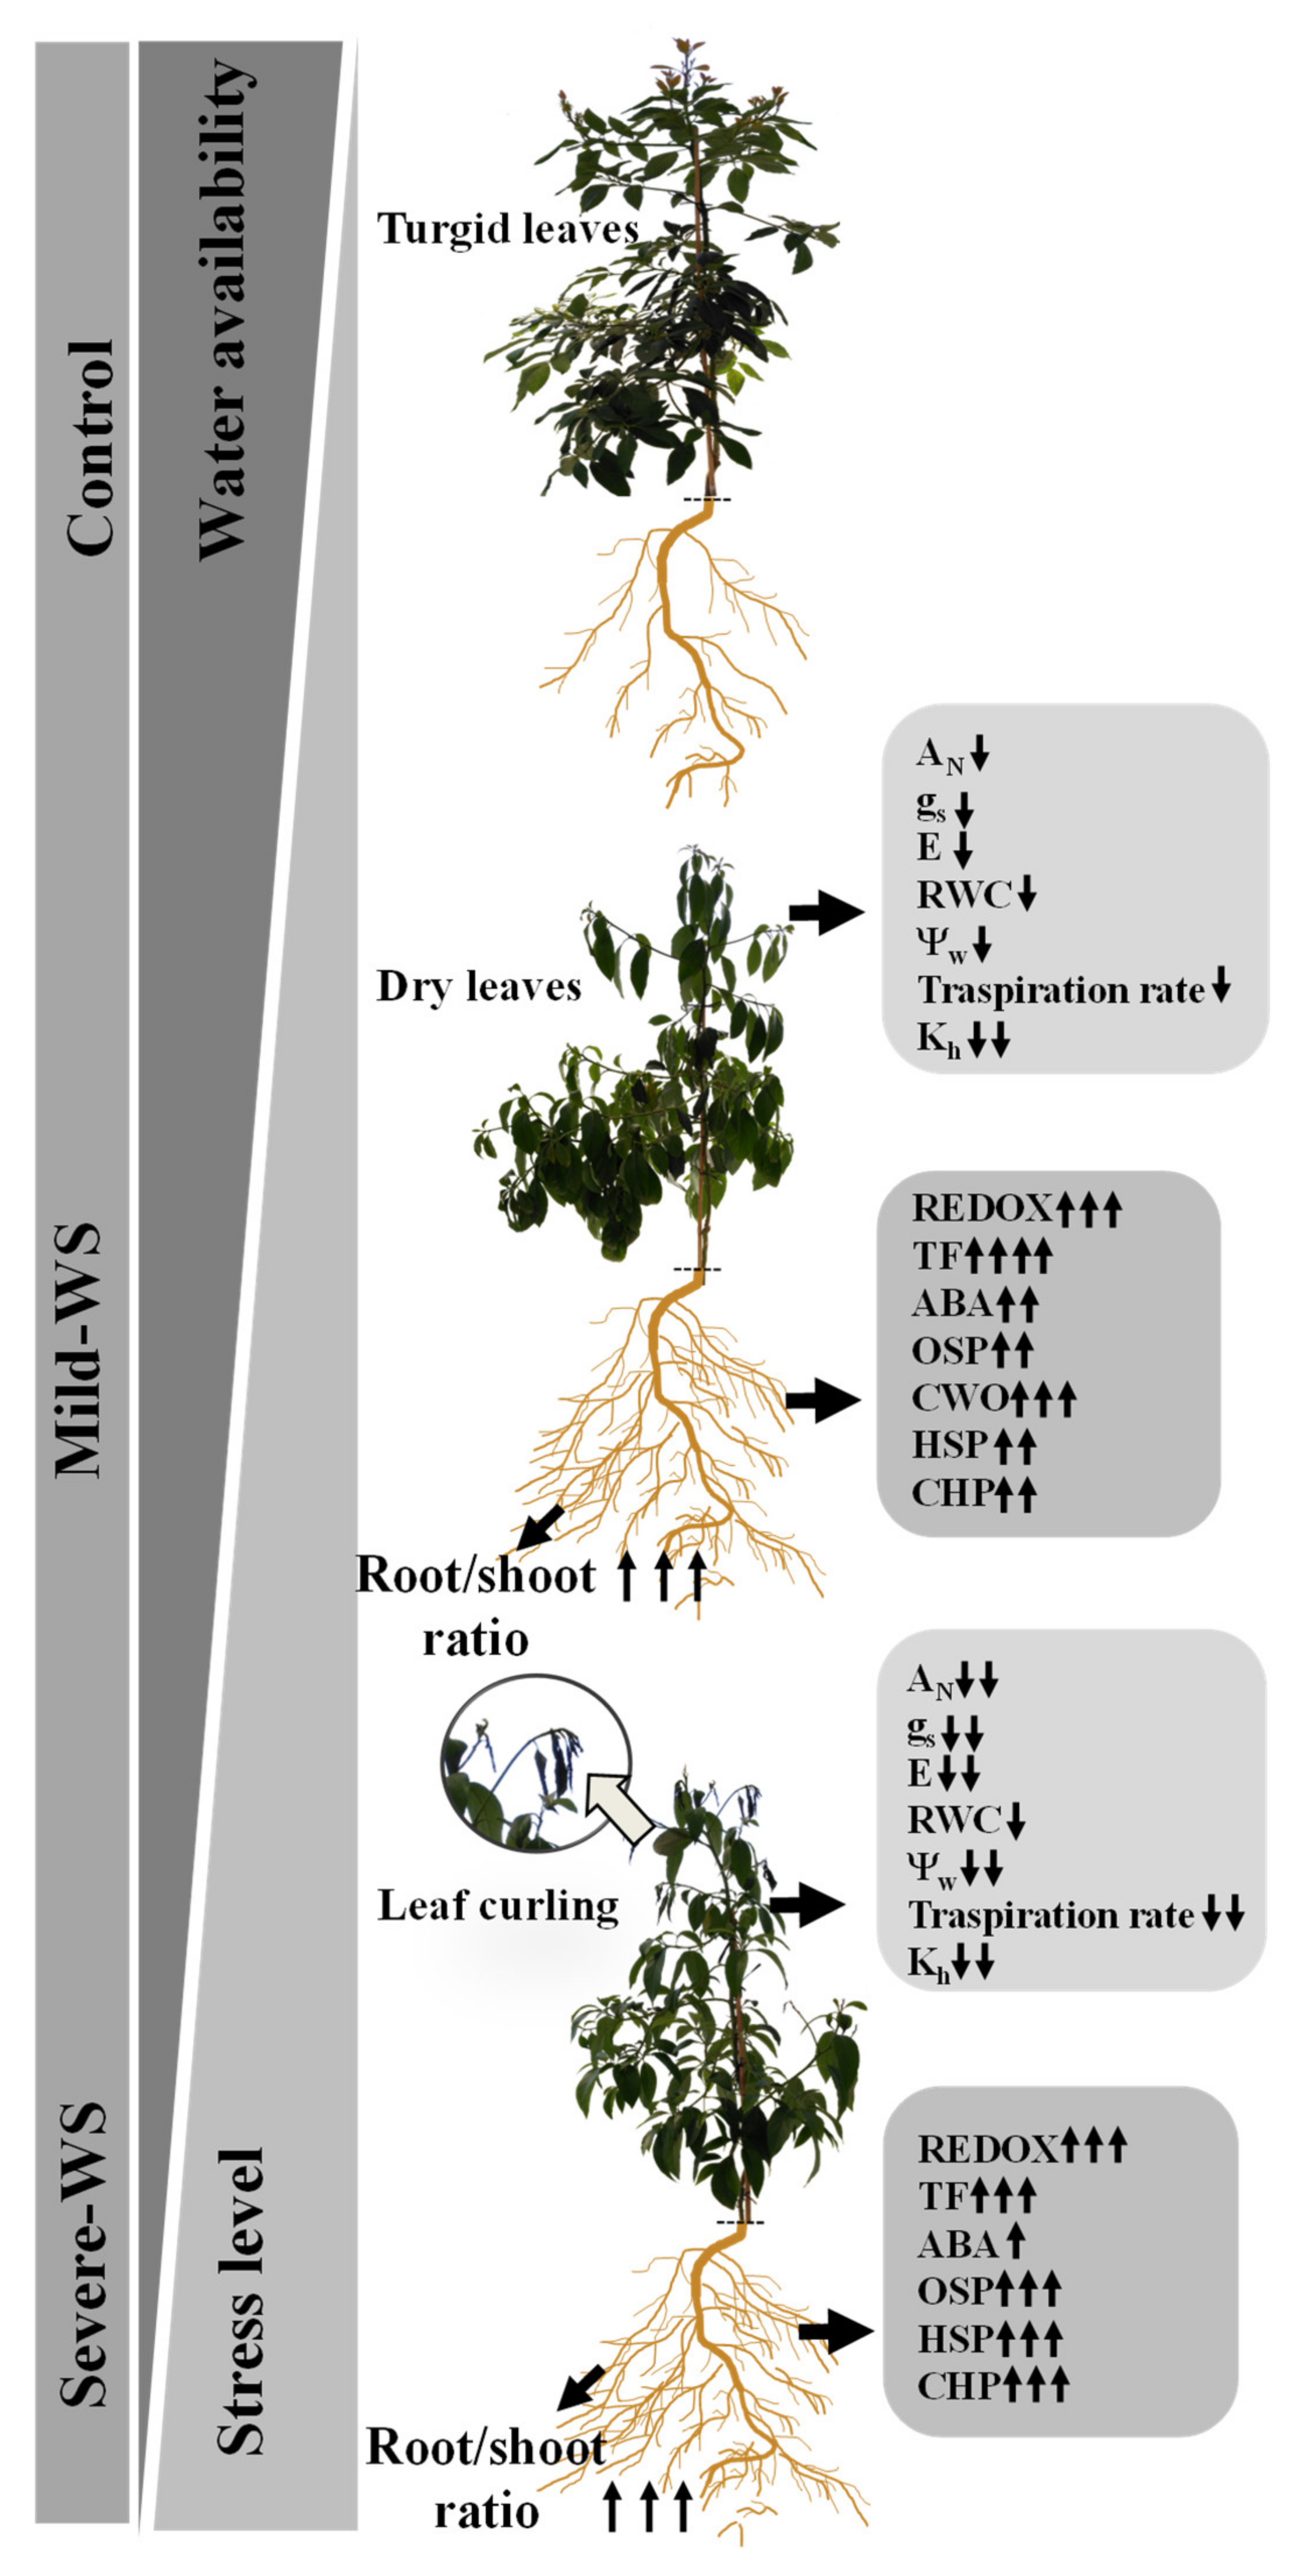
2.1. Physiological Response to Drought Stress and Rewatering
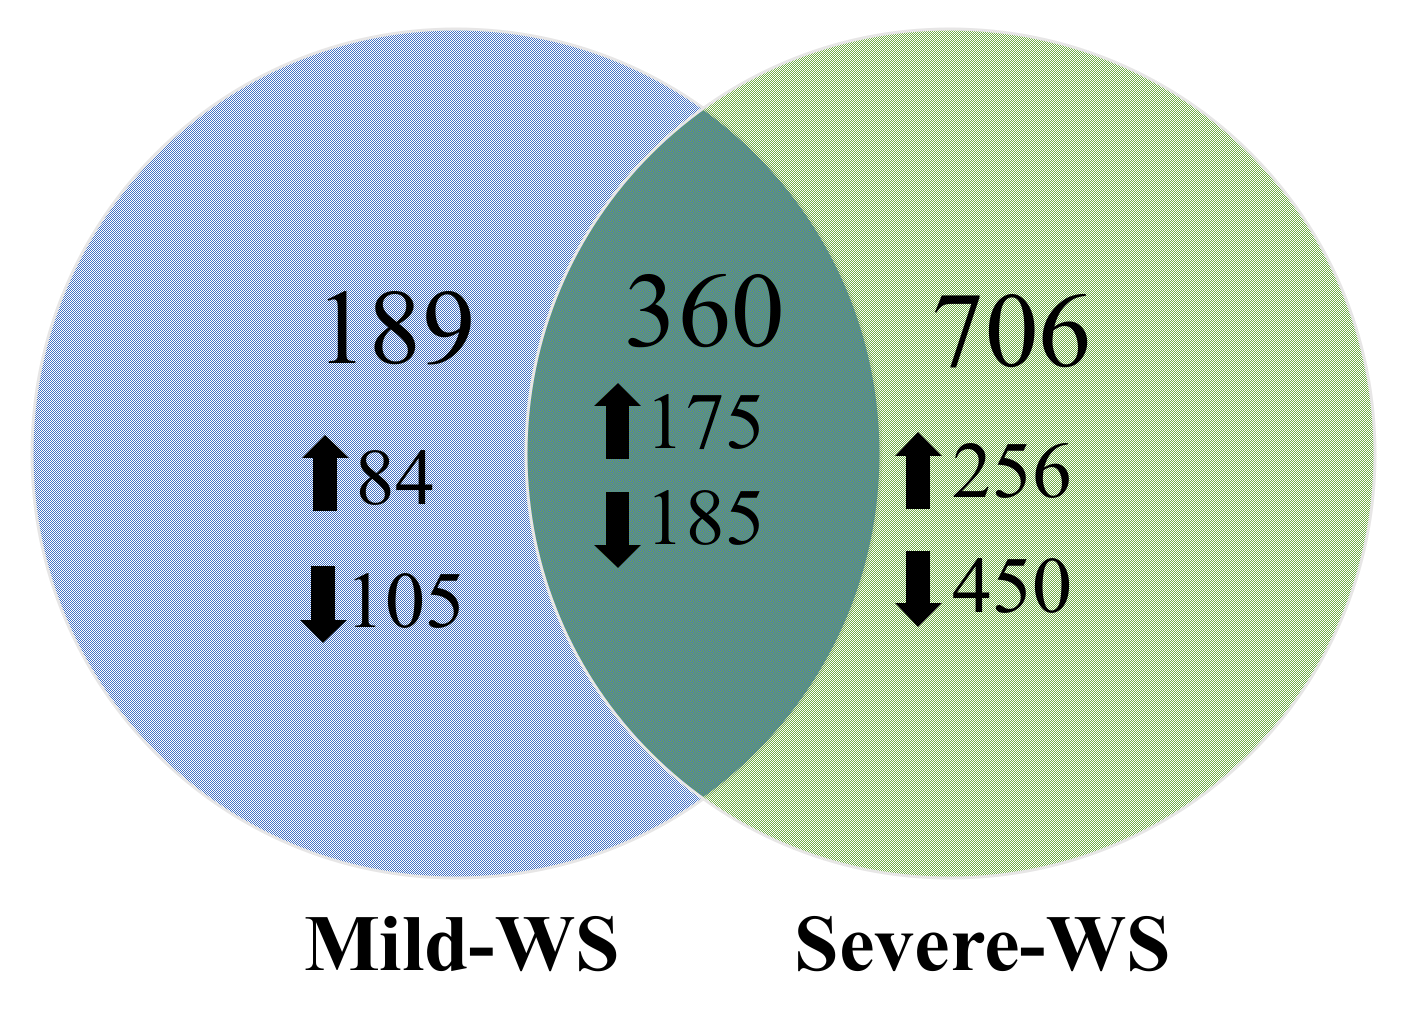
2.2. Transcriptional Responses of ‘Dusa’ Avocado Rootstock Subjected to Mild and Severe Water Stress
2.3. Validation of the Microarray
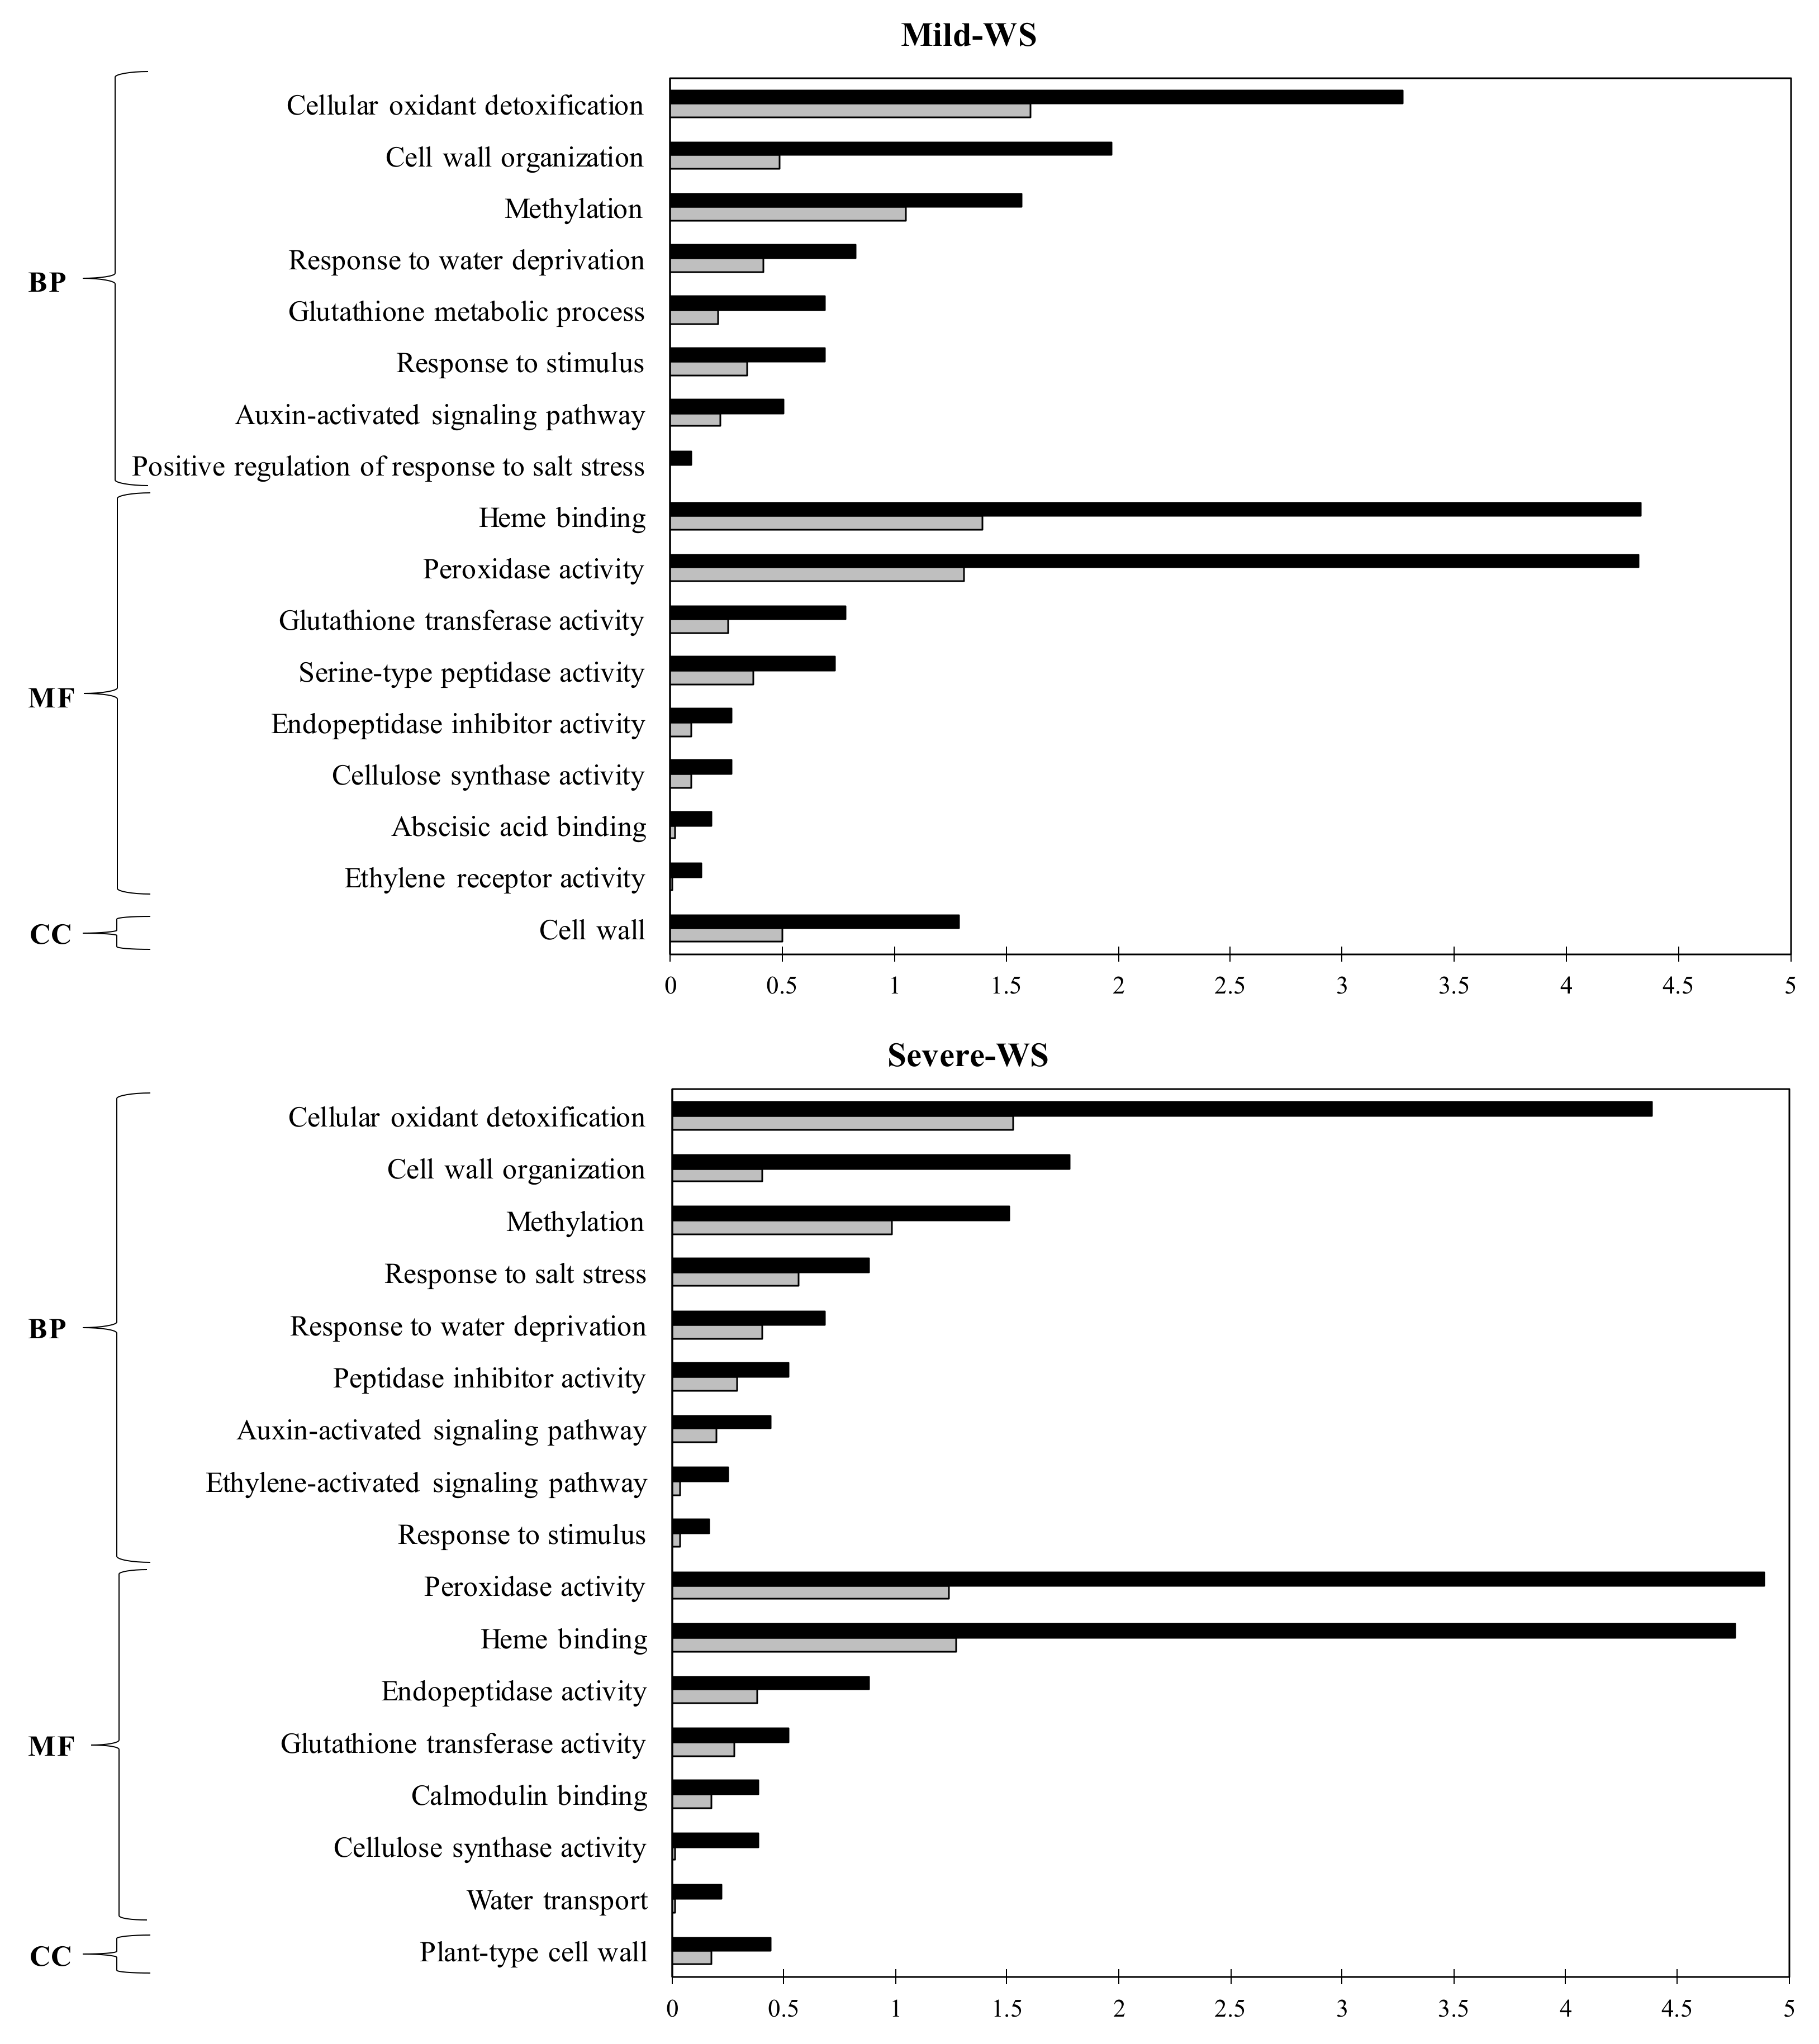
2.4. Functional Annotation and GO Term Enrichment Analysis of the Differentially Expressed Genes (DEGs) of ‘Dusa’ Avocado Roots Subjected to Mild and Severe Water Stress
2.5. Modeling ‘Dusa´ Response to Different Levels of Water Stress: Linking Plant Physiology with the Root-Induced Drought-Tolerant Genes
3. Conclusions
4. Materials and Methods
4.1. Plant Material and Experimental Design
4.2. Physiological Measurements
4.3. RNA Extraction
4.4. Microarray Analysis
4.5. Functional Annotation and Clustering
4.6. Quantitative Real-Time PCR
4.7. Statistical Analysis
Supplementary Materials
Author Contributions
Funding
Data Availability Statement
Acknowledgments
Conflicts of Interest
Authors’ Information
References
- Walter, J.; Nagy, L.; Hein, R.; Rascher, U.; Beierkuhnlein, C.; Willner, E.; Jentsch, A. Do plants remember drought? Hints towards a drought-memory in grasses. Environ. Exp. Bot. 2011, 71, 34–40. [Google Scholar] [CrossRef]
- Allen, C.D.; Breshears, D.D.; McDowell, N.G. On underestimation of global vulnerability to tree mortality and forest die-off from hotter drought in the Anthropocene. Ecosphere 2015, 6, 129. [Google Scholar] [CrossRef]
- Nardini, A.; Gullo, M.A.L.; Trifilò, P.; Salleo, S. The challenge of the Mediterranean climate to plant hydraulics: Responses and adaptations. Environ. Exp. Bot. 2014, 103, 68–79. [Google Scholar] [CrossRef]
- Purseglove, J.W. Persea americana Mill. In Tropical Crops: Dicotyledons; Longmans, Green and Co. Ltd.: London, UK, 1968; pp. 192–198. [Google Scholar]
- Moreno-Ortega, G.; Pliego, C.; Sarmiento, D.; Barceló, A.; Martínez-Ferri, E. Yield and fruit quality of avocado trees under different regimes of water supply in the subtropical coast of Spain. Agric. Water Manag. 2019, 221, 192–201. [Google Scholar] [CrossRef]
- Acosta-Rangel, A.; Ávila-Lovera, E.; De Guzman, M.E.; Torres, L.; Haro, R.; Arpaia, M.L.; Focht, E.; Santiago, L.S. Evaluation of leaf carbon isotopes and functional traits in avocado reveals water-use efficient cultivars. Agric. Ecosyst. Environ. 2018, 263, 60–66. [Google Scholar] [CrossRef] [Green Version]
- Kremer-Köhne, S.; Köhne, J.S. 25 years of avocado rootstock development in South Africa. In Proceedings of the VI World Avocado Congress, Viña del Mar, Chile, 12–16 November 2007. [Google Scholar]
- Haberman, A.; Tsror, L.; Lazare, S.; Hazanovsky, M.; Lebiush, S.; Zipori, I.; Busatn, A.; Simenski, E.; Dag, A. Management of Verticillium Wilt of Avocado Using Tolerant Rootstocks. Plants 2020, 9, 531. [Google Scholar] [CrossRef] [PubMed] [Green Version]
- Acosta-Rangel, A.M.; Li, R.; Celis, N.; Suarez, D.L.; Santiago, L.S.; Arpaia, M.L.; Mauk, P.A. The physiological response of ‘Hass’ avocado to salinity as influenced by rootstock. Sci. Hortic. 2019, 256, 108629. [Google Scholar] [CrossRef]
- Berg, N.V.D.; Mahomed, W.; Olivier, N.A.; Swart, V.; Crampton, B.G. Transcriptome analysis of an incompatible Persea americana-Phytophthora cinnamomi interaction reveals the involvement of SA- and JA-pathways in a successful defense response. PLoS ONE 2018, 13, e0205705. [Google Scholar] [CrossRef]
- Bogeat-Triboulot, M.-B.; Brosche, M.; Renaut, J.; Jouve, L.; LE Thiec, D.; Fayyaz, P.; Vinocur, B.; Witters, E.; Laukens, K.; Teichmann, T.; et al. Gradual Soil Water Depletion Results in Reversible Changes of Gene Expression, Protein Profiles, Ecophysiology, and Growth Performance in Populus euphratica, a Poplar Growing in Arid Regions. Plant Physiol. 2007, 143, 876–892. [Google Scholar] [CrossRef] [PubMed] [Green Version]
- Rodrigues, F.A.; de Laia, M.L.; Zingaretti, S.M. Analysis of gene expression profiles under water stress in tolerant and sensitive sugarcane plants. Plant Sci. 2009, 176, 286–302. [Google Scholar] [CrossRef]
- Meyer, E.; Aspinwall, M.J.; Lowry, D.B.; Palacio-Mejía, J.D.; Logan, T.L.; Fay, P.A.; Juenger, T.E. Integrating transcriptional, metabolomic, and physiological responses to drought stress and recovery in switchgrass (Panicum virgatum L.). BMC Genom. 2014, 15, 527. [Google Scholar] [CrossRef] [PubMed] [Green Version]
- Fox, H.; Doron-Faigenboim, A.; Kelly, G.; Bourstein, R.; Attia, Z.; Zhou, J.; Moshe, Y.; Moshelion, M.; David-Schwartz, R. Transcriptome analysis of Pinus halepensis under drought stress and during recovery. Tree Physiol. 2018, 38, 423–441. [Google Scholar] [CrossRef] [Green Version]
- Bielsa, B.; Hewitt, S.; Reyes-Chin-Wo, S.; Dhingra, A.; Rubio-Cabetas, M.J. Identification of water use efficiency related genes in ‘Garnem’ almond-peach rootstock using time-course transcriptome analysis. PLoS ONE 2018, 13, e0205493. [Google Scholar] [CrossRef] [PubMed]
- Zhang, X.; Lei, L.; Lai, J.; Zhao, H.; Song, W. Effects of drought stress and water recovery on physiological responses and gene expression in maize seedlings. BMC Plant Biol. 2018, 18, 1–16. [Google Scholar] [CrossRef]
- Singh, D.; Laxmi, A. Transcriptional regulation of drought response: A tortuous network of transcriptional factors. Front. Plant Sci. 2015, 6, 895. [Google Scholar] [CrossRef] [Green Version]
- Wang, H.; Wang, H.; Shao, H.; Tang, X. Recent Advances in Utilizing Transcription Factors to Improve Plant Abiotic Stress Tolerance by Transgenic Technology. Front. Plant Sci. 2016, 7, 67. [Google Scholar] [CrossRef] [PubMed] [Green Version]
- Zenda, T.; Liu, S.; Wang, X.; Liu, G.; Jin, H.; Dong, A.; Yang, Y.; Duan, H. Key Maize Drought-Responsive Genes and Pathways Revealed by Comparative Transcriptome and Physiological Analyses of Contrasting Inbred Lines. Int. J. Mol. Sci. 2019, 20, 1268. [Google Scholar] [CrossRef] [PubMed] [Green Version]
- Reeksting, B.J.; Olivier, N.A.; Berg, N.V.D. Transcriptome responses of an ungrafted Phytophthora root rot tolerant avocado (Persea americana) rootstock to flooding and Phytophthora cinnamomi. BMC Plant Biol. 2016, 16, 1–19. [Google Scholar] [CrossRef] [Green Version]
- Zumaquero, A.; Martínez-Ferri, E.; Matas, A.J.; Reeksting, B.; Olivier, N.A.; Pliego-Alfaro, F.; Barceló, A.; Berg, N.V.D.; Pliego, C. Rosellinia necatrix infection induces differential gene expression between tolerant and susceptible avocado rootstocks. PLoS ONE 2019, 14, e0212359. [Google Scholar] [CrossRef]
- Martínez-Ferri, E.; Moreno-Ortega, G.; Berg, N.V.D.; Pliego, C. Mild water stress-induced priming enhance tolerance to Rosellinia necatrix in susceptible avocado rootstocks. BMC Plant Biol. 2019, 19, 1–15. [Google Scholar] [CrossRef] [Green Version]
- Hsiao, T.C. Plant Responses to Water Stress. Annu. Rev. Plant Physiol. 1973, 24, 519–570. [Google Scholar] [CrossRef]
- Scholefield, P.B.; Walcott, J.J.; Kriedemann, P.E.; Ramadasan, A. Some environmental effects on photosynthesis and water relations of avocado leaves. Calif. Avocado Soc. Yearb. 1980, 64, 93–106. [Google Scholar]
- Azcón-Bieto, J.; Talón, M. Fundamentos de Fisiología Vegetal, Segunda ed.; Mc Graw-Hill-Interamericana: Madrid, Spain, 2000. [Google Scholar]
- Reyes-Santamaría, I.; Terrazas, T.; Barrientos-Priego, A.F.; Trejo, C. Xylem conductivity and vulnerability in cultivars and races of avocado. Sci. Hortic. 2002, 92, 97–105. [Google Scholar] [CrossRef]
- Ruehr, N.K.; Grote, R.; Mayr, S.; Arneth, A. Beyond the extreme: Recovery of carbon and water relations in woody plants following heat and drought stress. Tree Physiol. 2019, 39, 1285–1299. [Google Scholar] [CrossRef] [PubMed]
- Mansfield, T.A.; Atkinson, C.J. Stomatal behaviour in water-stressed plants. In Stress Responses in Plants: Adaptation and Acclimation Mechanisms; Wiley-Liss. Inc.: New York, NY, USA, 1990; pp. 241–264. [Google Scholar]
- Chaves, M.M.; Zarrouk, O.; Francisco, R.; Costa, J.; Santos, T.; Regalado, A.; Rodrigues, M.L.; Lopes, C. Grapevine under deficit irrigation: Hints from physiological and molecular data. Ann. Bot. 2010, 105, 661–676. [Google Scholar] [CrossRef] [Green Version]
- Flexas, J.; Badger, M.; Chow, W.S.; Medrano, H.; Osmond, C.B. Analysis of the Relative Increase in Photosynthetic O2 Uptake When Photosynthesis in Grapevine Leaves Is Inhibited following Low Night Temperatures and/or Water Stress. Plant Physiol. 1999, 121, 675–684. [Google Scholar] [CrossRef] [Green Version]
- Cifre, J.; Bota, J.; Escalona, J.; Medrano, H.; Flexas, J. Physiological tools for irrigation scheduling in grapevine (Vitis vinifera L.): An open gate to improve water-use efficiency? Agric. Ecosyst. Environ. 2005, 106, 159–170. [Google Scholar] [CrossRef]
- Arend, M.; Sever, K.; Pflug, E.; Gessler, A.; Schaub, M. Seasonal photosynthetic response of European beech to severe summer drought: Limitation, recovery and post-drought stimulation. Agric. For. Meteorol. 2016, 220, 83–89. [Google Scholar] [CrossRef]
- Birami, B.; Gattmann, M.; Heyer, A.G.; Grote, R.; Arneth, A.; Ruehr, N.K. Heat Waves Alter Carbon Allocation and Increase Mortality of Aleppo Pine Under Dry Conditions. Front. For. Glob. Chang. 2018, 1, 8. [Google Scholar] [CrossRef]
- Fereres, E.; Soriano, M.A. Deficit irrigation for reducing agricultural water use. J. Exp. Bot. 2007, 58, 147–159. [Google Scholar] [CrossRef] [Green Version]
- Vilagrosa, A.; Chirino, E.; Peguero-Pina, J.; Barigah, T.; Cochard, H.; Gil-Pelegrín, E. Xylem Cavitation and Embolism in Plants Living in Water-Limited Ecosystems. In Plant Responses to Drought Stress; Aroca, R., Ed.; Springer: Berlin/Heidelberg, Germany, 2012. [Google Scholar] [CrossRef]
- Jackson, R.B.; Sperry, J.S.; Dawson, T.E. Root water uptake and transport: Using physiological processes in global predictions. Trends Plant Sci. 2000, 5, 482–488. [Google Scholar] [CrossRef]
- Bartlett, M.K.; Klein, T.; Jansen, S.; Choat, B.; Sack, L. The correlations and sequence of plant stomatal, hydraulic, and wilting responses to drought. Proc. Natl. Acad. Sci. USA 2016, 113, 13098–13103. [Google Scholar] [CrossRef] [PubMed] [Green Version]
- Poorter, H.; Niklas, K.J.; Reich, P.; Oleksyn, J.; Poot, P.; Mommer, L. Biomass allocation to leaves, stems and roots: Meta-analyses of interspecific variation and environmental control. New Phytol. 2012, 193, 30–50. [Google Scholar] [CrossRef] [PubMed]
- Bhardwaj, A.R.; Joshi, G.; Kukreja, B.; Malik, V.; Arora, P.; Pandey, R.; Shukla, R.N.; Bankar, K.G.; Katiyar-Agarwal, S.; Goel, S.; et al. Global insights into high temperature and drought stress regulated genes by RNA-Seq in economically important oilseed crop Brassica juncea. BMC Plant Biol. 2015, 15, 1–15. [Google Scholar] [CrossRef] [Green Version]
- Garg, R.; Shankar, R.; Thakkar, B.; Kudapa, H.; Krishnamurthy, L.; Mantri, N.; Varshney, R.; Bhatia, S.; Jain, M. Transcriptome analyses reveal genotype- and developmental stage-specific molecular responses to drought and salinity stresses in chickpea. Sci. Rep. 2016, 6, 1–15. [Google Scholar] [CrossRef] [Green Version]
- Ksouri, N.; Jiménez, S.; Wells, C.E.; Contreras-Moreira, B.; Gogorcena, Y. Transcriptional Responses in Root and Leaf of Prunus persica under Drought Stress Using RNA Sequencing. Front. Plant Sci. 2016, 7, 1715. [Google Scholar] [CrossRef]
- Muthusamy, M.; Uma, S.; Backiyarani, S.; Saraswathi, M.S.; Chandrasekar, A. Transcriptomic Changes of Drought-Tolerant and Sensitive Banana Cultivars Exposed to Drought Stress. Front. Plant Sci. 2016, 7, 1609. [Google Scholar] [CrossRef] [Green Version]
- Lau, K.H.; Herrera, M.D.R.; Crisovan, E.; Wu, S.; Fei, Z.; Khan, M.A.; Buell, C.R.; Gemenet, D. Transcriptomic analysis of sweet potato under dehydration stress identifies candidate genes for drought tolerance. Plant Direct 2018, 2, e00092. [Google Scholar] [CrossRef] [Green Version]
- Ye, G.; Ma, Y.; Feng, Z.; Zhang, X. Transcriptomic analysis of drought stress responses of sea buckthorn (Hippophae rhamnoidessubsp. sinensis) by RNA-Seq. PLoS ONE 2018, 13, e0202213. [Google Scholar] [CrossRef] [Green Version]
- Smirnoff, N. The role of active oxygen in the response of plants to water deficit and desiccation. New Phytol. 1993, 125, 27–58. [Google Scholar] [CrossRef]
- Bartoli, C.G.; Simontacchi, M.; Tambussi, E.; Beltrano, J.; Montaldi, E.; Puntarulo, S. Drought and watering-dependent oxidative stress: Effect on antioxidant content in Triticum aestivum L. leaves. J. Exp. Bot. 1999, 50, 375–383. [Google Scholar] [CrossRef] [Green Version]
- Loggini, B.; Scartazza, A.; Brugnoli, E.; Navari-Izzo, F. Antioxidative Defense System, Pigment Composition, and Photosynthetic Efficiency in Two Wheat Cultivars Subjected to Drought1. Plant Physiol. 1999, 119, 1091–1100. [Google Scholar] [CrossRef] [Green Version]
- Ranty, B.; Aldon, D.; Galaud, J.-P. Plant calmodulins and calmodulin-related proteins: Multifaceted relays to decode calcium signals. Plant Signal. Behav. 2006, 1, 96–104. [Google Scholar] [CrossRef] [PubMed] [Green Version]
- Srinivasan, T.; Kumar, K.R.R.; Kirti, P.B. Constitutive Expression of a Trypsin Protease Inhibitor Confers Multiple Stress Tolerance in Transgenic Tobacco. Plant Cell Physiol. 2009, 50, 541–553. [Google Scholar] [CrossRef] [PubMed] [Green Version]
- Atkinson, N.J.; Lilley, C.J.; Urwin, P.E. Identification of Genes Involved in the Response of Arabidopsis to Simultaneous Biotic and Abiotic Stresses. Plant Physiol. 2013, 162, 2028–2041. [Google Scholar] [CrossRef] [Green Version]
- Cristina, M.; Petersen, M.; Mundy, J. Mitogen-Activated Protein Kinase Signaling in Plants. Annu. Rev. Plant Biol. 2010, 61, 621–649. [Google Scholar] [CrossRef]
- Zhang, L.; Zhao, H.-K.; Dong, Q.-L.; Zhang, Y.-Y.; Wang, Y.-M.; Li, H.-Y.; Xing, G.-J.; Li, Q.-Y.; Dong, Y.-S. Genome-wide analysis and expression profiling under heat and drought treatments of HSP70 gene family in soybean (Glycine max L.). Front. Plant Sci. 2015, 6, 773. [Google Scholar] [CrossRef] [Green Version]
- Gupta, S.C.; Sharma, A.; Mishra, M.; Mishra, R.K.; Chowdhuri, D.K. Heat shock proteins in toxicology: How close and how far? Life Sci. 2010, 86, 377–384. [Google Scholar] [CrossRef]
- De Ollas, C.; Dodd, I.C. Physiological impacts of ABA–JA interactions under water-limitation. Plant Mol. Biol. 2016, 91, 641–650. [Google Scholar] [CrossRef]
- Zhang, Z.; Cao, B.; Li, N.; Chen, Z.; Xu, K. Comparative transcriptome analysis of the regulation of ABA signaling genes in different rootstock grafted tomato seedlings under drought stress. Environ. Exp. Bot. 2019, 166, 103814. [Google Scholar] [CrossRef]
- Takahashi, F.; Kuromori, T.; Urano, K.; Yamaguchi-Shinozaki, K.; Shinozaki, K. Drought Stress Responses and Resistance in Plants: From Cellular Responses to Long-Distance Intercellular Communication. Front. Plant Sci. 2020, 11, 1407. [Google Scholar] [CrossRef]
- Javot, H.; Lauvergeat, V.; Santoni, V.; Martin-Laurent, F.; Güçlü, J.; Vinh, J.; Heyes, J.; Franck, K.I.; Schäffner, A.R.; Bouchez, D.; et al. Role of a Single Aquaporin Isoform in Root Water Uptake. Plant Cell 2003, 15, 509–522. [Google Scholar] [CrossRef] [PubMed] [Green Version]
- Sutka, M.; Li, G.; Boudet, J.; Boursiac, Y.; Doumas, P.; Maurel, C. Natural Variation of Root Hydraulics in Arabidopsis Grown in Normal and Salt-Stressed Conditions. Plant Physiol. 2011, 155, 1264–1276. [Google Scholar] [CrossRef] [Green Version]
- Islam, A.; Leung, S.; Nikmatullah, A.; Dijkwel, P.P.; McManus, M.T. Kunitz Proteinase Inhibitors Limit Water Stress Responses in White Clover (Trifolium repens L.) Plants. Front. Plant Sci. 2017, 8, 1683. [Google Scholar] [CrossRef] [PubMed] [Green Version]
- Clemente, M.; Corigliano, M.G.; Pariani, S.A.; Sánchez-López, E.F.; Sander, V.A.; Ramos-Duarte, V.A. Plant Serine Protease Inhibitors: Biotechnology Application in Agriculture and Molecular Farming. Int. J. Mol. Sci. 2019, 20, 1345. [Google Scholar] [CrossRef] [PubMed] [Green Version]
- Malefo, M.; Mathibela, E.; Crampton, B.; Makgopa, M. Investigating the role of Bowman-Birk serine protease inhibitor in Arabidopsis plants under drought stress. Plant Physiol. Biochem. 2020, 149, 286–293. [Google Scholar] [CrossRef] [PubMed]
- Iuchi, S.; Kobayashi, M.; Taji, T.; Naramoto, M.; Seki, M.; Kato, T.; Tabata, S.; Kakubari, Y.; Yamaguchi-Shinozaki, K.; Shinozaki, K. Regulation of drought tolerance by gene manipulation of 9-cis-epoxycarotenoid dioxygenase, a key enzyme in abscisic acid biosynthesis in Arabidopsis. Plant J. 2001, 27, 325–333. [Google Scholar] [CrossRef] [PubMed] [Green Version]
- He, R.; Zhuang, Y.; Cai, Y.; Agüero, C.B.; Liu, S.; Wu, J.; Deng, S.; Walker, M.A.; Lu, J.; Zhang, Y. Overexpression of 9-cis-Epoxycarotenoid Dioxygenase Cisgene in Grapevine Increases Drought Tolerance and Results in Pleiotropic Effects. Front. Plant Sci. 2018, 9, 970. [Google Scholar] [CrossRef] [PubMed]
- Molinari, M.D.C.; Fuganti-Pagliarini, R.; Marin, S.R.R.; Ferreira, L.C.; Barbosa, D.D.A.; Marcolino-Gomes, J.; De Oliveira, M.C.N.; Mertz-Henning, L.M.; Kanamori, N.; Takasaki, H.; et al. Overexpression of AtNCED3 gene improved drought tolerance in soybean in greenhouse and field conditions. Genet. Mol. Biol. 2020, 43, e20190292. [Google Scholar] [CrossRef]
- Zhai, H.; Wang, F.; Si, Z.; Huo, J.; Xing, L.; An, Y.; He, S.; Liu, Q. Amyo-inositol-1-phosphate synthase gene, IbMIPS1, enhances salt and drought tolerance and stem nematode resistance in transgenic sweet potato. Plant Biotechnol. J. 2016, 14, 592–602. [Google Scholar] [CrossRef]
- Liu, H.; Wang, X.; Zhang, H.; Yang, Y.; Ge, X.; Song, F. A rice serine carboxypeptidase-like gene OsBISCPL1 is involved in regulation of defense responses against biotic and oxidative stress. Gene 2008, 420, 57–65. [Google Scholar] [CrossRef] [PubMed]
- Pieczynski, M.; Wyrzykowska, A.; Milanowska, K.; Boguszewska-Mankowska, D.; Zagdanska, B.; Karlowski, W.; Jarmolowski, A.; Szweykowska-Kulinska, Z. Genomewide identification of genes involved in the potato response to drought indicates functional evolutionary conservation with Arabidopsis plants. Plant Biotechnol. J. 2018, 16, 603–614. [Google Scholar] [CrossRef] [PubMed] [Green Version]
- Rosado, A.; Schapire, A.L.; Bressan, R.A.; Harfouche, A.; Hasegawa, P.M.; Valpuesta, V.; Botella, M.A. The Arabidopsis Tetratricopeptide Repeat-Containing Protein TTL1 Is Required for Osmotic Stress Responses and Abscisic Acid Sensitivity. Plant Physiol. 2006, 142, 1113–1126. [Google Scholar] [CrossRef] [Green Version]
- Kang, J.; Hwang, J.-U.; Lee, M.; Kim, Y.-Y.; Assmann, S.M.; Martinoia, E.; Lee, Y. PDR-type ABC transporter mediates cellular uptake of the phytohormone abscisic acid. Proc. Natl. Acad. Sci. USA 2010, 107, 2355–2360. [Google Scholar] [CrossRef] [PubMed] [Green Version]
- Kuromori, T.; Miyaji, T.; Yabuuchi, H.; Shimizu, H.; Sugimoto, E.; Kamiya, A.; Moriyama, Y.; Shinozaki, K. ABC transporter AtABCG25 is involved in abscisic acid transport and responses. Proc. Natl. Acad. Sci. USA 2010, 107, 2361–2366. [Google Scholar] [CrossRef] [Green Version]
- Ali, S.; Ganai, B.A.; Kamili, A.N.; Bhat, A.A.; Mir, Z.; Bhat, J.A.; Tyagi, A.; Islam, S.T.; Mushtaq, M.; Yadav, P.; et al. Pathogenesis-related proteins and peptides as promising tools for engineering plants with multiple stress tolerance. Microbiol. Res. 2018, 212–213, 29–37. [Google Scholar] [CrossRef] [PubMed]
- Wang, H.; Wang, Z.; Zhang, M.; Jia, B.; Heng, W.; Ye, Z.; Zhu, L.; Xu, X. Transcriptome sequencing analysis of two different genotypes of Asian pear reveals potential drought stress genes. Tree Genet. Genomes 2018, 14, 40. [Google Scholar] [CrossRef]
- Gahlaut, V.; Jaiswal, V.; Kumar, A.; Gupta, P.K. Transcription factors involved in drought tolerance and their possible role in developing drought tolerant cultivars with emphasis on wheat (Triticum aestivum L.). Theor. Appl. Genet. 2016, 129, 2019–2042. [Google Scholar] [CrossRef] [PubMed]
- Lindemose, S.; O’Shea, C.; Jensen, M.K.; Skriver, K. Structure, Function and Networks of Transcription Factors Involved in Abiotic Stress Responses. Int. J. Mol. Sci. 2013, 14, 5842–5878. [Google Scholar] [CrossRef] [Green Version]
- Olsen, A.N.; Ernst, H.A.; Leggio, L.L.; Skriver, K. NAC transcription factors: Structurally distinct, functionally diverse. Trends Plant Sci. 2005, 10, 79–87. [Google Scholar] [CrossRef]
- Seo, P.J.; Xiang, F.; Qiao, M.; Park, J.-Y.; Na Lee, Y.; Kim, S.-G.; Lee, Y.-H.; Park, W.J.; Park, C.-M. The MYB96 Transcription Factor Mediates Abscisic Acid Signaling during Drought Stress Response in Arabidopsis. Plant Physiol. 2009, 151, 275–289. [Google Scholar] [CrossRef] [Green Version]
- Yang, X.; Kim, M.Y.; Ha, J.; Lee, S.-H. Overexpression of the Soybean NAC Gene GmNAC109 Increases Lateral Root Formation and Abiotic Stress Tolerance in Transgenic Arabidopsis Plants. Front. Plant Sci. 2019, 10, 1036. [Google Scholar] [CrossRef] [PubMed] [Green Version]
- Gaoming, S.-Q.; Chen, M.; Xu, Z.-S.; Zhao, C.-P.; Li, L.; Xu, H.-J.; Tang, Y.-M.; Zhao, X.; Ma, Y.-Z. The soybean GmbZIP1 transcription factor enhances multiple abiotic stress tolerances in transgenic plants. Plant Mol. Biol. 2011, 75, 537–553. [Google Scholar] [CrossRef]
- Yin, M.; Wang, Y.; Zhang, L.; Li, J.; Quan, W.; Yang, L.; Wang, Q.; Chan, Z. The Arabidopsis Cys2/His2 zinc finger transcription factor ZAT18 is a positive regulator of plant tolerance to drought stress. J. Exp. Bot. 2017, 68, 2991–3005. [Google Scholar] [CrossRef] [PubMed]
- Han, G.; Lu, C.; Guo, J.; Qiao, Z.; Sui, N.; Qiu, N.; Wang, B. C2H2 Zinc Finger Proteins: Master Regulators of Abiotic Stress Responses in Plants. Front. Plant Sci. 2020, 11, 115. [Google Scholar] [CrossRef] [Green Version]
- Guo, M.; Liu, J.-H.; Ma, X.; Luo, D.-X.; Gong, Z.-H.; Lu, M.-H. The Plant Heat Stress Transcription Factors (HSFs): Structure, Regulation, and Function in Response to Abiotic Stresses. Front. Plant Sci. 2016, 7, 114. [Google Scholar] [CrossRef] [Green Version]
- Perotti, M.F.; Ribone, P.A.; Chan, R.L. Plant transcription factors from the homeodomain-leucine zipper family I. Role in development and stress responses. IUBMB Life 2017, 69, 280–289. [Google Scholar] [CrossRef]
- Wu, Y.; Deng, Z.; Lai, J.; Zhang, Y.; Yang, C.; Yin, B.; Zhao, Q.; Zhang, L.; Li, Y.; Yang, C.; et al. Dual function of Arabidopsis ATAF1 in abiotic and biotic stress responses. Cell Res. 2009, 19, 1279–1290. [Google Scholar] [CrossRef]
- Xu, Z.-Y.; Kim, S.Y.; Hyeon, D.Y.; Kim, D.H.; Dong, T.; Park, Y.; Jin, J.B.; Joo, S.-H.; Hong, J.C.; Hwang, D.; et al. The Arabidopsis NAC Transcription Factor ANAC096 Cooperates with bZIP-Type Transcription Factors in Dehydration and Osmotic Stress Responses. Plant Cell 2013, 25, 4708–4724. [Google Scholar] [CrossRef] [Green Version]
- Nakashima, K.; Yamaguchi-Shinozaki, K.; Shinozaki, K. The transcriptional regulatory network in the drought response and its crosstalk in abiotic stress responses including drought, cold, and heat. Front. Plant Sci. 2014, 5, 170. [Google Scholar] [CrossRef] [Green Version]
- Sakuraba, Y.; Kim, Y.-S.; Han, S.-H.; Lee, B.-D.; Paek, N.-C. The Arabidopsis Transcription Factor NAC016 Promotes Drought Stress Responses by Repressing AREB1 Transcription through a Trifurcate Feed-Forward Regulatory Loop Involving NAP. Plant Cell 2015, 27, 1771–1787. [Google Scholar] [CrossRef] [PubMed] [Green Version]
- Ehong, Y.; Ezhang, H.; Ehuang, L.; Eli, D.; Esong, F. Overexpression of a Stress-Responsive NAC Transcription Factor Gene ONAC022 Improves Drought and Salt Tolerance in Rice. Front. Plant Sci. 2016, 7, 4. [Google Scholar] [CrossRef]
- Rushton, P.J.; Somssich, I.; Ringler, P.; Shen, Q.J. WRKY transcription factors. Trends Plant Sci. 2010, 15, 247–258. [Google Scholar] [CrossRef] [PubMed]
- Yu, Y.-T.; Wu, Z.; Lu, K.; Bi, C.; Liang, S.; Wang, X.-F.; Zhang, D.-P. Overexpression of the MYB37 transcription factor enhances abscisic acid sensitivity, and improves both drought tolerance and seed productivity in Arabidopsis thaliana. Plant Mol. Biol. 2016, 90, 267–279. [Google Scholar] [CrossRef] [PubMed] [Green Version]
- Cheng, X.; Xiong, R.; Yan, H.; Gao, Y.; Liu, H.; Wu, M.; Xiang, Y. The trihelix family of transcription factors: Functional and evolutionary analysis in Moso bamboo (Phyllostachys edulis). BMC Plant Biol. 2019, 19, 1–20. [Google Scholar] [CrossRef] [Green Version]
- Li, J.; Zhang, M.; Sun, J.; Mao, X.; Wang, J.; Wang, J.; Liu, H.; Zheng, H.; Zhen, Z.; Zhao, H.; et al. Genome-Wide Characterization and Identification of Trihelix Transcription Factor and Expression Profiling in Response to Abiotic Stresses in Rice (Oryza sativa L.). Int. J. Mol. Sci. 2019, 20, 251. [Google Scholar] [CrossRef] [Green Version]
- Magwanga, R.O.; Kirungu, J.N.; Lu, P.; Yang, X.; Dong, Q.; Cai, X.; Xu, Y.; Wang, X.; Zhou, Z.; Hou, Y.; et al. Genome wide identification of the trihelix transcription factors and overexpression of Gh_A05G2067 (GT-2), a novel gene contributing to increased drought and salt stresses tolerance in cotton. Physiol. Plant. 2019, 167, 447–464. [Google Scholar] [CrossRef] [Green Version]
- Qin, X.; Zeevaart, J.A. Overexpression of a 9-cis-Epoxycarotenoid Dioxygenase Gene in Nicotiana plumbaginifolia Increases Abscisic Acid and Phaseic Acid Levels and Enhances Drought Tolerance. Plant Physiol. 2002, 128, 544–551. [Google Scholar] [CrossRef]
- Huang, Y.; Guo, Y.; Liu, Y.; Zhang, F.; Wang, Z.; Wang, H.; Wang, F.; Li, D.; Mao, D.; Luan, S.; et al. 9-cis-Epoxycarotenoid Dioxygenase 3 Regulates Plant Growth and Enhances Multi-Abiotic Stress Tolerance in Rice. Front. Plant Sci. 2018, 9, 162. [Google Scholar] [CrossRef]
- Huang, Y.; Jiao, Y.; Xie, N.; Guo, Y.; Zhang, F.; Xiang, Z.; Wang, R.; Wang, F.; Gao, Q.; Tian, L.; et al. OsNCED5, a 9-cis-epoxycarotenoid dioxygenase gene, regulates salt and water stress tolerance and leaf senescence in rice. Plant Sci. 2019, 287, 110188. [Google Scholar] [CrossRef]
- Skubacz, A.; Daszkowska-Golec, A.; Szarejko, I. The Role and Regulation of ABI5 (ABA-Insensitive 5) in Plant Development, Abiotic Stress Responses and Phytohormone Crosstalk. Front. Plant Sci. 2016, 7, 1884. [Google Scholar] [CrossRef] [PubMed] [Green Version]
- Collin, A.; Daszkowska-Golec, A.; Kurowska, M.; Szarejko, I. Barley ABI5 (Abscisic Acid INSENSITIVE 5) Is Involved in Abscisic Acid-Dependent Drought Response. Front. Plant Sci. 2020, 11, 1138. [Google Scholar] [CrossRef]
- He, Z.; Wu, J.; Sun, X.; Dai, M. The Maize Clade A PP2C Phosphatases Play Critical Roles in Multiple Abiotic Stress Responses. Int. J. Mol. Sci. 2019, 20, 3573. [Google Scholar] [CrossRef] [PubMed] [Green Version]
- Jung, C.; Nguyen, N.H.; Cheong, J.-J. Transcriptional Regulation of Protein Phosphatase 2C Genes to Modulate Abscisic Acid Signaling. Int. J. Mol. Sci. 2020, 21, 9517. [Google Scholar] [CrossRef] [PubMed]
- Das-Chatterjee, A.; Goswami, L.; Maitra, S.; Dastidar, K.G.; Ray, S.; Majumder, A.L. Introgression of a novel salt-tolerant L-myo-inositol 1-phosphate synthase from Porteresia coarctata (Roxb.) Tateoka (PcINO1) confers salt tolerance to evolutionary diverse organisms. FEBS Lett. 2006, 580, 3980–3988. [Google Scholar] [CrossRef] [Green Version]
- Kaur, H.; Verma, P.; Petla, B.P.; Rao, V.; Saxena, S.C.; Majee, M. Ectopic expression of the ABA-inducible dehydration-responsive chickpea l-myo-inositol 1-phosphate synthase 2 (CaMIPS2) in Arabidopsis enhances tolerance to salinity and dehydration stress. Planta 2013, 237, 321–335. [Google Scholar] [CrossRef] [PubMed]
- Tan, J.; Wang, C.; Xiang, B.; Han, R.; Guo, Z. Hydrogen peroxide and nitric oxide mediated cold- and dehydration-inducedmyo-inositol phosphate synthase that confers multiple resistances to abiotic stresses. Plant Cell Environ. 2013, 36, 288–299. [Google Scholar] [CrossRef]
- Goswami, L.; Sengupta, S.; Mukherjee, S.; Ray, S.; Mukherjee, R.; Majumder, A.L. Targeted expression of L-myo- inositol 1-phosphate synthase from Porteresia coarctata (Roxb.) Tateoka confers multiple stress tolerance in transgenic crop plants. J. Plant Biochem. Biotechnol. 2014, 23, 316–330. [Google Scholar] [CrossRef]
- Padmalatha, K.V.; Dhandapani, G.; Kanakachari, M.; Kumar, S.; Dass, A.; Patil, D.P.; Rajamani, V.; Kumar, K.; Pathak, R.; Rawat, B.; et al. Genome-wide transcriptomic analysis of cotton under drought stress reveal significant down-regulation of genes and pathways involved in fibre elongation and up-regulation of defense responsive genes. Plant Mol. Biol. 2012, 78, 223–246. [Google Scholar] [CrossRef]
- Ji, W.; Zhu, Y.; Li, Y.; Yang, L.; Zhao, X.; Cai, H.; Bai, X. Over-expression of a glutathione S-transferase gene, GsGST, from wild soybean (Glycine soja) enhances drought and salt tolerance in transgenic tobacco. Biotechnol. Lett. 2010, 32, 1173–1179. [Google Scholar] [CrossRef]
- Chen, J.-H.; Jiang, H.-W.; Hsieh, E.-J.; Chen, H.-Y.; Chien, C.-T.; Hsieh, H.-L.; Lin, T.-P. Drought and Salt Stress Tolerance of an Arabidopsis Glutathione S-Transferase U17 Knockout Mutant Are Attributed to the Combined Effect of Glutathione and Abscisic Acid. Plant Physiol. 2012, 158, 340–351. [Google Scholar] [CrossRef] [Green Version]
- Nianiou-Obeidat, I.; Madesis, P.; Kissoudis, C.; Voulgari, G.; Chronopoulou, E.; Tsaftaris, A.; Labrou, N.E. Plant glutathione transferase-mediated stress tolerance: Functions and biotechnological applications. Plant Cell Rep. 2017, 36, 791–805. [Google Scholar] [CrossRef] [PubMed]
- Senthil-Kumar, M.; Hema, R.; Suryachandra, T.R.; Ramegowda, H.; Gopalakrishna, R.; Rama, N.; Udayakumar, M.; Mysore, K.S. Functional characterization of three water deficit stress-induced genes in tobacco and Arabidopsis: An approach based on gene down regulation. Plant Physiol. Biochem. 2010, 48, 35–44. [Google Scholar] [CrossRef] [PubMed]
- Hatmi, S.; Gruau, C.; Trotel-Aziz, P.; Villaume, S.; Rabenoelina, F.; Baillieul, F.; Eullaffroy, P.; Clément, C.; Ferchichi, A.; Aziz, A. Drought stress tolerance in grapevine involves activation of polyamine oxidation contributing to improved immune response and low susceptibility to Botrytis cinerea. J. Exp. Bot. 2015, 66, 775–787. [Google Scholar] [CrossRef] [PubMed] [Green Version]
- Fraudentali, I.; Rodrigues-Pousada, R.; Angelini, R.; Ghuge, S.; Cona, A. Plant Copper Amine Oxidases: Key Players in Hormone Signaling Leading to Stress-Induced Phenotypic Plasticity. Int. J. Mol. Sci. 2021, 22, 5136. [Google Scholar] [CrossRef]
- Pospíšilová, H.; Jiskrova, E.; Vojta, P.; Mrízová, K.; Kokáš, F.; Čudejková, M.M.; Bergougnoux, V.; Plíhal, O.; Klimešová, J.; Novak, O.; et al. Transgenic barley overexpressing a cytokinin dehydrogenase gene shows greater tolerance to drought stress. New Biotechnol. 2016, 33, 692–705. [Google Scholar] [CrossRef] [PubMed]
- Chen, L.; Zhao, J.; Song, J.C.; Jameson, P.E. Cytokinin dehydrogenase: A genetic target for yield improvement in wheat. Plant Biotechnol. J. 2020, 18, 614–630. [Google Scholar] [CrossRef] [PubMed]
- Hai, N.N.; Chuong, N.N.; Tu, N.H.C.; Kisiala, A.; Hoang, X.L.T.; Thao, N.P. Role and Regulation of Cytokinins in Plant Response to Drought Stress. Plants 2020, 9, 422. [Google Scholar] [CrossRef] [PubMed] [Green Version]
- Lim, C.W.; Han, S.-W.; Hwang, I.S.; Kim, D.S.; Hwang, B.K.; Lee, S.C. The Pepper Lipoxygenase CaLOX1 Plays a Role in Osmotic, Drought and High Salinity Stress Response. Plant Cell Physiol. 2015, 56, 930–942. [Google Scholar] [CrossRef] [Green Version]
- Xing, Q.; Zhang, X.; Li, Y.; Shao, Q.; Cao, S.; Wang, F.; Qi, H. The lipoxygenase CmLOX13 from oriental melon enhanced severe drought tolerance via regulating ABA accumulation and stomatal closure in Arabidopsis. Environ. Exp. Bot. 2019, 167, 103815. [Google Scholar] [CrossRef]
- Xing, Q.; Liao, J.; Cao, S.; Li, M.; Lv, T.; Qi, H. CmLOX10 positively regulates drought tolerance through jasmonic acid -mediated stomatal closure in oriental melon (Cucumis melo var. makuwa Makino). Sci. Rep. 2020, 10, 1–14. [Google Scholar] [CrossRef]
- Zeng, L.; Deng, R.; Guo, Z.; Yang, S.; Deng, X. Genome-wide identification and characterization of Glyceraldehyde-3-phosphate dehydrogenase genes family in wheat (Triticum aestivum). BMC Genom. 2016, 17, 1–10. [Google Scholar] [CrossRef] [PubMed] [Green Version]
- Li, X.; Wei, W.; Li, F.; Zhang, L.; Deng, X.; Liu, Y.; Yang, S. The Plastidial Glyceraldehyde-3-Phosphate Dehydrogenase Is Critical for Abiotic Stress Response in Wheat. Int. J. Mol. Sci. 2019, 20, 1104. [Google Scholar] [CrossRef] [PubMed] [Green Version]
- Hu, Y.; Li, W.C.; Xu, Y.Q.; Li, G.J.; Liao, Y.; Fu, F.-L. Differential expression of candidate genes for lignin biosynthesis under drought stress in maize leaves. J. Appl. Genet. 2009, 50, 213–223. [Google Scholar] [CrossRef] [PubMed]
- Li, Z.; Peng, Y.; Ma, X. Different response on drought tolerance and post-drought recovery between the small-leafed and the large-leafed white clover (Trifolium repens L.) associated with antioxidative enzyme protection and lignin metabolism. Acta Physiol. Plant. 2013, 35, 213–222. [Google Scholar] [CrossRef]
- Liu, W.; Jiang, Y.; Wang, C.; Zhao, L.; Jin, Y.; Xing, Q.; Li, M.; Lv, T.; Qi, H. Lignin synthesized by CmCAD2 and CmCAD3 in oriental melon (Cucumis melo L.) seedlings contributes to drought tolerance. Plant Mol. Biol. 2020, 103, 689–704. [Google Scholar] [CrossRef]
- Aguayo, M.F.; Ampuero, D.; Mandujano, P.; Parada, R.; Muñoz, R.; Gallart, M.; Altabella, T.; Cabrera, R.; Stange, C.; Handford, M. Sorbitol dehydrogenase is a cytosolic protein required for sorbitol metabolism in Arabidopsis thaliana. Plant Sci. 2013, 205–206, 63–75. [Google Scholar] [CrossRef]
- Jia, Y.; Wong, D.C.; Sweetman, C.; Bruning, J.B.; Ford, C.M. New insights into the evolutionary history of plant sorbitol dehydrogenase. BMC Plant Biol. 2015, 15, 101. [Google Scholar] [CrossRef] [Green Version]
- Cha, J.-Y.; Kim, J.Y.; Jung, I.J.; Kim, M.R.; Melencion, A.; Alam, S.S.; Yun, D.-J.; Lee, S.Y.; Kim, M.G.; Kim, W.-Y. NADPH-dependent thioredoxin reductase A (NTRA) confers elevated tolerance to oxidative stress and drought. Plant Physiol. Biochem. 2014, 80, 184–191. [Google Scholar] [CrossRef]
- da Fonseca-Pereira, P.; Daloso, D.M.; Gago, J.; Silva, F.M.D.O.; A Condori-Apfata, J.; Florez-Sarasa, I.; Tohge, T.; Reichheld, J.-P.; Nunes-Nesi, A.; Fernie, A.R.; et al. The Mitochondrial Thioredoxin System Contributes to the Metabolic Responses Under Drought Episodes in Arabidopsis. Plant Cell Physiol. 2019, 60, 213–229. [Google Scholar] [CrossRef] [Green Version]
- Duan, F.; Ding, J.; Lee, D.; Lu, X.; Feng, Y.-Q.; Song, W. Overexpression of SoCYP85A1, a Spinach Cytochrome p450 Gene in Transgenic Tobacco Enhances Root Development and Drought Stress Tolerance. Front. Plant Sci. 2017, 8, 1909. [Google Scholar] [CrossRef] [PubMed] [Green Version]
- Rao, M.J.; Xu, Y.; Tang, X.; Huang, Y.; Liu, J.; Deng, X.; Xu, Q. CsCYT75B1, a Citrus CYTOCHROME P450 Gene, Is Involved in Accumulation of Antioxidant Flavonoids and Induces Drought Tolerance in Transgenic Arabidopsis. Antioxidants 2020, 9, 161. [Google Scholar] [CrossRef] [PubMed] [Green Version]
- Magwanga, R.O.; Lu, P.; Kirungu, J.N.; Dong, Q.; Cai, X.; Zhou, Z.; Wang, X.; Hou, Y.; Xu, Y.; Peng, R.; et al. Knockdown of Cytochrome P450 Genes Gh_D07G1197 and Gh_A13G2057 on Chromosomes D07 and A13 Reveals Their Putative Role in Enhancing Drought and Salt Stress Tolerance in Gossypium hirsutum. Genes 2019, 10, 226. [Google Scholar] [CrossRef] [Green Version]
- Islam, T.; Manna, M.; Reddy, M.K. Glutathione Peroxidase of Pennisetum glaucum (PgGPx) Is a Functional Cd2+ Dependent Peroxiredoxin that Enhances Tolerance against Salinity and Drought Stress. PLoS ONE 2015, 10, e0143344. [Google Scholar] [CrossRef]
- Csiszár, J.; Gallé, A.; Horváth, E.; Dancsó, P.; Gombos, M.; Váry, Z.; Erdei, L.; Györgyey, J.; Tari, I. Different peroxidase activities and expression of abiotic stress-related peroxidases in apical root segments of wheat genotypes with different drought stress tolerance under osmotic stress. Plant Physiol. Biochem. 2012, 52, 119–129. [Google Scholar] [CrossRef]
- Liu, J.-X.; Feng, K.; Duan, A.-Q.; Li, H.; Yang, Q.-Q.; Xu, Z.-S.; Xiong, A.-S. Isolation, purification and characterization of an ascorbate peroxidase from celery and overexpression of the AgAPX1 gene enhanced ascorbate content and drought tolerance in Arabidopsis. BMC Plant Biol. 2019, 19, 1–13. [Google Scholar] [CrossRef] [Green Version]
- Zhang, L.; Wu, M.; Teng, Y.; Jia, S.; Yu, D.; Wei, T.; Chen, C.; Song, W. Overexpression of the Glutathione Peroxidase 5 (RcGPX5) Gene From Rhodiola crenulata Increases Drought Tolerance in Salvia miltiorrhiza. Front. Plant Sci. 2019, 9, 1950. [Google Scholar] [CrossRef] [PubMed]
- George, S.; Manoharan, D.; Li, J.; Britton, M.; Parida, A. Drought and salt stress in Chrysopogon zizanioides leads to common and specific transcriptomic responses and may affect essential oil composition and benzylisoquinoline alkaloids metabolism. Curr. Plant Biol. 2017, 11–12, 12–22. [Google Scholar] [CrossRef]
- Morrell, R.; Sadanandom, A. Dealing with Stress: A Review of Plant SUMO Proteases. Front. Plant Sci. 2019, 10, 1122. [Google Scholar] [CrossRef]
- Huang, Y.; Xiao, B.; Xiong, L. Characterization of a stress responsive proteinase inhibitor gene with positive effect in improving drought resistance in rice. Planta 2007, 226, 73–85. [Google Scholar] [CrossRef]
- Zhang, X.; Liu, S.; Takano, T. Two cysteine proteinase inhibitors from Arabidopsis thaliana, AtCYSa and AtCYSb, increasing the salt, drought, oxidation and cold tolerance. Plant Mol. Biol. 2008, 68, 131–143. [Google Scholar] [CrossRef] [PubMed]
- Budič, M.; Sabotič, J.; Meglič, V.; Kos, J.; Kidrič, M. Characterization of two novel subtilases from common bean (Phaseolus vulgaris L.) and their responses to drought. Plant Physiol. Biochem. 2013, 62, 79–87. [Google Scholar] [CrossRef] [PubMed]
- Figueiredo, J.; Silva, M.S.; Figueiredo, A. Subtilisin-like proteases in plant defence: The past, the present and beyond. Mol. Plant Pathol. 2018, 19, 1017–1028. [Google Scholar] [CrossRef] [PubMed]
- Grigorova, B.; Vaseva, I.; Demirevska, K.; Feller, U. Expression of selected heat shock proteins after individually applied and combined drought and heat stress. Acta Physiol. Plant. 2011, 33, 2041–2049. [Google Scholar] [CrossRef]
- Taji, T.; Ohsumi, C.; Iuchi, S.; Seki, M.; Kasuga, M.; Kobayashi, M.; Yamaguchi-Shinozaki, K.; Shinozaki, K. Important roles of drought- and cold-inducible genes for galactinol synthase in stress tolerance in Arabidopsis thaliana. Plant J. 2002, 29, 417–426. [Google Scholar] [CrossRef]
- Zhuo, C.; Wang, T.; Lu, S.; Zhao, Y.; Li, X.; Guo, Z. A cold responsive galactinol synthase gene fromMedicago falcata(MfGolS1) is induced bymyo-inositol and confers multiple tolerances to abiotic stresses. Physiol. Plant. 2013, 149, 67–78. [Google Scholar] [CrossRef]
- Vinson, C.C.; Mota, A.P.Z.; Porto, B.N.; Oliveira, T.N.; Sampaio, I.; Lacerda, A.L.; Danchin, E.G.J.; Guimaraes, P.M.; Williams, T.C.R.; Brasileiro, A.C.M. Characterization of raffinose metabolism genes uncovers a wild Arachis galactinol synthase conferring tolerance to abiotic stresses. Sci. Rep. 2020, 10, 1–19. [Google Scholar] [CrossRef]
- Hayat, S.; Hayat, Q.; Alyemeni, M.N.; Wani, A.S.; Pichtel, J.; Ahmad, A. Role of proline under changing environments: A review. Plant Signal. Behav. 2012, 7, 1456–1466. [Google Scholar] [CrossRef] [Green Version]
- Jarzyniak, K.; Jasiå„Ski, M. Membrane transporters and drought resistance—A complex issue. Front. Plant Sci. 2014, 5, 687. [Google Scholar] [CrossRef] [Green Version]
- Kaur, G.; Asthir, B. Proline: A key player in plant abiotic stress tolerance. Biol. Plant. 2015, 59, 609–619. [Google Scholar] [CrossRef]
- Li, Y.C.; Meng, F.R.; Zhang, C.Y.; Zhang, N.; Sun, M.S.; Ren, J.P.; Bin Niu, H.; Wang, X.; Yin, J. Comparative analysis of water stress-responsive transcriptomes in drought-susceptible and -tolerant wheat (Triticum aestivum L.). J. Plant Biol. 2012, 55, 349–360. [Google Scholar] [CrossRef]
- Jones, L.; McQueen-Mason, S. A role for expansins in dehydration and rehydration of the resurrection plant Craterostigma plantagineum. FEBS Lett. 2004, 559, 61–65. [Google Scholar] [CrossRef] [Green Version]
- Li, F.; Han, Y.; Feng, Y.; Xing, S.; Zhao, M.; Chen, Y.; Wang, W. Expression of wheat expansin driven by the RD29 promoter in tobacco confers water-stress tolerance without impacting growth and development. J. Biotechnol. 2013, 163, 281–291. [Google Scholar] [CrossRef]
- Cho, S.K.; Kim, J.E.; Park, J.-A.; Eom, T.J.; Kim, W.T. Constitutive expression of abiotic stress-inducible hot pepperCaXTH3, which encodes a xyloglucan endotransglucosylase/hydrolase homolog, improves drought and salt tolerance in transgenicArabidopsisplants. FEBS Lett. 2006, 580, 3136–3144. [Google Scholar] [CrossRef] [PubMed] [Green Version]
- Choi, J.Y.; Seo, Y.S.; Kim, S.J.; Kim, W.T.; Shin, J.S. Constitutive expression of CaXTH3, a hot pepper xyloglucan endotransglucosylase/hydrolase, enhanced tolerance to salt and drought stresses without phenotypic defects in tomato plants (Solanum lycopersicum cv. Dotaerang). Plant Cell Rep. 2011, 30, 867–877. [Google Scholar] [CrossRef]
- Dong, J. Isolation of a novel xyloglucan endotransglucosylase (OsXET9) gene from rice and analysis of the response of this gene to abiotic stresses. Afr. J. Biotechnol. 2011, 10, 17424–17434. [Google Scholar] [CrossRef]
- Blum, A. Osmotic adjustment is a prime drought stress adaptive engine in support of plant production. Plant Cell Environ. 2017, 40, 4–10. [Google Scholar] [CrossRef]
- Turner, N.C. Turgor maintenance by osmotic adjustment: 40 years of progress. J. Exp. Bot. 2018, 69, 3223–3233. [Google Scholar] [CrossRef] [PubMed] [Green Version]
- Le Gall, H.; Philippe, F.; Domon, J.-M.; Gillet, F.; Pelloux, J.; Rayon, C. Cell Wall Metabolism in Response to Abiotic Stress. Plants 2015, 4, 112–166. [Google Scholar] [CrossRef]
- Fanourakis, D.; Nikoloudakis, N.; Pappi, P.; Markakis, E.; Doupis, G.; Charova, S.N.; Delis, C.; Tsaniklidis, G. The Role of Proteases in Determining Stomatal Development and Tuning Pore Aperture: A Review. Plants 2020, 9, 340. [Google Scholar] [CrossRef] [Green Version]
- Frolich, E.F.; Platt, R.G. Use of the etiolation technique in rooting avocado cuttings. Calif. Avocado Soc. Yearb. 1972, 55, 97–109. [Google Scholar]
- Hsiao, T.C. Measurements of plant water status. In Irrigation of Agricultural Crops; Monograph No. 30; Stewart, B.A., Nielsen, D.R., Eds.; American Society of Agronomy: Madison, WI, USA, 1990; pp. 243–279. [Google Scholar]
- Von Caemmerer, S.; Farquhar, G. Some relationships between the biochemistry of photosynthesis and the gas exchange of leaves. Planta 1981, 153, 376–387. [Google Scholar] [CrossRef]
- Uddling, J.; Gelang-Alfredsson, J.; Piikki, K.; Pleijel, H. Evaluating the relationship between leaf chlorophyll concentration and SPAD-502 chlorophyll meter readings. Photosynth. Res. 2007, 91, 37–46. [Google Scholar] [CrossRef]
- Lovisolo, C.; Hartung, W.; Schubert, A. Whole-plant hydraulic conductance and root-to-shoot flow of abscisic acid are independently affected by water stress in grapevines. Funct. Plant Biol. 2002, 29, 1349–1356. [Google Scholar] [CrossRef] [PubMed]
- Chang, S.; Puryear, J.; Cairney, J. A simple and efficient method for isolating RNA from pine trees. Plant Mol. Biol. Rep. 1993, 11, 113–116. [Google Scholar] [CrossRef]
- Warnes, G.R.; Bolker, B.; Bonebakker, L.; Gentleman, R.; Liaw, W.H.A.; Lumley, T.; Maechler, M.; Magnusson, A.; Moeller, S.; Schwartz, M.; et al. gplots: Various R Programming Tools for Plotting Data. R Package Version 3.0.1. 2016. Available online: https://cran.r-project.org/web/packages/gplots/index.html (accessed on 30 April 2018).
- Neuwirth, E. RcolorBrewer: Colorbrewer Palettes. R Package Version 1.1–2. 2014. Available online: https://CRAN.R-project.org/package=RColorBrewer (accessed on 1 April 2018).
- Engelbrecht, J.; Berg, N.V.D. Expression of defence-related genes against Phytophthora cinnamomi in five avocado rootstocks. S. Afr. J. Sci. 2013, 109, 1–8. [Google Scholar] [CrossRef] [Green Version]
- Pfaffl, M.W. A new mathematical model for relative quantification in real-time RT-PCR. Nucleic Acids Res. 2001, 29, 45e. [Google Scholar] [CrossRef] [PubMed]


| Control | Mild-WS | Severe-WS | Mild-WSRecovery | Severe-WSRecovery | ||||||
|---|---|---|---|---|---|---|---|---|---|---|
| Plant dry biomass (g) | 567.94 ± 63.76 | ns | 504.08 ± 64.02 | ns | 554.43 ± 38.84 | ns | 572.93 ± 77.63 | ns | 571.70 ± 30.88 | ns |
| Leaf dry biomass (%) | 29.09 ± 2.74 | ns | 21.26 ± 2.18 | ns | 23.30 ± 2.57 | ns | 29.87 ± 1.96 | ns | 23.09 ± 2.57 | ns |
| Stem dry biomass (%) | 43.69 ± 1.45 | ns | 41.46 ± 2.07 | ns | 39.00 ± 2.27 | ns | 38.91 ± 0.82 | ns | 39.30 ± 0.37 | ns |
| Root dry biomass (%) | 27.22 ± 2.60 | b | 37.28 ± 0.95 | a | 37.70 ± 2.45 | a | 31.22 ± 2.42 | ab | 37.61 ± 2.60 | a |
| Root /shoot ratio | 0.38 ± 0.05 | b | 0.60 ± 0.02 | a | 0.61 ± 0.06 | a | 0.46 ± 0.05 | ab | 0.61 ± 0.06 | a |
| Leaf mass area (g·m−2) | 98.76 ± 3.09 | ab | 90.05 ± 1.52 | b | 74.17 ± 5.50 | c | 104.17 ± 6.78 | a | 86.90 ± 6.92 | bc |
| Mild-WS | Severe-WS | ||||
|---|---|---|---|---|---|
| Annotation | Contig | Microarray FC | q-RT FC | Microarray FC | q-RT FC |
| PR5 | Pa_Contig01462 | 2.80 | 4.06 | 6.10 | 7.24 |
| Profilin 1 isoform 1 | Pa_Contig02273 | 1.07 | 1.39 | −1.10 | −1.22 |
| Protease inhibitor II | Pa_Contig03907 | −1.20 | −1.68 | 2.12 | 4.31 |
| Alcohol dehydrogenase b | Pa_Sin_GI32N0T02IUGTU | 1.04 | 1.61 | −1.05 | −2.00 |
| LRR resistance PLP | Pa_Contig01244 | 1.06 | 1.39 | −1.12 | −1.22 |
| Trypsin inhibitor | Pa_Contig04097 | −2.39 | −1.18 | 1.16 | 1.51 |
| Sucrose synthase | Pa_Contig00004 | −1.83 | −2.22 | −1.54 | −1.44 |
| Phenylalanine ammonia-lyase (PAL) | Pa_Contig00410 | −1.00 | −1.59 | −1.41 | −1.51 |
| Chalcone synthase | Pa_Contig00619 | −1.50 | −3.54 | −3.02 | −6.10 |
| Xyloglucan endotransglucosylase hydrolase | Pa_Contig00751 | −2.04 | −4.63 | −2.71 | −7.94 |
| Defensin j1-2-like | Pa_Contig04185 | −1.99 | −2.32 | −2.04 | −1.33 |
| Lipoxygenase (LOX) | Pa_Contig04337 | −1.74 | −2.29 | −1.85 | −4.15 |
| PR4 | Pa_Contig06278 | −3.28 | −2.67 | −3.78 | −5.60 |
| Mild-WS | Severe-WS | ||||
|---|---|---|---|---|---|
| Name | Description | FC | Name | Description | FC |
| Pa_Sin_FZ03KKT01BNH1K | 18.1 kDa class I heat-shock protein-like | 28.94 | Pa_Sin_FZ03KKT01BNH1K | 18.1 kDa class I heat-shock protein-like | 23.07 |
| Pa_Sin_HA66E9C01BSEGX | Splicing factor SF3a60 homolog | 22.31 | Pa_Contig05542 | NA | 21.08 |
| Pa_Contig03188 | Transmembrane protein TauE-like | 19.52 | Pa_Sin_GI32N0T02G3V3U | DExH-box ATP-dependent RNA helicase DExH3 | 14.81 |
| Pa_Contig03520 | Transmembrane protein TauE-like | 18.46 | Pa_Contig03188 | Transmembrane protein TauE-like | 13.97 |
| Pa_Sin_GI32N0T02J3CHK | PREDICTED: uncharacterized protein LOC103961965 | 14.94 | Pa_Sin_HA66E9C01AIWJ3 | 25.3 kDa heat-shock protein | 12.05 |
| Pa_Contig02835 | Probable nucleoredoxin 2 | 14.42 | Pa_Contig03520 | Transmembrane protein TauE-like | 11.97 |
| Pa_Contig05542 | NA | 13.94 | Pa_Sin_GI32N0T02IBYBH | Phospholipase D beta 1 | 11.80 |
| Pa_Contig00313 | NAC domain-containing protein 72 | 12.71 | Pa_Contig04544 | Hypothetical protein CKAN_02127100 | 11.75 |
| Pa_Contig00357 | CTP synthase-like isoform X1 | 10.36 | Pa_Contig02363 | galactinol synthase 1 | 11.10 |
| Pa_Contig02363 | Galactinol synthase 1 | 9.48 | Pa_Sin_HA66E9C01ARY1I | 17.9 kDa class II heat-shock protein-like | 10.71 |
| Pa_Sin_GI32N0T02JKR74 | ABC transporter C family member 3 | 9.04 | Pa_Sin_GI32N0T02IZT2Y | Zinc finger MYM-type protein 1-like protein | 10.24 |
| Pa_Sin_GI32N0T02H4DYV | DEAD-box ATP-dependent RNA helicase 56 isoform X2 | 8.56 | Pa_Contig00313 | NAC domain-containing protein 72 | 10.18 |
| Pa_Sin_HA66E9C01B0D6Q | Redoxin | 7.93 | Pa_Sin_HA66E9C01AOOV3 | ATP synthase subunit G mitochondrial-like | 10.00 |
| Pa_Sin_GI32N0T02HYARG | Pentatricopeptide repeat-containing protein At5g66520 | 7.75 | Pa_Contig00357 | CTP synthase-like isoform X1 | 9.80 |
| Pa_Contig03826 | Transcription factor SPATULA-like | 7.67 | Pa_Contig05359 | Wound-responsive family protein | 9.53 |
| Pa_Contig06401 | CTP synthase-like | 7.56 | Pa_Contig04498 | NA | 9.48 |
| Pa_Contig04336 | Trinucleotide repeat-containing gene 18 protein | 7.15 | Pa_Sin_GI32N0T02JFLZB | Pentatricopeptide repeat-containing protein At1g08070 | 8.80 |
| Pa_Contig03089 | Snakin-2 | 7.07 | Pa_Contig06344 | Serine carboxypeptidase-like 42 | 8.79 |
| Pa_Sin_HA66E9C01ARY1I | 17.9 kDa class II heat-shock protein-like | 6.92 | Pa_Contig02835 | Probable nucleoredoxin 2 | 8.38 |
| Pa_Sin_GI32N0T02JL4B4 | 9-cis-epoxycarotenoid dioxygenase | 6.75 | Pa_Sin_HA66E9C01AKONC | Pyrophosphatase domain-containing protein | 8.17 |
| Pa_NA_RC_Contig06917 | NA | −30.10 | Pa_Sin_HA66E9C01AZE26 | Major pollen allergen Bet v 1-F/I | −15.16 |
| Pa_Sin_GI32N0T02JH50H | Photosystem I P700 apoprotein A1 | −19.40 | Pa_Contig07385 | Cysteine peptidase, asparagine active site-containing protein | −14.04 |
| Pa_Sin_GI32N0T02I198R | DExH-box ATP-dependent RNA helicase DExH3 | −18.78 | Pa_Contig07552 | Peptidase_C1 domain-containing protein/Inhibitor_I29 | −11.27 |
| Pa_Sin_HA66E9C01A762Y | Superoxide dismutase [Mn], mitochondrial | −9.61 | Pa_Sin_GI32N0T02GHCO6 | Plasma membrane ATPase 1 | −11.17 |
| Pa_Sin_HA66E9C01ABCHY | Protein unc-13 homolog | −8.37 | Pa_Sin_GI32N0T02I0NSB | Pyruvate decarboxylase 2 | −10.98 |
| Pa_Sin_GI32N0T02IB55S | Hypothetical protein | −7.29 | Pa_Contig03628 | Peptidoglycan-binding Lysin subgroup | −10.89 |
| Pa_NA_RC_Contig06574 | NA | −7.22 | Pa_Contig01574 | TIP protein | −9.40 |
| Pa_Sin_HA66E9C01BUD7H | Aspartate/other aminotransferase | −6.45 | Pa_Contig02013 | Stellacyanin-like protein | −9.09 |
| Pa_Sin_GI32N0T02F883Q | Acyl-protein thioesterase, putative | −6.26 | Pa_Contig00293 | Putative laccase 9 | −9.03 |
| Pa_Sin_GI32N0T02J1G6J | SusD/RagB family nutrient-binding lipoprotein | −5.90 | Pa_Sin_HA66E9C01AN9EE | Peroxidase 3-like | −8.82 |
| Pa_NA_F_contig07053 | NA | −5.84 | Pa_Contig06873 | Hypothetical protein CKAN_01558700 | −8.71 |
| Pa_Contig03714 | l-Idonate 5-dehydrogenase | −5.46 | Pa_Sin_GI32N0T02GK4GX | Putative senescence-associated protein | −8.64 |
| Pa_NA_RC_Contig07246 | Hypothetical protein PHALS_14482 | −5.36 | Pa_Contig05711 | Senescence-specific cysteine protease SAG39-like | −8.56 |
| Pa_Contig01285 | Pathogenesis-related protein 1-like protein | −5.19 | Pa_Sin_HA66E9C01BC645 | HSP20-like chaperone | −8.47 |
| Pa_Contig00582 | BTB/POZ and TAZ domain-containing protein 1-like | −5.10 | Pa_Sin_GI32N0T02IPVS0 | HSP70-like protein | −8.26 |
| Pa_Sin_GI32N0T02FFZXN | Patatin/phospholipase A2-related | −5.02 | Pa_Contig03714 | l-Idonate 5-dehydrogenase | −8.17 |
| Pa_Sin_GI32N0T02GE7BG | Pyruvate decarboxylase 1 | −4.84 | Pa_Sin_GI32N0T02JFZ2K | LURP1-like domain-containing protein | −8.11 |
| Pa_Contig06521 | Hypothetical protein VOLCADRAFT_107374 | −4.69 | Pa_Contig05100 | 14 kDa proline-rich protein DC2.15-like | −7.89 |
| Pa_Contig01605 | 36.4 kDa proline-rich protein | −4.69 | Pa_Sin_GI32N0T02J1LXF | Pentatricopeptide repeat-containing protein At5g18475 | −7.43 |
| Pa_Contig01261 | Basic endochitinase-like protein | −4.64 | Pa_Contig05579 | 14 kDa proline-rich protein DC2.15-like | −7.36 |
| Sequence name | Description | Function | Mild-WS FC | Severe-WS FC | References |
|---|---|---|---|---|---|
| Transcription factor | |||||
| Pa_Contig00978 | B-box zinc finger protein 32 | Transcription factor | 2.50 | 2.73 | [78,79,80] |
| Pa_Contig00204 | Zinc finger CCCH domain-containing protein 20 | Transcription factor | 2.54 | 2.66 | [78,79,80] |
| Pa_Contig04595 | Zinc finger protein ZAT10 | Transcription factor | 2.45 | 2.85 | [78,79,80] |
| Pa_Sin_GI32N0T02FVARP | Heat stress transcription factor B-2a | Transcription factor | 3.33 | [81] | |
| Pa_Sin_GI32N0T02J04TC | Heat stress transcription factor B-3 | Transcription factor | 2.44 | 3.13 | [81] |
| Pa_Sin_GI32N0T02GJ71A | Heat stress transcription factor C-1 | Transcription factor | 4.41 | 5.44 | [81] |
| Pa_Contig00660 | Homeobox-leucine zipper protein HAT5 | Transcription factor | 4.51 | 2.32 | [82] |
| Pa_Contig01191 | NAC domain-containing protein 2 | Transcription factor | 3.88 | 4.15 | [83,84,85,86,87] |
| Pa_Contig03450 | NAC domain-containing protein 2 | Transcription factor | 3.67 | 5.30 | [83,84,85,86,87] |
| Pa_Contig00313 | NAC domain-containing protein 72 | Transcription factor | 12.71 | 10.18 | [83,84,85,86,87] |
| Pa_Contig07055 | NAC domain-containing protein 82-like protein | Transcription factor | 1.88 | 2.60 | [83,84,85,86,87] |
| Pa_Contig07561 | NAC domain-containing protein 82-like protein | Transcription factor | 1.94 | 2.57 | [83,84,85,86,87] |
| Pa_Contig03801 | Probable WRKY transcription factor 31 | Transcription factor | 2.05 | [88] | |
| Pa_Contig04109 | Probable WRKY transcription factor 48 | Transcription factor | 1.33 | 2.48 | [88] |
| Pa_Contig03985 | Transcription factor MYB1R1 | Transcription factor | 2.15 | 2.64 | [89] |
| Pa_Contig05714 | Transcription factor MYBS3 | Transcription factor, Response to hormones | 2.06 | 1.99 | [89] |
| Pa_Contig05191 | Trihelix transcription factor ASIL2 | Transcription factor | 1.69 | 2.36 | [90,91,92] |
| Hormonal regulation | |||||
| Pa_Sin_GI32N0T02JL4B4 | 9-cis-Epoxycarotenoid dioxygenase | Abscisic acid signaling pathway | 6.75 | 2.34 | [62,63,93,94,95] |
| Pa_Sin_GI32N0T02HK1RI | 9-cis-Epoxycarotenoid dioxygenase NCED1 | Abscisic acid signaling pathway | 5.71 | 1.55 | [62,63,93,94,95] |
| Pa_Sin_HA66E9C01AOCH8 | Putative 9-cis-epoxycarotenoid dioxygenase | Abscisic acid signaling pathway | 4.29 | 1.70 | [62,63,93,94,95] |
| Pa_Contig04541 | Abscisic acid-insensitive 5-like protein 5 | Abscisic acid signaling pathway | 2.30 | 1.70 | [96,97] |
| Pa_Contig01488 | Probable protein phosphatase 2C 24 | Abscisic acid signaling pathway | 4.19 | 2.12 | [98,99] |
| Pa_Contig04387 | Myo-inositol-1-phosphate synthase | Stress signaling | 5.97 | 3.80 | [100,101,102,103] |
| Redox homeostasis | |||||
| Pa_Contig00910 | Ubiquinol oxidase 2 | Alternative oxidase (AOX) activity | 2.52 | 3.78 | [104] |
| Pa_Contig02586 | Glutathione S-transferase 23-like | Glutathione transferase activity | 2.32 | 3.50 | [105,106,107] |
| Pa_Contig05480 | Probable glutathione S-transferase | Glutathione transferase activity | 2.14 | 1.88 | [105,106,107] |
| Pa_Contig01550 | Probable glutathione S-transferase parA | Glutathione transferase activity | 2.14 | 1.42 | [105,106,107] |
| Pa_Contig01827 | Putative glutathione S-transferase | Glutathione transferase activity | 4.40 | 2.62 | [105,106,107] |
| Pa_Contig02245 | Alcohol dehydrogenase superfamily, zinc-type | Oxidoreductase activity | 2.01 | 2.26 | [108] |
| Pa_Sin_GI32N0T02JXR49 | Amine oxidase | Oxidoreductase activity | 2.13 | 2.12 | [109,110] |
| Pa_Sin_HA66E9C01AHBP7 | Amine oxidase | Oxidoreductase activity | 2.09 | 2.37 | [109,110] |
| Pa_Sin_GI32N0T02HAOKJ | Cytokinin dehydrogenase 7 isoform X2 | Oxidoreductase activity | 2.04 | [111,112,113] | |
| Pa_Sin_GI32N0T02H5ZVO | Lipoxygenase 6 | Oxidoreductase activity | 2.04 | [114,115,116] | |
| Pa_Contig01521 | NADP-dependent glyceraldehyde-3-phosphate dehydrogenase | Oxidoreductase activity | 2.44 | 2.03 | [117,118] |
| Pa_Sin_GI32N0T02IWQT9 | Probable cinnamyl alcohol dehydrogenase 6 | Oxidoreductase activity, lignin biosynthesis | 2.68 | [119,120,121] | |
| Pa_Contig04086 | Sorbitol dehydrogenase | Oxidoreductase activity | 3.03 | 3.47 | [122,123] |
| Pa_Contig03274 | Thioredoxin-like protein CXXS1 | Oxidoreductase activity | 2.17 | [124,125] | |
| Pa_Contig01894 | Corytuberine synthase (Cytochrome P450) | Oxidoreductase activity | 2.28 | 1.35 | [126,127,128] |
| Pa_Contig01546 | Cytochrome P450 CYP72A219-like protein | Oxidoreductase activity | 1.71 | 2.07 | [126,127,128] |
| Pa_Contig01573 | Cytochrome P450 714C2-like | Oxidoreductase activity | 3.88 | 3.22 | [126,127,128] |
| Pa_Contig01652 | Cytochrome P450 71A1 | Oxidoreductase activity | 2.37 | 3.52 | [126,127,128] |
| Pa_Contig07139 | Cytochrome P450 71A1 | Oxidoreductase activity | 2.34 | 3.11 | [126,127,128] |
| Pa_Contig07325 | Cytochrome P450 71A1 | Oxidoreductase activity | 2.04 | 3.00 | [126,127,128] |
| Pa_Contig07667 | Cytochrome P450 71A1 | Oxidoreductase activity | 2.36 | 3.16 | [126,127,128] |
| Pa_Contig00616 | Cytochrome P450 89A2 | Oxidoreductase activity | 3.03 | 2.80 | [126,127,128] |
| Pa_Contig04644 | Cytochrome P450 89A2 | Oxidoreductase activity | 5.79 | 3.53 | [126,127,128] |
| Pa_Sin_HA66E9C01B0D6Q | 1-Cys peroxiredoxin isozyme | Peroxidase activity | 7.93 | [129] | |
| Pa_Sin_GI32N0T02JBZZB | Peroxiredoxin Q | Peroxidase activity | 2.25 | [129] | |
| Pa_Contig05152 | Cationic peroxidase 1-like | Peroxidase activity | 2.01 | [130,131,132] | |
| Pa_Contig06649 | Cationic peroxidase 1-like | Peroxidase activity | 2.13 | 5.48 | [130,131,132] |
| Pa_Contig04553 | Peroxidase 12-like | Peroxidase activity | 2.01 | [130,131,132] | |
| Protease and protease inhibitor activity | |||||
| Pa_Contig01409 | Serine carboxypeptidase-like 42 | Intracellular turnover of proteins | 2.69 | 5.98 | [67,133] |
| Pa_Contig02982 | Serine carboxypeptidase-like 42 | Intracellular turnover of proteins | 1.87 | 6.32 | [67,133] |
| Pa_Contig06344 | Serine carboxypeptidase-like 42 | Intracellular turnover of proteins | 2.19 | 8.79 | [67,133] |
| Pa_Contig03889 | Desumoylating isopeptidase 1 | Post-translational mechanism in respond to stress | 1.71 | 2.02 | [134] |
| Pa_Contig02540 | Kunitz trypsin inhibitor 2 | Protease inhibitor, wound and herbivores response | 1.40 | 2.10 | [59] |
| Pa_Contig00984 | Cysteine proteinase inhibitor 12-like | Proteinase inhibitor | 1.94 | 2.36 | [49,61,135,136] |
| Pa_Contig05072 | Proteinase inhibitor | Proteinase inhibitor | 1.44 | 2.47 | [49,61,135,136] |
| Pa_NA_RC_Contig07158 | Proteinase inhibitor I3 | Proteinase inhibitor | 1.42 | 3.05 | [49,61,135,136] |
| Pa_Contig03565 | Subtilisin-like protease SBT3.17 | Serine protease, plant defense response | 2.68 | [137,138] | |
| Chaperone and heat shock proteins | |||||
| Pa_Contig03398 | Chaperone protein ClpB1 | Chaperone activity | 3.33 | 4.30 | [139] |
| Pa_Sin_GI32N0T02HS82J | Chaperone protein ClpB1 | Chaperone activity | 3.56 | 5.20 | [139] |
| Pa_Sin_GI32N0T02HS9YT | Chaperone protein ClpB1 | Chaperone activity | 3.70 | 6.05 | [139] |
| Pa_Contig03328 | Chaperone protein dnaJ 11 | Chaperone activity | 2.47 | 2.68 | [139] |
| Pa_Sin_HA66E9C01AV9KD | Chaperonin-like RbcX protein 2 | Chaperone activity | 2.86 | 3.94 | [139] |
| Pa_Sin_GI32N0T02GU01I | Chaperonin-like RbcX protein 2 | Chaperone activity | 3.65 | [139] | |
| Pa_Sin_HA66E9C01BZUZG | 15.7 kDa heat-shock protein, peroxisomal | Heat-shock protein activity | 2.12 | 3.43 | [139] |
| Pa_Sin_HA66E9C01AHKXT | 17.3 kDa class II heat-shock protein | Heat-shock protein activity | 5.67 | 5.93 | [139] |
| Pa_Contig01858 | 17.8 kDa class I heat-shock protein-like | Heat-shock protein activity | 3.94 | 5.70 | [139] |
| Pa_Sin_HA66E9C01ARY1I | 17.9 kDa class II heat-shock protein-like | Heat-shock protein activity | 6.92 | 10.71 | [139] |
| Pa_Sin_FZ03KKT01BNH1K | 18.1 kDa class I heat-shock protein-like | Heat-shock protein activity | 28.94 | 23.07 | [139] |
| Pa_Sin_HA66E9C01AIWJ3 | 25.3 kDa heat-shock protein | Heat-shock protein activity | 6.14 | 12.05 | [139] |
| Pa_Contig02550 | Class I heat-shock-like protein | Heat-shock protein activity | 3.23 | 5.38 | [139] |
| Pa_Sin_GI32N0T02I40L4 | Class I heat-shock-like protein | Heat-shock protein activity | 1.54 | 3.31 | [139] |
| Pa_Sin_HA66E9C01AFKWO | Heat-shock 70 kDa protein | Heat-shock protein activity | 3.60 | [139] | |
| Pa_Sin_GI32N0T02GPO75 | Heat-shock 70 kDa protein 15-like | Heat-shock protein activity | 4.71 | [139] | |
| Pa_Sin_GI32N0T02J33GV | Heat-shock 70 kDa protein 17 | Heat-shock protein activity | 3.30 | [139] | |
| Pa_Contig00041 | Heat-shock cognate 70 kDa protein 2 | Heat-shock protein activity | 1.64 | 2.02 | [139] |
| Pa_Sin_GI32N0T02FE65Z | Heat-shock protein | Heat-shock protein activity | 3.59 | 5.30 | [139] |
| Pa_Contig04262 | Heat-shock protein 70 | Heat-shock protein activity | 2.05 | 2.63 | [139] |
| Pa_Contig00058 | Heat-shock protein 83 | Heat-shock protein activity | 3.74 | 4.25 | [139] |
| Pa_Contig05589 | Small heat-shock protein | Heat-shock protein activity | 1.82 | 2.40 | [139] |
| Osmoprotectant | |||||
| Pa_Contig02363 | Galactinol synthase 1 | Galactose metabolism | 9.48 | 11.10 | [140,141,142] |
| Pa_Contig04773 | Galactinol synthase 1-like | Galactose metabolism | 5.25 | 6.49 | [140,141,142] |
| Pa_Contig00418 | Probable galactinol–sucrose galactosyltransferase 2 | Myo-inositol and raffinose synthesis | 2.15 | 2.83 | [100,101,102,103] |
| Pa_Contig02227 | Probable galactinol–sucrose galactosyltransferase 2 | Myo-inositol and raffinose synthesis | 2.14 | 2.30 | [100,101,102,103] |
| Pa_Sin_GI32N0T02GAY0V | Proline transporter 2-like | Proline metabolic process | 2.65 | 3.14 | [143,144,145] |
| Pa_Contig05170 | Beta-fructofuranosidase, soluble isoenzyme I-like | Sucrose metabolic process | 4.03 | 5.32 | [146] |
| Cell-wall organization | |||||
| Pa_Contig05067 | Expansin-like A2 | Cell-wall organization | 2.41 | 1.55 | [147,148] |
| Pa_Contig00733 | Probable xyloglucan endotransglucosylase/hydrolase protein 23 | Cell-wall organization | 4.64 | 5.16 | [149,150,151] |
| Pa_Contig01176 | Probable xyloglucan endotransglucosylase/hydrolase protein 27 | Cell-wall organization | 2.14 | 1.86 | [149,150,151] |
Publisher’s Note: MDPI stays neutral with regard to jurisdictional claims in published maps and institutional affiliations. |
© 2021 by the authors. Licensee MDPI, Basel, Switzerland. This article is an open access article distributed under the terms and conditions of the Creative Commons Attribution (CC BY) license (https://creativecommons.org/licenses/by/4.0/).
Share and Cite
Guillermo, M.-O.; Adela, Z.; Antonio, M.; Olivier, N.A.; Noëlani, v.d.B.; Palomo-Ríos, E.; Elsa, M.-F.; Clara, P. Physiological and Molecular Responses of ‘Dusa’ Avocado Rootstock to Water Stress: Insights for Drought Adaptation. Plants 2021, 10, 2077. https://doi.org/10.3390/plants10102077
Guillermo M-O, Adela Z, Antonio M, Olivier NA, Noëlani vdB, Palomo-Ríos E, Elsa M-F, Clara P. Physiological and Molecular Responses of ‘Dusa’ Avocado Rootstock to Water Stress: Insights for Drought Adaptation. Plants. 2021; 10(10):2077. https://doi.org/10.3390/plants10102077
Chicago/Turabian StyleGuillermo, Moreno-Ortega, Zumaquero Adela, Matas Antonio, Nicholas A. Olivier, van den Berg Noëlani, Elena Palomo-Ríos, Martínez-Ferri Elsa, and Pliego Clara. 2021. "Physiological and Molecular Responses of ‘Dusa’ Avocado Rootstock to Water Stress: Insights for Drought Adaptation" Plants 10, no. 10: 2077. https://doi.org/10.3390/plants10102077
APA StyleGuillermo, M.-O., Adela, Z., Antonio, M., Olivier, N. A., Noëlani, v. d. B., Palomo-Ríos, E., Elsa, M.-F., & Clara, P. (2021). Physiological and Molecular Responses of ‘Dusa’ Avocado Rootstock to Water Stress: Insights for Drought Adaptation. Plants, 10(10), 2077. https://doi.org/10.3390/plants10102077