1. Introduction
At the moment, disinformation has become a real threat in the digital world, also on crowdsourcing platforms. In this respect, Volunteered Geographic Information (VGI) has not been spared as it is also prone to vandalism. The most famous examples of such vandalism include New York City being renamed Jewtropolis in OpenStreetMap (OSM) by a contributor qualified as an “anti-Semite” in the press [
1], but self-declared as an “ethical hacker” (
https://www.reddit.com/r/openstreetmap/comments/9brqx4/this_is_medwedianpresident1_talking_what_i_did/), or Google workers from India caught reversing one-way streets in OpenStreetMap (OSM) [
2]. Vandalism acts on OSM were estimated to be 0.2% of changesets in 2018 [
3].
In VGI, carto-vandalism designates all mapping contributions that are intentionally perpetrated in order to deface the collaborative spatial database without good reason [
4,
5,
6]. Yet, in order to be reusable and trustworthy, crowdsourced spatial data should ensure a certain level of quality. Therefore, with the aim of providing a minimal level of quality of VGI, one possible solution could be to automatically detect vandalism. Vandalism detection tools have been developed to spot vandalism on Wikidata platforms in an automated way [
7,
8]. However, in the case of VGI, very few tools were devised to address this issue precisely; actually, current research is not able to automatically detect carto-vandalism [
5,
9].
Consequently, this paper investigates the following question: To what extent can vandalism in VGI be automatically detected using supervised machine learning methods?
One of the main challenges of supervised machine learning is domain adaptation, also known as transfer learning [
10,
11]. This issue refers to the ability of the learning algorithm to classify the data regardless, in our case, of the geographical region considered. This is what [
12] calls homogeneous transfer learning.
Therefore, we intend to answer the following questions:
How do we acquire or generate a corpus covering different cases of vandalism in different regions of the map?
Which features can we use from OSM in order to build the learning dataset?
Is a classifier, trained on a part of a specific geographic region, able to detect OSM vandalism automatically over the other parts of this specific region?
Can the same classifier detect OSM vandalism in any region of the world?
If we consider a learning dataset, considering several regions, is the model built on it better to detect OSM vandalism in any region of the map?
We contribute to this research by first designing a corpus of vandalism on OpenStreetMap (OSM) data, then by experimenting with a supervised learning method, the random forests [
13], to detect vandalism in OSM. The experimental results’ analysis leads us to evaluate the strengths and weaknesses of the approach in order to detect various kinds of vandalism in different regions of interest.
The article is structured as follows.
Section 2 reviews related work on VGI vandalism.
Section 3 describes the construction of our vandalism corpus.
Section 4 introduces the general methodology of the conducted experiments.
Section 5 presents our random forests classifier and the results obtained with this classifier.
Section 6 discusses the ability of these techniques to detect vandalism in OSM.
Section 7 concludes the article and gives some insight into future work.
2. Related Work
In order to better understand the mechanisms of vandalism in VGI and OSM, a few studies focused on the past cases of vandalism in OSM. For instance, there were many cases of vandalism caused by players of the Pokemon GO game, and most of them were identified and reverted by experienced OSM users [
9]. In this study, the vandalized features were collected using the comments made by the experienced users when reverting the changes. The study shows that most vandals are young users, as vandalism occurred a few hours after their registration to OSM. In the case of Pokemon GO vandalism, only 16.5% of vandalized features stayed in the dataset for more than a week. These two results are interesting if we want to detect vandalism automatically.
There were also two studies of the list of users banned from OSM [
5,
6]. Even if bans are rarely due to vandalism actions, but more to due misconduct towards the community of OSM contributors, this list gives an idea of the diversity of vandalism cases in OSM.
Then, as a significant part of the vandalized features in OSM can remain unchanged for a long time, researchers investigated the automatic detection of this vandalism. Recent research has explored the potential of unsupervised techniques to detect vandalism in OpenStreetMap, in particular by using clustering-based outlier detection algorithms [
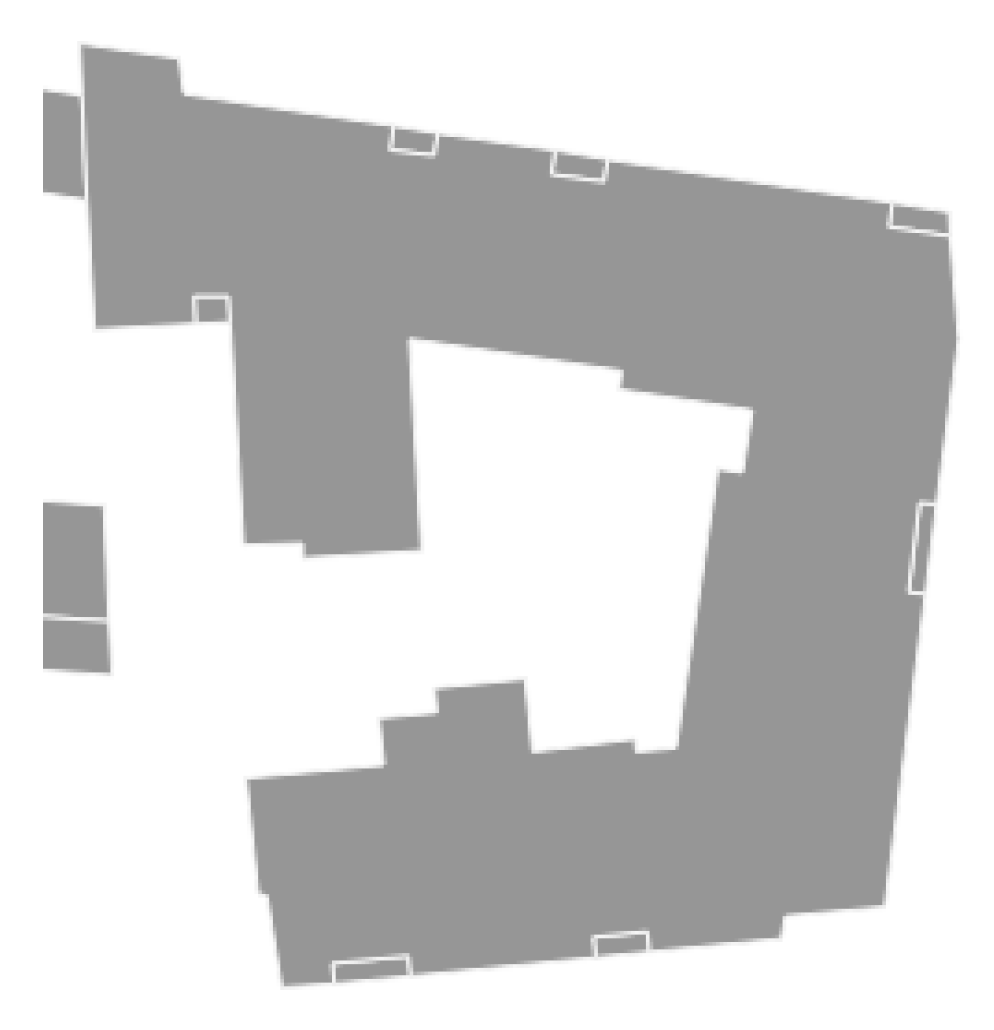
5]. However, the output of this approach relies heavily on the characteristics of the dataset. For instance, many buildings in France are mapped by parts. Consequently, OSM datasets from French regions contain small and weirdly shaped buildings (
Figure 1). Consequently, vandalizing these datasets by mapping small fictional buildings will probably go unnoticed according to an outlier detection algorithm, as the vandalized data are not seen as outliers with respect to the rest of the dataset. This highlights the main drawback of detecting vandalism using outlier detection algorithms, in the sense that vandalized data that do not fall in the anomaly set cannot be detected. Therefore, the results of this method are not satisfying enough to enable a fully automatic detection of vandalism in OSM data.
In [
14], a supervised learning system, named OSMPatrol, was proposed to detect errors in OSM thanks to a rule-based method. However, this tool not only detects vandalism—i.e., intentional errors—but also unintentional mistakes. Therefore, exploring the potential of supervised learning methods to detect vandalism in OSM still remains a research agenda. Nevertheless, supervised learning approaches require having a corpus of labelled data available. In this regard, while the corpus of vandalism data exists for knowledge bases such as Wikidata [
15,
16], to the best of our knowledge, there is no such dataset in VGI.
As for choosing the learning algorithm, the work in [
8] stated that random forest is the most appropriate method to detect vandalism in Wikidata. Therefore, it seemed coherent to run experiments using random forest, to determine if this method performs as well for vandalism detection in OSM as for vandalism in Wikidata. On another note, recent work has initiated the use of deep learning to assess the quality of VGI data itself [
17] and even to enhance them [
10]. As detecting vandalism in VGI is a kind of quality assessment, the applications of machine learning to OSM quality assessment are interesting to study.
3. A Corpus of Vandalism in OpenStreetMap
To train a machine learning model to detect vandalised contributions in OSM, a corpus of vandalised contributions is necessary. We propose a model for such a corpus in the first subsection, and then, we describe in the following subsections how we instantiated this corpus with synthetic vandalism.
3.1. Model of the Corpus
What we learned from the studies on past vandalism in OSM is that it is very complex to characterise a single map feature as vandalism, without the context of the map and the history of editions in the area. More generally, it is acknowledged that with the geographic context of a VGI contribution, its spatial relations with other geographical features are often necessary to assess the quality of the contribution [
18,
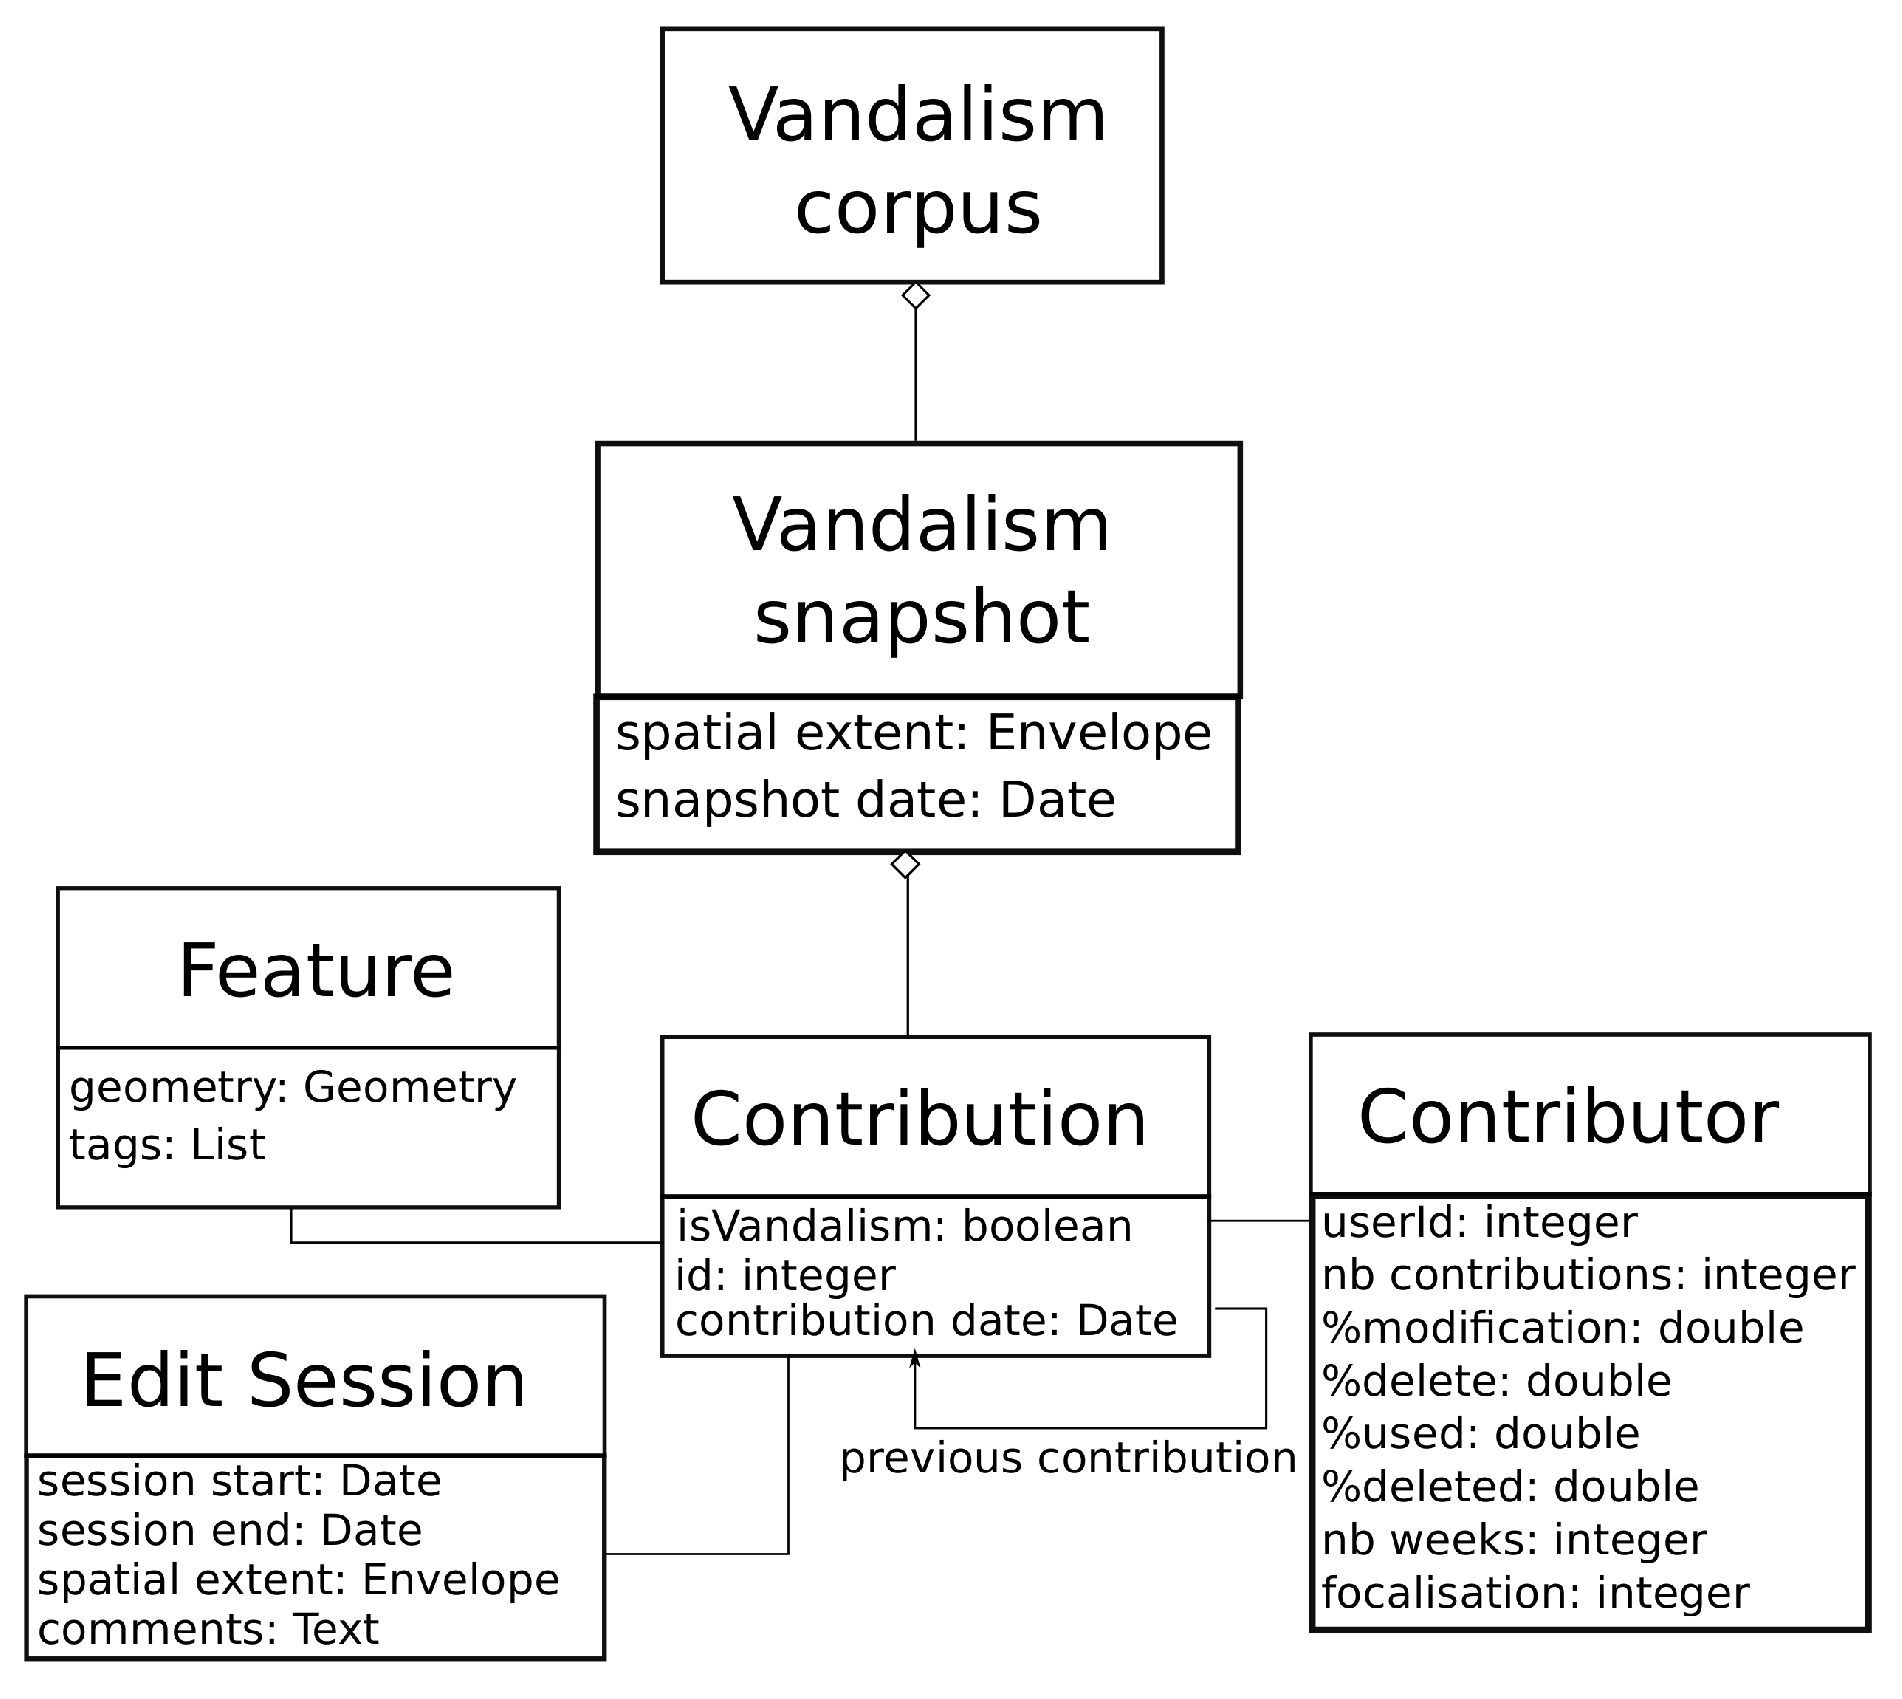
19]. As a consequence, we propose to model our corpus of vandalism as a set of OSM spatiotemporal snapshots that contain one or more vandalised features and many more non-vandalised features (
Figure 2). A spatiotemporal snapshot is an extract of OSM with a limited spatial extent and a snapshot date: the extract is composed of all the map features that lie within the envelope of the snapshot, and we use the last version of these features that is anterior to the snapshot date.
Then, inside each snapshot, a contribution is either vandalised or not. We store many different characteristics of the contribution in the snapshot (geometry, tags, previous versions, information on the contributor, edit session metadata) in order to further compute many descriptors for machine learning models. For instance, the geometry of the feature enables geometry validity measures, while the “number of weeks” of the contributor helps to compute the age of the contributor in OSM [
9].
3.2. Pipeline of the Corpus Building
So far, detecting vandalism in volunteered geographic information using supervised machine learning has been impossible because there has been no corpus of vandalism data. Therefore, the first step consists of designing such a corpus of data.
Besides, a good quality vandalism corpus is crucial to enable the model to properly learn what vandalism is and, therefore, to make it able to detect it.
As mapping data may vary from one geographical region to another and as our research question does not focus on detecting vandalism in a specific region, we have to consider different study areas. Let be the set of study areas, i.e., the set of the different geographic regions in which we will try to detect the possible vandalism.
Let , , be the OSM dataset extracted from the corresponding area. The corpus will contain OSM data that are labelled as vandalism and non-vandalism. As vandalism does not commonly happen in OSM, we assume that the OSM datasets for all areas do not contain a priori vandalized contributions.
Therefore, we manually add fake OSM vandalized data to the corpus. For each , let be the set of vandalized data that are artificially made on x. We denote , the database in which and are stored.
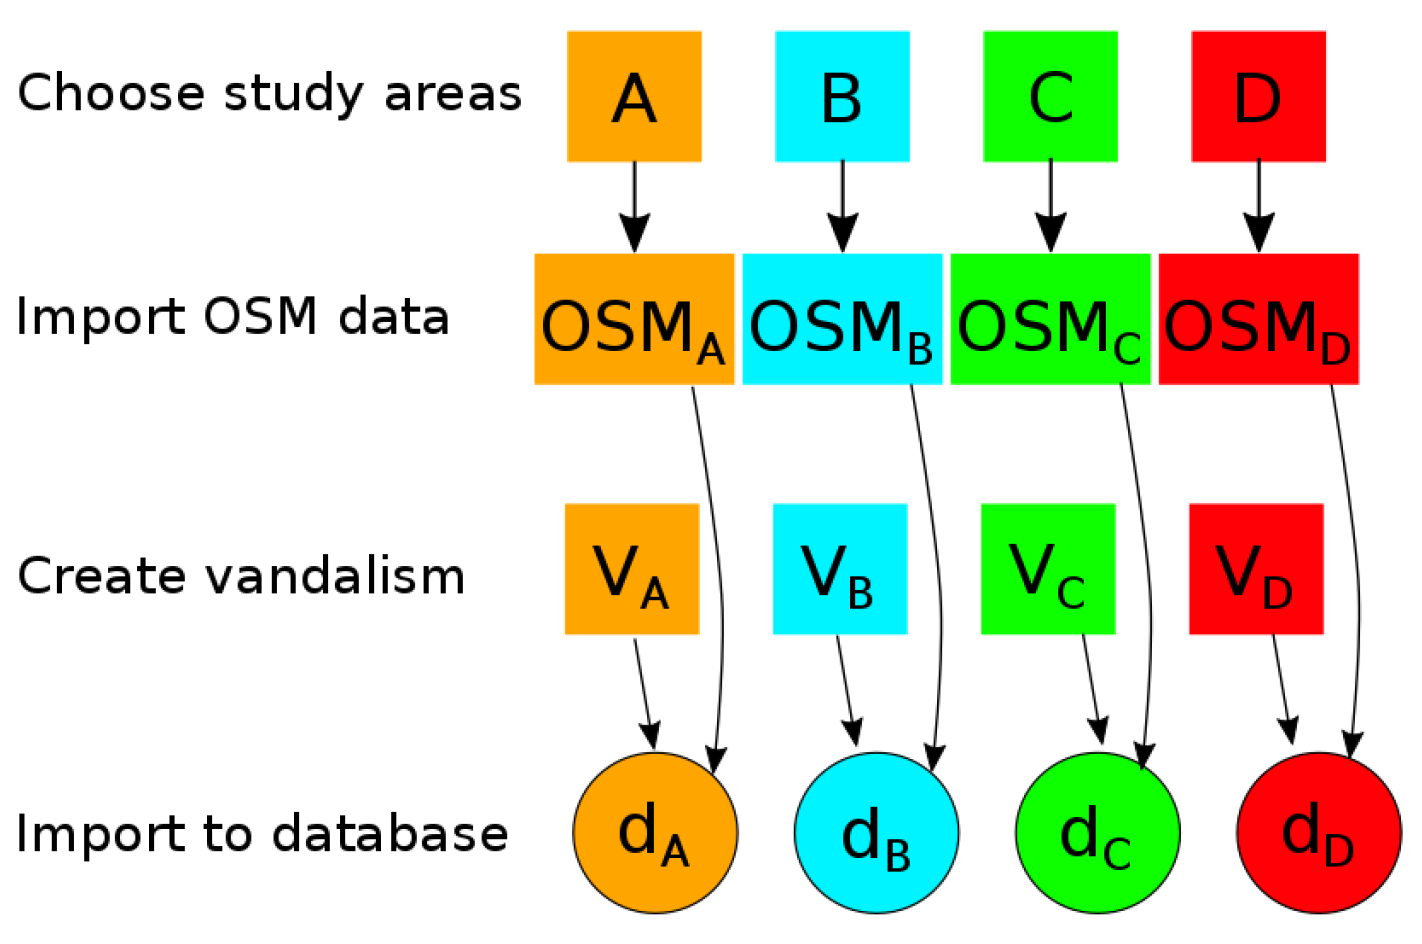
The general pipeline to build the corpus consists of four steps: the choice of the study areas, the import, the addition of vandalism cases we created, and the inclusion into a database. In the OSM context, each study area will correspond to a specific snapshot. This pipeline is illustrated in
Figure 3 for the case where
contains four different regions (
).
3.3. Selected Snapshots
To better capture the diversity of vandalism in OSM in a few snapshots, we decided to create snapshots with fake vandalism, i.e., extract snapshots of OSM without any vandalism in the current versions of the contributions, and then to vandalise the data ourselves, mimicking the vandals identified in the literature.
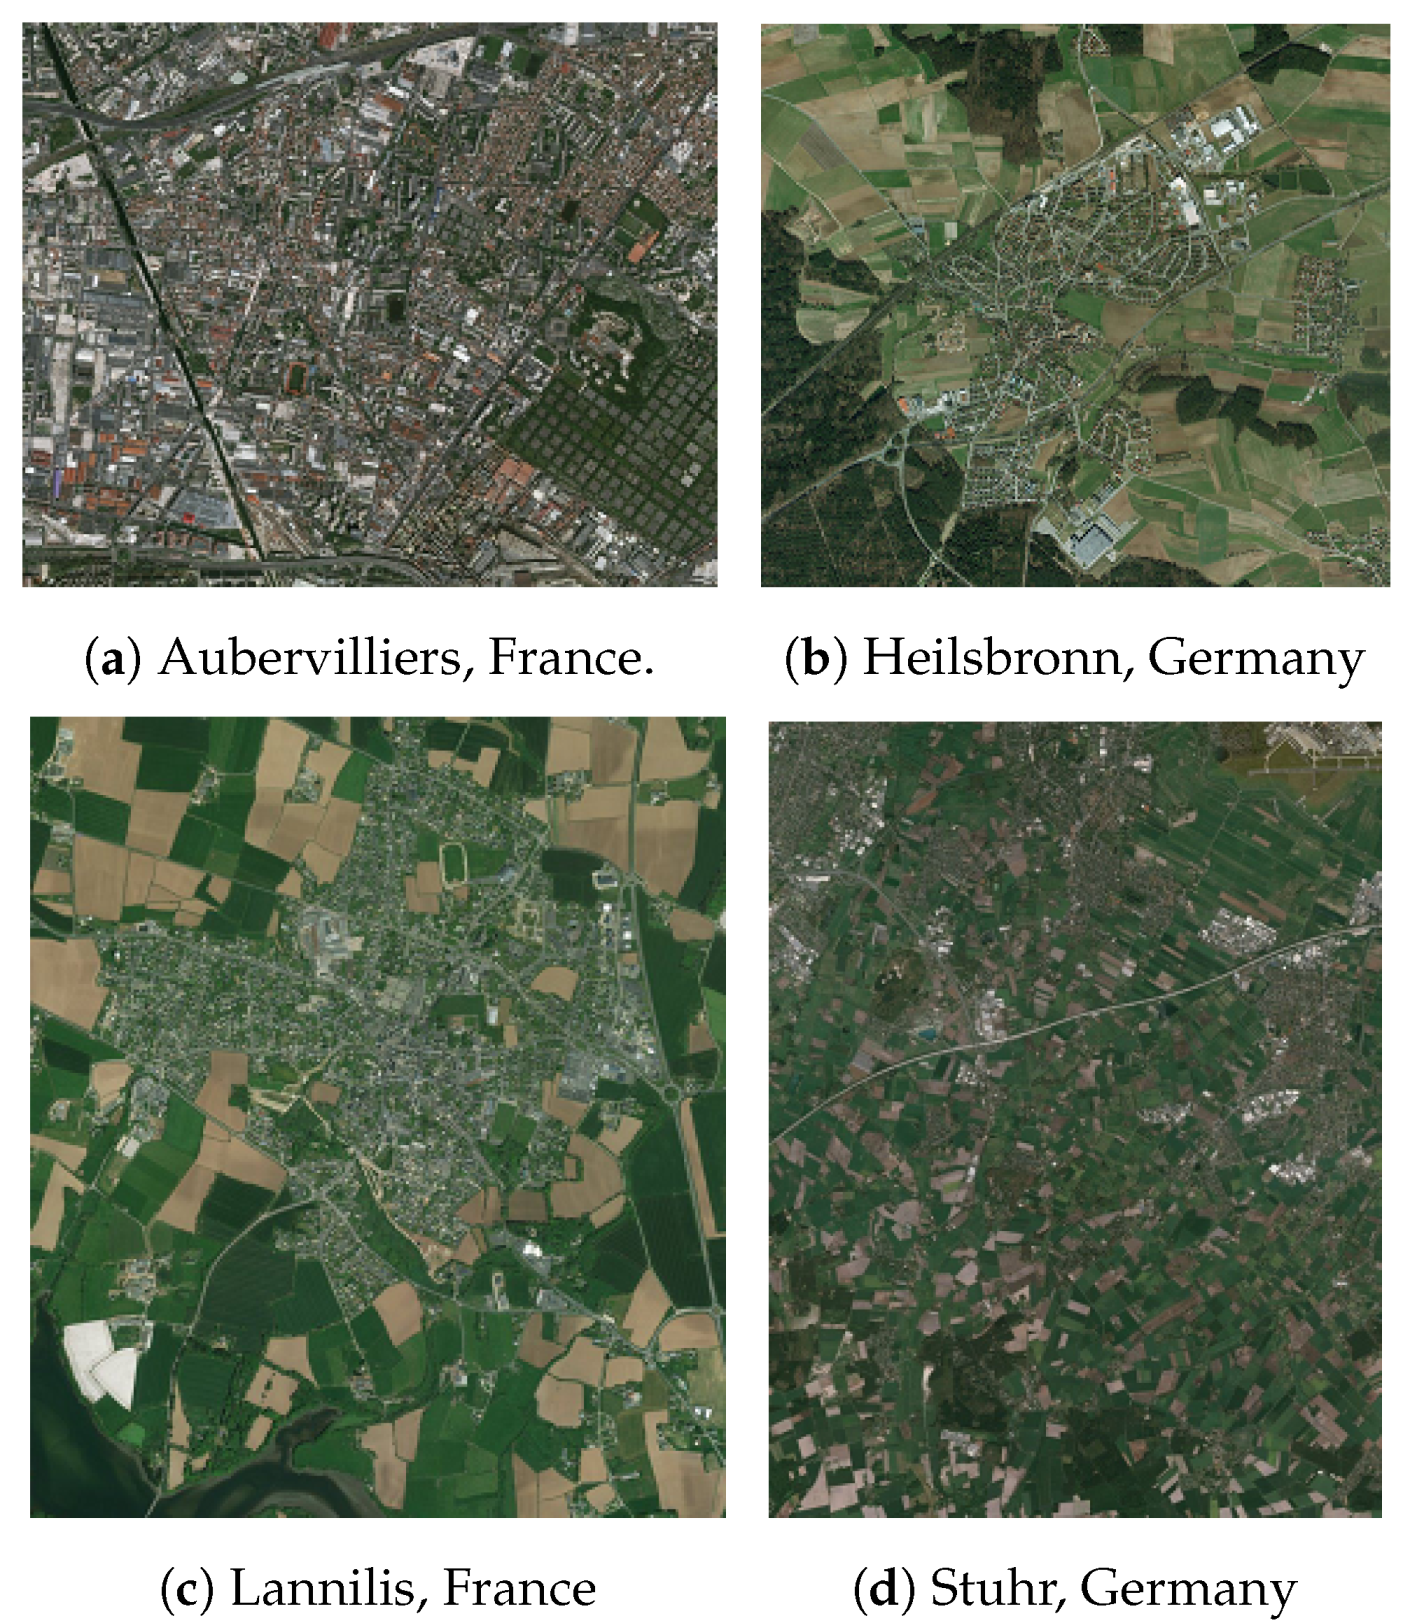
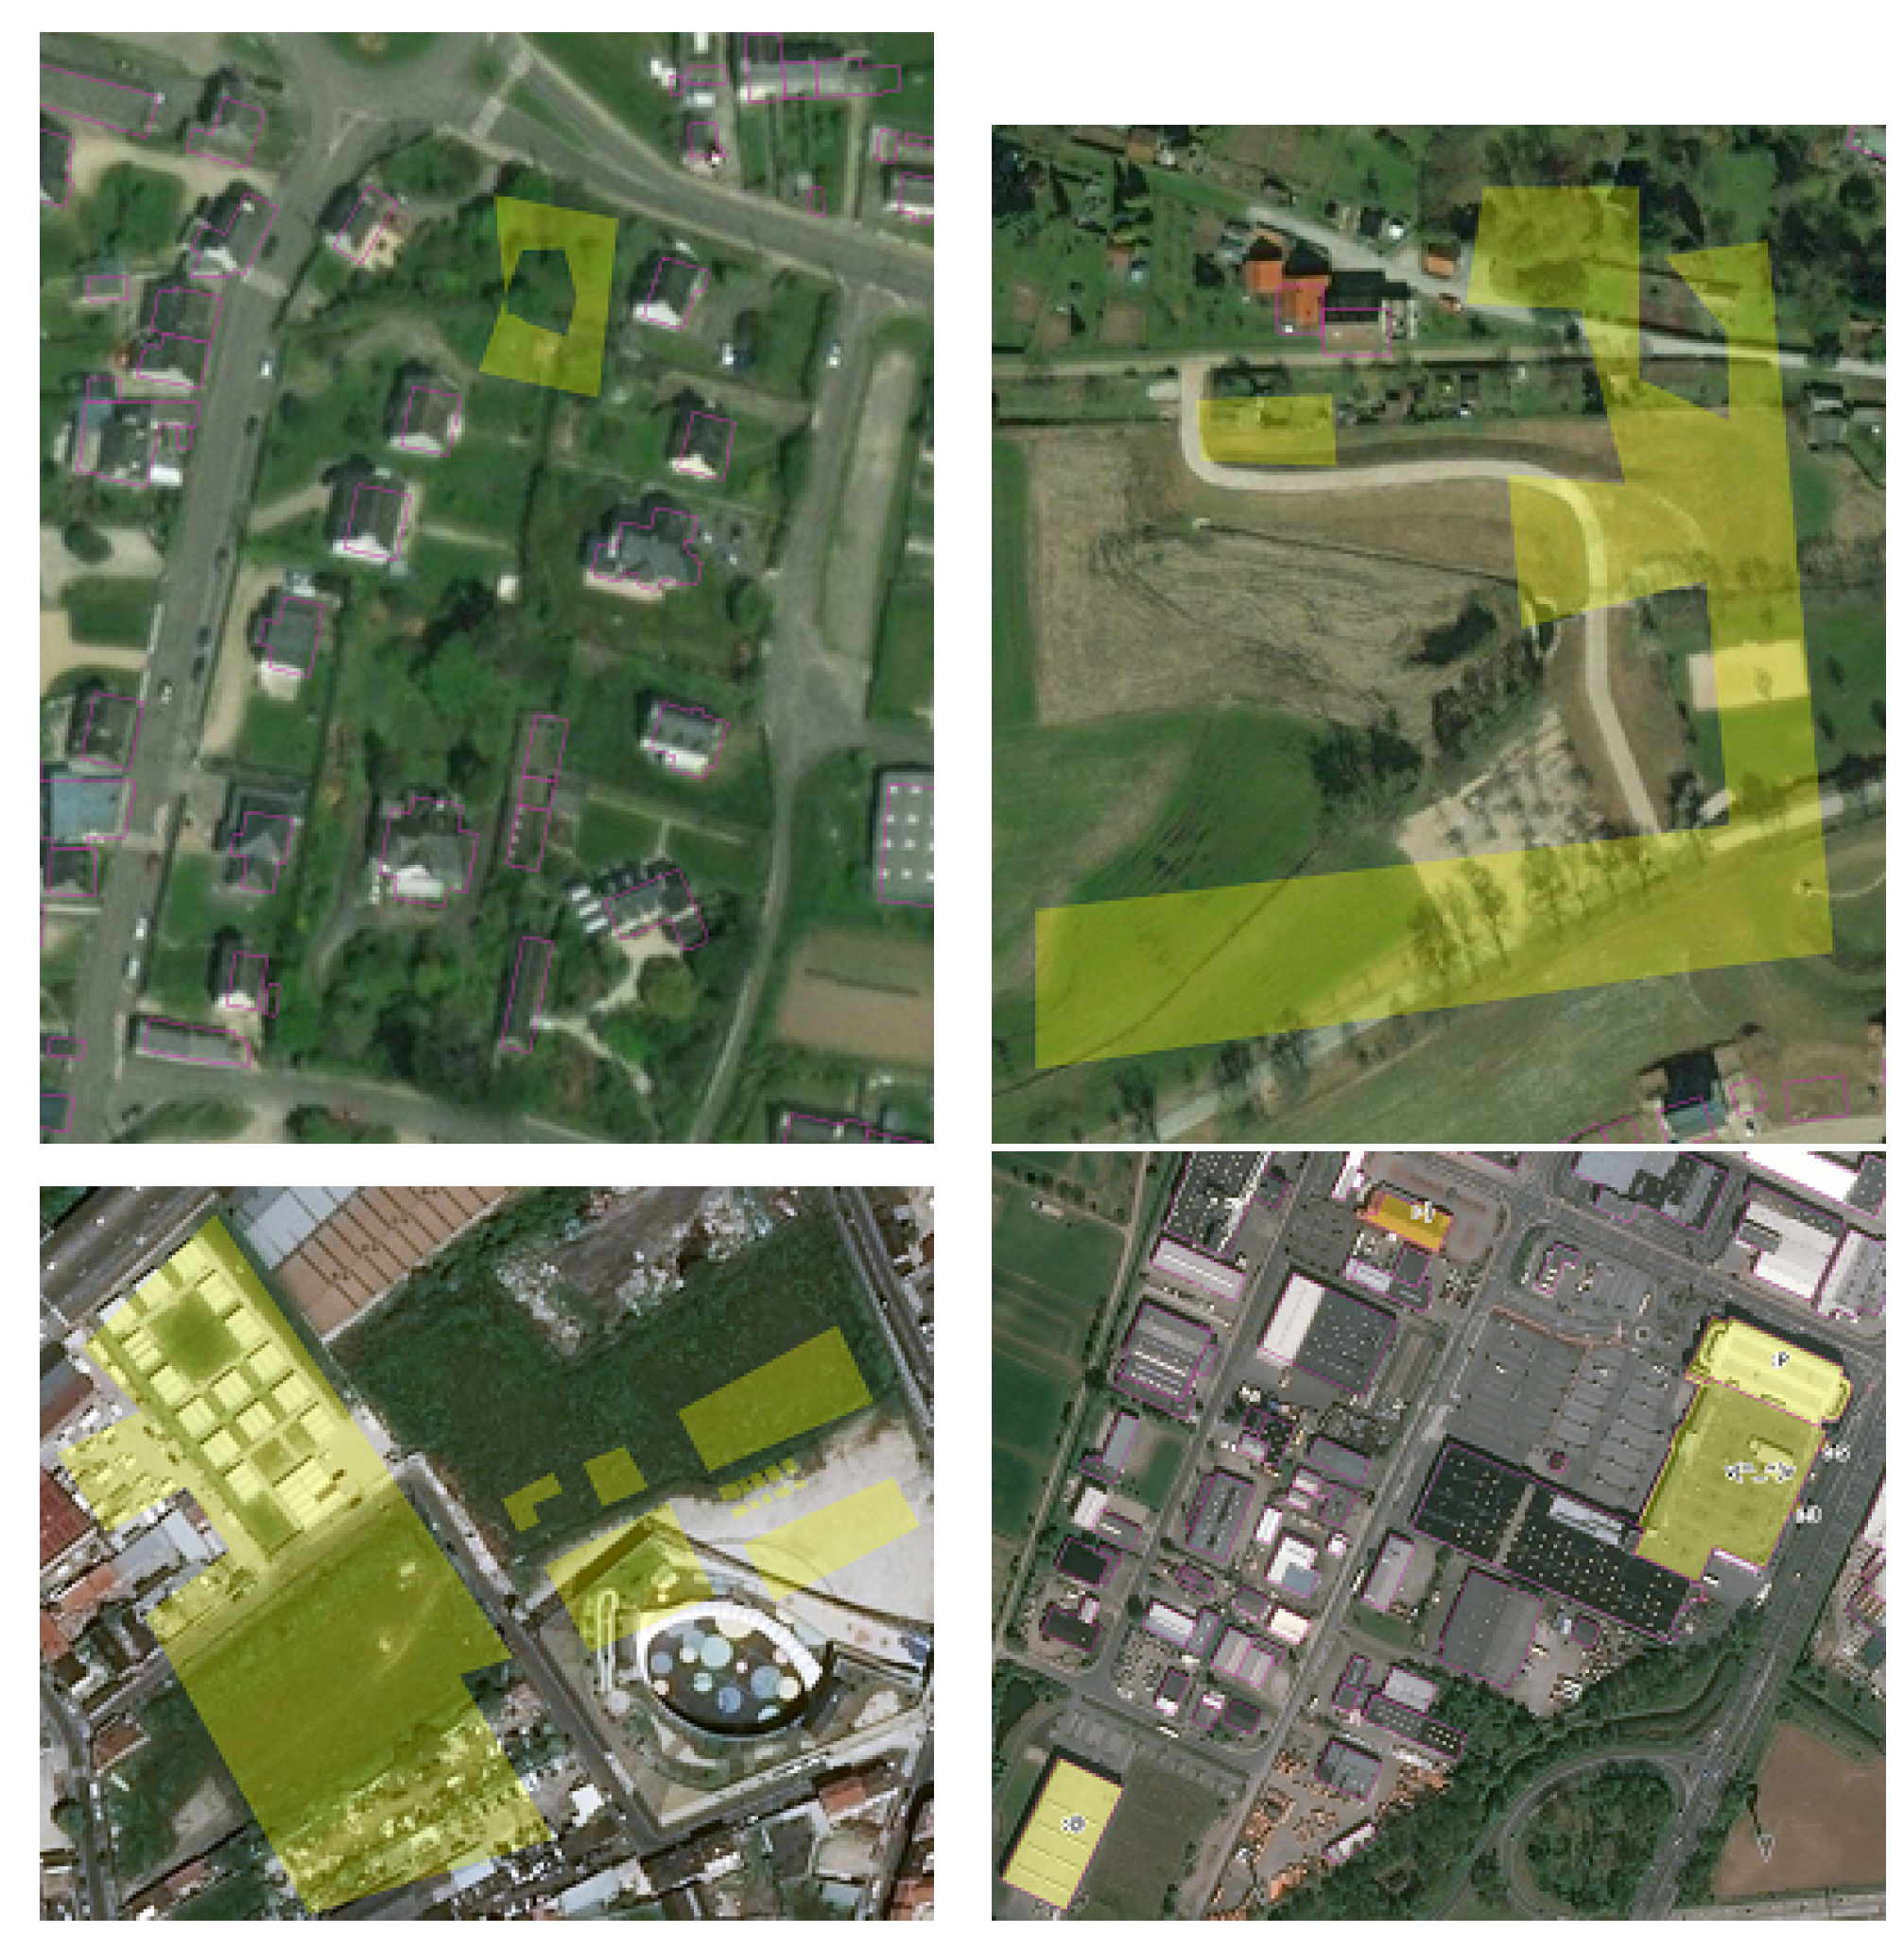
Four snapshots are included in the corpus for the experiments presented in this paper. The spatial extents of these four snapshots are (
A) Aubervilliers, (
B) Stuhr, (
C) Lannilis, and (
D) Heilsbronn, which are located in France (
A and
C areas) or Germany (
B and
D areas).
Figure 4 depicts the aerial view of each area. These four snapshots were selected because they cover urban and rural landscapes, in two different countries where buildings were captured differently. We also made sure that all four snapshots mainly contained high-quality data in terms of spatial accuracy and completeness. Finally, with visual inspection, we checked that there was no vandalized building in these four snapshots.
First, , , are instantiated by downloading OSM data from these regions as historical files from Geofabrik, a free download server. Then, these files are imported into different PostGIS databases , , thanks to a custom Python script based on the Osmium library. The snapshot date for all four snapshots is 14 February 2018.
3.4. Vandalizing the Dataset
As most OSM contributors rely on a Bing aerial imagery layer to trace OSM elements, we wanted to mimic this operating mode to produce artificial vandalism. To do this, we used QGIS to display a Bing aerial map base and the OSM vector data layer so that we could see what objects were already mapped in OSM.
The production of artificial vandalism (i.e., instantiating
,
) consisted of creating new buildings with the
isVandalismfield from
Figure 2 set to true or by modifying existing buildings of the OSM building layer (only buildings were vandalised in these snapshots).
According to the typology of carto-vandalism proposed by [
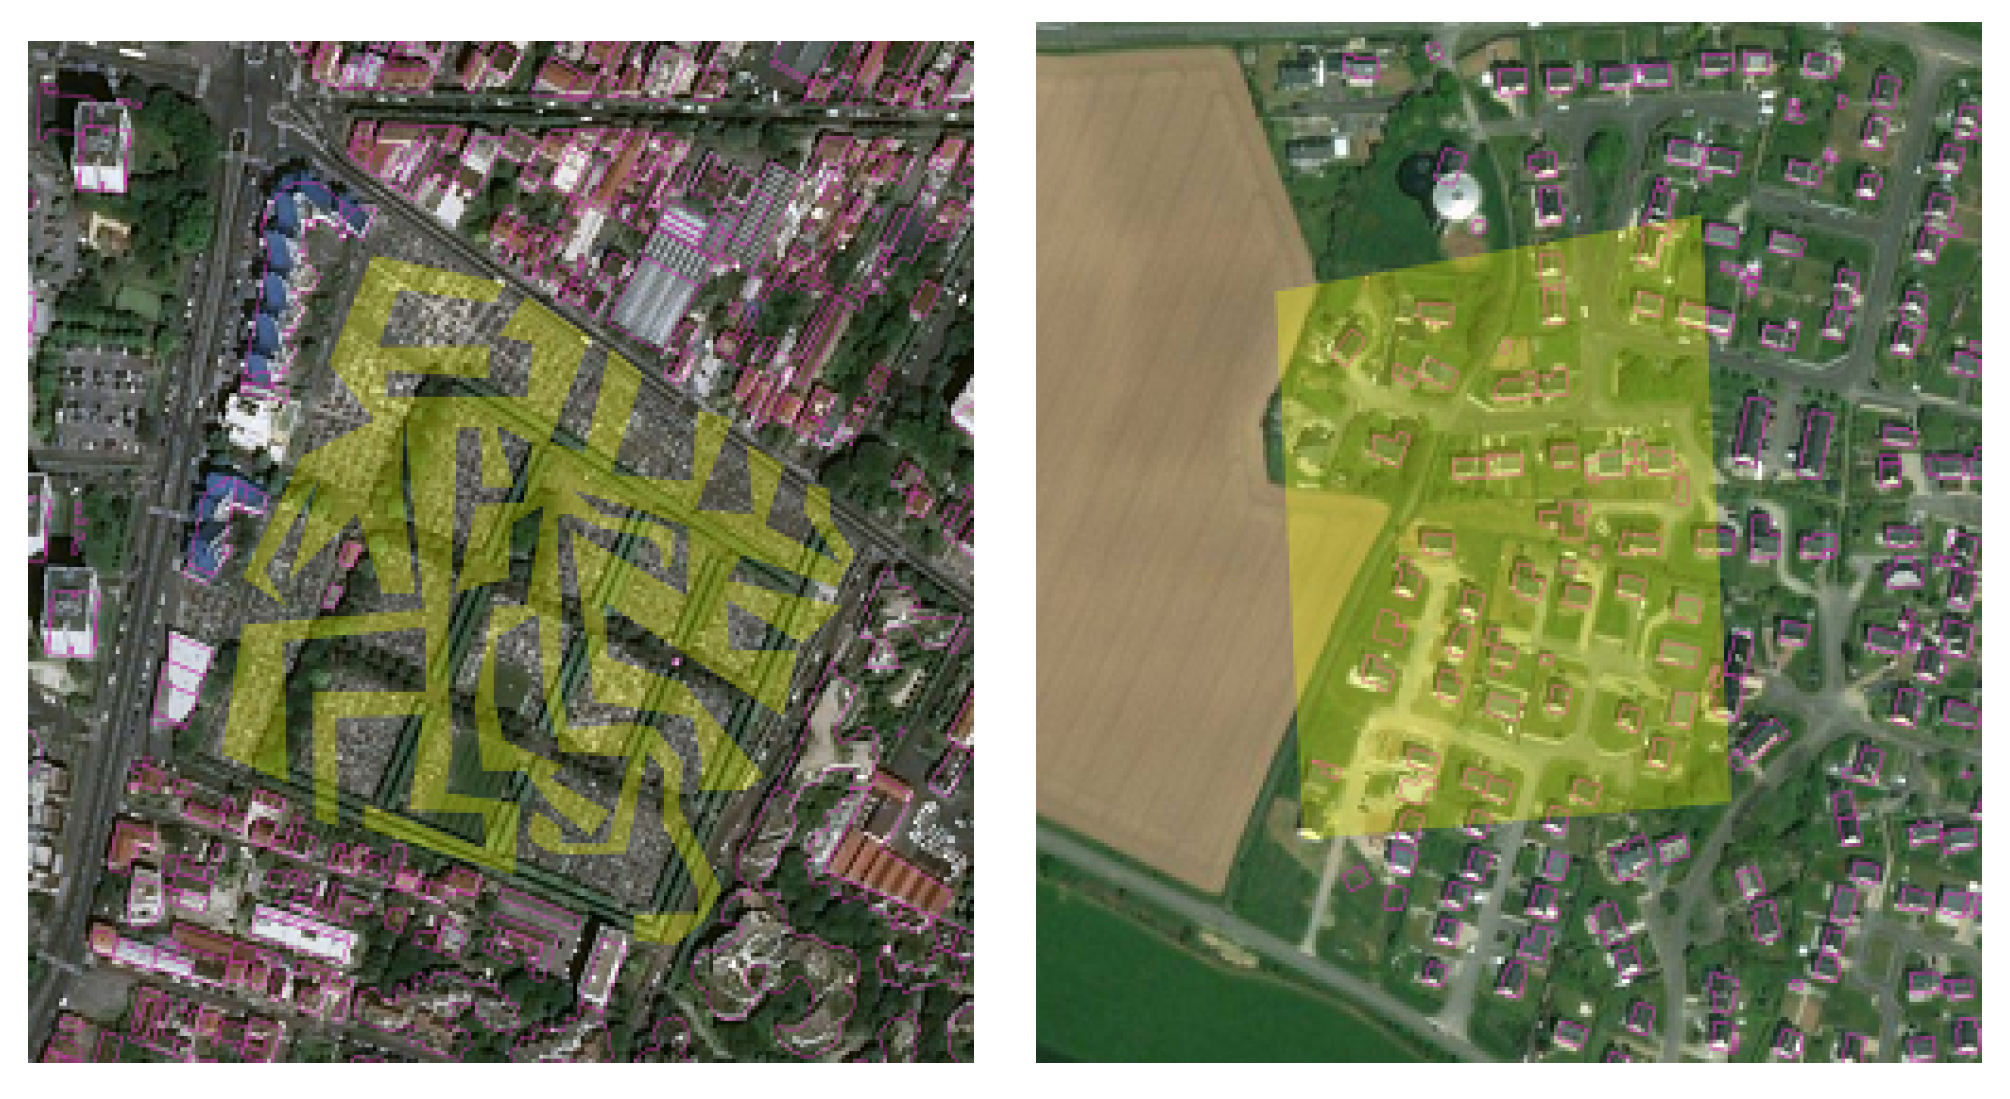
4], we mainly perpetrated play, fantasy, artistic, and industrial carto-vandalism in each study area. In the constructed dataset, play vandalism is represented by large buildings, which may overlap existing OSM buildings.
Fantasy vandalism is represented by fictional buildings that are mapped in blank spaces. These features look like real buildings, except they do not exist in reality. Artistic vandalism corresponds to weirdly shaped buildings. These buildings follow the same principles as the famous graffiti vandalism case [
14].
Industrial vandalism corresponds to existing commercial or industrial buildings whose tag “name” value is changed into special character values like “…” or smileys like “:)”. It mimics how rivals or angry customers have vandalized commercial or industrial OSM features in the past.
The study of past vandalism cases showed the contribution patterns, and the behaviour of the contributor in the OSM platform was key to identify these cases [
5,
6,
9], so we included some contributor information in our corpus and decided to add fake users as contributors of the fake vandalism. The contributors can be characterised by their age in the project [
9,
20], their number of past contributions [
14,
21], or by their interactions with other OSM users [
22,
23]. These measures can be computed for existing contributors, but for fake contributors, the ones based on the analysis of the interactions with the other users are very complex to simulate. Therefore, rather than generating fake graphs of past interactions for the fake users, we created fake profiles of measures, e.g., the ratio of past contributions that were deleted by other users. These profiles derive from an analysis of the measures for real OSM users [
23]. As past studies on vandalism show that vandals rarely limit themselves to one vandalized feature [
9], most of our fake vandals were associated with several of our vandalized features. Some fake contributors only contributed vandalism, so they should be easier to automatically identify, and others were given a number of contributions higher than the number of vandalized contributions they were associated with; the contributions associated with these last fake contributors should be harder to automatically identify as vandalism.
Figure 5 depicts some examples of fake vandalized buildings.
Table 1 sums up the count of OSM buildings and vandalized ones. For each study area, the introduced vandalized elements always represent a small portion against the amount of buildings
,
(less than 1%). This is a way of being realistic in making artificial vandalized buildings, as vandalism does not commonly happen everywhere on OSM data while providing enough examples to train a machine learning model.
4. Methodology for the Use of Machine Learning for Vandalism Detection
4.1. Main Principles
The main idea of this paper is to consider that vandalism can be detected using a classification method, such as random forest, that obtained good results in the case of Wikipedia vandalism.
As we created a corpus containing vandalisms in four regions, we considered that we would learn three models from two of them ( and ): a model in each region and a model for their union. We tested these models on the four different areas in order to check: (i) if the model can detect vandalism in its input region; (ii) the ability of the model to be transferable to any region of the map. The third model—i.e., the model built on the union of the vandalized datasets and —allows us to study the contribution of variety in the dataset to OSM vandalism detection.
The methodology we propose is divided into three steps. The first step is to prepare the different datasets; then, the second step is the training of the classifiers; the third step is the evaluation of the trained classifiers in different scenarios corresponding to our different questions.
4.2. Building a Learning Dataset
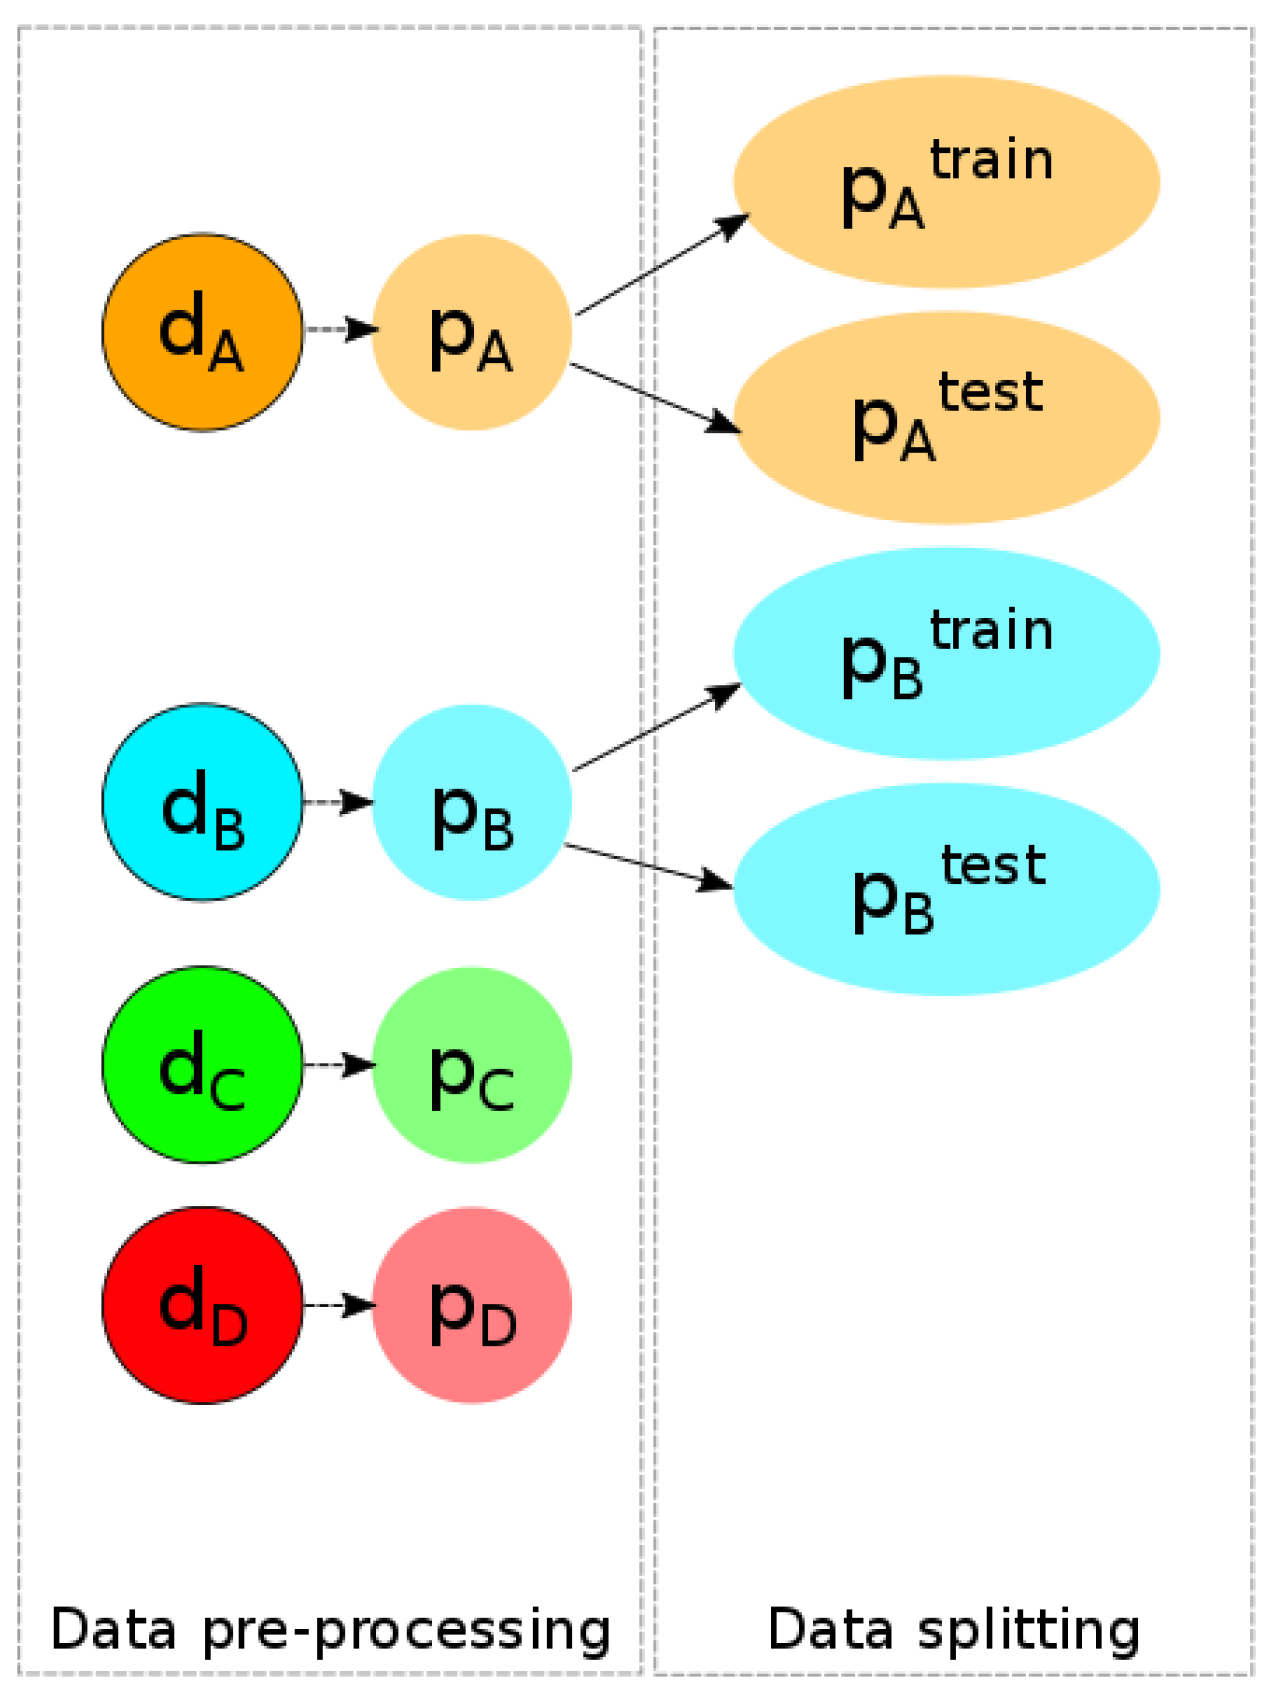
Data pre-processing is an important step in the experimental protocol because it consists of converting the data into another representation that will be given as the input to the learning algorithm. This new representation is the way the algorithm will see the data.
As the configuration of machine learning algorithms may vary from one another, the data pre-processing step should also be adapted to the chosen algorithm. For instance, random forest takes as input a set of features that characterize the data, while a convolutional neural network performs better on a set of images. Therefore, the data preparation step has to be adapted to the chosen machine learning. In our case, this is presented in
Section 3.
Once the dataset that will be used for the machine learning is built, we denote
as the processed dataset from
(
Figure 6).
4.3. Classifier Training
We consider as a set of four different regions . As we investigate the ability of the model to detect vandalism in different places, three models are trained on different datasets: the dataset, the dataset, and a dataset grouping the and datasets. Using those sets allows the evaluation of the possibility to answer our different questions related to the ability of our approach to detect vandalism in the area over which the data are learned and also to generalize the detection to different areas.
The processed data are split into training and testing datasets as:
where
is the training set from area
x and
the testing set. The testing set should contain data that the classifier did not encounter during the training phase; therefore:
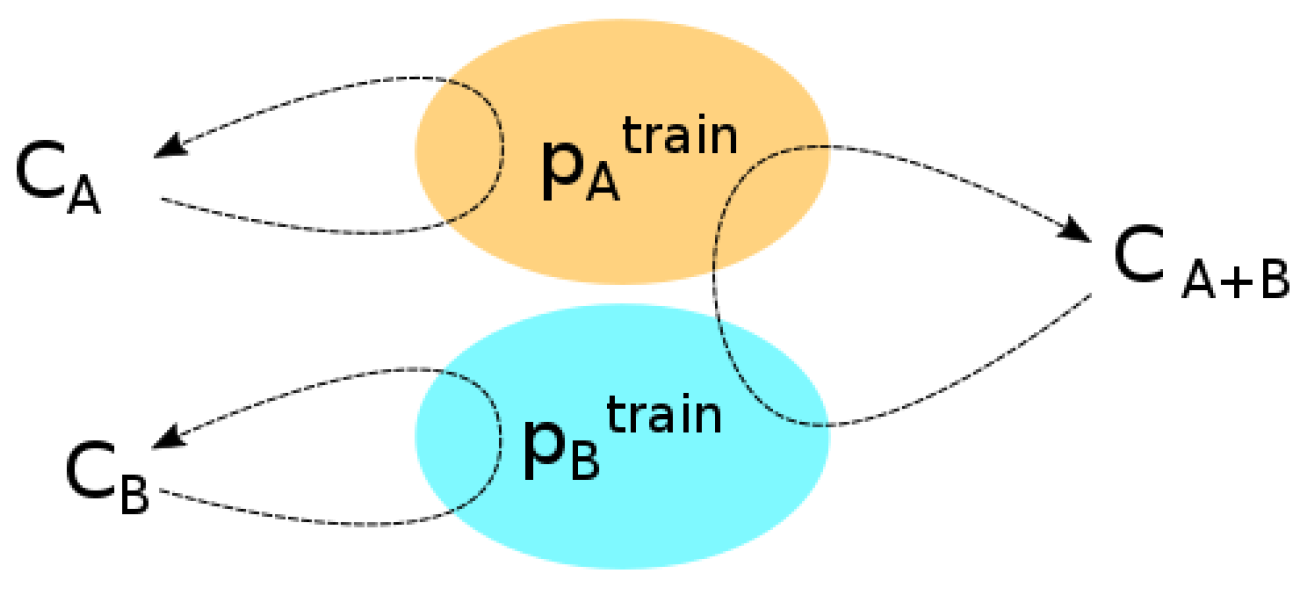
Let
be a classifier trained on
. We build three classifiers
,
, and
, where
is a classifier that is trained on Areas A and B (
Figure 7).
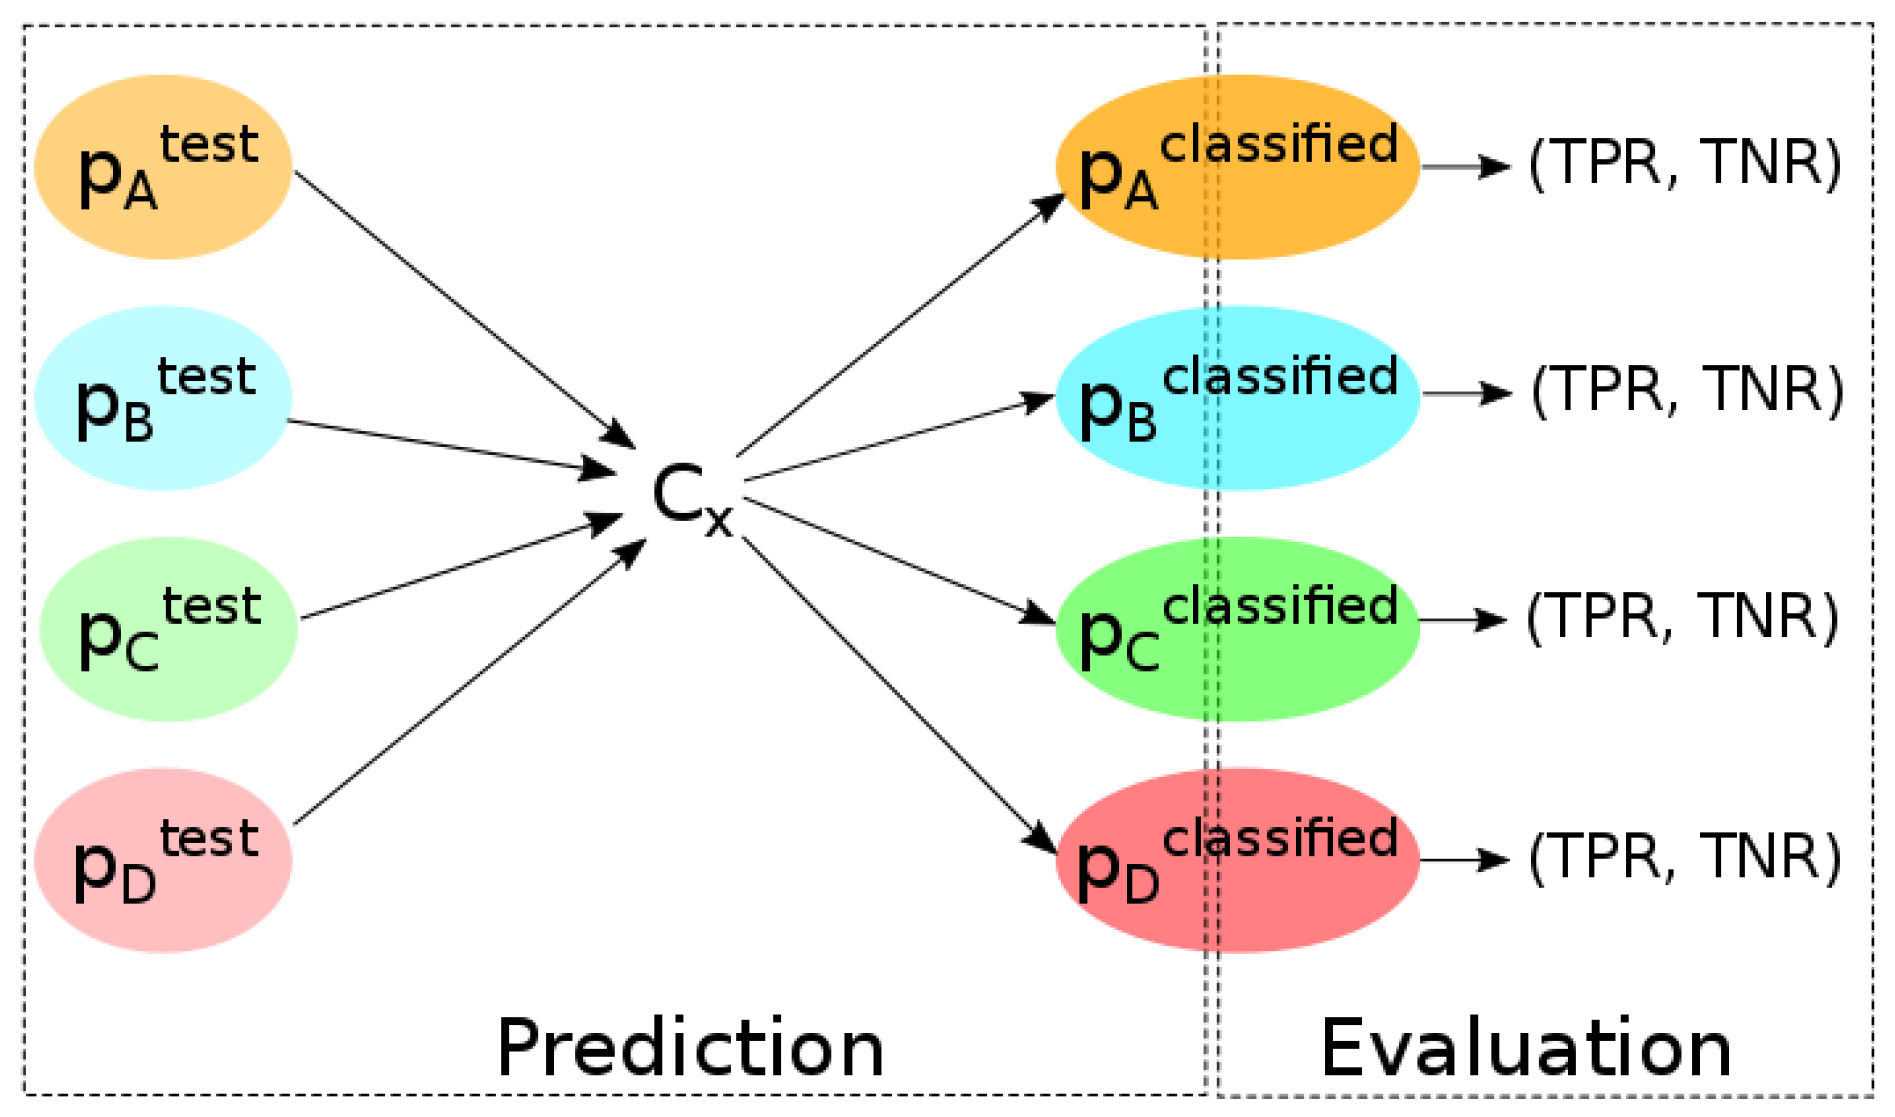
4.4. Scenarios’ Evaluation
Figure 8 illustrates how the different scenarios will be tested on the different datasets we used. The scenarios are defined in accordance with our research questions.
First, we want to investigate the ability of the classifiers to detect vandalism in the same area as the one used during the training phase.
Second, in order to evaluate the domain adaption ability of the classifiers, we observe the results of their predictions in different areas from the one used during training.
Finally, the comparison between the predictions of the classifiers leads to exploring if a classifier is more “domain adaptable” when it is trained in different geographic regions.
In order to evaluate and compare the different scenarios and case studies, several metrics can be considered.
4.5. Evaluation Metrics
The metrics used to assess the different classifiers are the true positive rate (also known as recall or hit rate) and the true negative rate. These rates are computed at the end of a prediction in order to quantify the performance of a classifier. The True Positive Rate (
TPR) measures the portion of good predictions among the objects that are truly vandalism. The True Negative Rate (
TNR) measures the portion of good predictions of True Positives (TPs)—among truly non-vandalism contributions. A model that performs well in detecting OSM vandalism automatically is expected to have high
TPR and
TNR during the test prediction phase.
where the True Positives (TPs) are vandalized data that are detected by the classifier and false Negatives (FNs) are undetected vandalized data, and
where True Negatives (TNs) are OSM data that are correctly classified as non-vandalism.
5. OSMWatchman: A Random Forest Classifier for Vandalism Detection
The random forest approach works on the object level, that is to say, the algorithm learns directly on building objects described by a set of features.
5.1. Features for Vandalism Detection
The data preparation consists of developing the relevant features that properly differentiate OSM vandalized buildings from regular ones. The work in [
8] highlighted content and context features as important metrics that characterize vandalism well in knowledge bases. Content features focus on the content of the contributed information itself, whereas context features provide metrics on the contribution user, the contribution history, and connections to other contributions of the knowledge base. In the following subsections, content and context features are proposed and described.
5.1.1. Content Features
In the case of OSM data, the content of the contribution can be seen at a geometric level and a semantic level. At a geometric level, some features were already proposed in [
5]. They mainly characterize the size and the shape of OSM buildings. Based on these features, we consider the following geometric features: perimeter, edge shortest length, edge median length, elongation, convexity, compactness. These features are used because most of the artistic vandalism cases are made of contributions with unusual geometries. For instance, the top left building in
Figure 5 has an extremely large perimeter and an extremely low compactness, while the top right building has a very large perimeter and the edge shortest length.
At a semantic level, OSM mapping data have tags, which are key-value pairs that describe the geographic elements. We denote
as a feature that counts the number of tags describing an OSM element, where
T is the set of tags that describe an OSM element. Let
be the set of tag keys of the OSM element and
the set of the corresponding values. Most of the OSM vandalized contributions where an object is created contain a very low number of tags [
9], so this feature should be helpful.
To capture vandalism on OSM tags, we consider a feature that quantifies the maximum rate of special characters in an OSM contribution. This feature is inspired by the character level features proposed in [
8]. Quantifying the rate of special characters is not enough to cover every kind of vandalism that may happen on OSM tags, but it can at least help to spot one specific case of vandalism: for instance, one of the banned users of OSM marked his misdeed with smileys as values for the tag
name [
5]. This character feature is defined as:
where
is the number of special characters in
v and the
function gives the total size of
v.
5.1.2. Context Features
As OSM data are geographic elements, they are spatially related to one another [
18]. Besides, as fictional and artistic vandalism consist of mapping elements over existing ones, it is important to consider topological features that quantify the potential overlaps between different types of geographic data that do not usually happen [
19]. We denote
as the geometry of an OSM building object and
as the set of OSM objects that correspond to natural geographic elements where there should not be any building (water, meadow, forest, etc.). We define two topological features:
As previously mentioned, context features also include quantifying the contributions’ history [
8]. Regarding the history of the object, we consider a feature
that counts the number of unique contributors who worked on the object throughout its different versions, because the way an object has been edited has an impact on its quality [
24].
quantifies the duration in seconds between the current version of the OSM contribution and its previous version. As past research showed that vandalized contributions usually do not last very long [
9], there is also a feature,
contribution_age, that measures the age of the contribution with the duration in seconds between the last version of the OSM contribution and the date of the snapshot.
5.1.3. User Features
The OSM community considers that vandalism detection should focus on changeset features and on user features (
https://wiki.openstreetmap.org/wiki/Vandalism#Detection). In fact, VGI quality is strongly related to the quality of the contributors [
5,
21,
25]. Therefore, detecting vandalism can also be seen as retrieving the contributions of users who are considered somehow as untrustworthy or excluding from investigation the contributions of trustworthy contributions [
8,
26].
Quantifying the contributors’ trustworthiness is a research issue that has been addressed in numerous ways in the literature, by estimating either their reputation [
26,
27,
28], their collaborative behaviour [
29,
30], or their expertise [
20,
31,
32]. According to [
14], vandalism is strongly related to the contributor’s profile, but it can be perpetrated by new users, as well as experienced contributors. Besides, good quality data contributed by inexperienced users should be recognized as their true value to ensure the quality of the work done in crowdsourcing platforms [
33].
Therefore, we take into account the users’ participation behaviour on the platform through different user features:
: total number of a user’s contributions.It is obtained by summing the number of contributions in the changesets made on the study area, which include an edit on at least one OSM building.
: portion of a user’s contributions that are data modifications.
: portion of a user’s contributions that are data suppressions.
: portion of a user’s contributions that are reused by other contributors [
29].
: portion of a user’s contributions that were afterwards modified by other contributors.
: portion of a user’s contributions that were afterwards deleted by other contributors.
: number of weeks during which a contributor edited the OSM database. It corresponds to the age of the user, which was seen as critical regarding Pokemon GO vandalism [
9].
: This feature evaluates the geometry of the area on which a contributor made his/her edits compared to the geometry of the study area. Its value ranges between zero and one. It tends towards zero when the participation area is broader than the study area and to one when the participation area is mainly inside the study area. A vandal is less likely to contribute to a large area.
In order to score the contributors’ trustworthiness, we consider
and
as, respectively, the average and the weighted average of the user features. Ideally, the more trustworthy a contributor is, the higher
and
should be. Assuming that the more a user’s contributions are edited (resp. deleted), the less he/she appears trustworthy, it is noted that
and
take into account
and
.
Table 2 gives the weights that are used for
.
However, as artificial vandalized buildings do not have a context regarding their history and their contributors in OSM, we had to create these pieces of information. Therefore, all vandalized building have a version numbered at 1. Regarding the user features, fake user profiles were built by giving arbitrary values to these features, at first. Then, after analysing the distribution of real user features, we could assign low values to the fake profiles’ user features in order to create a vandal profile. This way, poor trust scores would be associated with vandalized buildings. However, to simulate the fact that a trustworthy contributor might vandalize OSM [
34], we gave higher scores to some of the fake users.
Table 3 summarizes the selected features used to describe the different OSM snapshot data.
5.2. Data Classification
Random forest is a supervised learning algorithm that operates by randomly building multiple decision trees that are trained on different subsets of the input features given as the input to the algorithm. The final data predictions are made by counting the predictions made by each decision tree [
35].
In these experiments, we built random forest classifiers in R using the Caret package. Each classifier was trained with a 10 cross-fold validation repeated three times. Eighty percent of
,
, and
were used to train the classifiers, while the remaining 20% was used for the test phase.
Table 4 gives the prediction results for the three classifiers.
5.3. Results
The classifier trained on the Aubervilliers building performs very well in predicting vandalism in Aubervilliers. However, it performs poorly in Stuhr. Furthermore, it even fails at detecting any vandalized building in Lannilis (same country, but rural) and Heilsbronn (different country and rural). Likewise, the classifier trained on Stuhr succeeds at detecting vandalism in the same area. However, it performs poorly in the other study areas. The same observations are made for the classifier trained on Aubervilliers and Stuhr.
As none of these classifiers perform better than the others for predicting vandalism in an unknown area, a new classifier
was trained on Aubervilliers and Stuhr, but without taking into account any user features.
Table 5 gives the prediction results for
. Even if this classifier still succeeds at detecting vandalism in Aubervilliers and Stuhr (the TPR and TNR values are still high), we notice that the TPR is slightly lower than the TPR values found with
in the same areas, meaning that a few vandalized buildings were no longer detected. Besides, predictions in Lannilis and Heilsbronn with
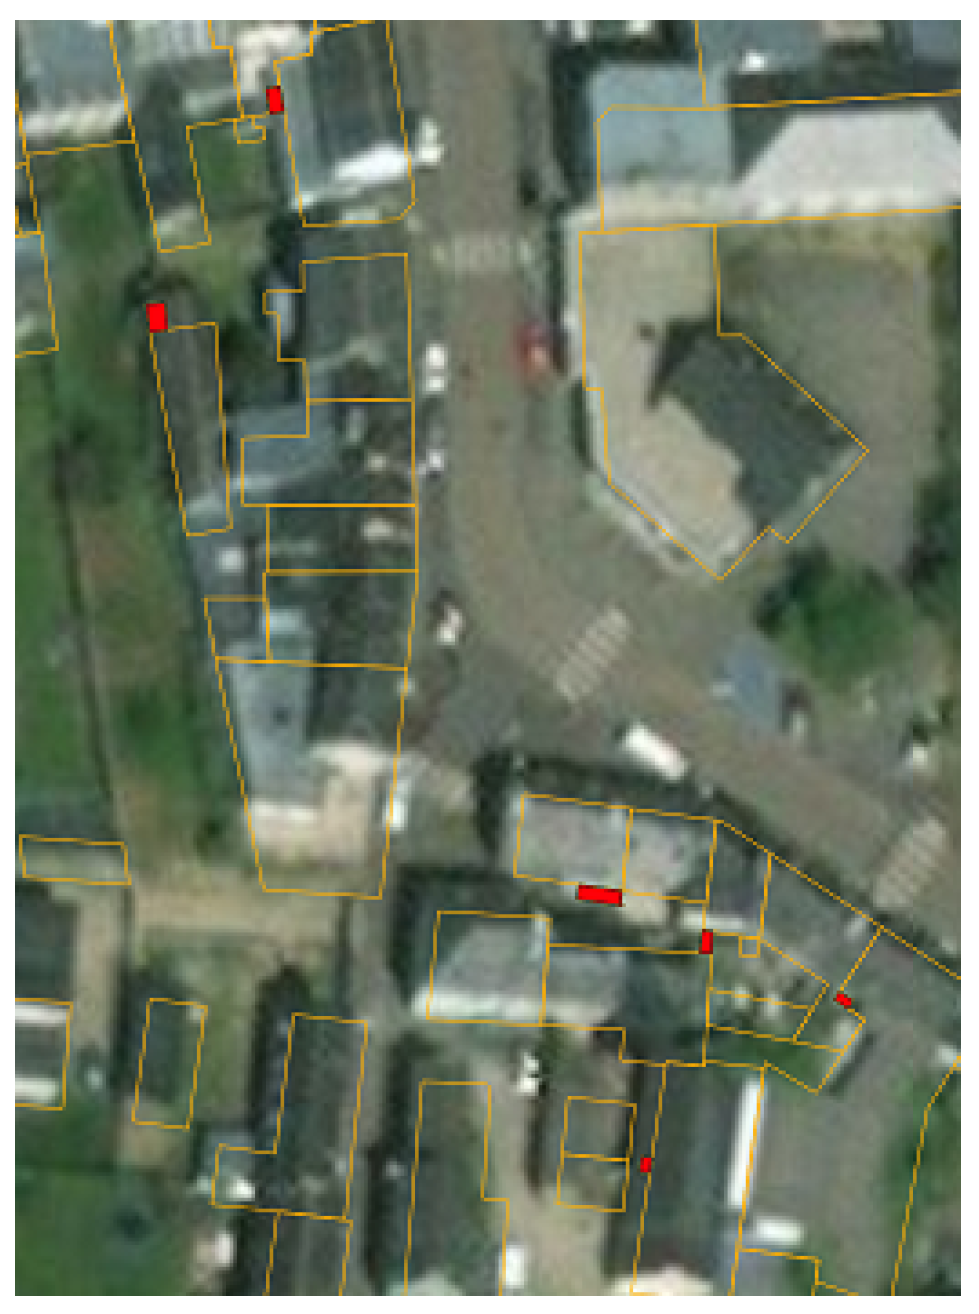
give slightly lower TNR values, which means that some non-vandalized buildings were detected. Indeed, by looking at the false positives detected by
, we notice that they correspond to tiny mapping elements that are actually pieces of buildings (
Figure 9). These elements are likely to be data from the French cadaster, which were imported into OSM by a trustful contributor. Therefore, it would explain why these data were not classified as vandalism by
, contrary to
. Therefore, user features are relevant to detect vandalism, in particular by reducing the number of false positives.
6. Discussion
This section discusses the advantages and drawbacks of OSMWatchman (
Supplementary Materials). The high performance of random forest classifiers to detect vandalism in the same areas as the ones used for the training shows that it is possible to detect OSM vandalism automatically in familiar areas. A trained random forest ranksthe features that are the most important to predict the data, which can help to determine the features that describe OSM vandalism data best.
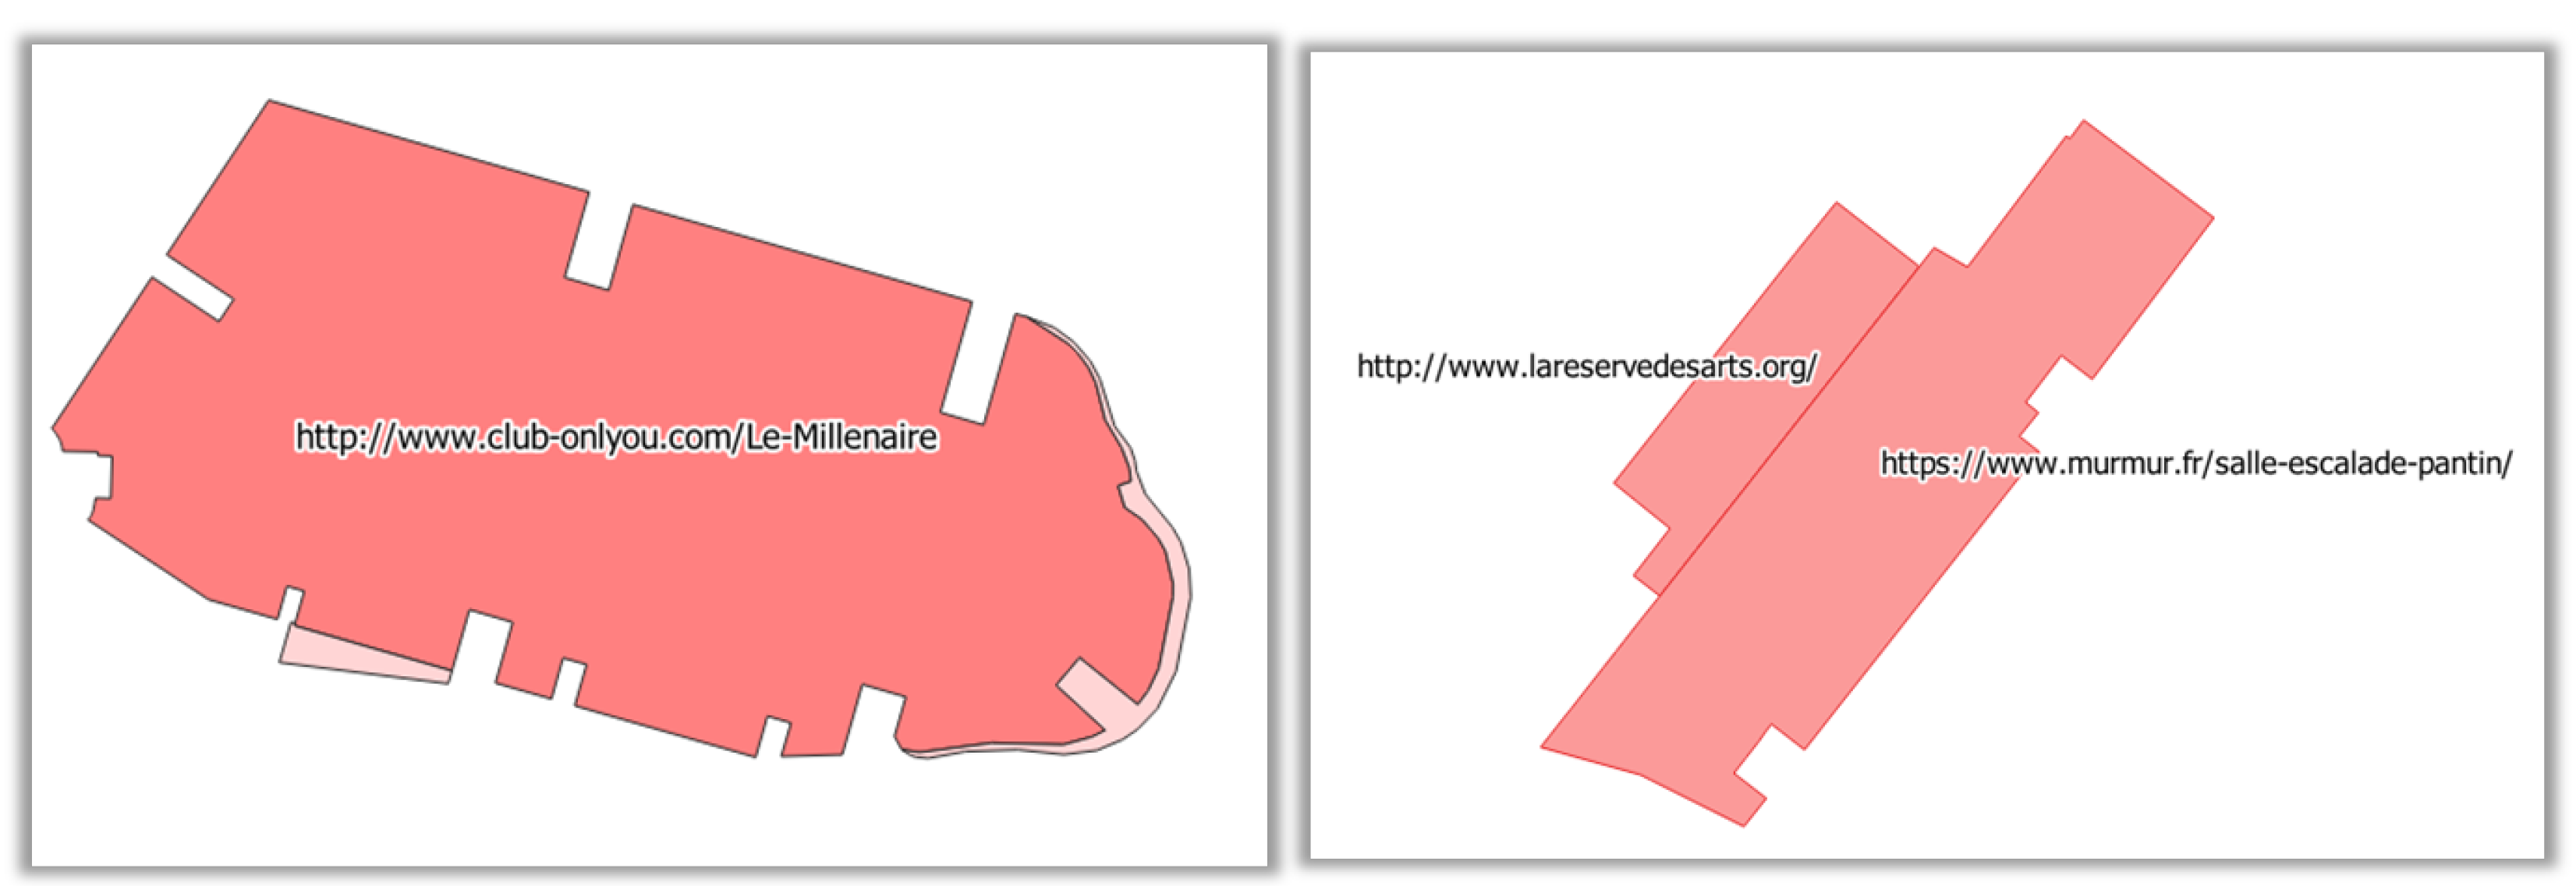
However, developing the algorithm for the input features can be costly, and the proposed features have clear limitations. To illustrate these limitations, we applied the model trained on Aubervilliers to detect vandalized buildings in the neighbouring city of Pantin, which has a similar geography, but no fake vandalism. Some buildings are wrongly classified as vandalism, due to the
feature that counts the number of special characters in the tags. In these cases (
Figure 10), a tag contains the URL of a website related to the buildings, and this URL contains multiple instances of special characters; but, these buildings are clearly not vandalized. This shows that the syntactical feature built on tags should be more sophisticated to tolerate URLs as tags.
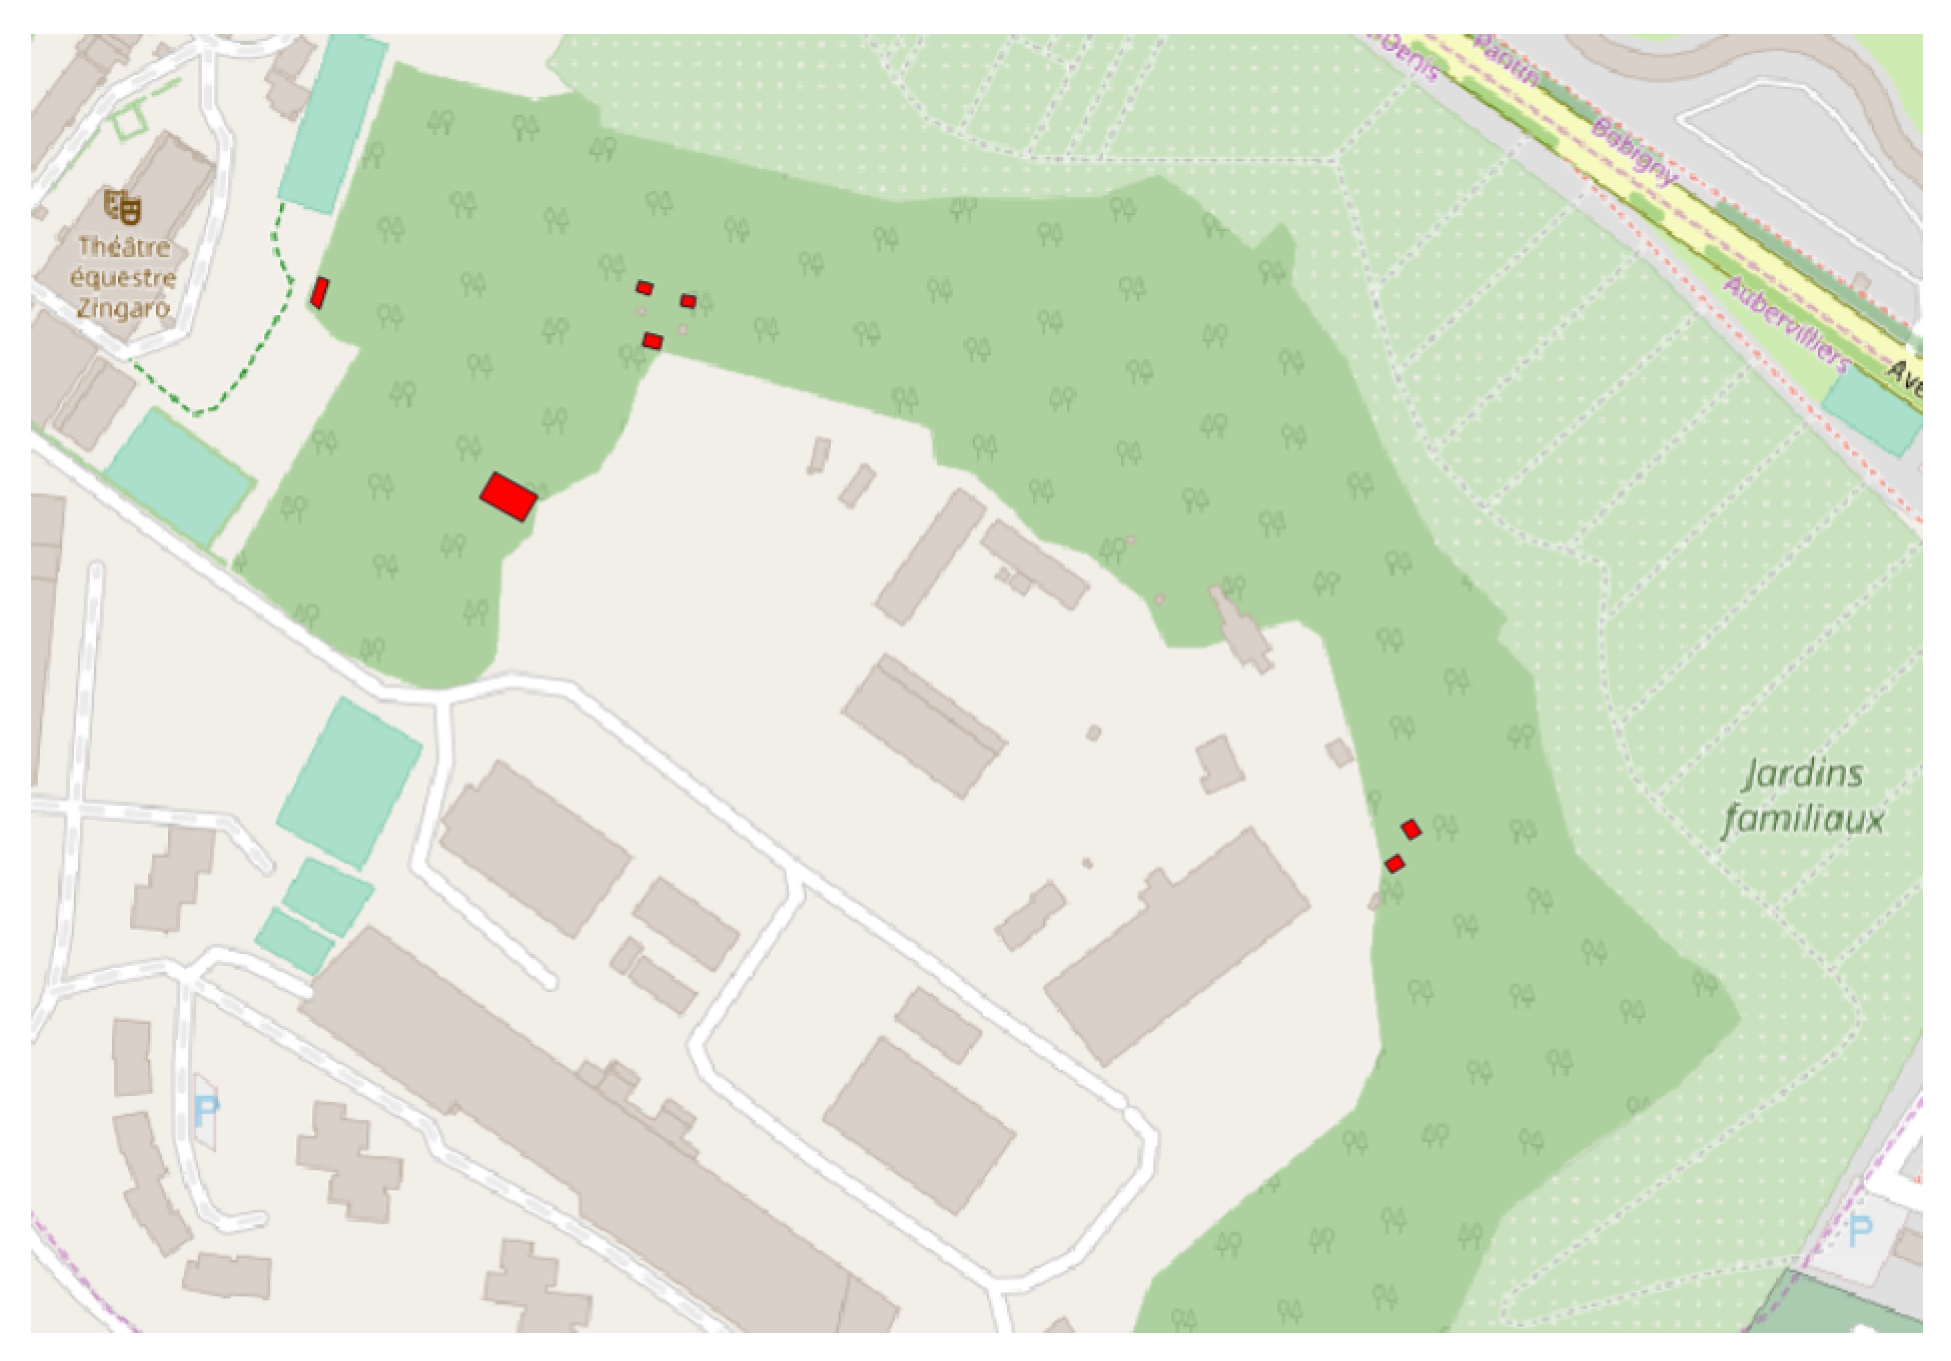
In the same areas, several tiny buildings are wrongly classified as vandalism because they are contained in a forest polygon (
Figure 11). In fact, this place contains several shared urban gardens, and these small buildings are cabins that are actually located under the trees. This example shows that the
and
features should be refined, as in some cases, it is not impossible to have small buildings located inside small wooded areas.
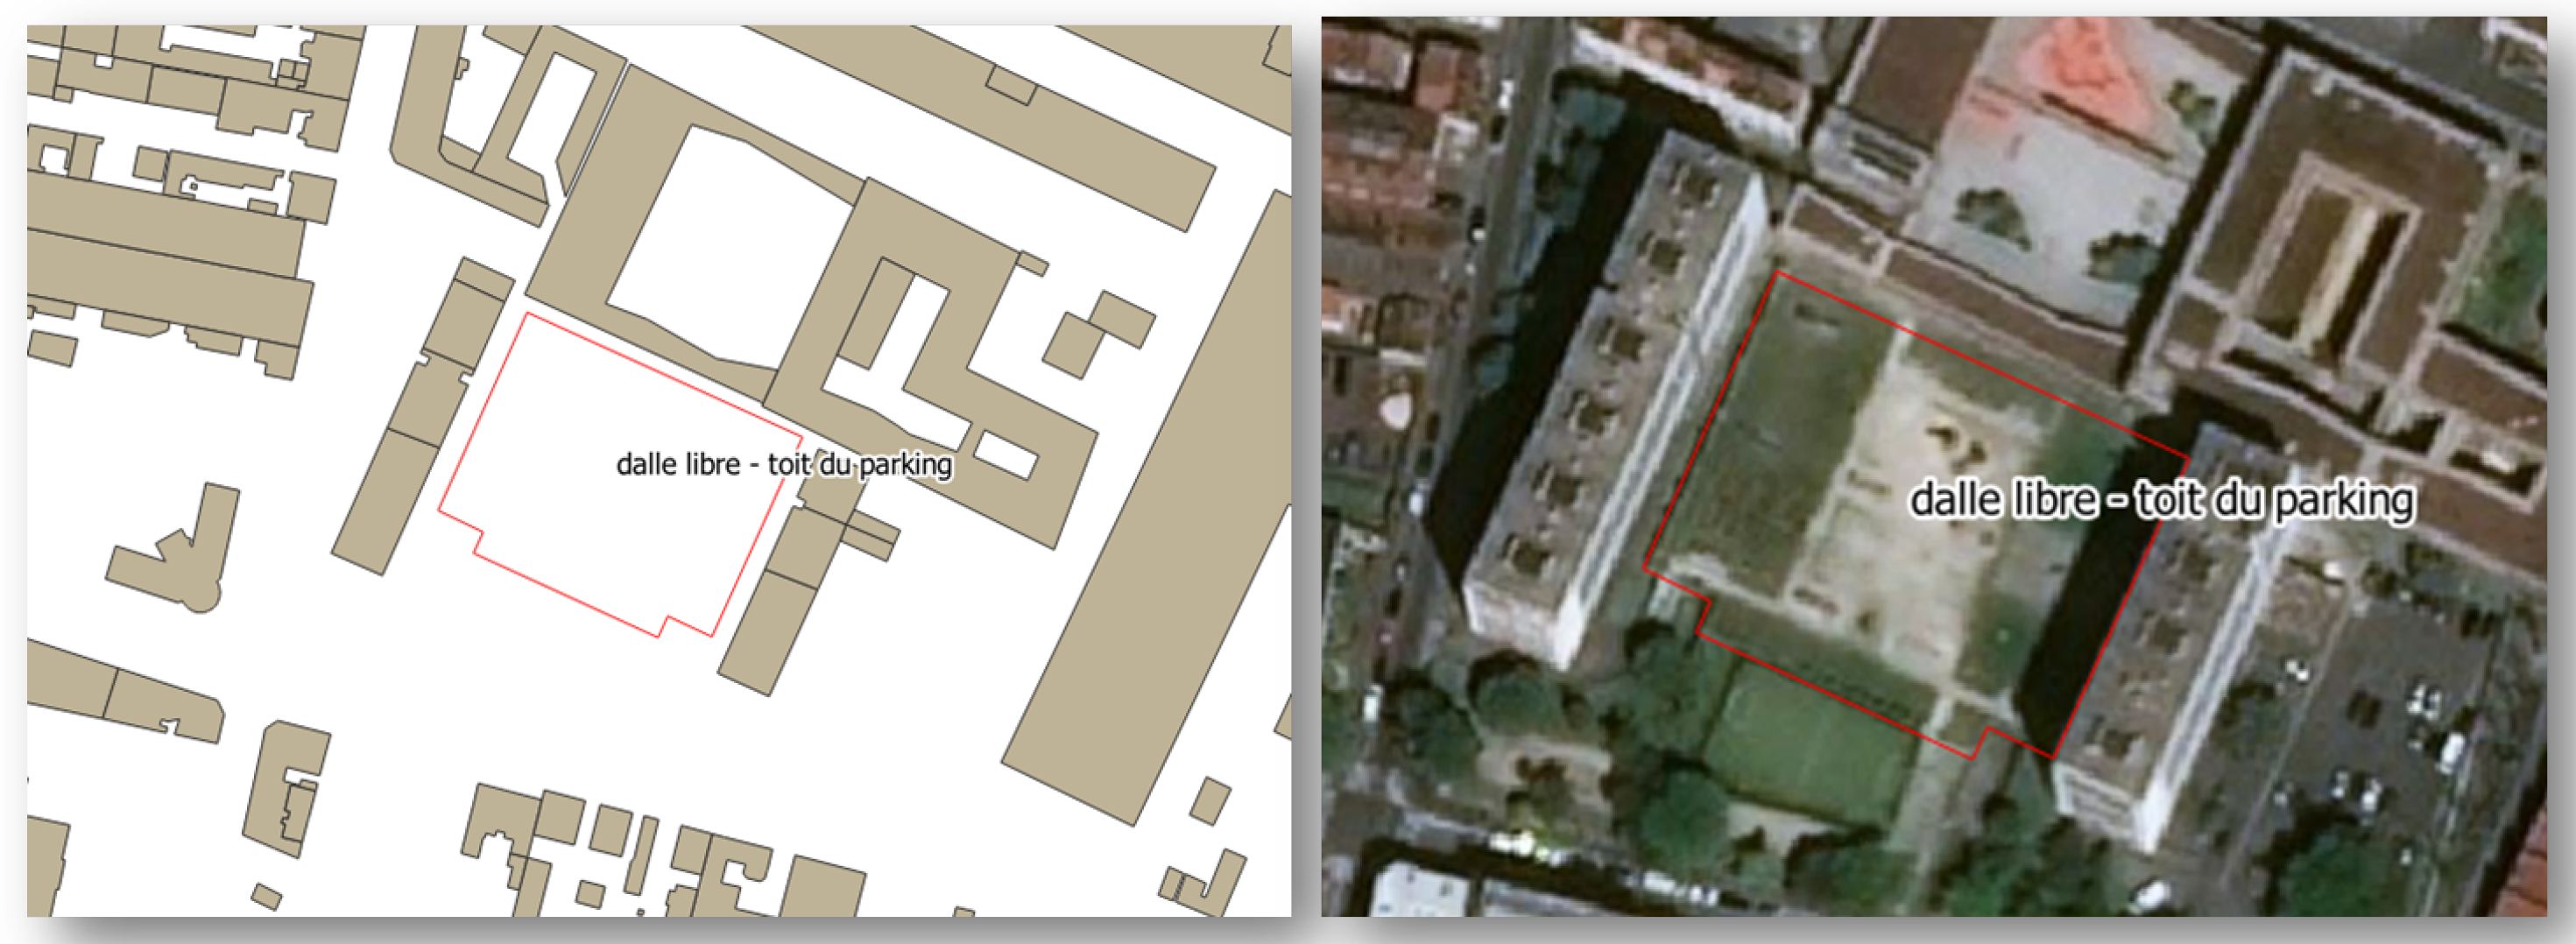
Besides, artificial vandalisms that do not have context features need to be assigned arbitrary values. There was purposely very few examples of vandalized data regarding the number of OSM buildings, as vandalism is quite unusual in OSM (although there is a risk). As the dataset is very unbalanced, there is no way for data augmentation. The solution is to manually generate more vandalized objects in the vandalism corpus. Furthermore, even in the cases where OSM seems to be vandalized, it is complex to be sure it is vandalism and not, only, honest mistakes. The contribution illustrated in
Figure 12 appeared in the Aubervilliers area and was not considered as vandalism by our classifiers. There is clearly no building on this esplanade between two large apartment blocks. The name given to this building can be translated to “free esplanade - roof of the parking lot”. It seems to be a vernacular way of calling the esplanade, probably used by the inhabitants of the apartment blocks. Besides this contribution, the same user contributed to several other map features in the same area, and they seem to be good contributions. In this case, we would argue that both possible classifications (vandalism or error) are acceptable.
Eventually, random forest did not prove its effectiveness in predicting vandalism in unfamiliar OSM regions, because the features happened to be very different from one area to another. This phenomenon can be seen as a kind of concept drift, not due to a temporal evolution as in [
36], but due to a spatial evolution. For instance, buildings can have different shapes in very urban or very rural areas, and the geographic context also changes greatly, so all the features related to the shape and the spatial relations can have distributions that vary with with the geographic landscape (
Figure 9). Even the features related to users and history can be very different in urban areas with many users and edits and rural areas with often a few users to edit the whole area. There are also differences between countries due to the availability of source datasets, such as the cadaster data in France for buildings. We see three possible solutions to overcome this domain adaptation problem:
Define new or normalized features that are less sensitive to changes in landscapes and data sources;
Use transfer learning to fine-tune a trained model to specific landscapes, maybe just with non-vandalized contributions, which are much easier to annotate;
Train different versions of OSMWatchman, each one being specialized for some types of landscapes.
7. Conclusions and Future Work
This study explored the potential of supervised learning methods for OSM vandalism detection. A random forest-based model, OSMWatchman, was proposed and experimented with, yielding mixed results: while OSMWatchman is able to automatically detect vandalism in familiar OSM regions, the model is not successful enough in terms of domain adaptation yet.
Our research opens up many perspectives. The first consists of improving the performance of OSMWatchman. To better understand the domain adaptation limitations, it could be interesting to test vandalism prediction in regions that are closer to the ones used for training, such as neighbouring areas or regions, which have the same geographic landscapes. Thus, this would help to determine if random forest is not at least domain adaptable in unknown regions close to the training areas. On this, a study on the similarity of OSM regions may help to better assess the transfer learning ability of the method considered here. It requires qualifying OSM data at a regional level [
12]. We also saw in the previous discussion that there are limitations with some features used in OSMWatchman, as they can cause false positive predictions. Improved features should help improve the detection results, even when transferring the model to unknown regions.
Another way to improve OSMWatchman would be to train it with more diverse map objects than just buildings. Several of the features are specific to buildings (e.g., ) or just to polygons (e.g., , or ). Therefore, we rather plan to train several classifiers, for each of the types of OSM map objects, with their own set of features, than to train a global classifier able to detect vandalism whatever the type of object.
The OSM users are able to revert most of the actual vandalism because they have access to the ground truth, either by field survey or by looking at aerial images. In order to introduce this ground truth into a learning model, one idea would be to use a convolutional neural network [
37] with images combining the OSM contributions and aerial imagery. Recent research shows the ability of convolutional neural networks to recognize geographic features such as roads and buildings in aerial imagery [
38,
39], so such models could recognize building footprints that are introduced into OSM without actual existence on the ground.
The corpus of OSM vandalism should also be improved. As vandalized buildings were manually mapped, a perspective can be to enrich the corpus with real examples, by seeking old OSM vandalized data that have been repaired or deleted by now. Reusing the dataset on Pokemon GO vandalism [
9] to create new snapshot would be a first step. This would require digging deeper into the history of OSM data.
Finally, we would like to develop OSMWatchman as a tool that could be used by OSM users to go after vandalism more easily.
Author Contributions
Conceptualization, Quy Thy Truong, Guillaume Touya, and Cyril de Runz; data curation, Quy Thy Truong; formal analysis, Quy Thy Truong; investigation, Quy Thy Truong; methodology, Quy Thy Truong; software, Quy Thy Truong; supervision, Guillaume Touya and Cyril de Runz; validation, Quy Thy Truong, Guillaume Touya, and Cyril de Runz; visualization, Quy Thy Truong; writing, original draft, Quy Thy Truong, Guillaume Touya, and Cyril de Runz; writing, review and editing, Guillaume Touya and Cyril de Runz. All authors read and agreed to the published version of the manuscript.
Funding
This research received no external funding.
Conflicts of Interest
The authors declare no conflict of interest.
References
- Zaveri, M. New York City Is Briefly Labeled ‘Jewtropolis’ on Snapchat and Other Apps. The New York Times, 30 August 2018. [Google Scholar]
- Garling, C. Google Workers Caught ‘Vandalizing’ Open Source Maps. Wired 2012. Available online: https://www.wired.com/2012/01/osm-google-accusation/ (accessed on 21 June 2020).
- Can We Validate Every Change on OSM. State of the Map: 2018. Available online: https://2018.stateofthemap.org/2018/T079-Can_we_validate_every_change_on_OSM_/ (accessed on 21 June 2020).
- Ballatore, A. Defacing the Map: Cartographic Vandalism in the Digital Commons. Cartogr. J. 2014, 51, 214–224. [Google Scholar] [CrossRef]
- Truong, Q.T.; Touya, G.; De Runz, C. Towards Vandalism Detection in OpenStreetMap Through a Data Driven Approach. In Proceedings of the 10th International Conference on Geographic Information Science (GIScience 2018), Melbourne, Australia, 28–31 August 2018. [Google Scholar] [CrossRef]
- Quinn, S.; Bull, F. Understanding Threats to Crowdsourced Geographic Data Quality Through a Study of OpenStreetMap Contributor Bans. In Geospatial Information System Use in Public Organizations—How and Why GIS Should Be Used in the Public Sector; Valcik, N., Dean, D., Eds.; Taylor & Francis: New York, NY, USA, 2019; pp. 80–96. [Google Scholar]
- Chin, S.C.; Street, W.N.; Srinivasan, P.; Eichmann, D. Detecting Wikipedia vandalism with active learning and statistical language models. In Proceedings of the 4th Workshop on Information Credibility, WICOW ’10, Raleigh, NC, USA, 27 April 2010; ACM: New York, NY, USA, 2010; pp. 3–10. [Google Scholar] [CrossRef] [Green Version]
- Heindorf, S.; Potthast, M.; Stein, B.; Engels, G. Vandalism Detection in Wikidata. In Proceedings of the 25th ACM International on Conference on Information and Knowledge Management—CIKM ’16, Indianapolis, IN, USA, 24–28 October 2016; ACM: New York, NY, USA, 2016; pp. 327–336. [Google Scholar] [CrossRef]
- Juhász, L.; Novack, T.; Hochmair, H.H.; Qiao, S. Cartographic Vandalism in the Era of Location-Based Games—The Case of OpenStreetMap and Pokémon GO. ISPRS Int. J. Geo-Inf. 2020, 9, 197. [Google Scholar] [CrossRef] [Green Version]
- Chen, J.; Zipf, A. Deep Learning with Satellite Images and Volunteered Geographic Information. In Geospatial Data Science Techniques and Applications; CRC Press: Boca Raton, FL, USA, 2017; p. 274. [Google Scholar]
- Touya, G.; Zhang, X.; Lokhat, I. Is deep learning the new agent for map generalization? Int. J. Cartogr. 2019, 1–16. [Google Scholar] [CrossRef] [Green Version]
- Iddianozie, C.; McArdle, G. A Transfer Learning Paradigm for Spatial Networks. In Proceedings of the 34th ACM/SIGAPP Symposium on Applied Computing, SAC ’19, Limassol, Cyprus, 8–12 April 2019; ACM: New York, NY, USA, 2019; pp. 659–666. [Google Scholar] [CrossRef]
- Ho, T.K. Random Decision Forests. In Proceedings of the 3rd International Conference on Document Analysis and Recognition, Montreal, QC, Canada, 14–16 August 1995; IEEE Computer Society: Washington, DC, USA, 1995; Volume 1, p. 278. [Google Scholar]
- Neis, P.; Goetz, M.; Zipf, A. Towards Automatic Vandalism Detection in OpenStreetMap. ISPRS Int. J. Geo-Inf. 2012, 1, 315–332. [Google Scholar] [CrossRef]
- Heindorf, S.; Potthast, M.; Stein, B.; Engels, G. Towards Vandalism Detection in Knowledge Bases. In Proceedings of the 38th International ACM SIGIR Conference on Research and Development in Information Retrieval—SIGIR ’15, Santiago, Chile, 9–13 August 2015; pp. 831–834. [Google Scholar] [CrossRef]
- Potthast, M. Crowdsourcing a wikipedia vandalism corpus. In Proceedings of the 33rd International ACM SIGIR Conference on Research and Development in Information Retrieval—SIGIR ’10, Geneva, Switzerland, 19–23 July 2010; ACM: New York, NY, USA, 2010; pp. 789–790. [Google Scholar] [CrossRef]
- Xu, Y.; Chen, Z.; Xie, Z.; Wu, L. Quality assessment of building footprint data using a deep autoencoder network. Int. J. Geogr. Inf. Sci. 2017, 31, 1929–1951. [Google Scholar] [CrossRef]
- Goodchild, M.F.; Li, L. Assuring the quality of volunteered geographic information. Spat. Stat. 2012, 1, 110–120. [Google Scholar] [CrossRef]
- Touya, G.; Brando, C. Detecting Level-of-Detail Inconsistencies in Volunteered Geographic Information Data Sets. Cartogr. Int. J. Geogr. Inf. Geovis. 2013, 48, 134–143. [Google Scholar] [CrossRef] [Green Version]
- Bégin, D.; Devillers, R.; Roche, S. The life cycle of contributors in collaborative online communities -the case of OpenStreetMap. Int. J. Geogr. Inf. Sci. 2018, 32, 1611–1630. [Google Scholar] [CrossRef] [Green Version]
- Bégin, D.; Devillers, R.; Roche, S. Assessing Volunteered Geographic Information (VGI) Quality Based on Contributors’ Mapping Behaviours. In Proceedings of the 8th International Symposium on Spatial Data Quality, Hong Kong, China, 30 May–1 June 2013; Volume XL-2/W1, pp. 149–154. [Google Scholar]
- Mooney, P.; Corcoran, P. How social is OpenStreetMap? In Proceedings of the AGILE’2012 International Conference on Geographic Information Science, Avignon, France, 24–27 April 2012. [Google Scholar]
- Truong, Q.T.; de Runz, C.; Touya, G. Analysis of collaboration networks in OpenStreetMap through weighted social multigraph mining. Int. J. Geogr. Inf. Sci. 2019, 33, 1651–1682. [Google Scholar] [CrossRef]
- Mooney, P.; Corcoran, P. The Annotation Process in OpenStreetMap. Trans. GIS 2012, 16, 561–579. [Google Scholar] [CrossRef]
- Kessler, C.; de Groot, R.T.A. Trust as a Proxy Measure for the Quality of Volunteered Geographic Information in the Case of OpenStreetMap. In Geographic Information Science at the Heart of Europe; Lecture Notes in Geoinformation and Cartography; Vandenbroucke, D., Bucher, B., Crompvoets, J., Eds.; Springer International Publishing: Berlin, Germany, 2013; pp. 21–37. [Google Scholar] [CrossRef]
- Tan, C.H.; Agichtein, E.; Ipeirotis, P.; Gabrilovich, E. Trust, but Verify: Predicting Contribution Quality for Knowledge Base Construction and Curation. In Proceedings of the 7th ACM International Conference on Web Search and Data Mining—WSDM ’14, New York, NY, USA, 24–28 February 2014; pp. 553–562. [Google Scholar] [CrossRef]
- D’Antonio, F.; Fogliaroni, P.; Kauppinen, T. VGI Edit History Reveals Data Trustworthiness and User Reputation. In Proceedings of the 17th AGILE Conference on Geographic Information Science, Castellón, Spain, 3–6 June 2014. [Google Scholar]
- Lodigiani, C.; Melchiori, M. A PageRank-based Reputation Model for VGI Data. Procedia Comput. Sci. 2016, 98, 566–571. [Google Scholar] [CrossRef] [Green Version]
- Truong, Q.T.; Touya, G.; de Runz, C. Building Social Networks in Volunteered Geographic Information Communities: What Contributor Behaviours Reveal About Crowdsourced Data Quality. In Lecture Notes in Geoinformation and Cartography, Proceedings of Workshops and Posters at the 13th International Conference on Spatial Information Theory (COSIT 2017), L’Aquila, Italy, 4–8 September 2017; Springer: Berlin, Germany, 2017. [Google Scholar] [CrossRef]
- Stein, K.; Kremer, D.; Schlieder, C. Spatial Collaboration Networks of OpenStreetMap. In OpenStreetMap in GIScience; Lecture Notes in Geoinformation and Cartography; Jokar Arsanjani, J., Zipf, A., Mooney, P., Helbich, M., Eds.; Springer International Publishing: Berlin, Germany, 2015; pp. 167–186. [Google Scholar] [CrossRef]
- Yang, A.; Fan, H.; Jing, N. Amateur or Professional: Assessing the Expertise of Major Contributors in OpenStreetMap Based on Contributing Behaviors. ISPRS Int. J. Geo-Inf. 2016, 5, 21. [Google Scholar] [CrossRef]
- Robertson, C.; Feick, R. Defining Local Experts: Geographical Expertise as a Basis for Geographic Information Quality; Clementini, E., Donnelly, M., Yuan, M., Kray, C., Fogliaroni, P., Ballatore, A., Eds.; Schloss Dagstuhl–Leibniz-Zentrum fuer Informatik: Dagstuhl, Germany, 2017. [Google Scholar]
- Halfaker, A.; Kittur, A.; Riedl, J. Don’T Bite the Newbies: How Reverts Affect the Quantity and Quality of Wikipedia Work. In Proceedings of the 7th International Symposium on Wikis and Open Collaboration, WikiSym ’11, Mountain View, CA, USA, 3–5 October 2011; ACM: New York, NY, USA, 2011; pp. 163–172. [Google Scholar] [CrossRef]
- Neis, P.; Zipf, A. Analyzing the Contributor Activity of a Volunteered Geographic Information Project—The Case of OpenStreetMap. ISPRS Int. J. Geo-Inf. 2012, 1, 146–165. [Google Scholar] [CrossRef]
- Breiman, L. Random Forests. Mach. Learn. 2001, 45, 5–32. [Google Scholar] [CrossRef] [Green Version]
- Gama, J.; Žliobaitė, I.; Bifet, A.; Pechenizkiy, M.; Bouchachia, A. A survey on concept drift adaptation. ACM Comput. Surv. (CSUR) 2014, 46, 1–37. [Google Scholar] [CrossRef]
- LeCun, Y.; Bengio, Y.; Hinton, G. Deep learning. Nature 2015, 521, 436. [Google Scholar] [CrossRef]
- Xu, Y.; Wu, L.; Xie, Z.; Chen, Z. Building Extraction in Very High Resolution Remote Sensing Imagery Using Deep Learning and Guided Filters. Remote Sens. 2018, 10, 144. [Google Scholar] [CrossRef] [Green Version]
- Zhang, Z.; Liu, Q.; Wang, Y. Road Extraction by Deep Residual U-Net. IEEE Geosci. Remote Sens. Lett. 2017, 15, 749–753. [Google Scholar] [CrossRef] [Green Version]
| Sample Availability: Samples are available from the authors. |
Figure 1.
A French building mapped on OSM in eight pieces.
Figure 1.
A French building mapped on OSM in eight pieces.
Figure 2.
UMLdiagram of the proposed corpus. The corpus is composed of OSM snapshots containing some vandalised contribution, but mostly normal contributions.
Figure 2.
UMLdiagram of the proposed corpus. The corpus is composed of OSM snapshots containing some vandalised contribution, but mostly normal contributions.
Figure 3.
Building a vandalism corpus in OSM on four different areas.
Figure 3.
Building a vandalism corpus in OSM on four different areas.
Figure 4.
Aerial view of the study areas (Bing aerial).
Figure 4.
Aerial view of the study areas (Bing aerial).
Figure 5.
Fake vandalism examples.
Figure 5.
Fake vandalism examples.
Figure 6.
Pre-processing the data to an adapted format for the learning algorithm.
Figure 6.
Pre-processing the data to an adapted format for the learning algorithm.
Figure 7.
Training two classifiers on two different datasets and one classifier on both datasets.
Figure 7.
Training two classifiers on two different datasets and one classifier on both datasets.
Figure 8.
Observing the performance of each classifier by predicting vandalism in each study area.
Figure 8.
Observing the performance of each classifier by predicting vandalism in each study area.
Figure 9.
False positives (small building pieces coloured in red) detected by .
Figure 9.
False positives (small building pieces coloured in red) detected by .
Figure 10.
False positives detected by the model trained on Aubervilliers and applied to the neighbouring city of Pantin, caused by the feature.
Figure 10.
False positives detected by the model trained on Aubervilliers and applied to the neighbouring city of Pantin, caused by the feature.
Figure 11.
False positives detected by the model trained on Aubervilliers and applied to the neighbouring city of Pantin, caused by the feature.
Figure 11.
False positives detected by the model trained on Aubervilliers and applied to the neighbouring city of Pantin, caused by the feature.
Figure 12.
A contribution that is complex to classify as vandalism or as an error.
Figure 12.
A contribution that is complex to classify as vandalism or as an error.
Table 1.
Count of vandalized buildings and OSM buildings in each study area.
Table 1.
Count of vandalized buildings and OSM buildings in each study area.
| Area x | OSM Buildings | Vandalized Buildings |
|---|
| A (Aubervilliers) | 10,250 | 71 |
| B (Stuhr) | 6274 | 44 |
| C (Lannilis) | 8066 | 32 |
| D (Heilsbronn) | 6254 | 31 |
Table 2.
User feature weights for .
Table 2.
User feature weights for .
| User Feature | Weight |
|---|
| 1 |
| 1 |
| 1 |
| 2 |
| 2 |
| 2 |
| 3 |
| 3 |
Table 3.
Selected features.
Table 3.
Selected features.
| Features | Description |
|---|
| perimeter of the polygon |
| length of the shortest side |
| median length of the polygon sides |
| elongation |
| convexity of the polygon |
| compactness of the polygon |
| number of natural areas containing the polygon |
| number of natural areas that intersect the polygon |
| syntactical index |
| number of tags describing the object |
| number of different contributors of the object |
| duration of the period between the current version and the previous one |
| average of contributor’s trustworthiness |
| weighted average of contributor’s trustworthiness |
Table 4.
OSMWatchman prediction results.
Table 4.
OSMWatchman prediction results.
| | Aubervilliers Pred. | Stuhr Pred. | Lannilis Pred. | Heilsbronn Pred. |
|---|
| | TPR | TNR | TPR | TNR | TPR | TNR | TPR | TNR |
|---|
| Aubervilliers | 1 | 1 | 0.18 | 0.99 | 0 | 0.99 | 0 | 0.99 |
| Stuhr | 0.36 | 0.99 | 1 | 0.99 | 0 | 1 | 0 | 0.99 |
| Aubervilliers + Stuhr | 0.97 | 0.99 | 0.98 | 1 | 0 | 1 | 0 | 1 |
Table 5.
Predictions of OSMWatchman with without user features.
Table 5.
Predictions of OSMWatchman with without user features.
| | TPR | TNR |
|---|
| Aubervilliers | 0.94 | 0.99 |
| Stuhr | 0.90 | 1 |
| Lannilis | 0.03 | 0.98 |
| Heilsbronn | 0 | 0.99 |
© 2020 by the authors. Licensee MDPI, Basel, Switzerland. This article is an open access article distributed under the terms and conditions of the Creative Commons Attribution (CC BY) license (http://creativecommons.org/licenses/by/4.0/).


