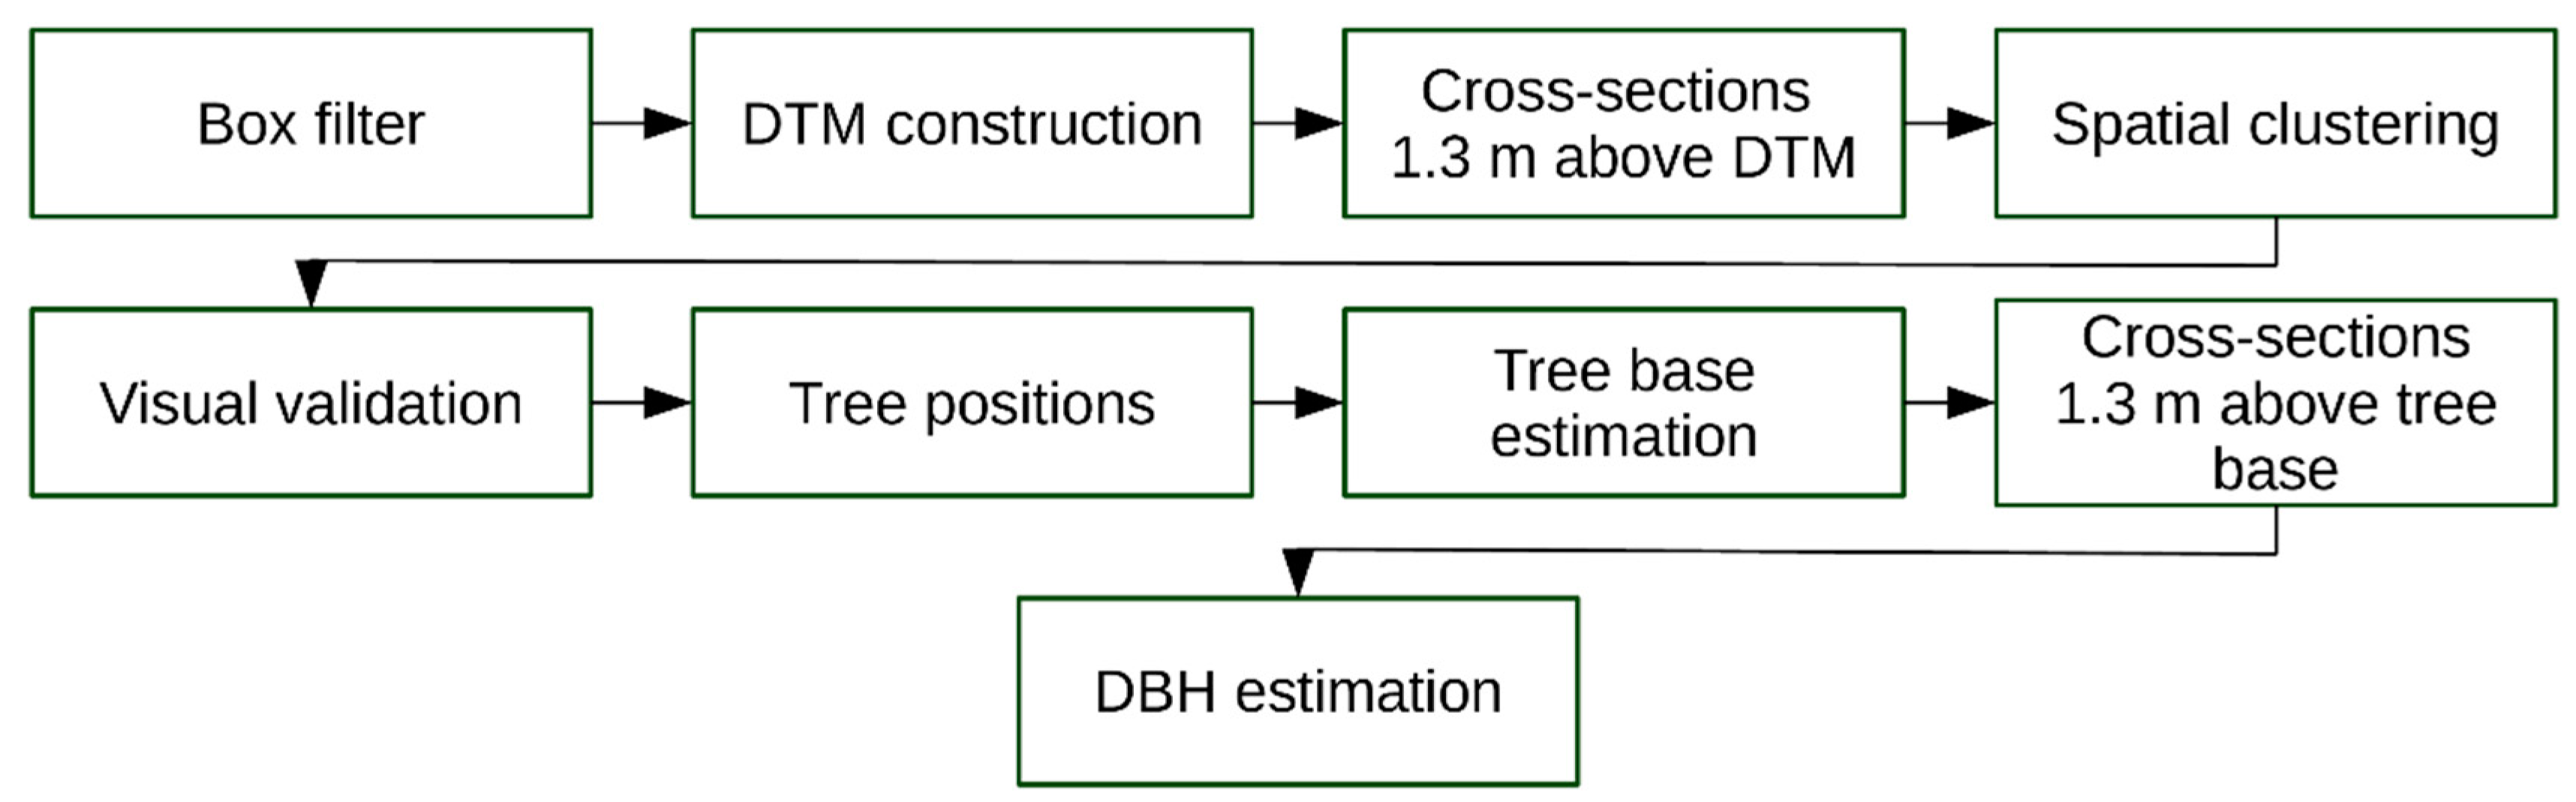
Appendix B
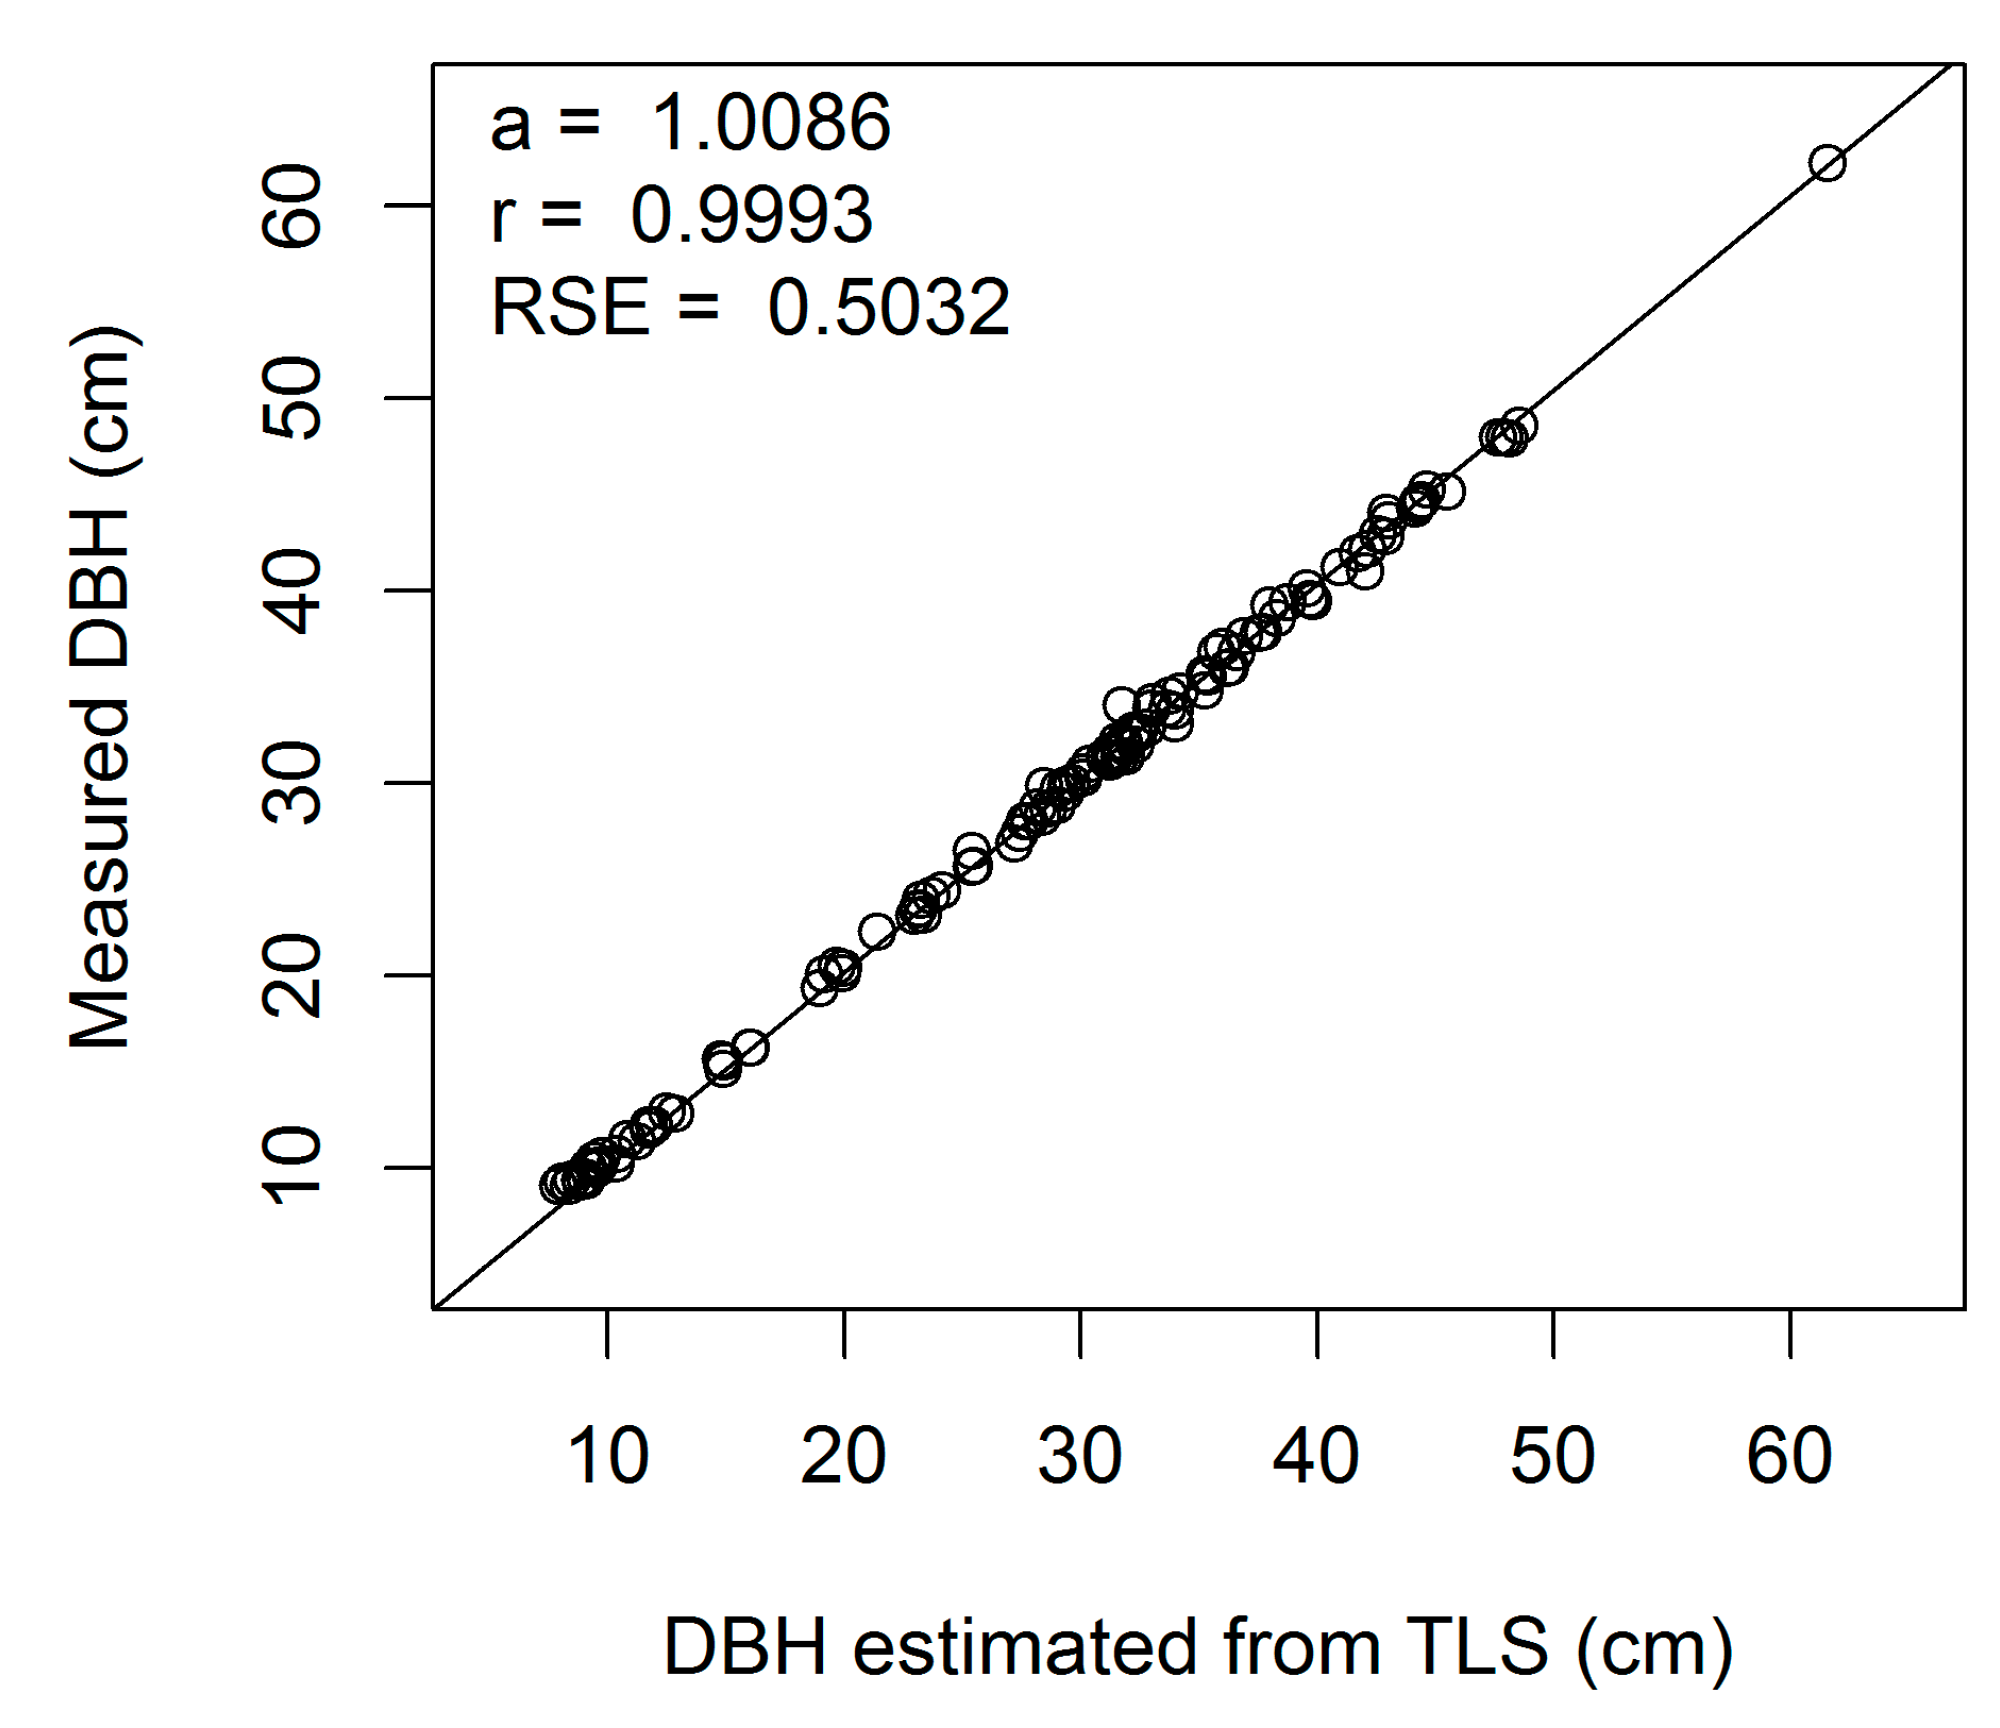
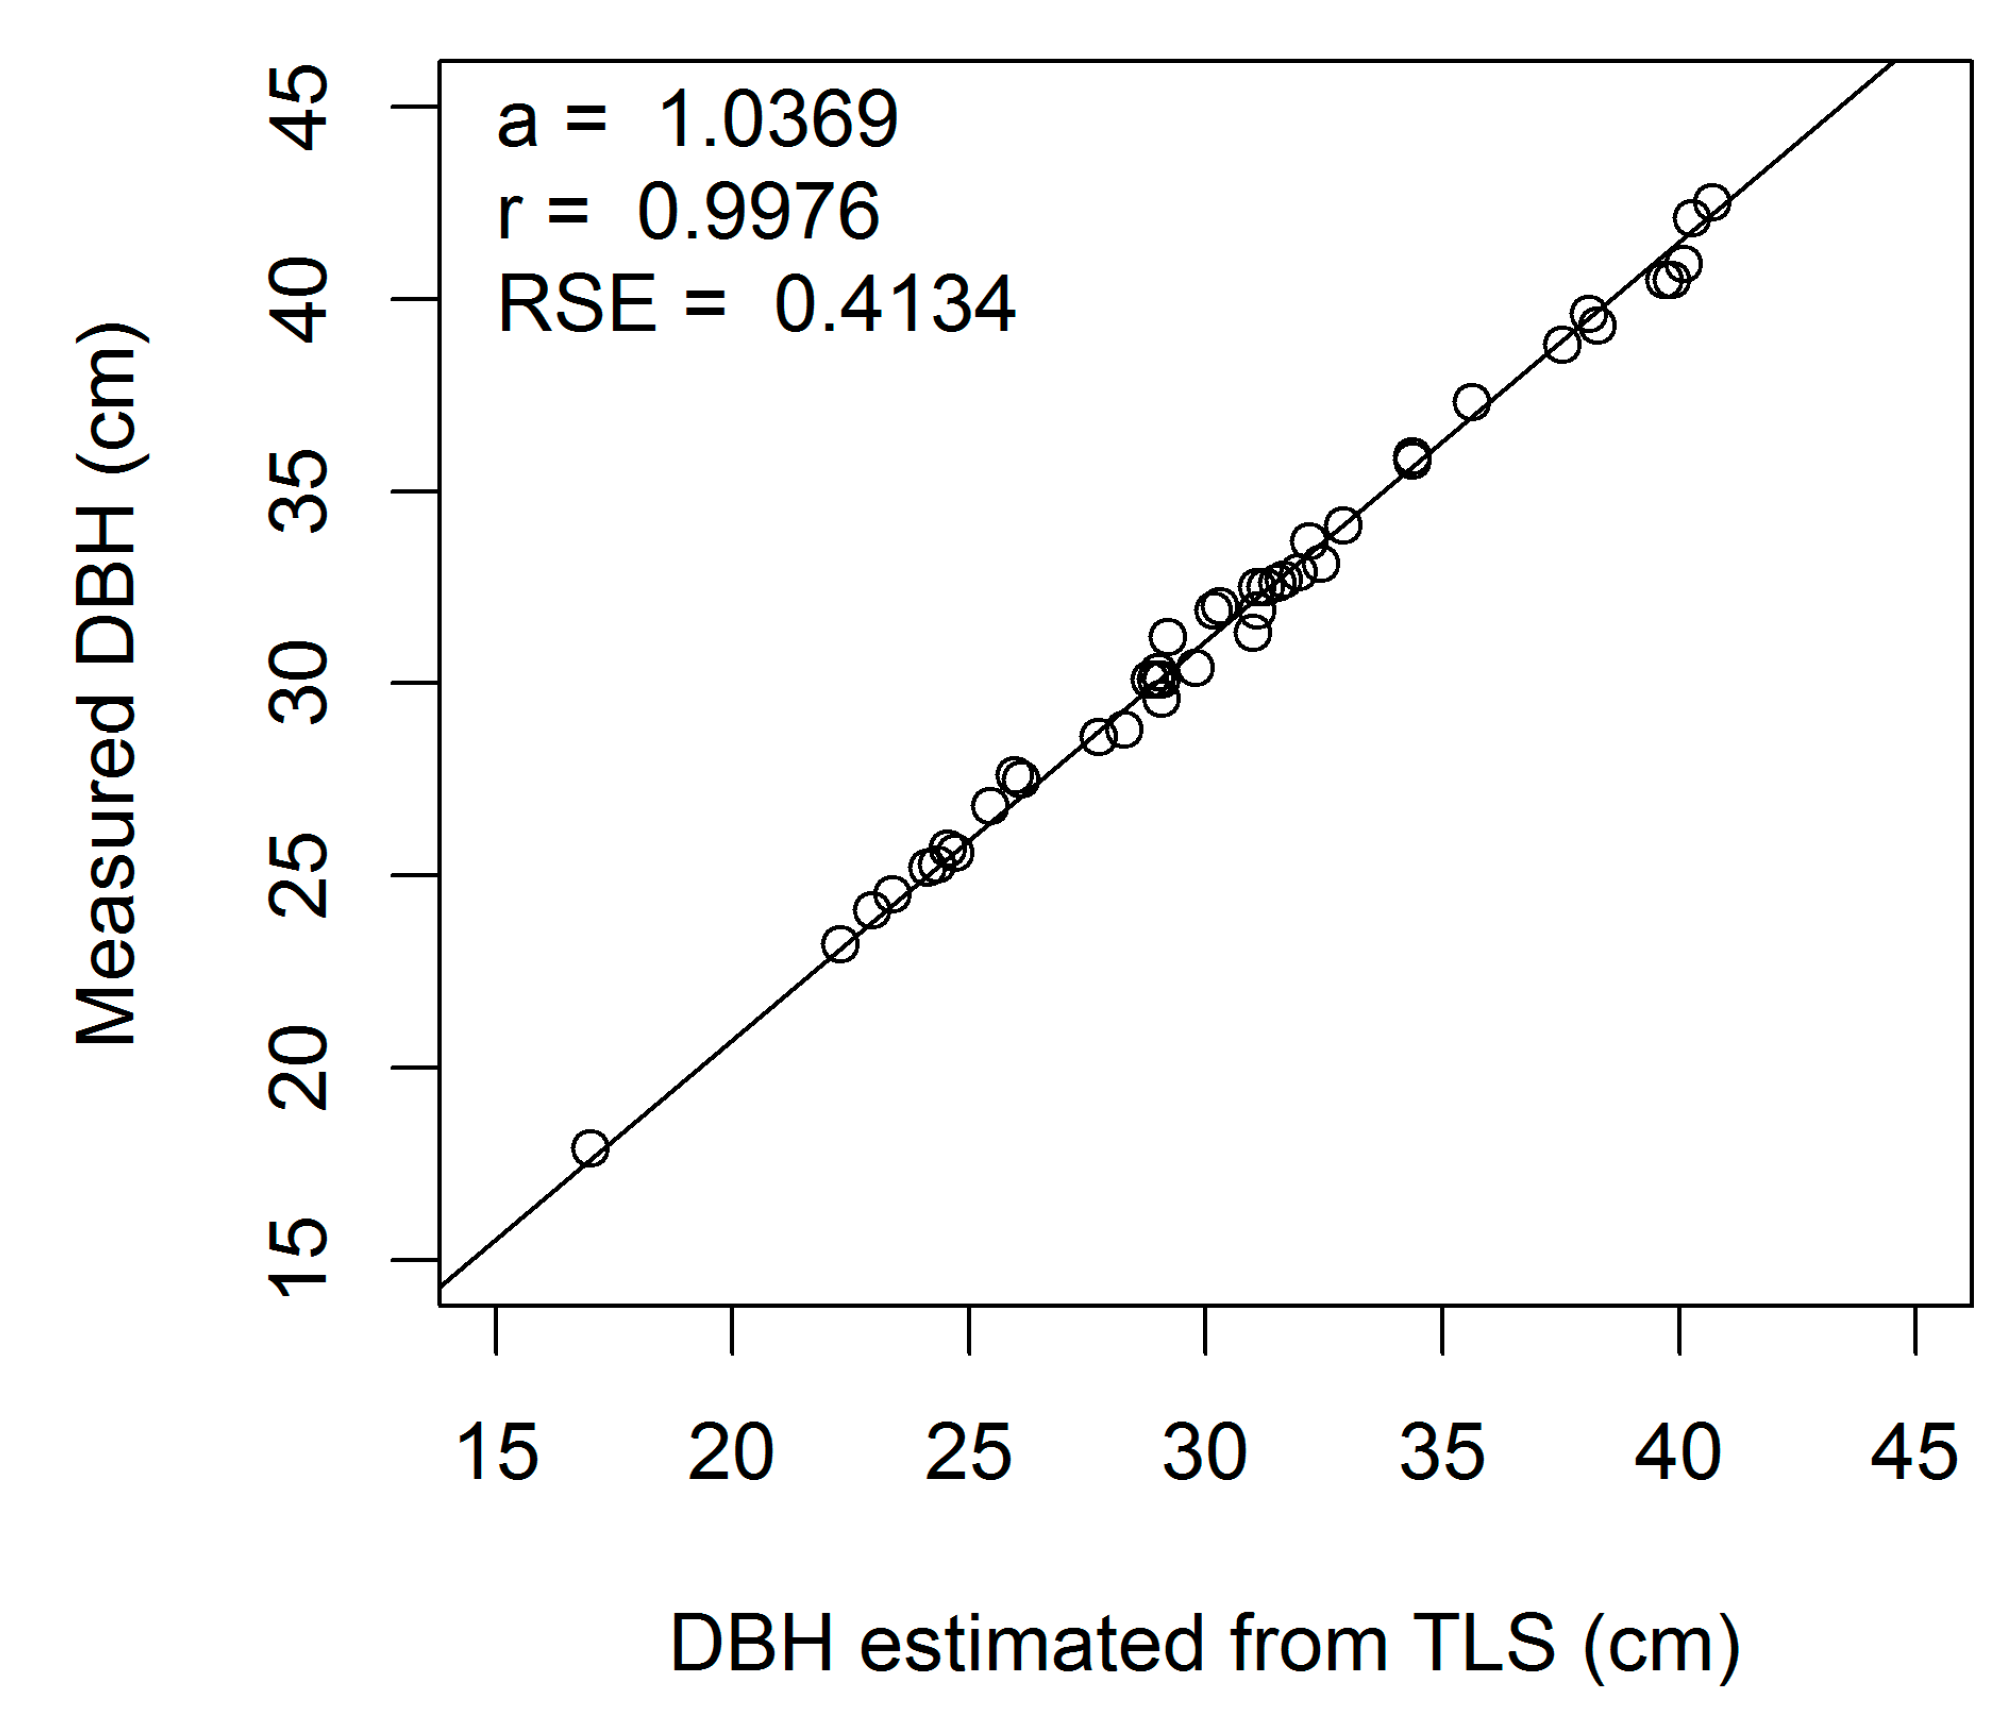
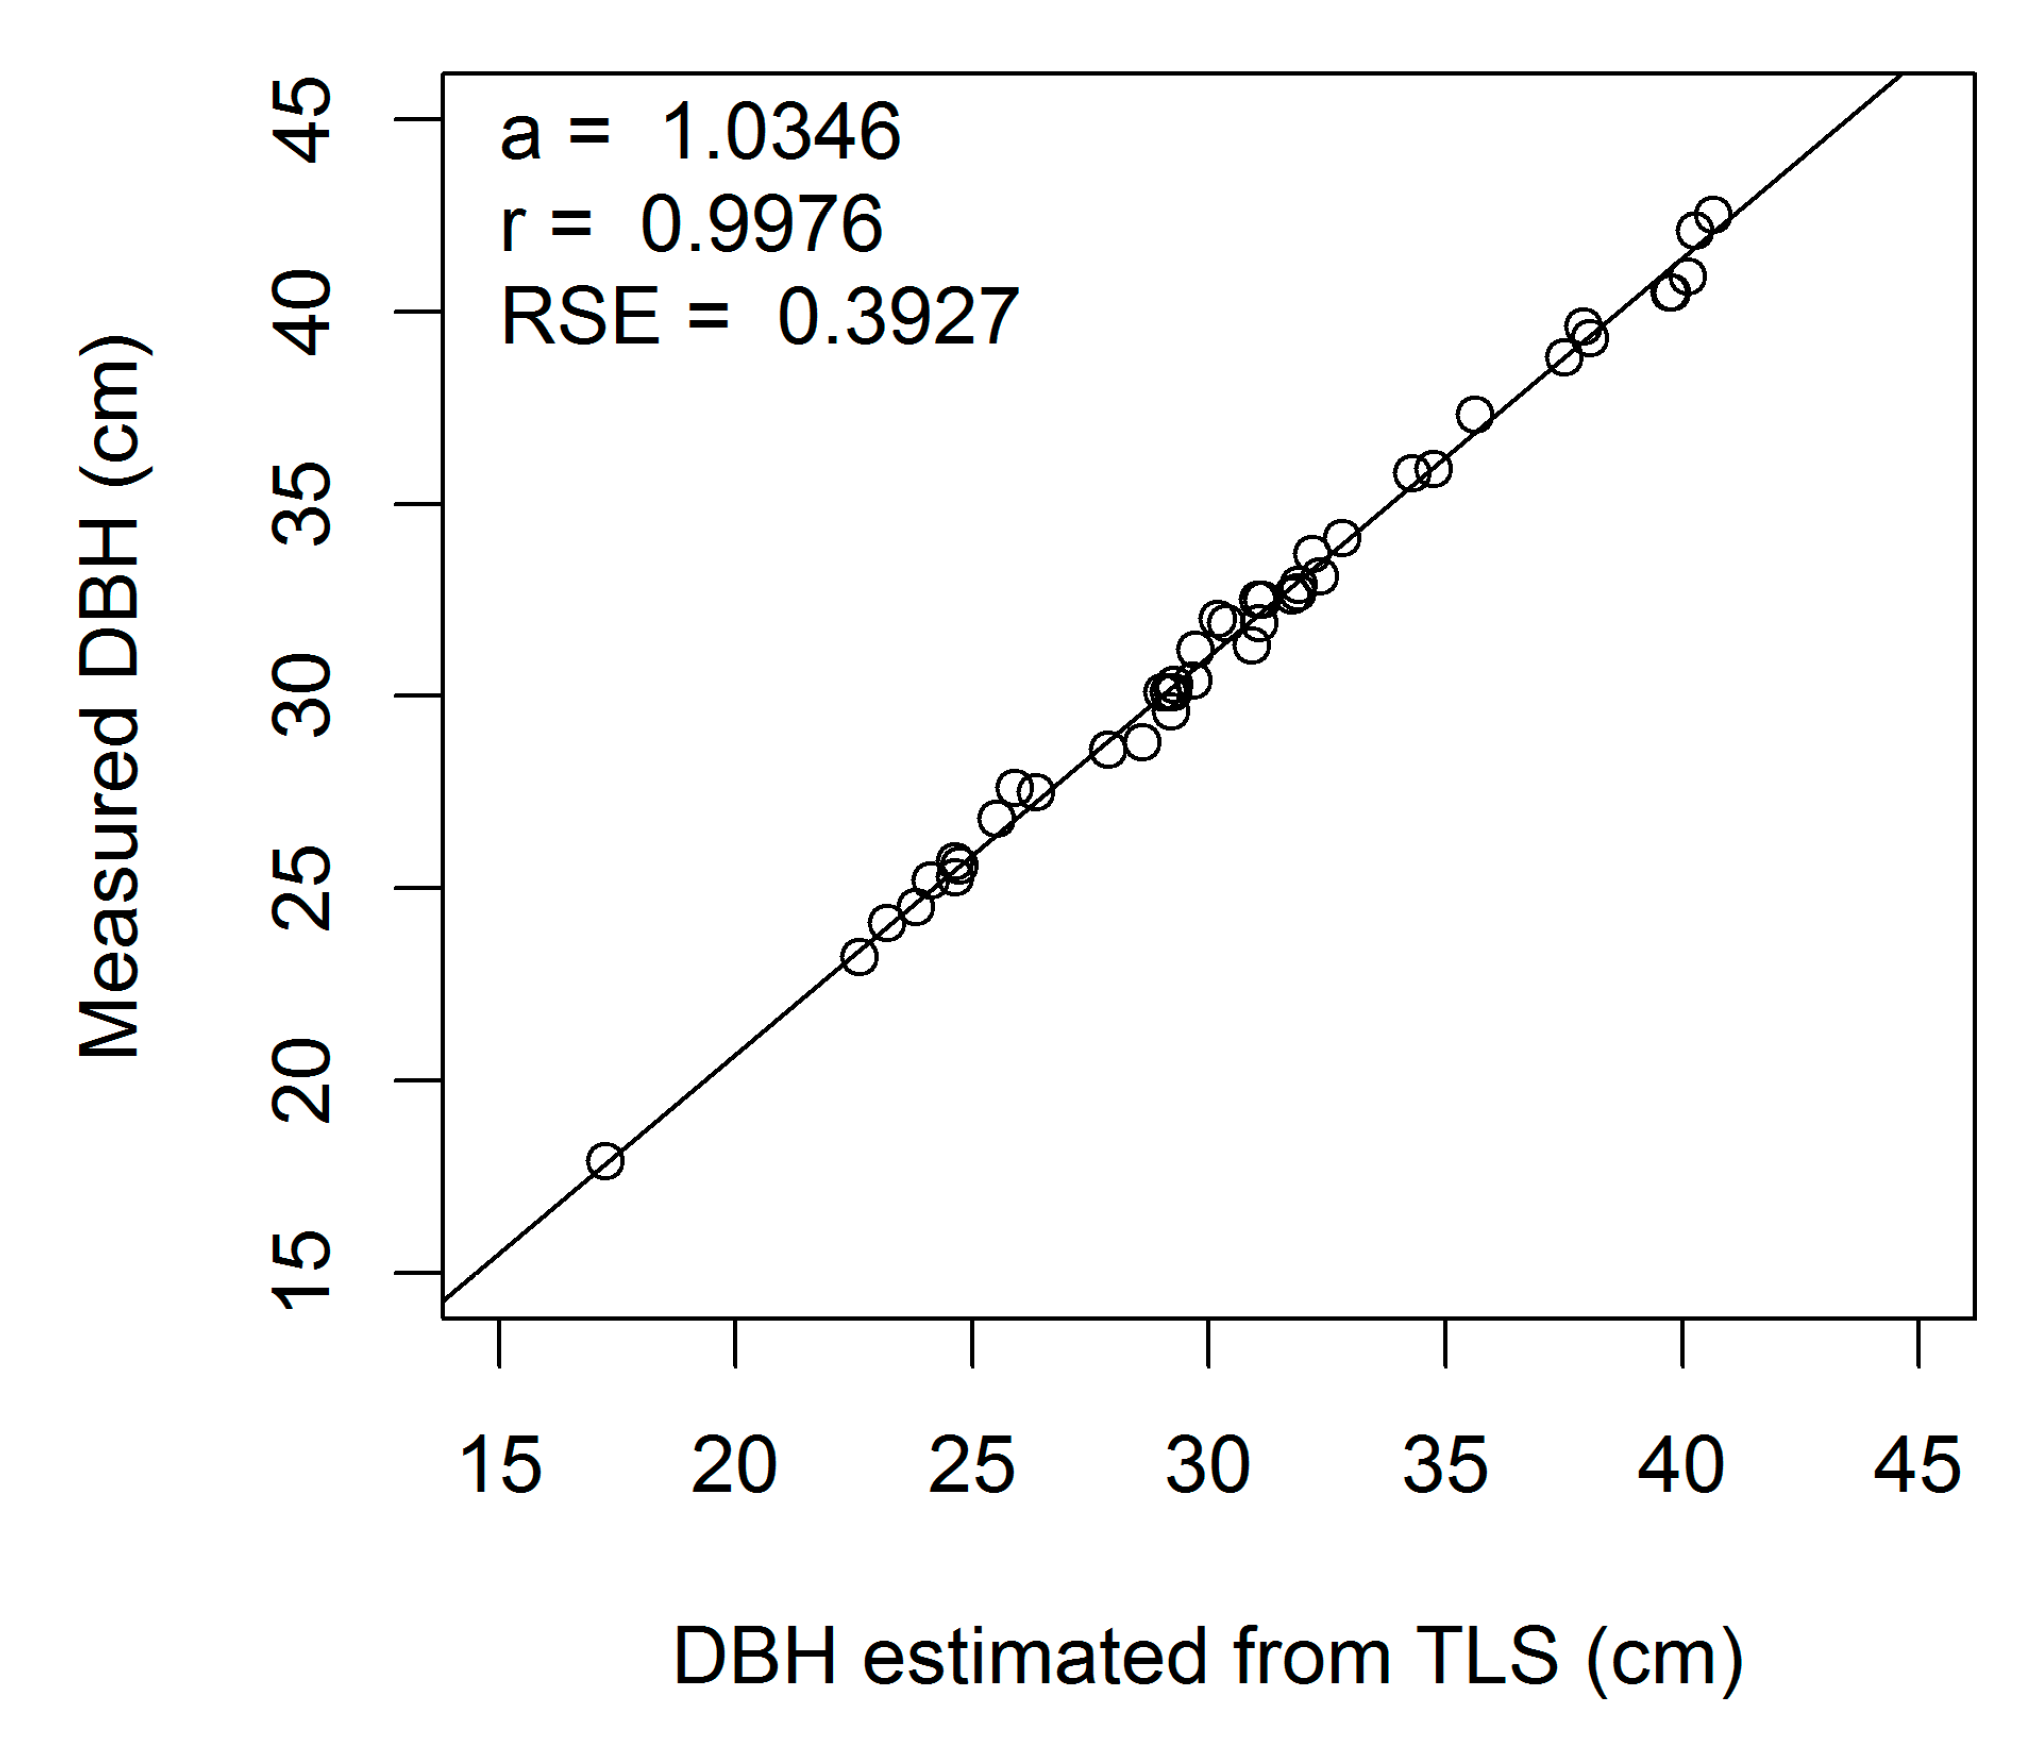
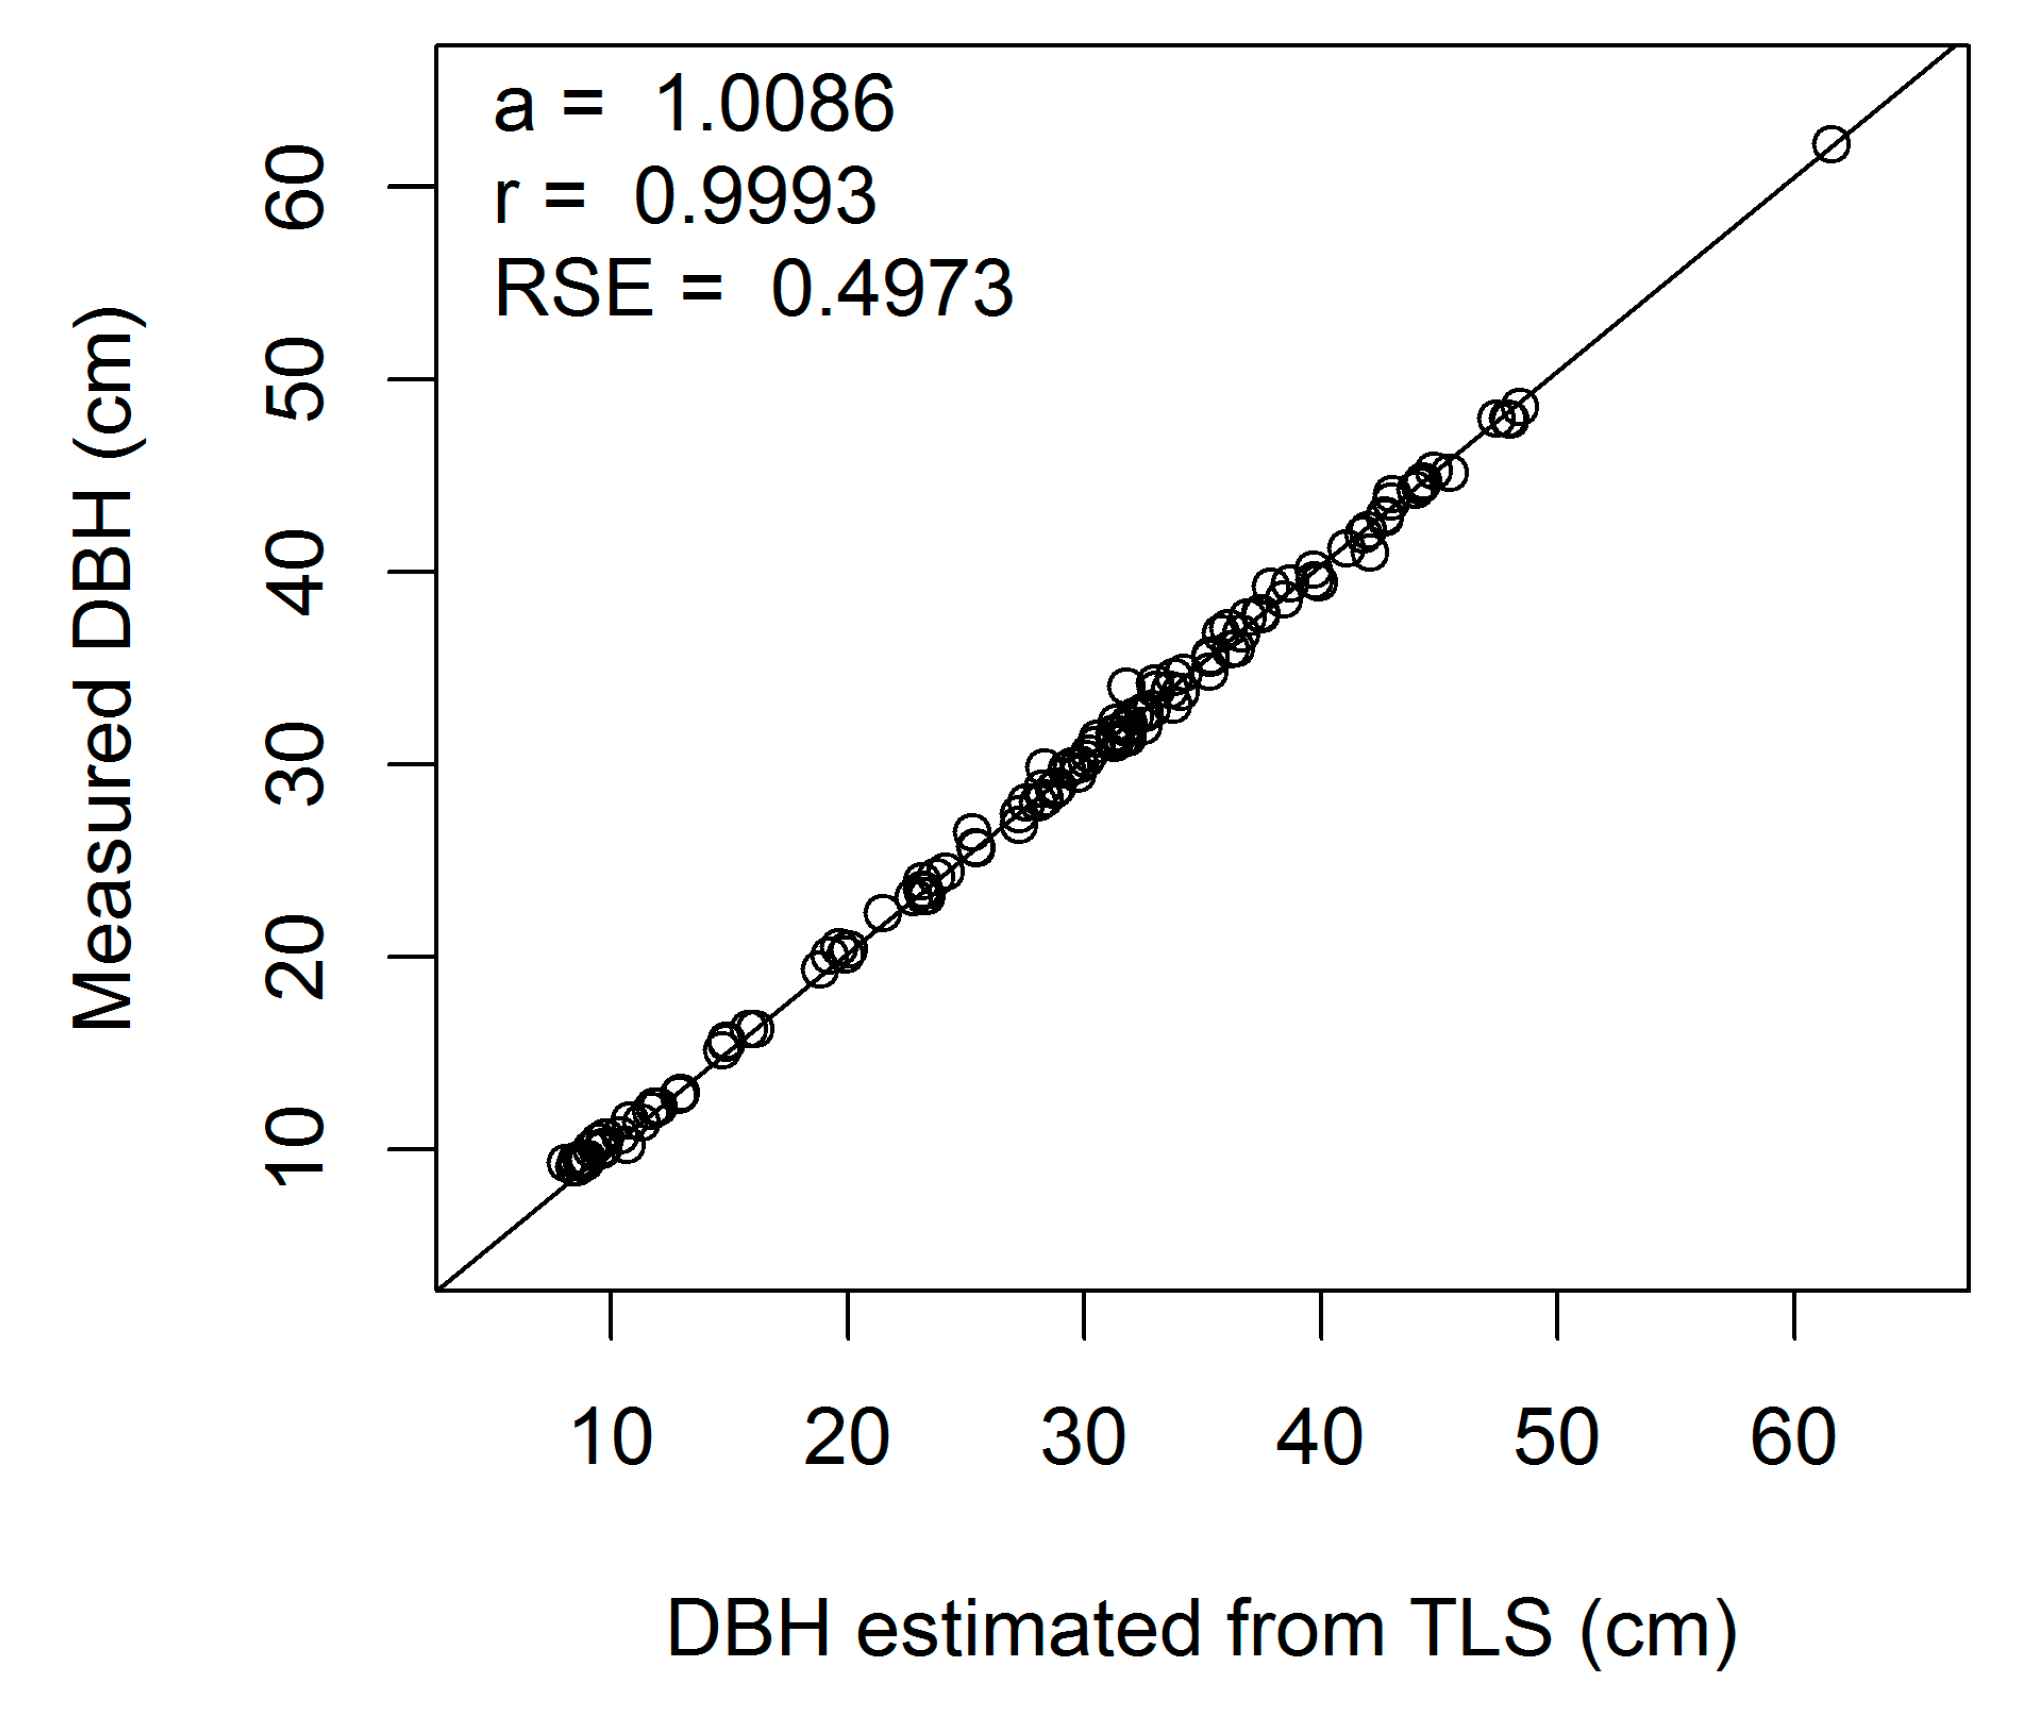
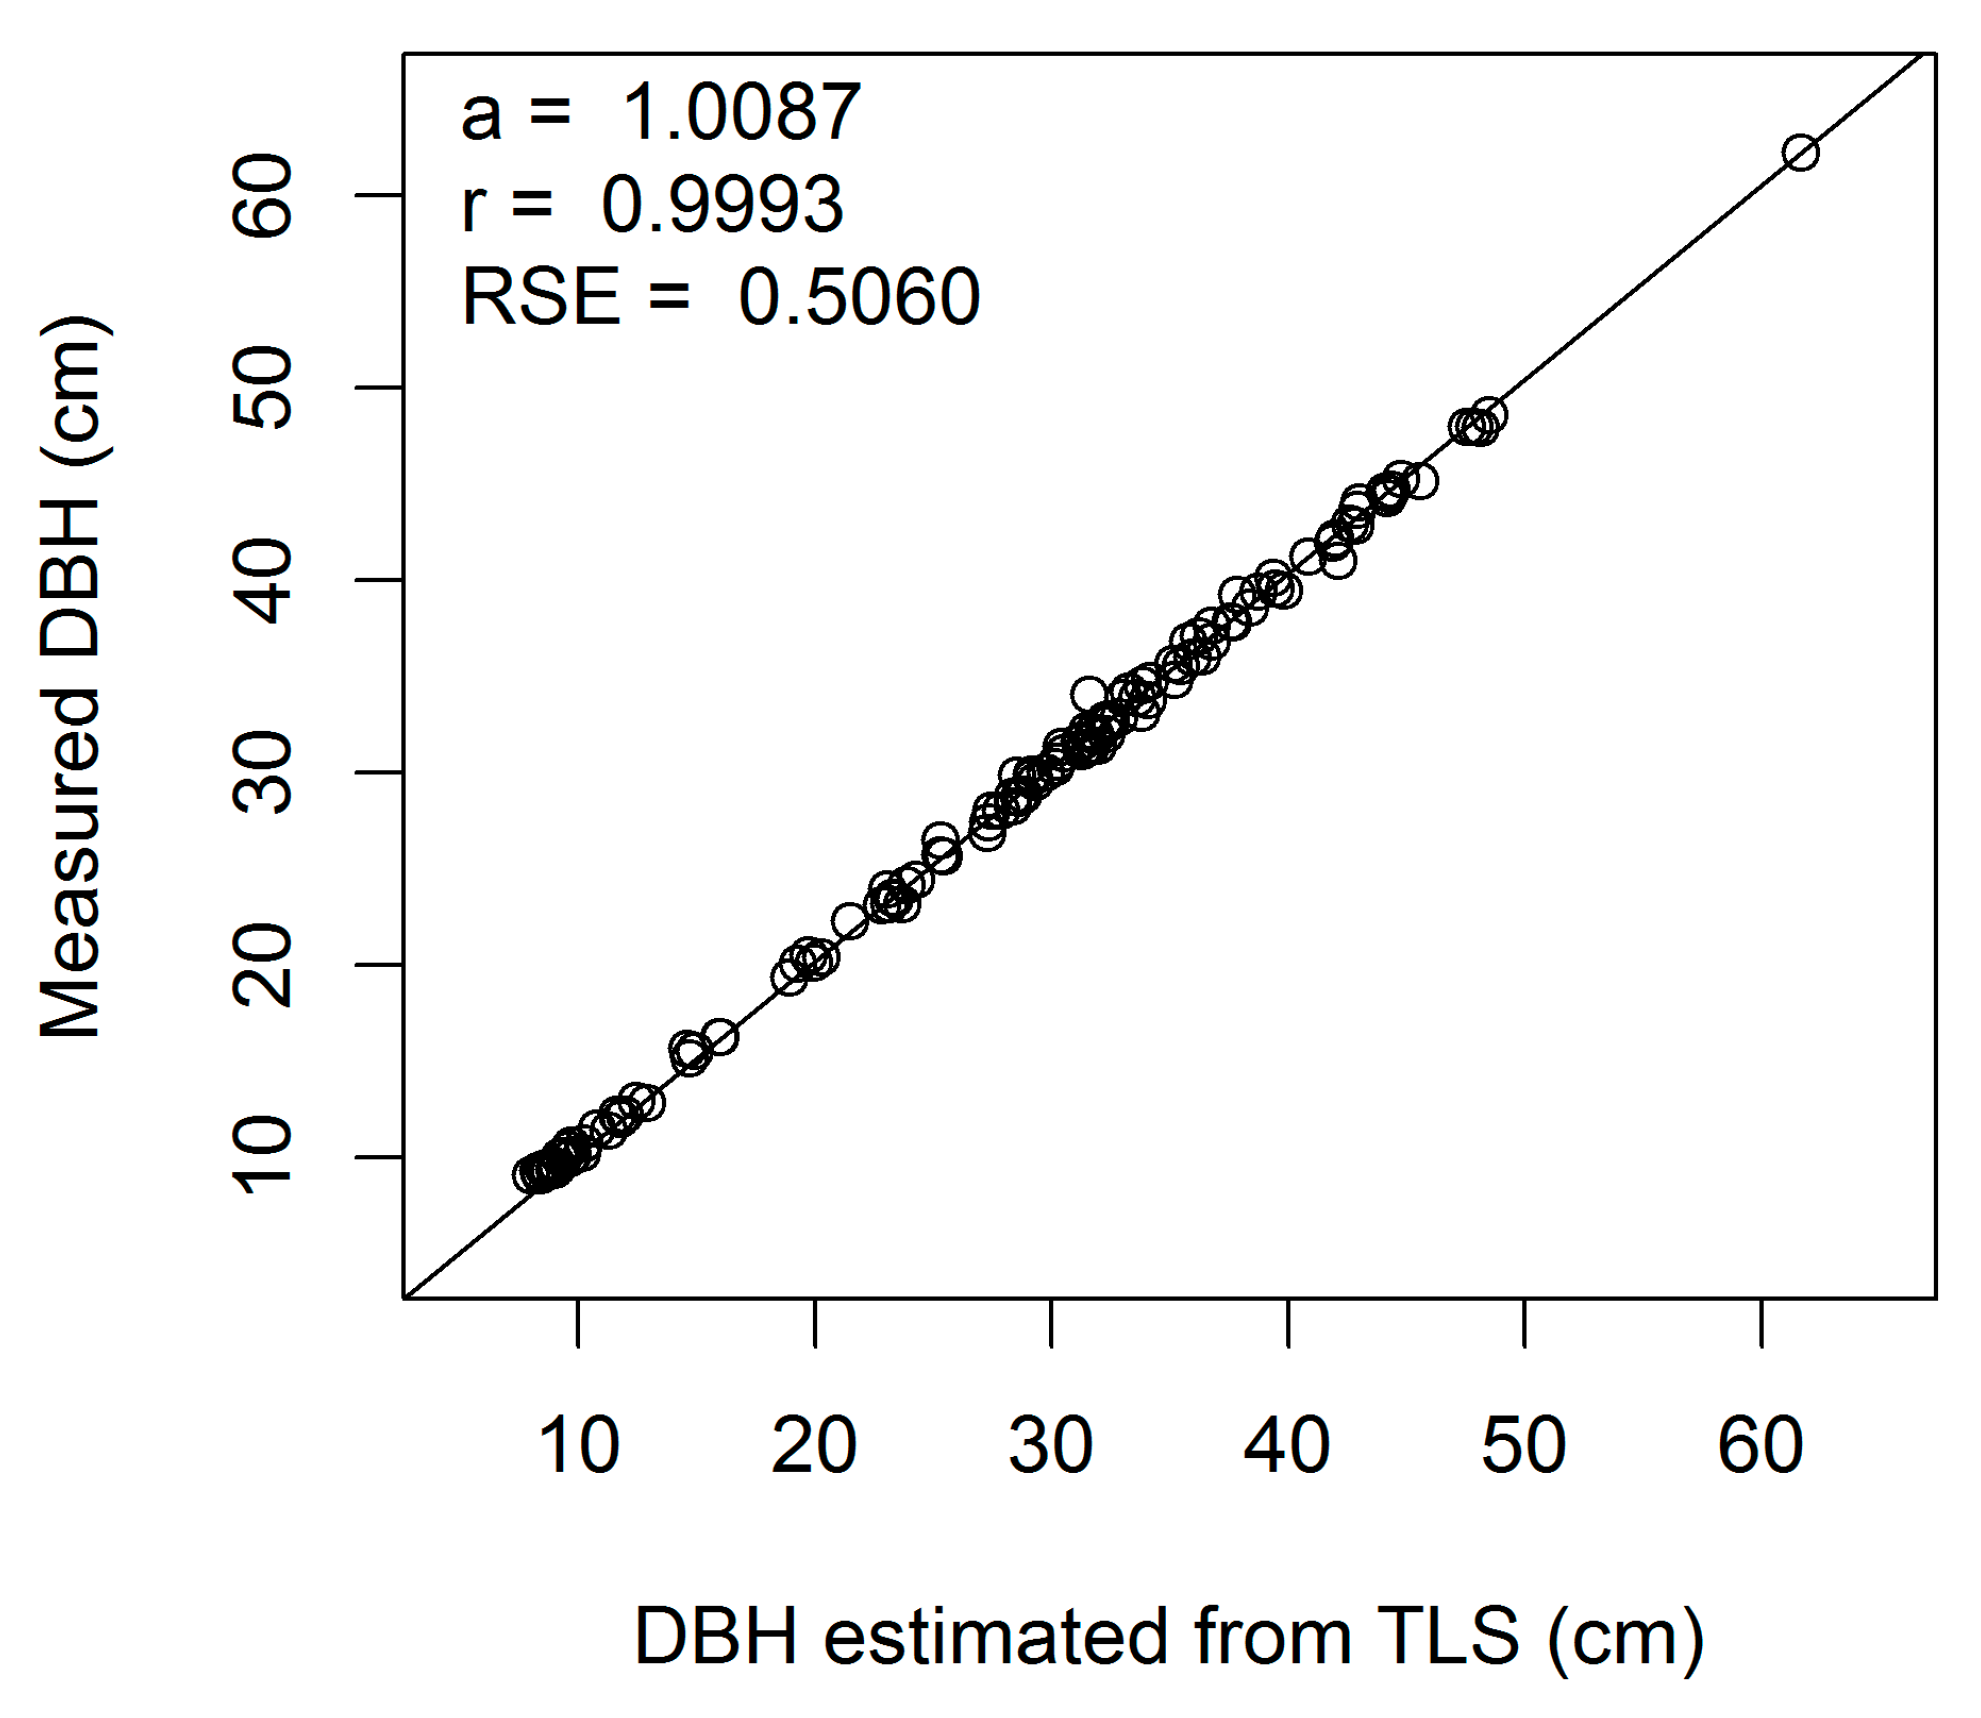
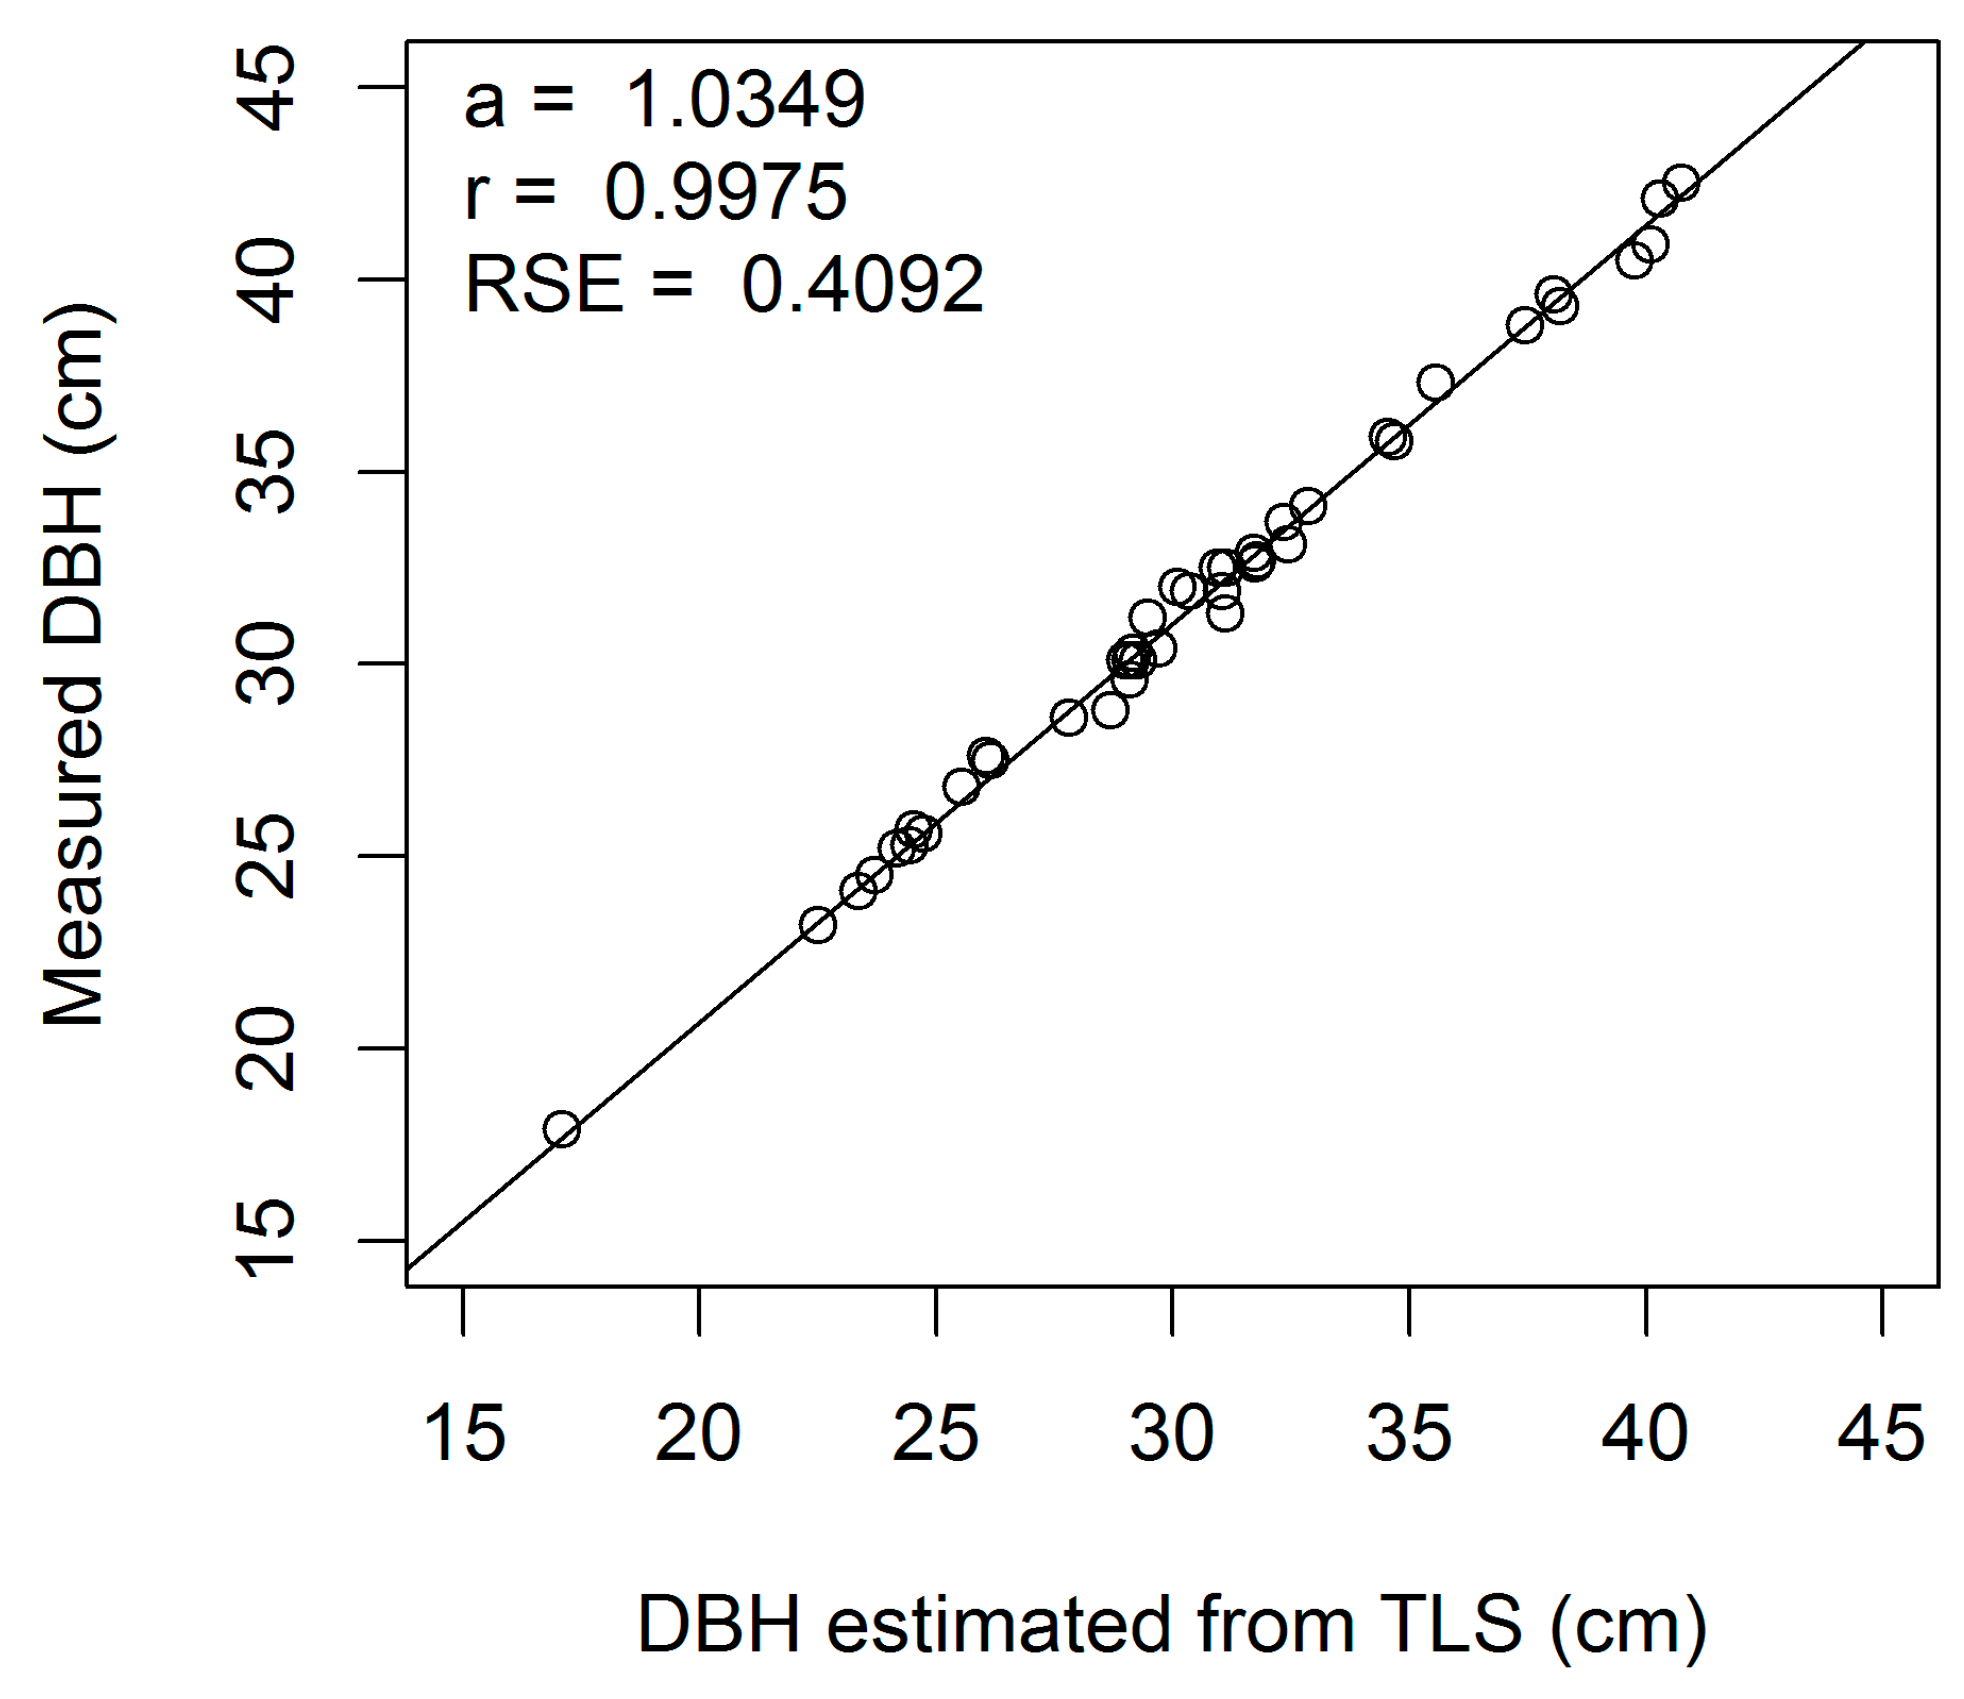
Figure A1.
Linear regression of measured on estimated DBH (cm) for European beech 1-cm cross-section (a, regression slope; r, correlation coefficient; RSE, residual standard error).
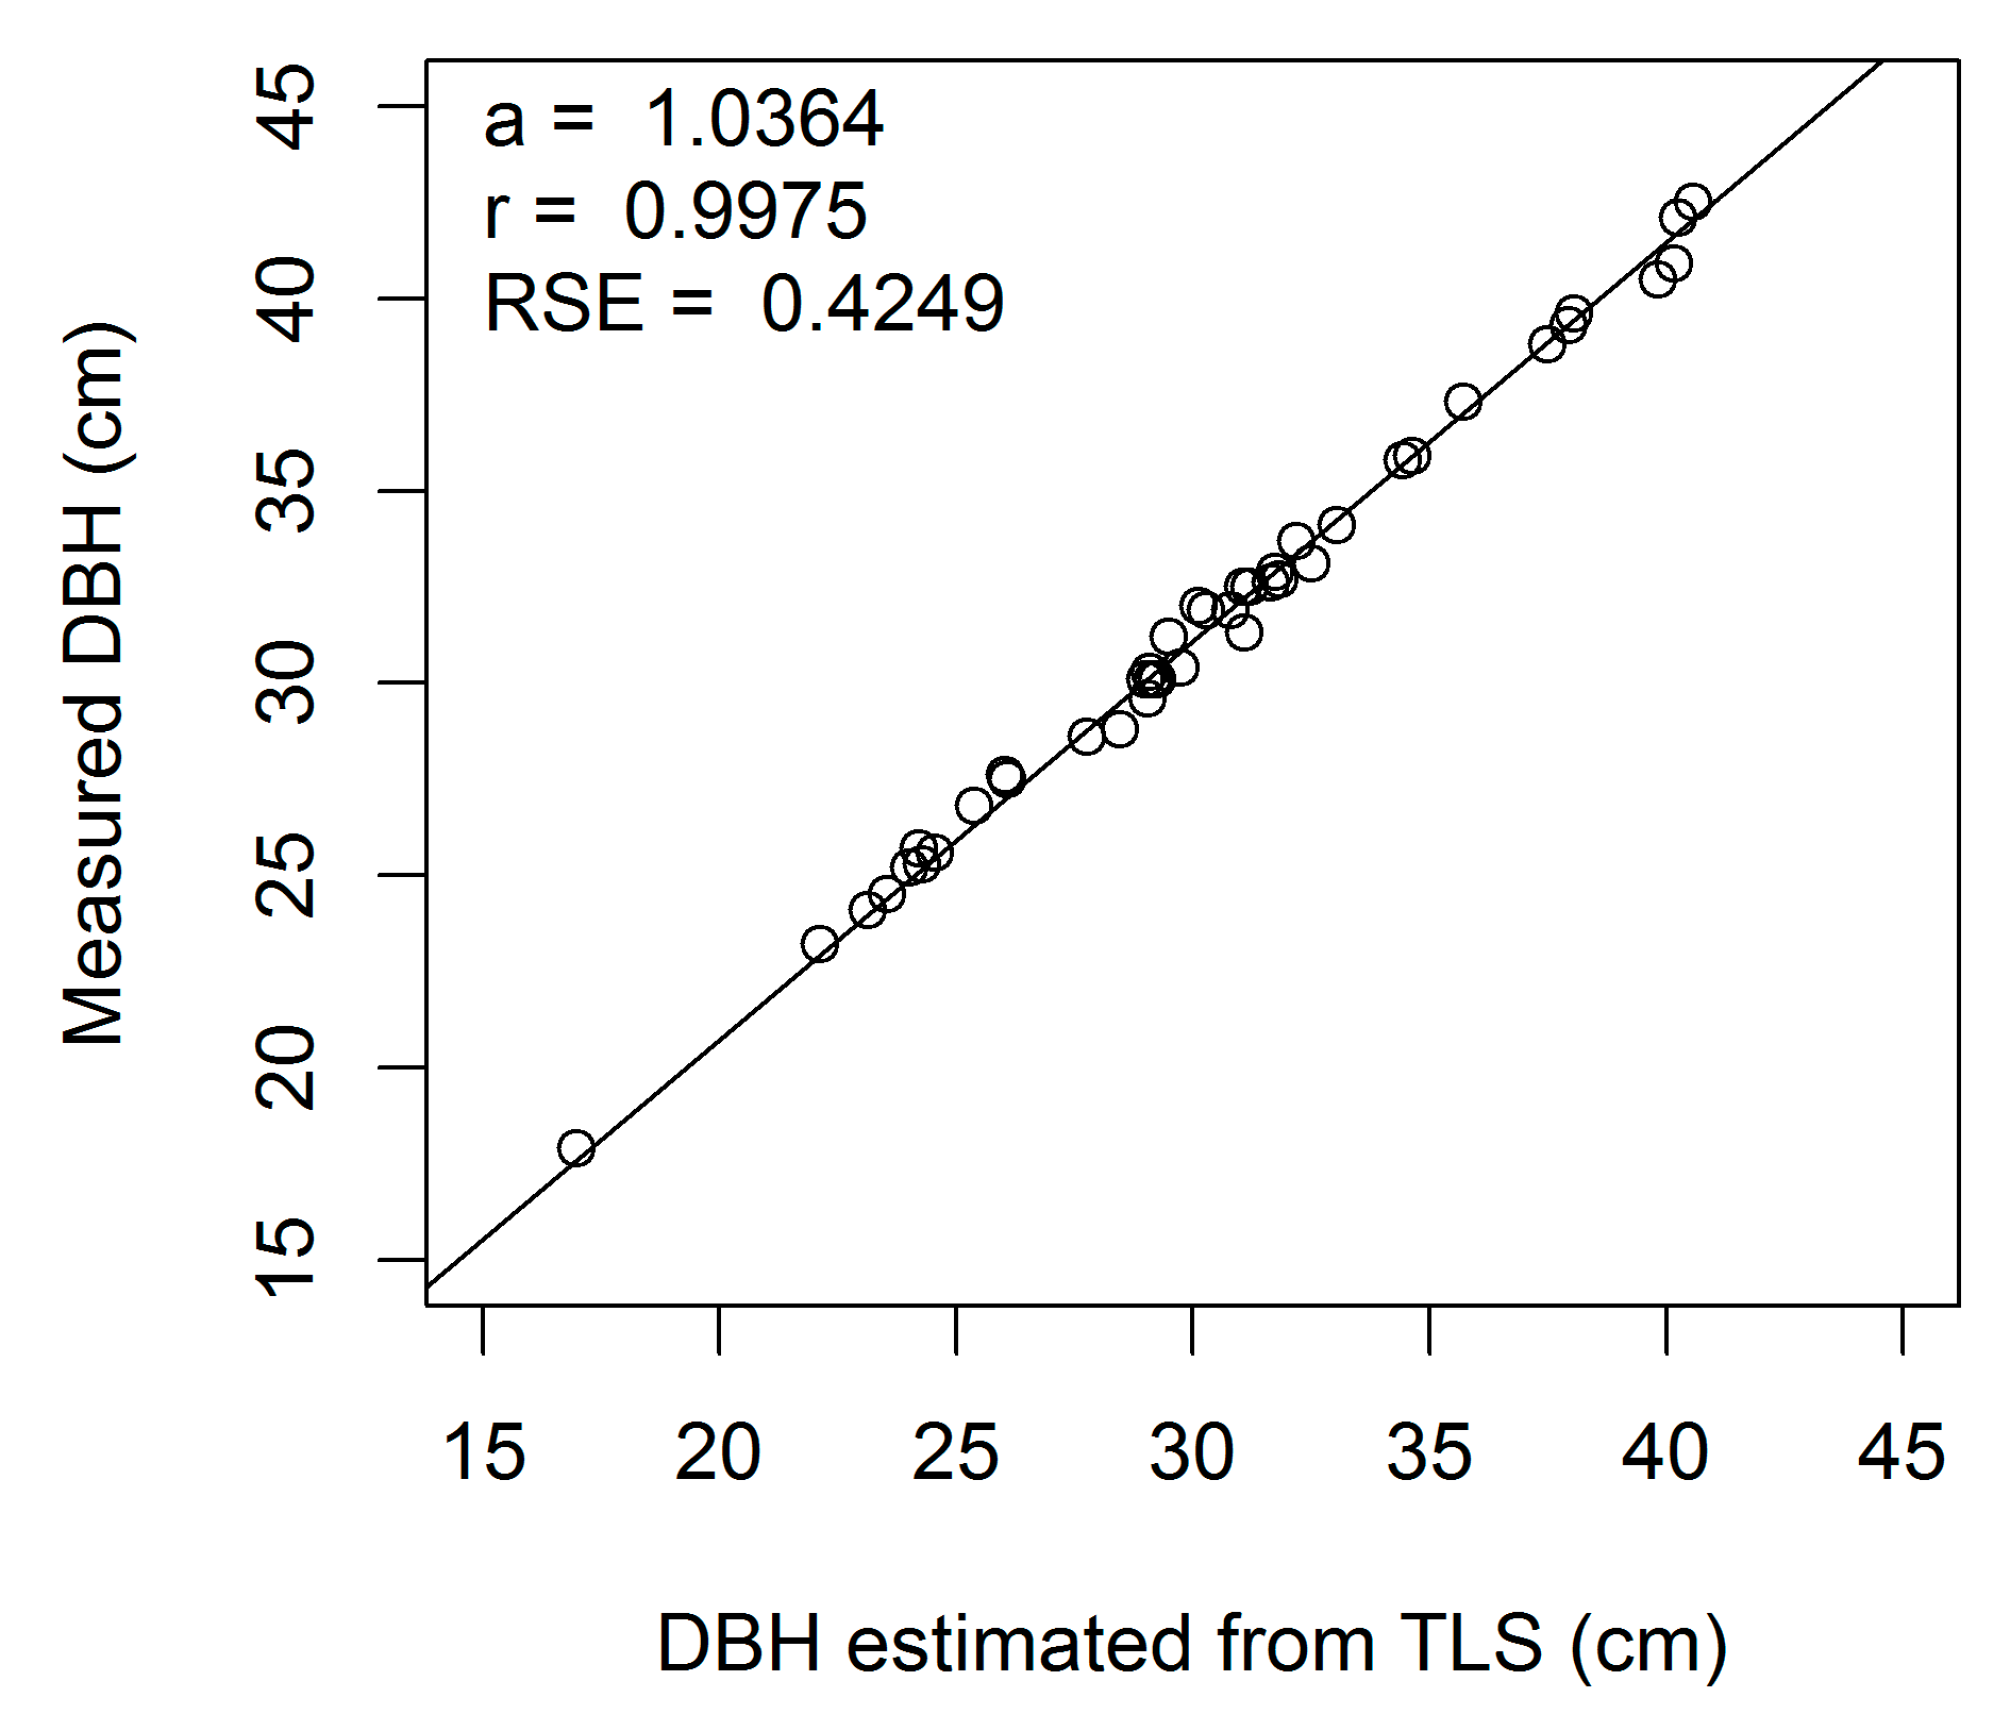
Figure A1.
Linear regression of measured on estimated DBH (cm) for European beech 1-cm cross-section (a, regression slope; r, correlation coefficient; RSE, residual standard error).
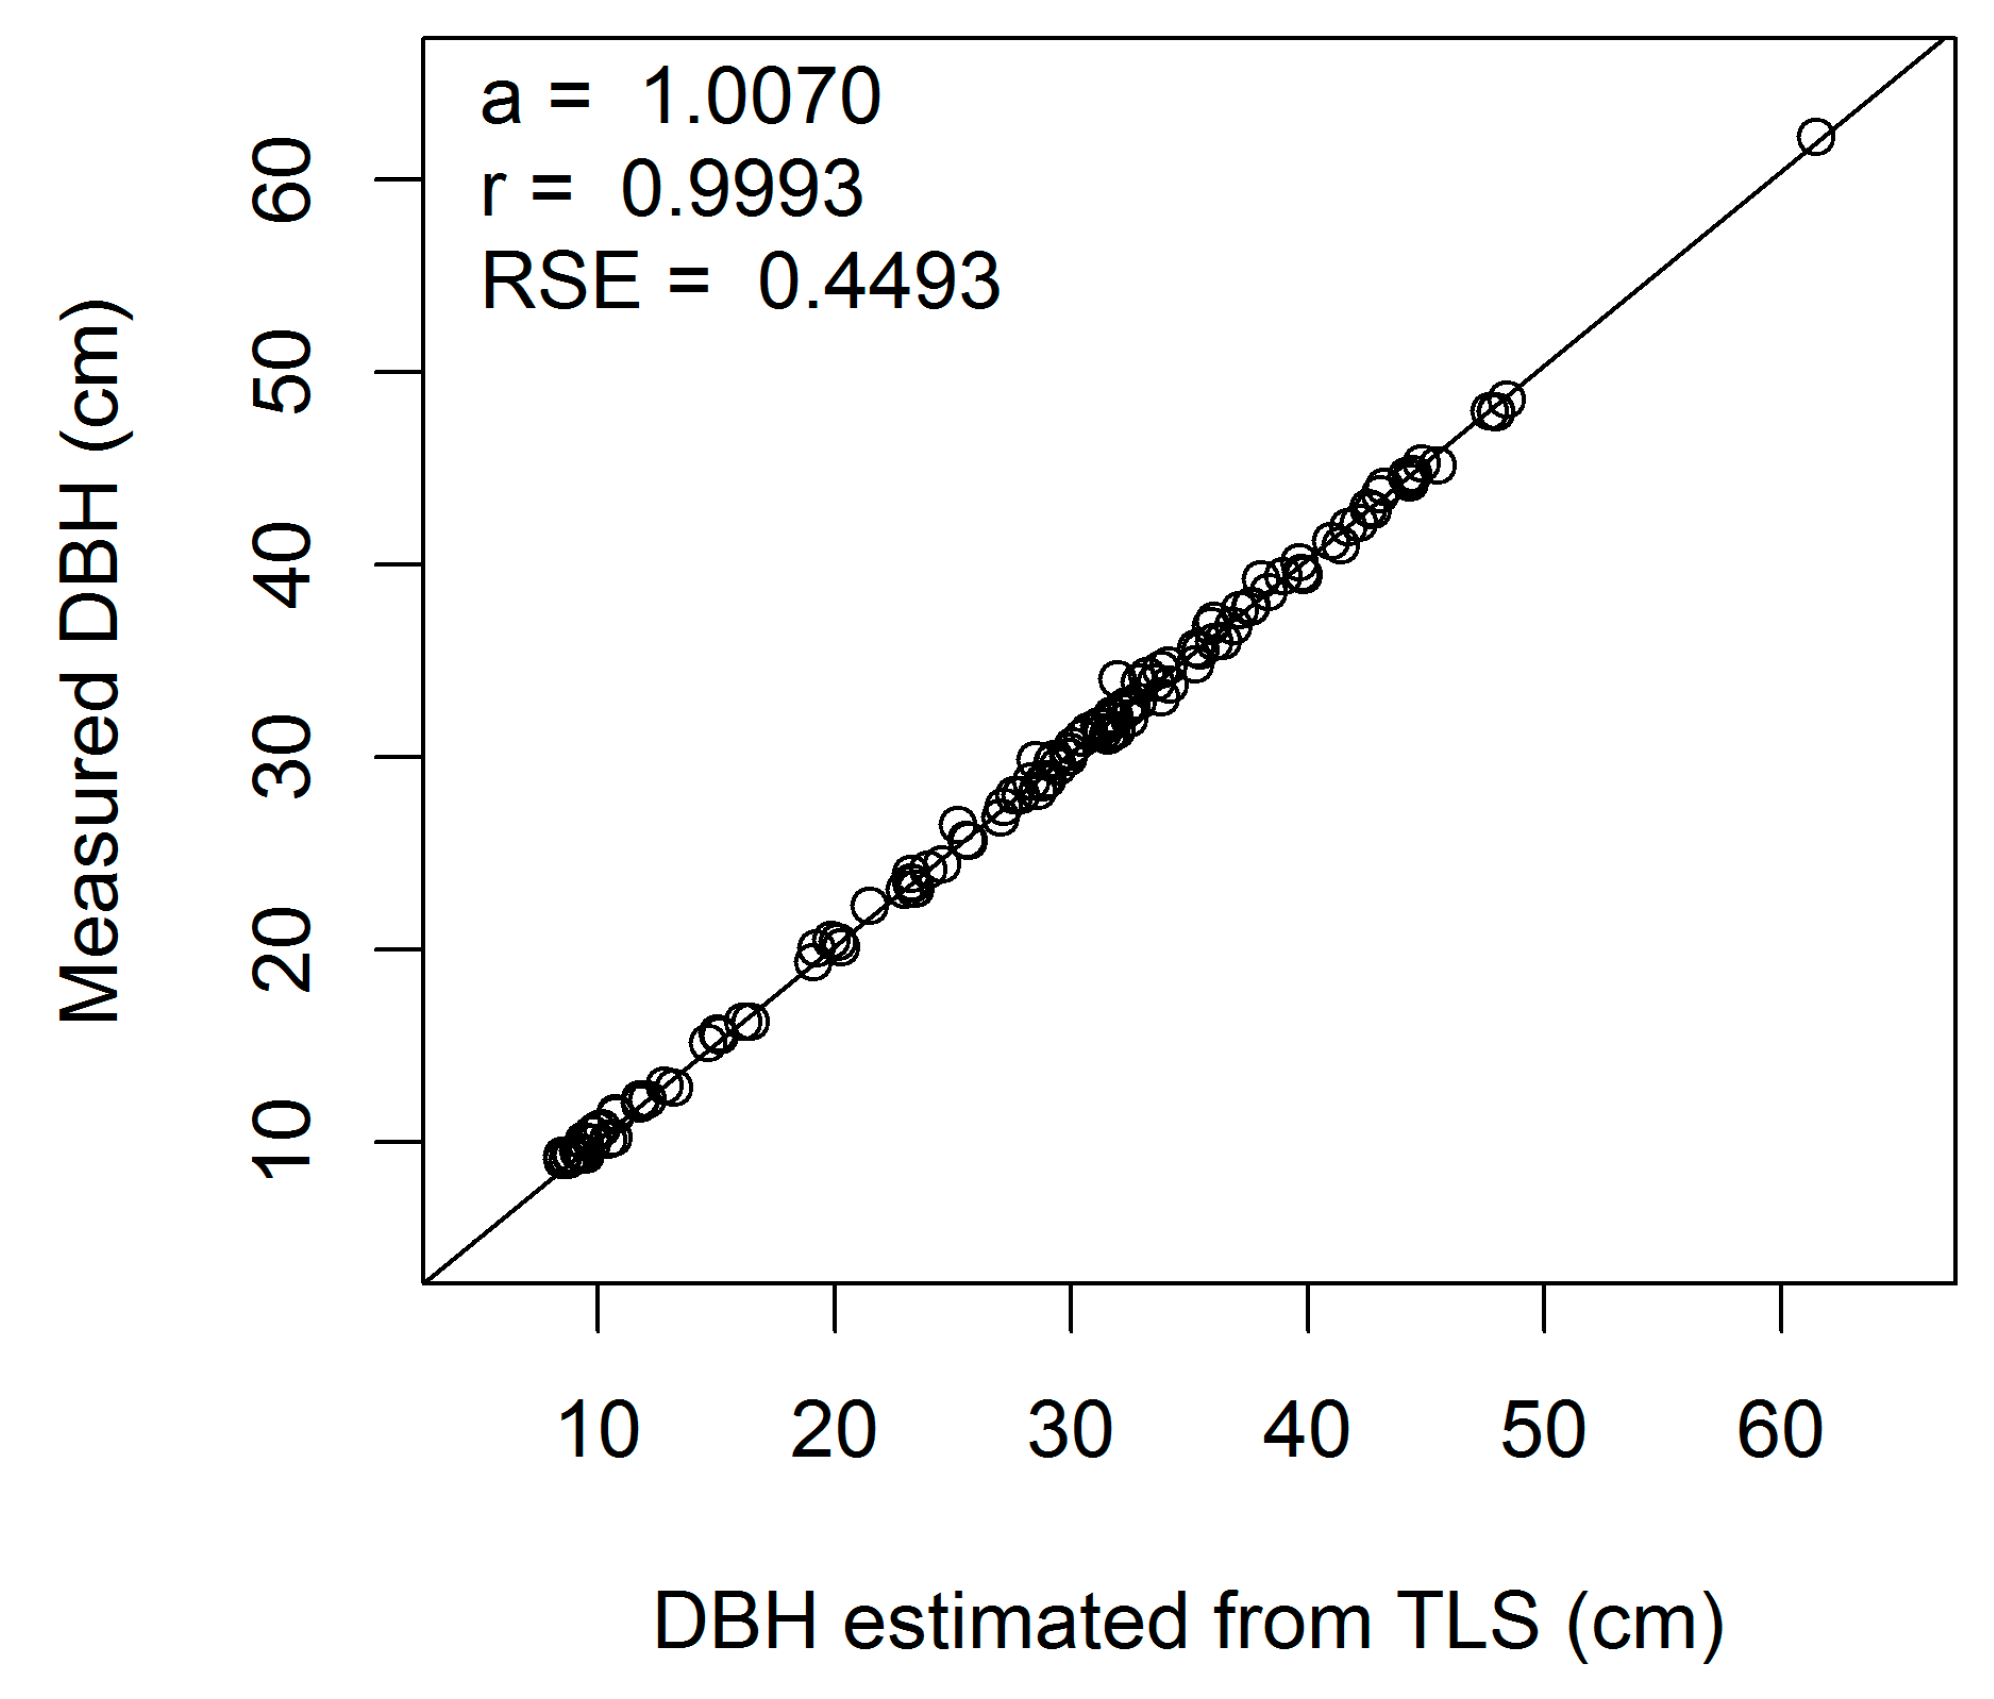
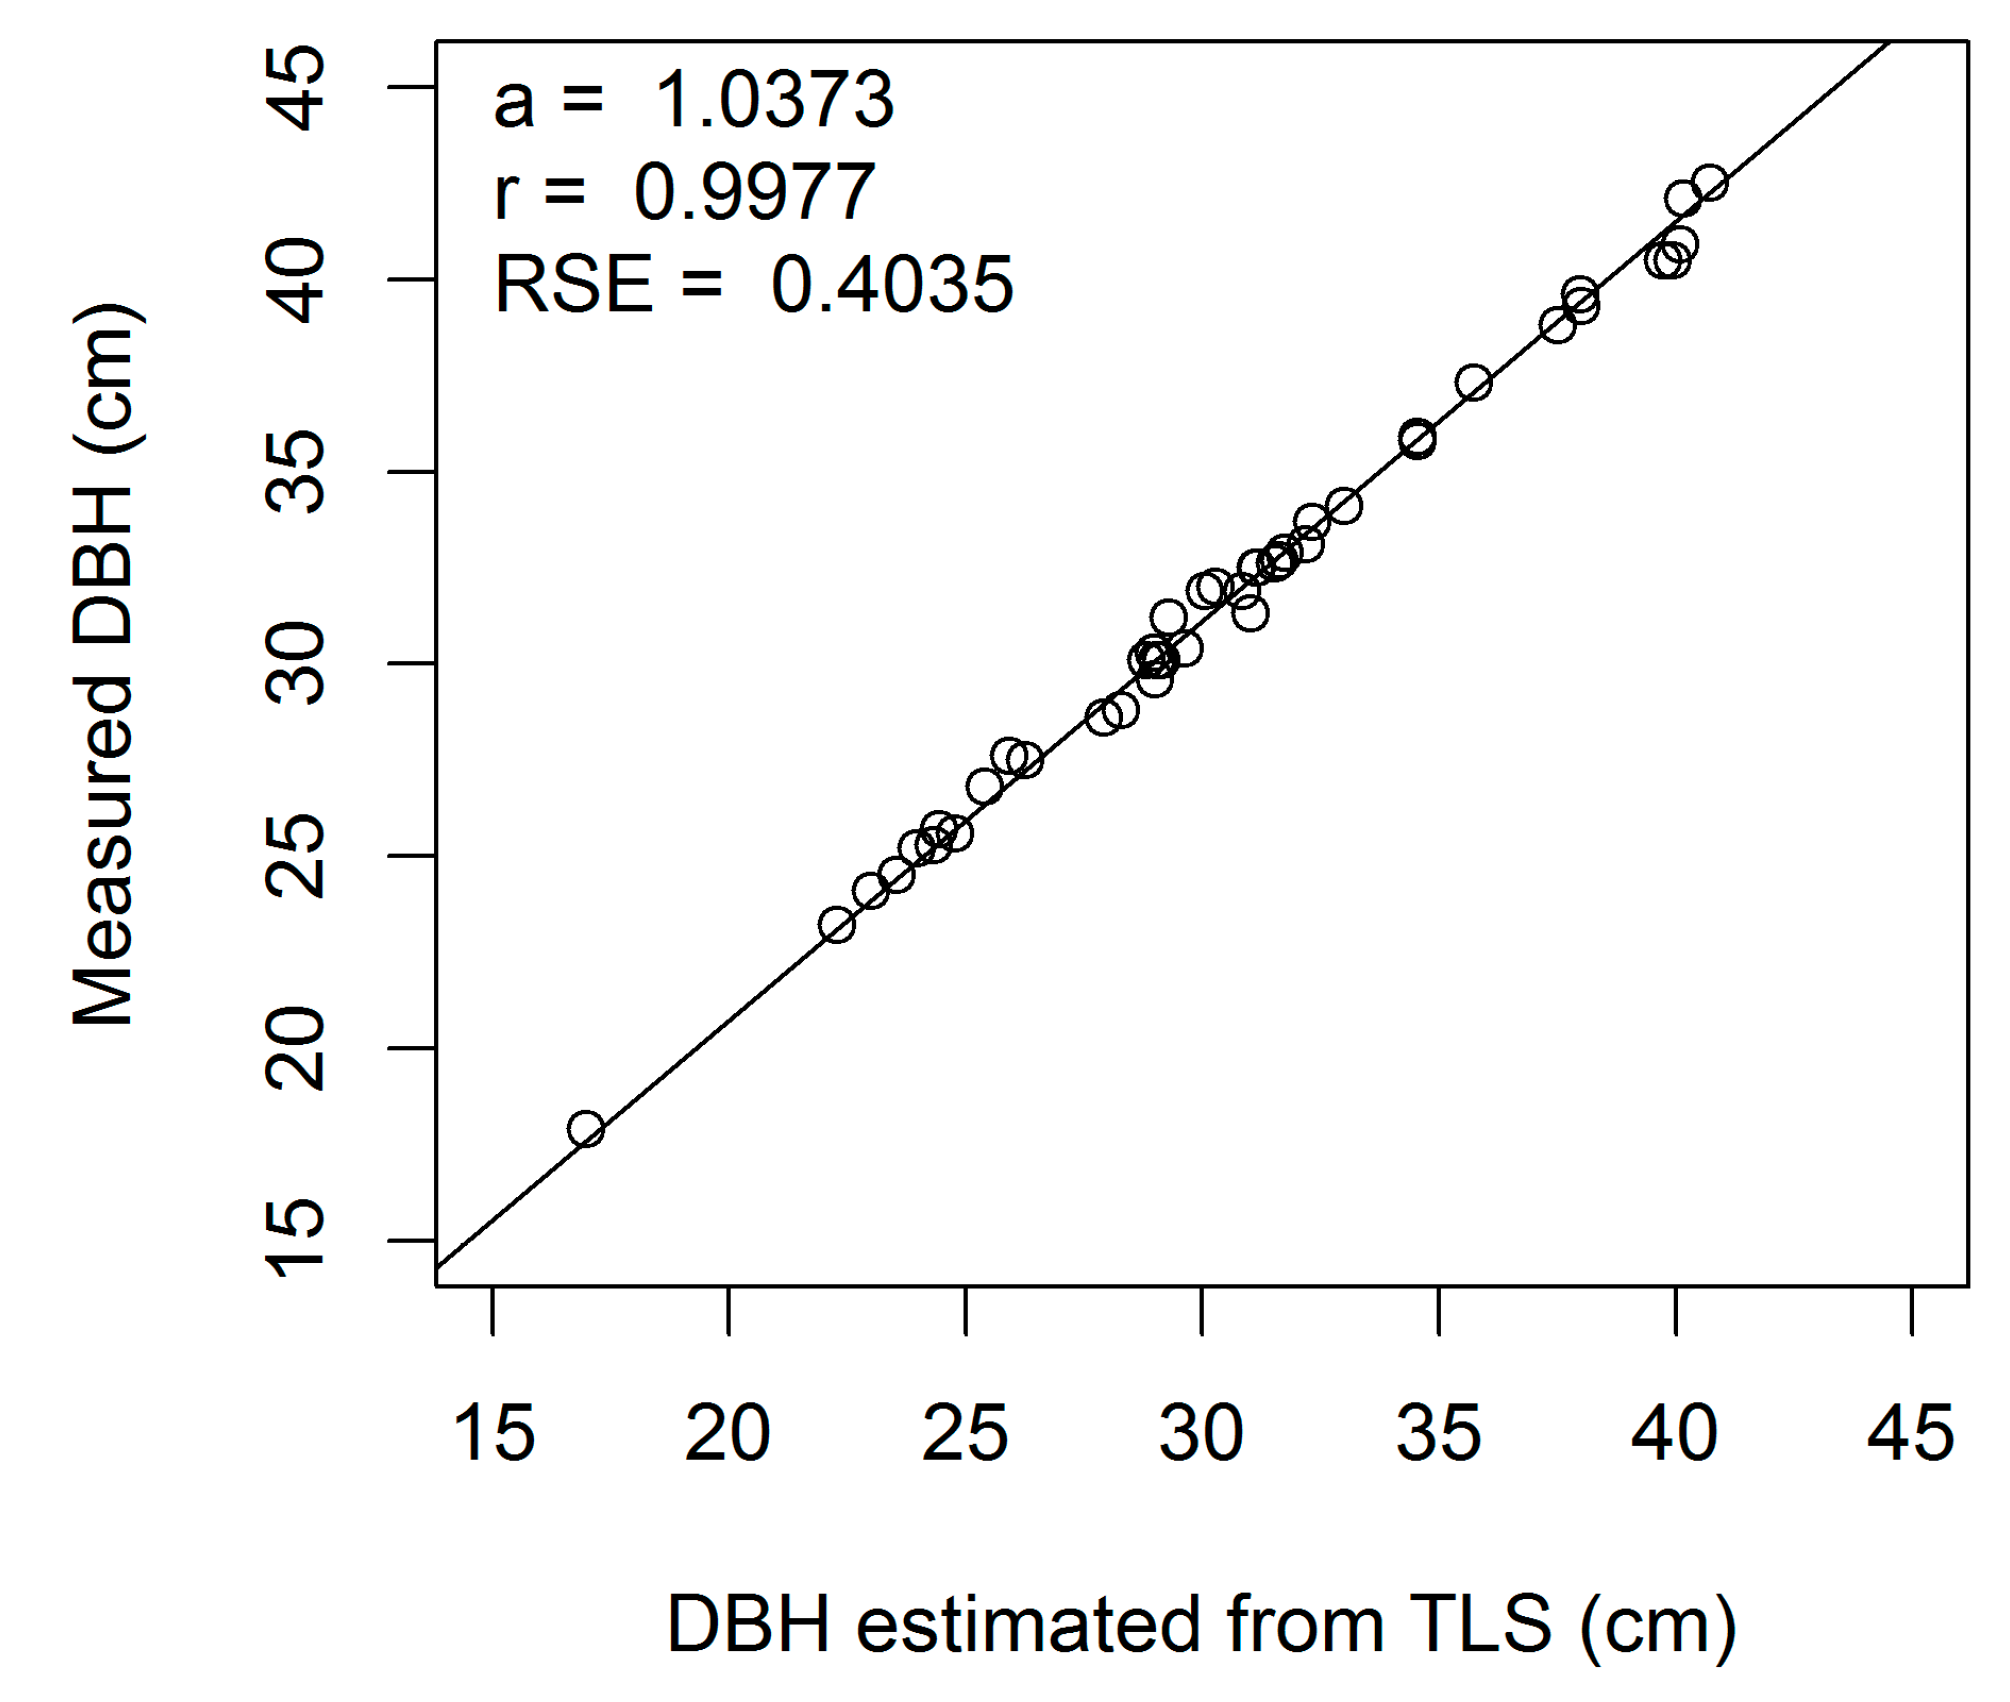
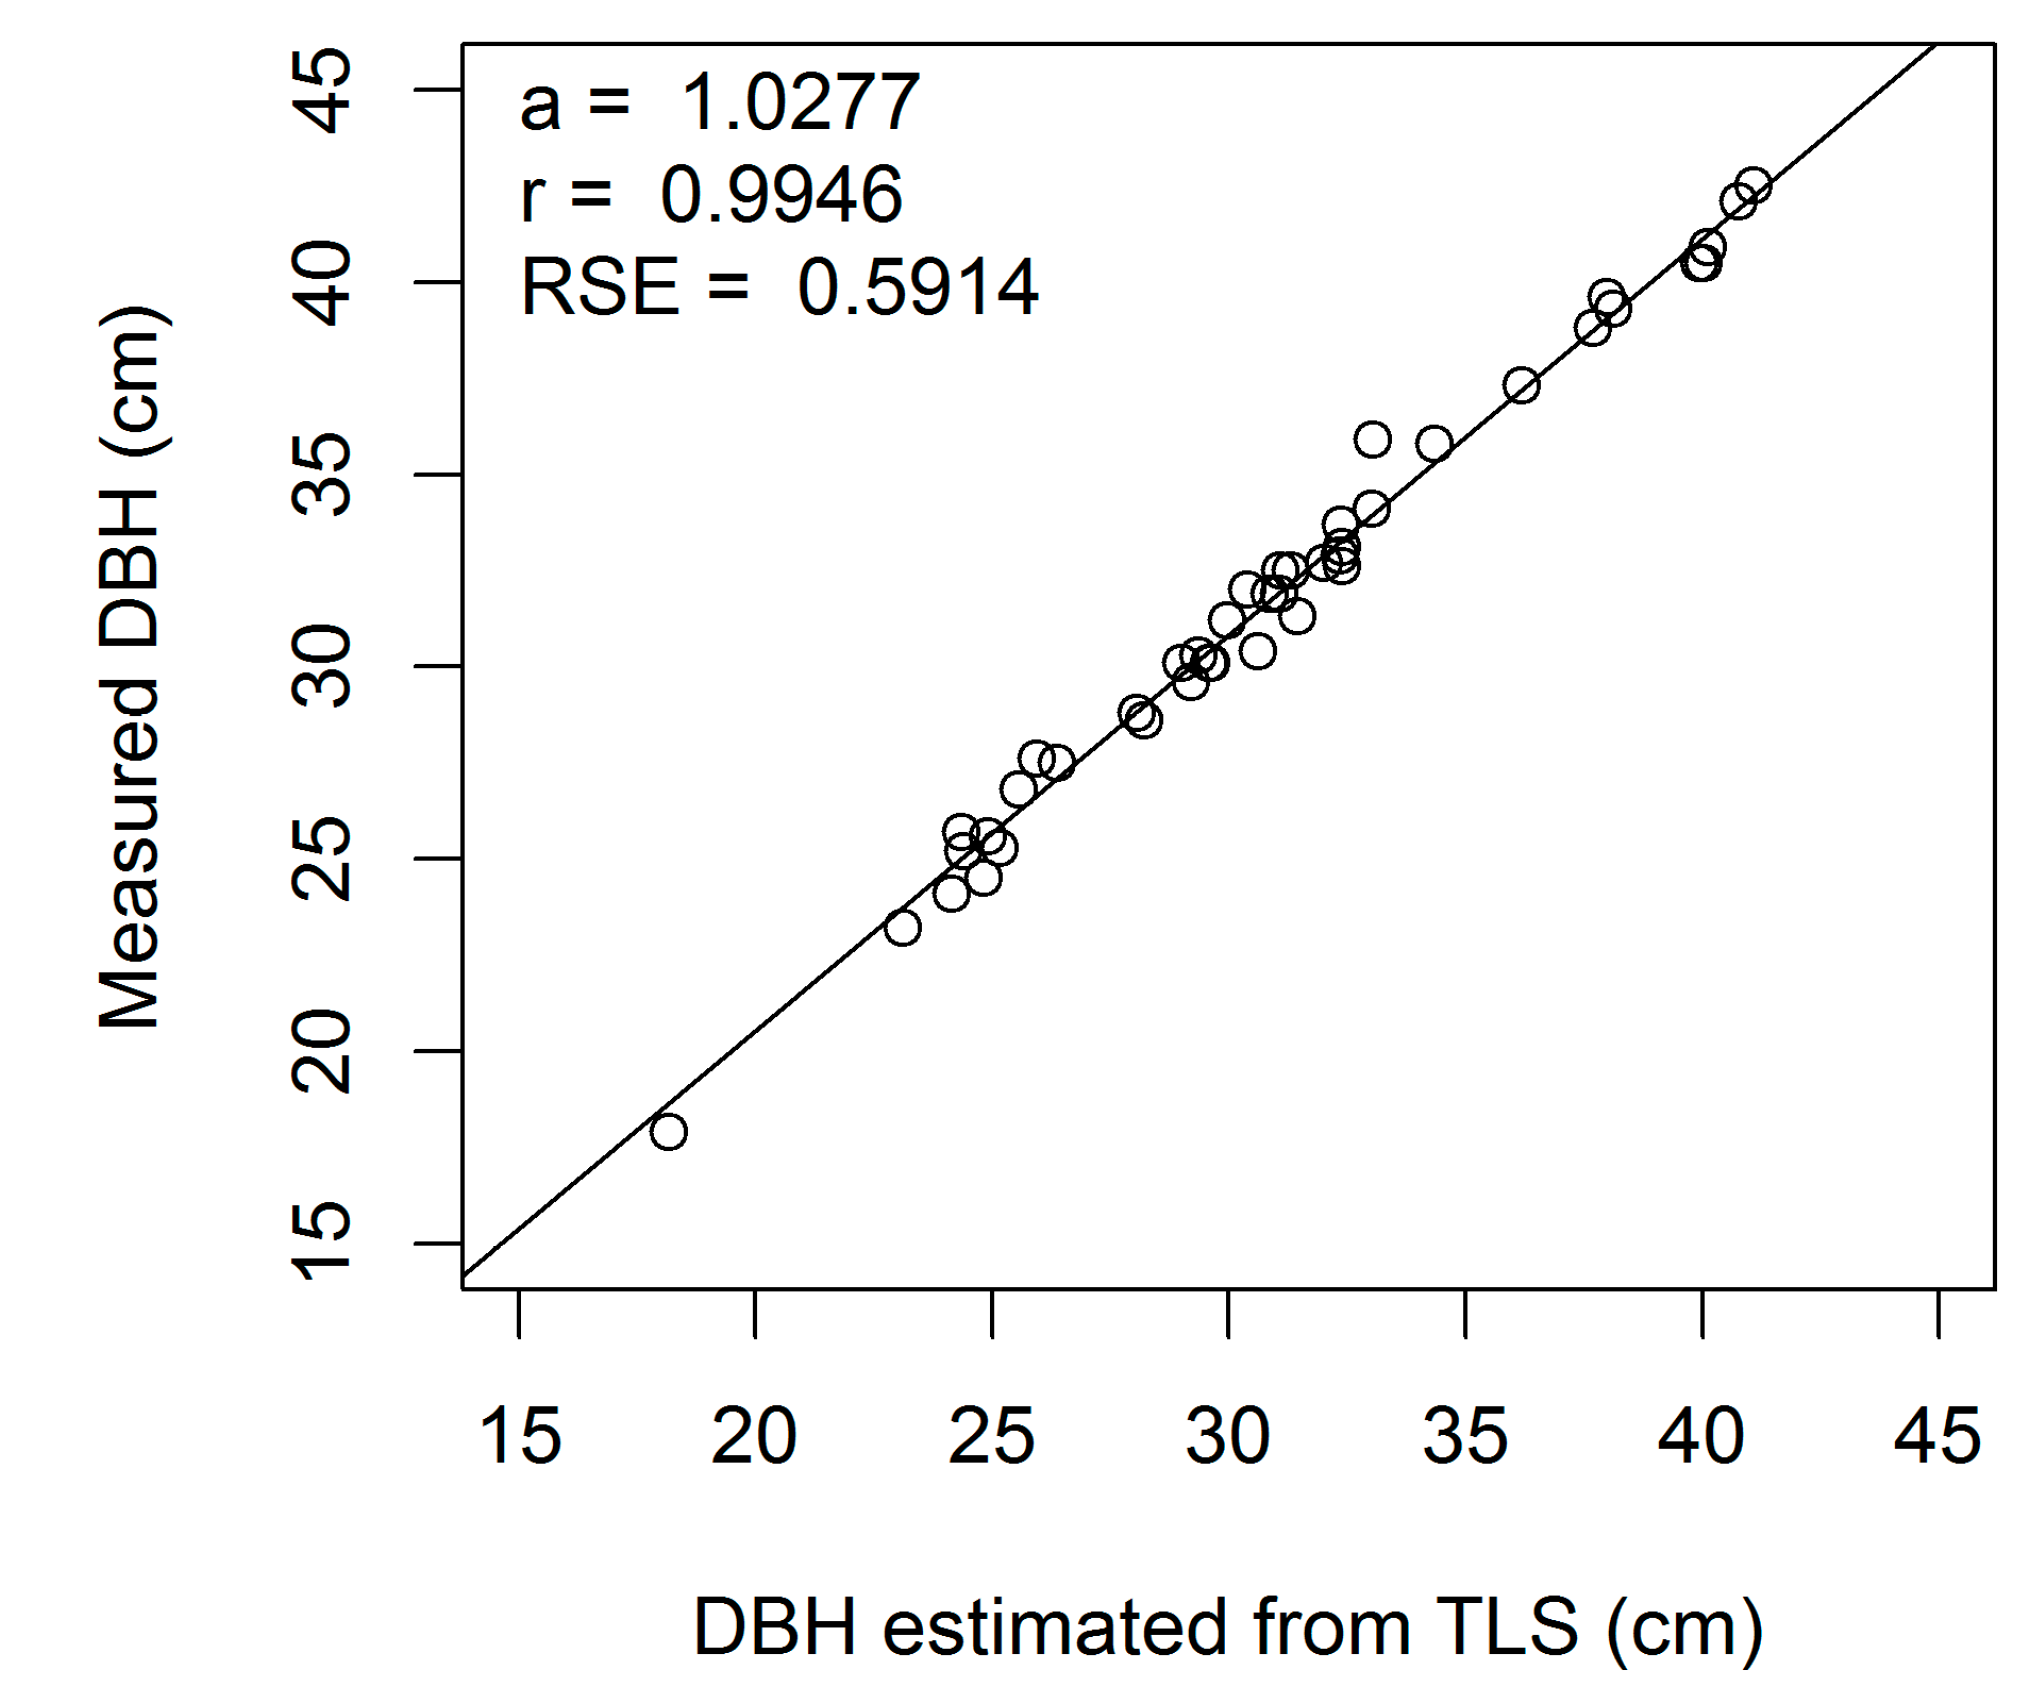
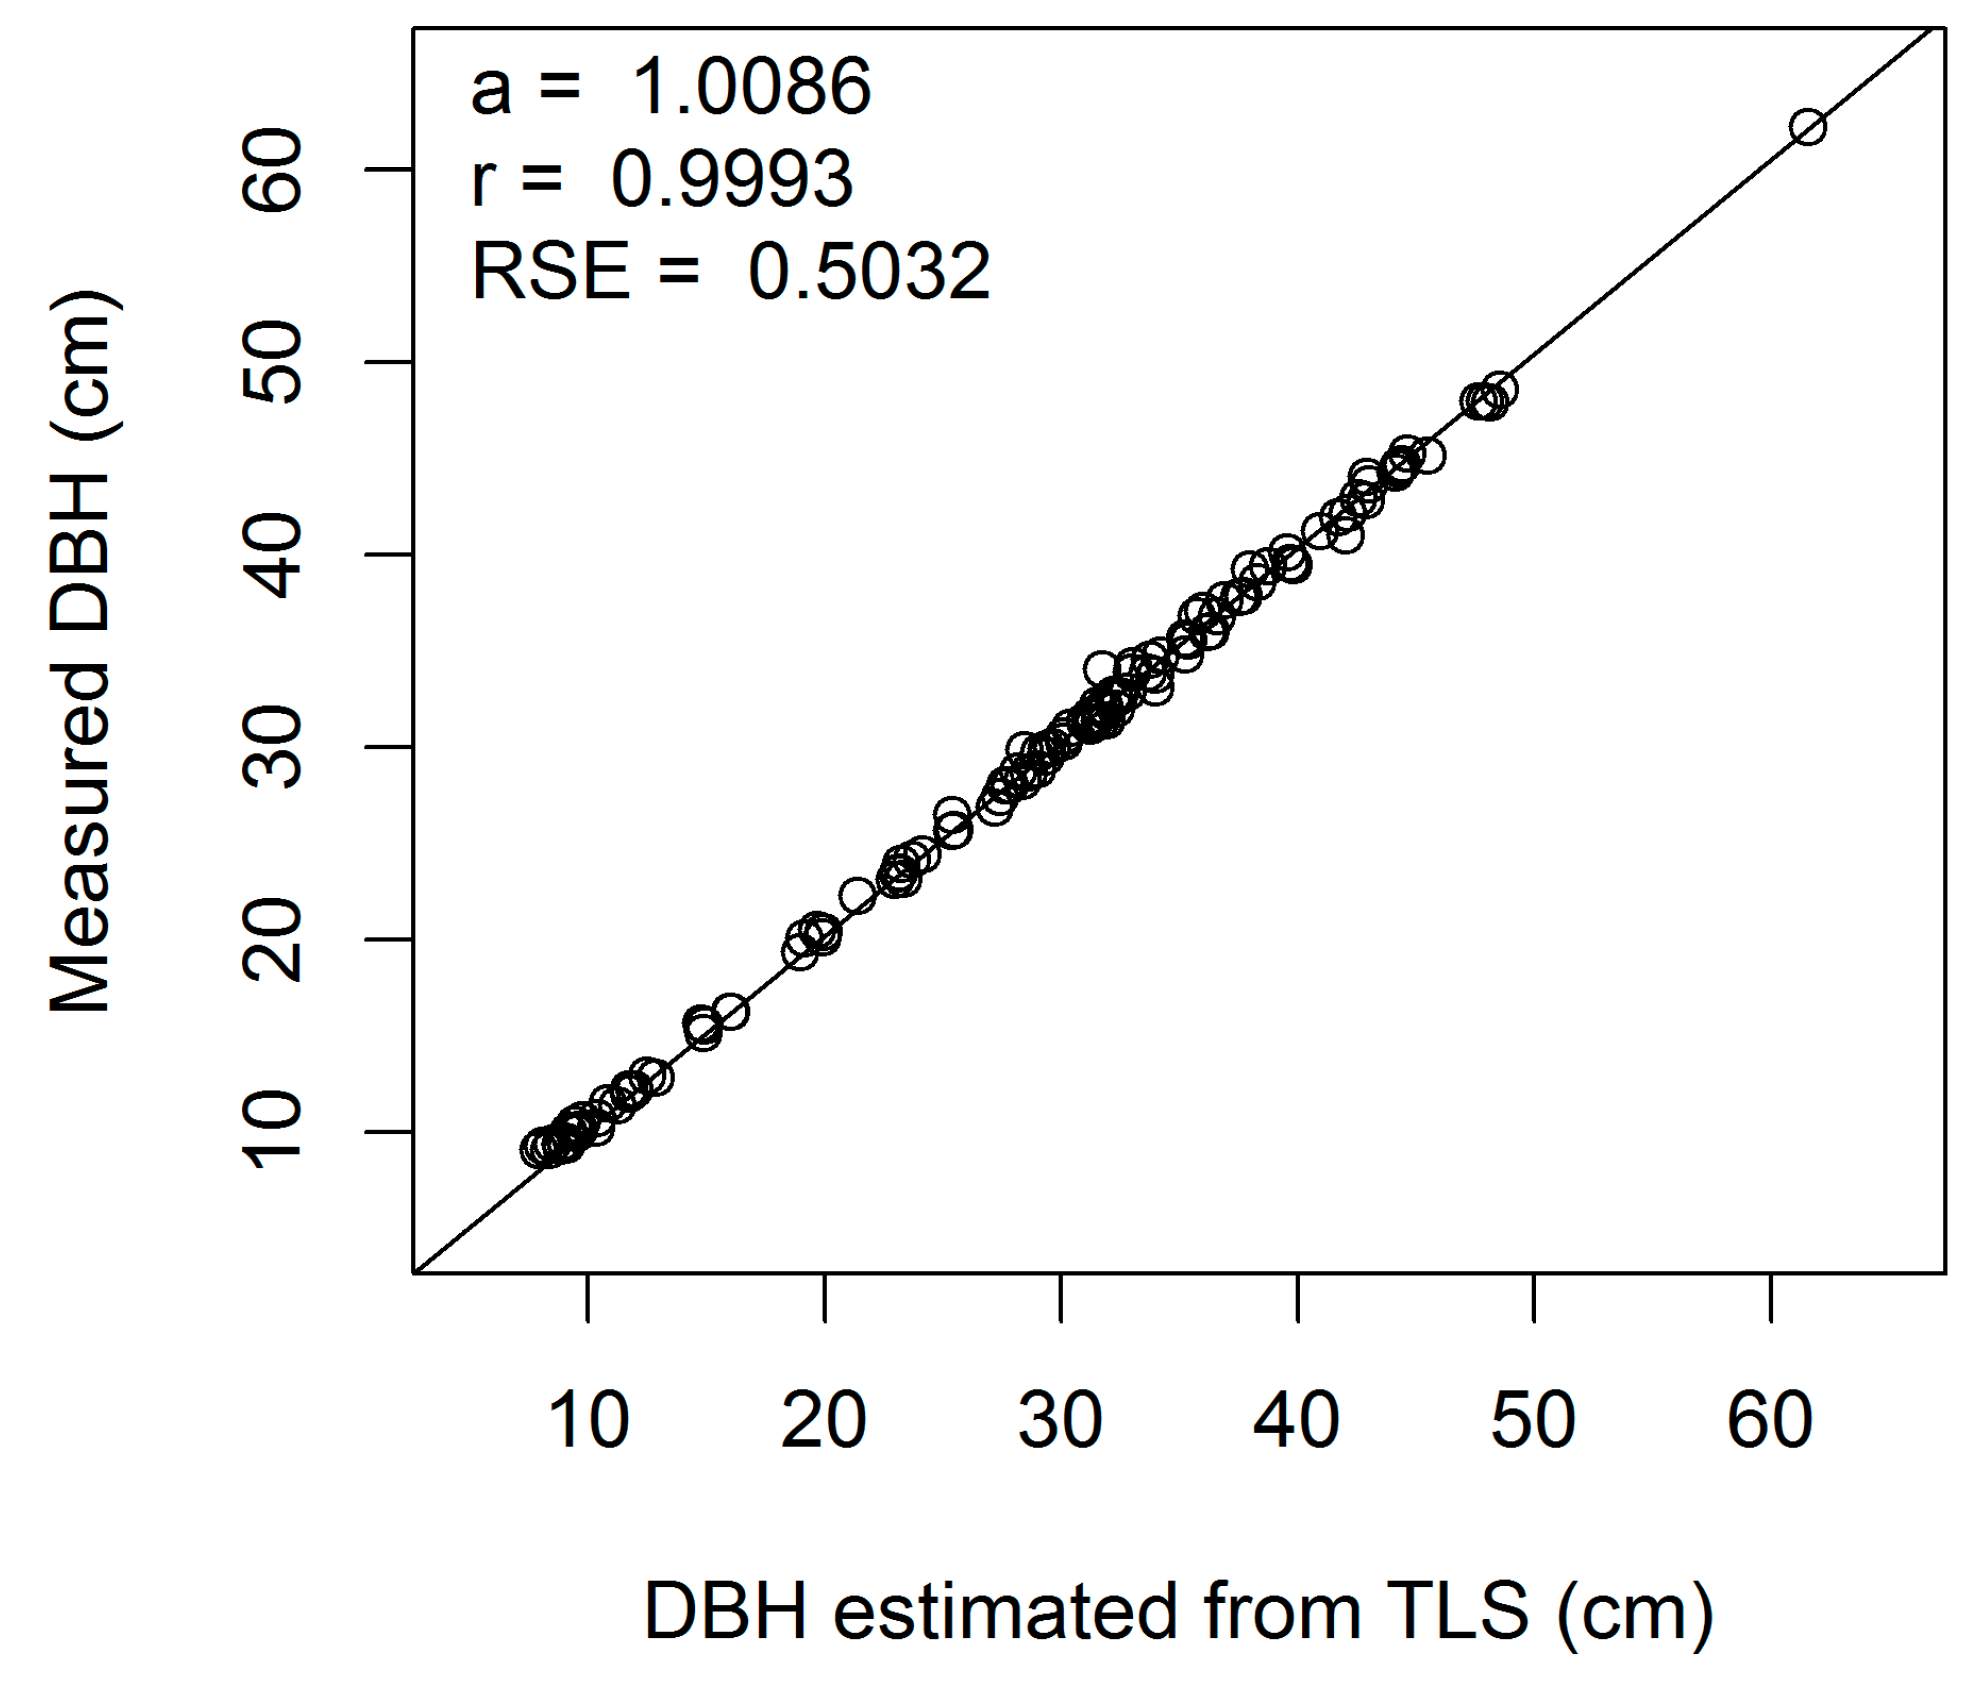
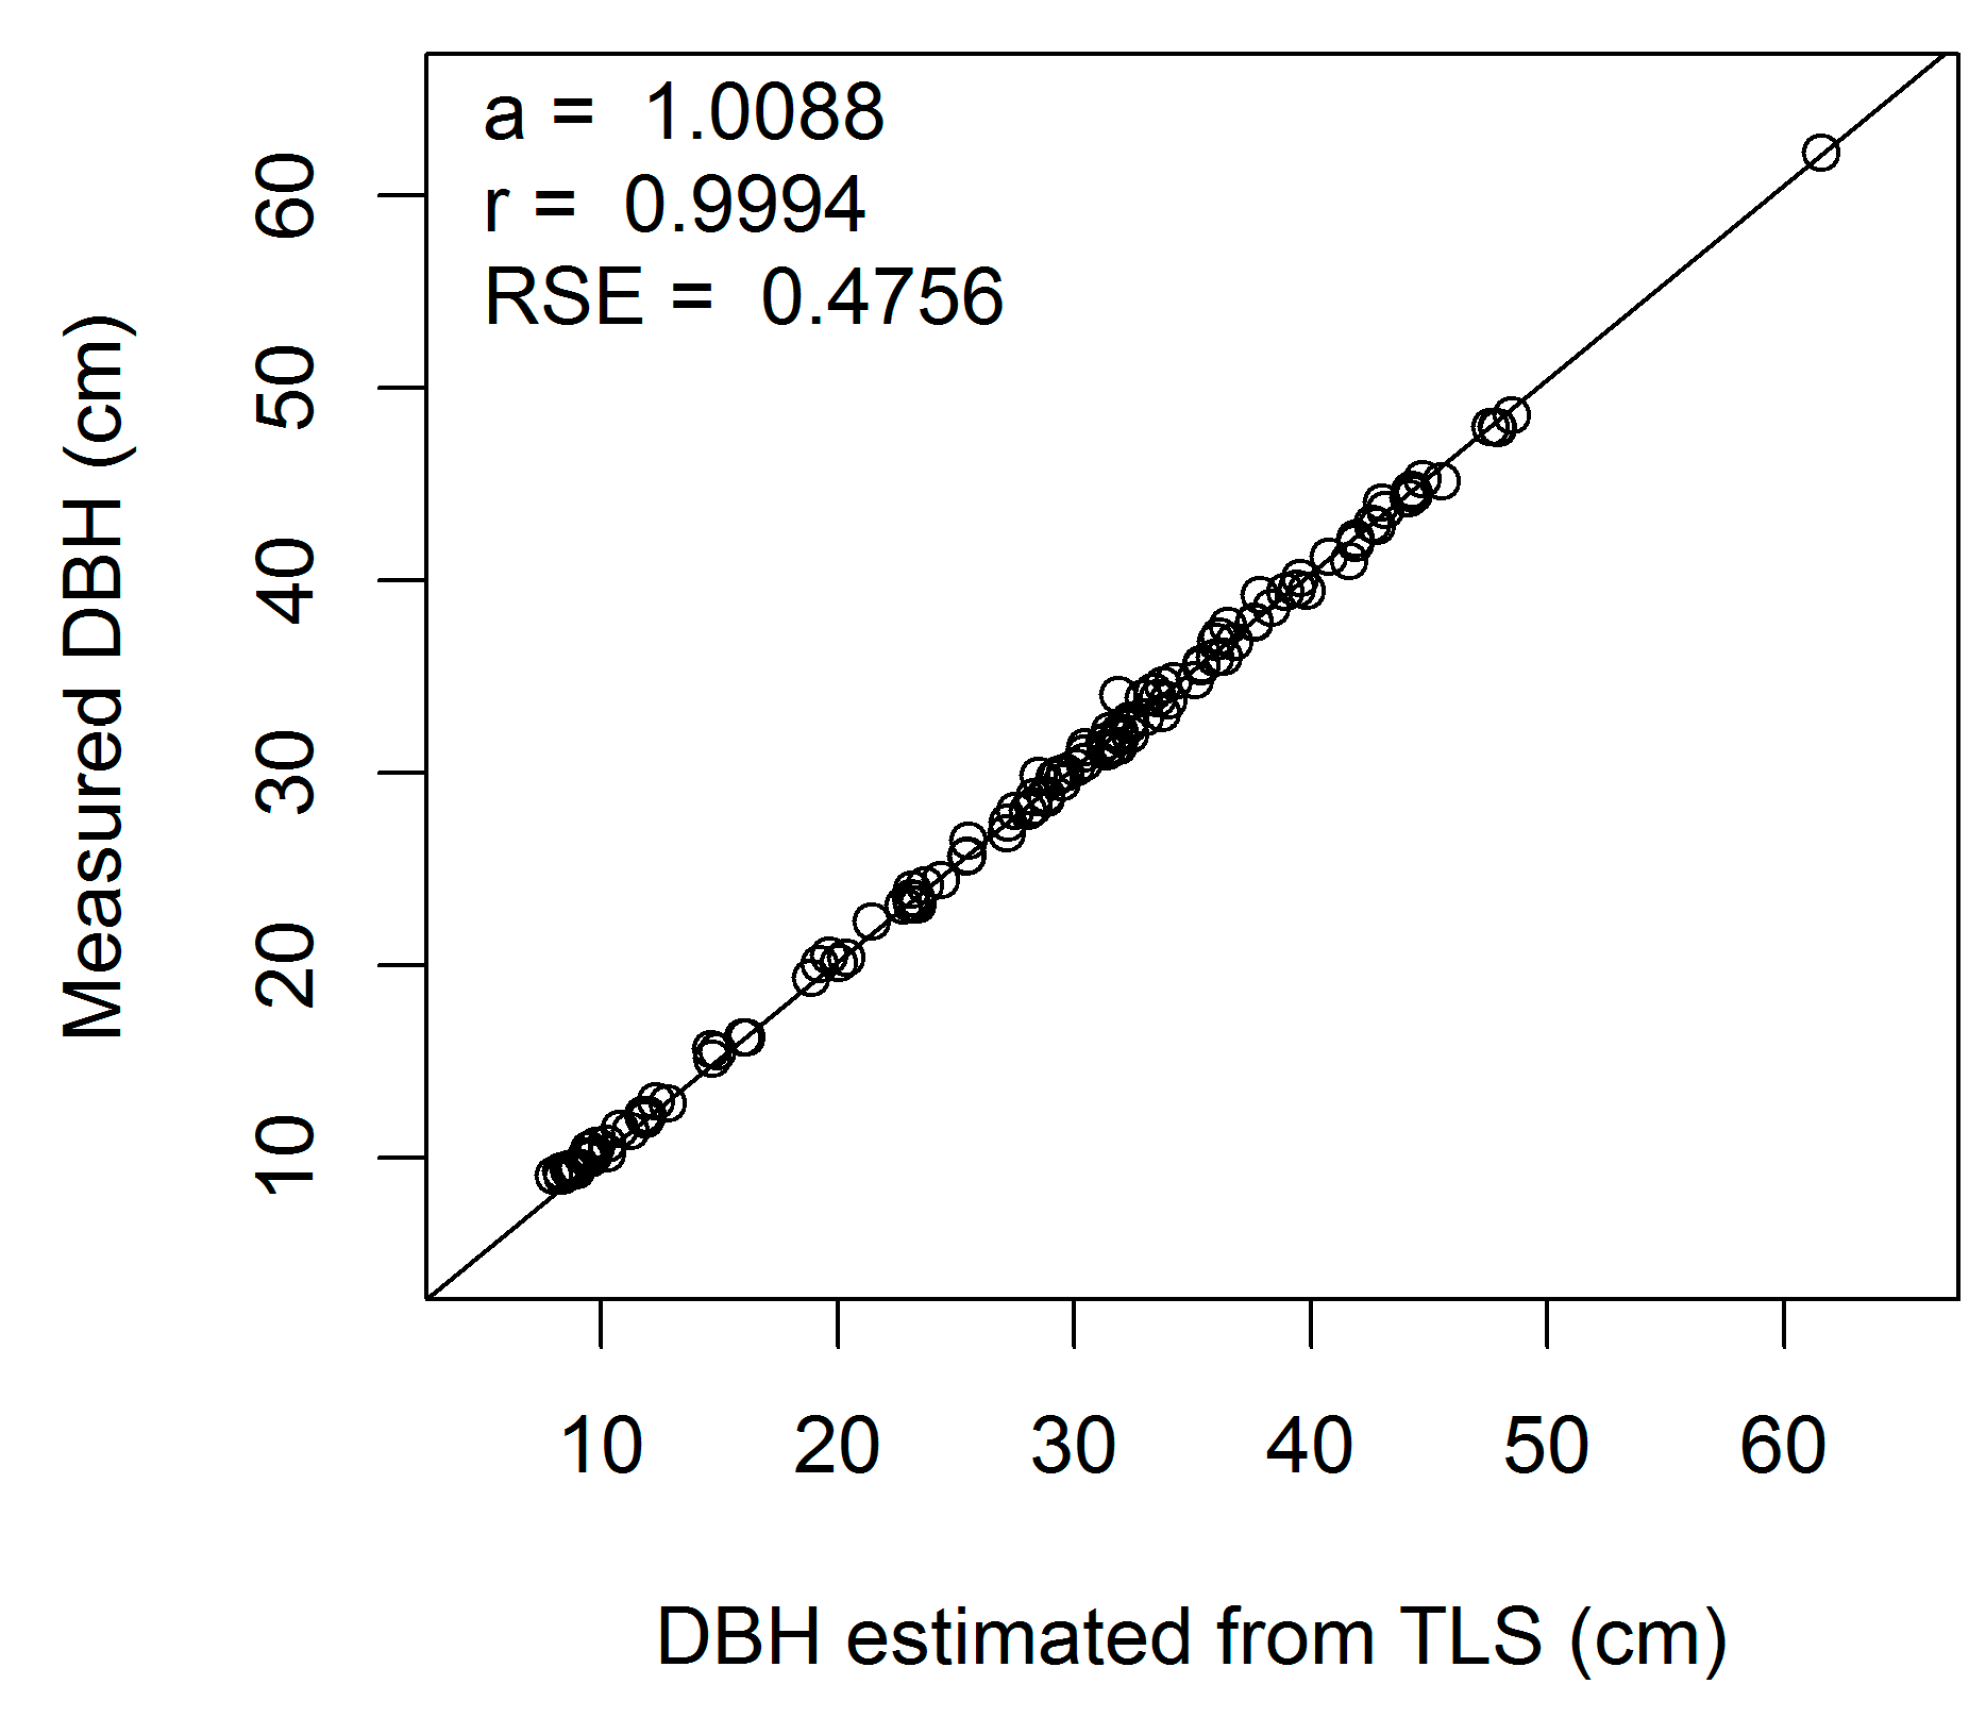
Figure A2.
Linear regression of measured on estimated DBH (cm) for European beech 2-cm cross-section (a, regression slope; r, correlation coefficient; RSE, residual standard error).
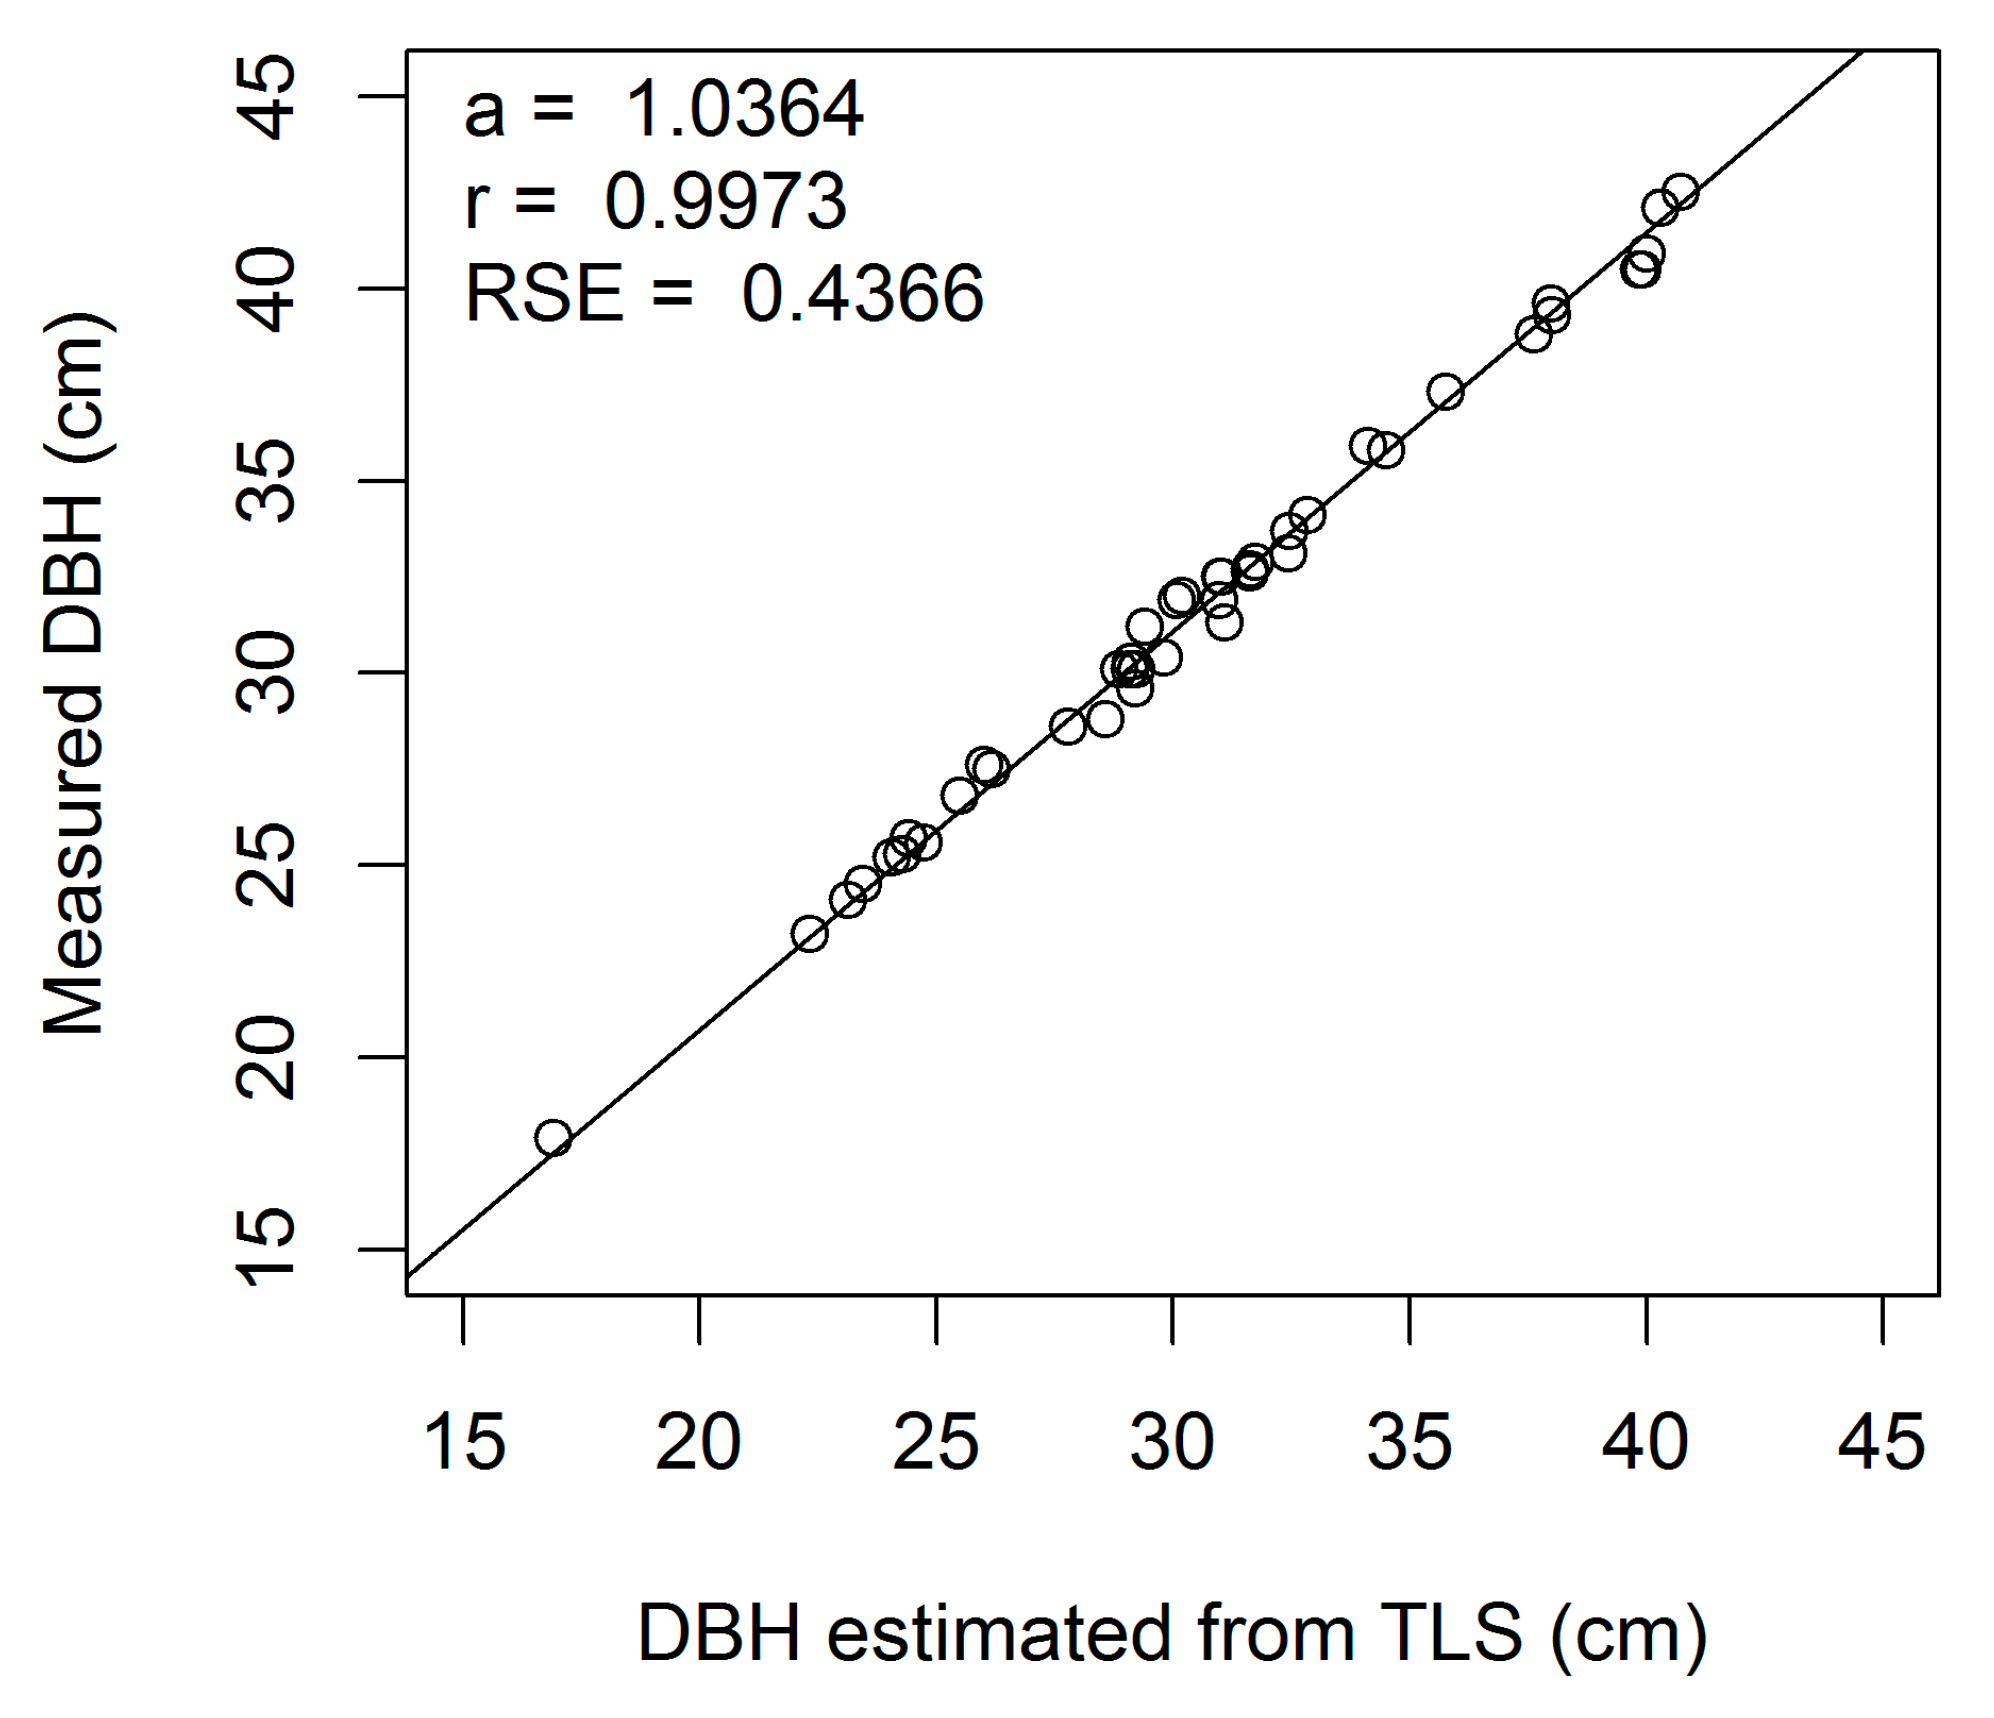
Figure A2.
Linear regression of measured on estimated DBH (cm) for European beech 2-cm cross-section (a, regression slope; r, correlation coefficient; RSE, residual standard error).
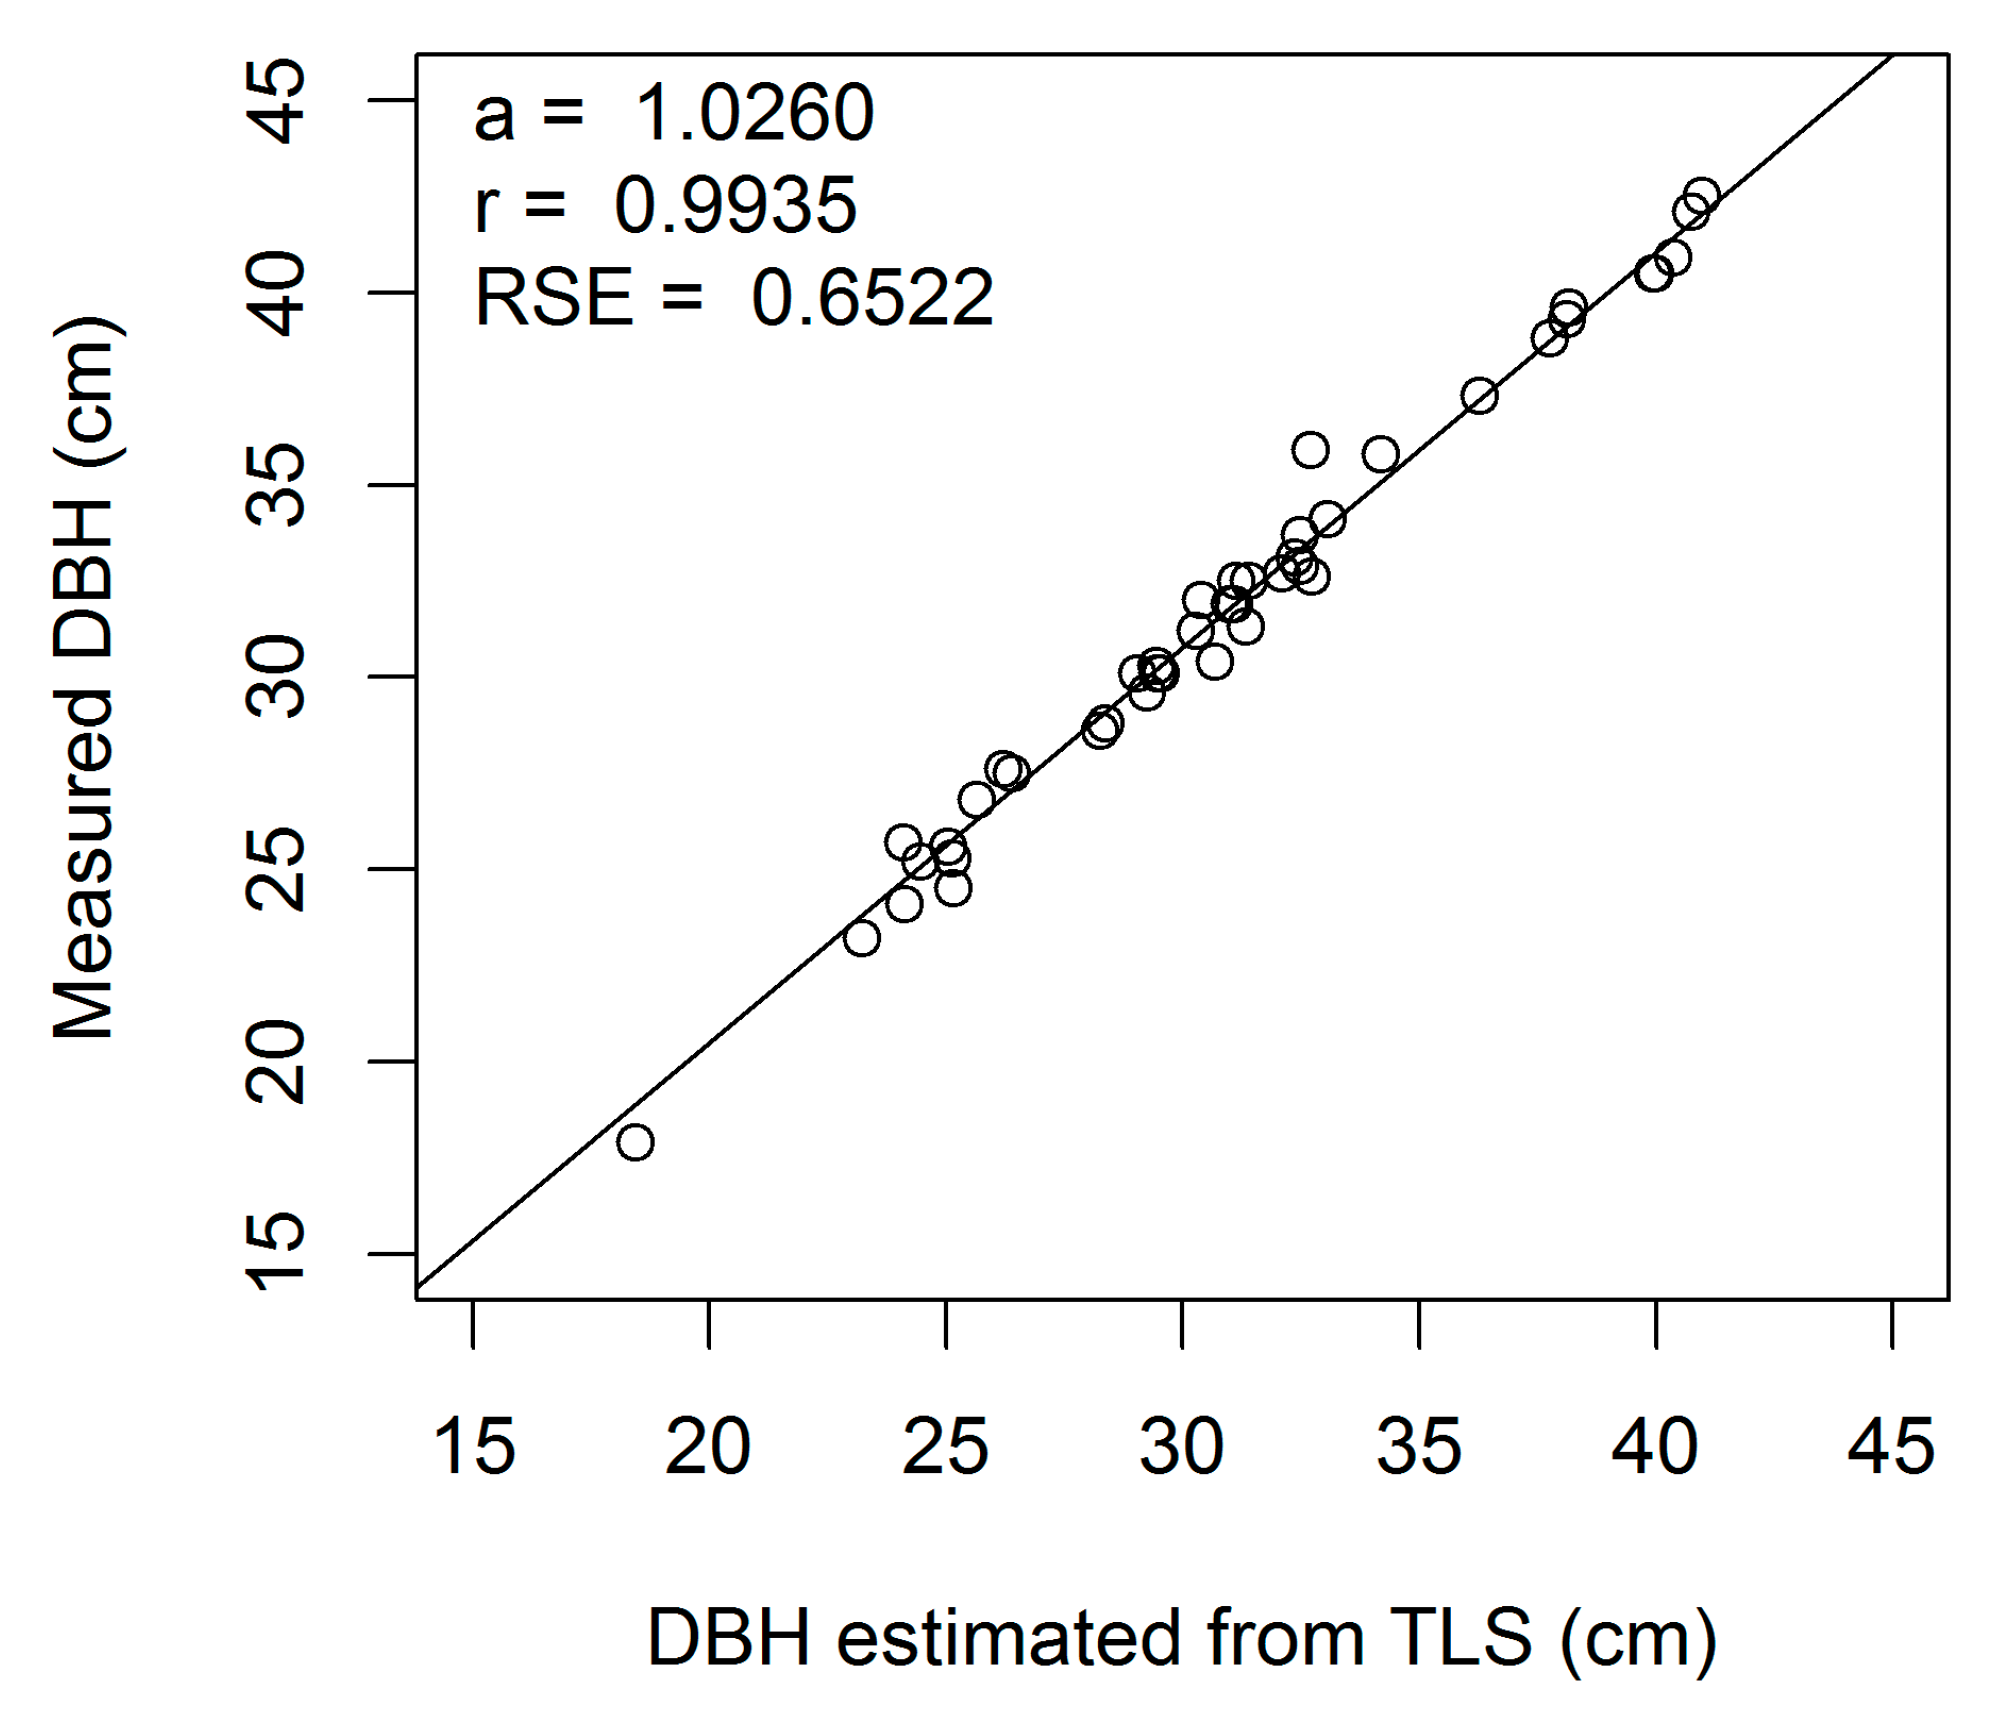
Figure A3.
Linear regression of measured on estimated DBH (cm) for European beech 3-cm cross-section (a, regression slope; r, correlation coefficient; RSE, residual standard error).
Figure A3.
Linear regression of measured on estimated DBH (cm) for European beech 3-cm cross-section (a, regression slope; r, correlation coefficient; RSE, residual standard error).
Figure A4.
Linear regression of measured on estimated DBH (cm) for European beech 4-cm cross-section (a, regression slope; r, correlation coefficient; RSE, residual standard error).
Figure A4.
Linear regression of measured on estimated DBH (cm) for European beech 4-cm cross-section (a, regression slope; r, correlation coefficient; RSE, residual standard error).
Figure A5.
Linear regression of measured on estimated DBH (cm) for European beech 5-cm cross-section (a, regression slope; r, correlation coefficient; RSE, residual standard error).
Figure A5.
Linear regression of measured on estimated DBH (cm) for European beech 5-cm cross-section (a, regression slope; r, correlation coefficient; RSE, residual standard error).
Figure A6.
Linear regression of measured on estimated DBH (cm) for European beech 6-cm cross-section (a, regression slope; r, correlation coefficient; RSE, residual standard error).
Figure A6.
Linear regression of measured on estimated DBH (cm) for European beech 6-cm cross-section (a, regression slope; r, correlation coefficient; RSE, residual standard error).
Figure A7.
Linear regression of measured on estimated DBH (cm) for European beech 7-cm cross-section (a, regression slope; r, correlation coefficient; RSE, residual standard error).
Figure A7.
Linear regression of measured on estimated DBH (cm) for European beech 7-cm cross-section (a, regression slope; r, correlation coefficient; RSE, residual standard error).
Figure A8.
Linear regression of measured on estimated DBH (cm) for European beech 8-cm cross-section (a, regression slope; r, correlation coefficient; RSE, residual standard error).
Figure A8.
Linear regression of measured on estimated DBH (cm) for European beech 8-cm cross-section (a, regression slope; r, correlation coefficient; RSE, residual standard error).
Figure A9.
Linear regression of measured on estimated DBH (cm) for European beech 9-cm cross-section (a, regression slope; r, correlation coefficient; RSE, residual standard error).
Figure A9.
Linear regression of measured on estimated DBH (cm) for European beech 9-cm cross-section (a, regression slope; r, correlation coefficient; RSE, residual standard error).
Figure A10.
Linear regression of measured on estimated DBH (cm) for European beech 10-cm cross-section (a, regression slope; r, correlation coefficient; RSE, residual standard error).
Figure A10.
Linear regression of measured on estimated DBH (cm) for European beech 10-cm cross-section (a, regression slope; r, correlation coefficient; RSE, residual standard error).
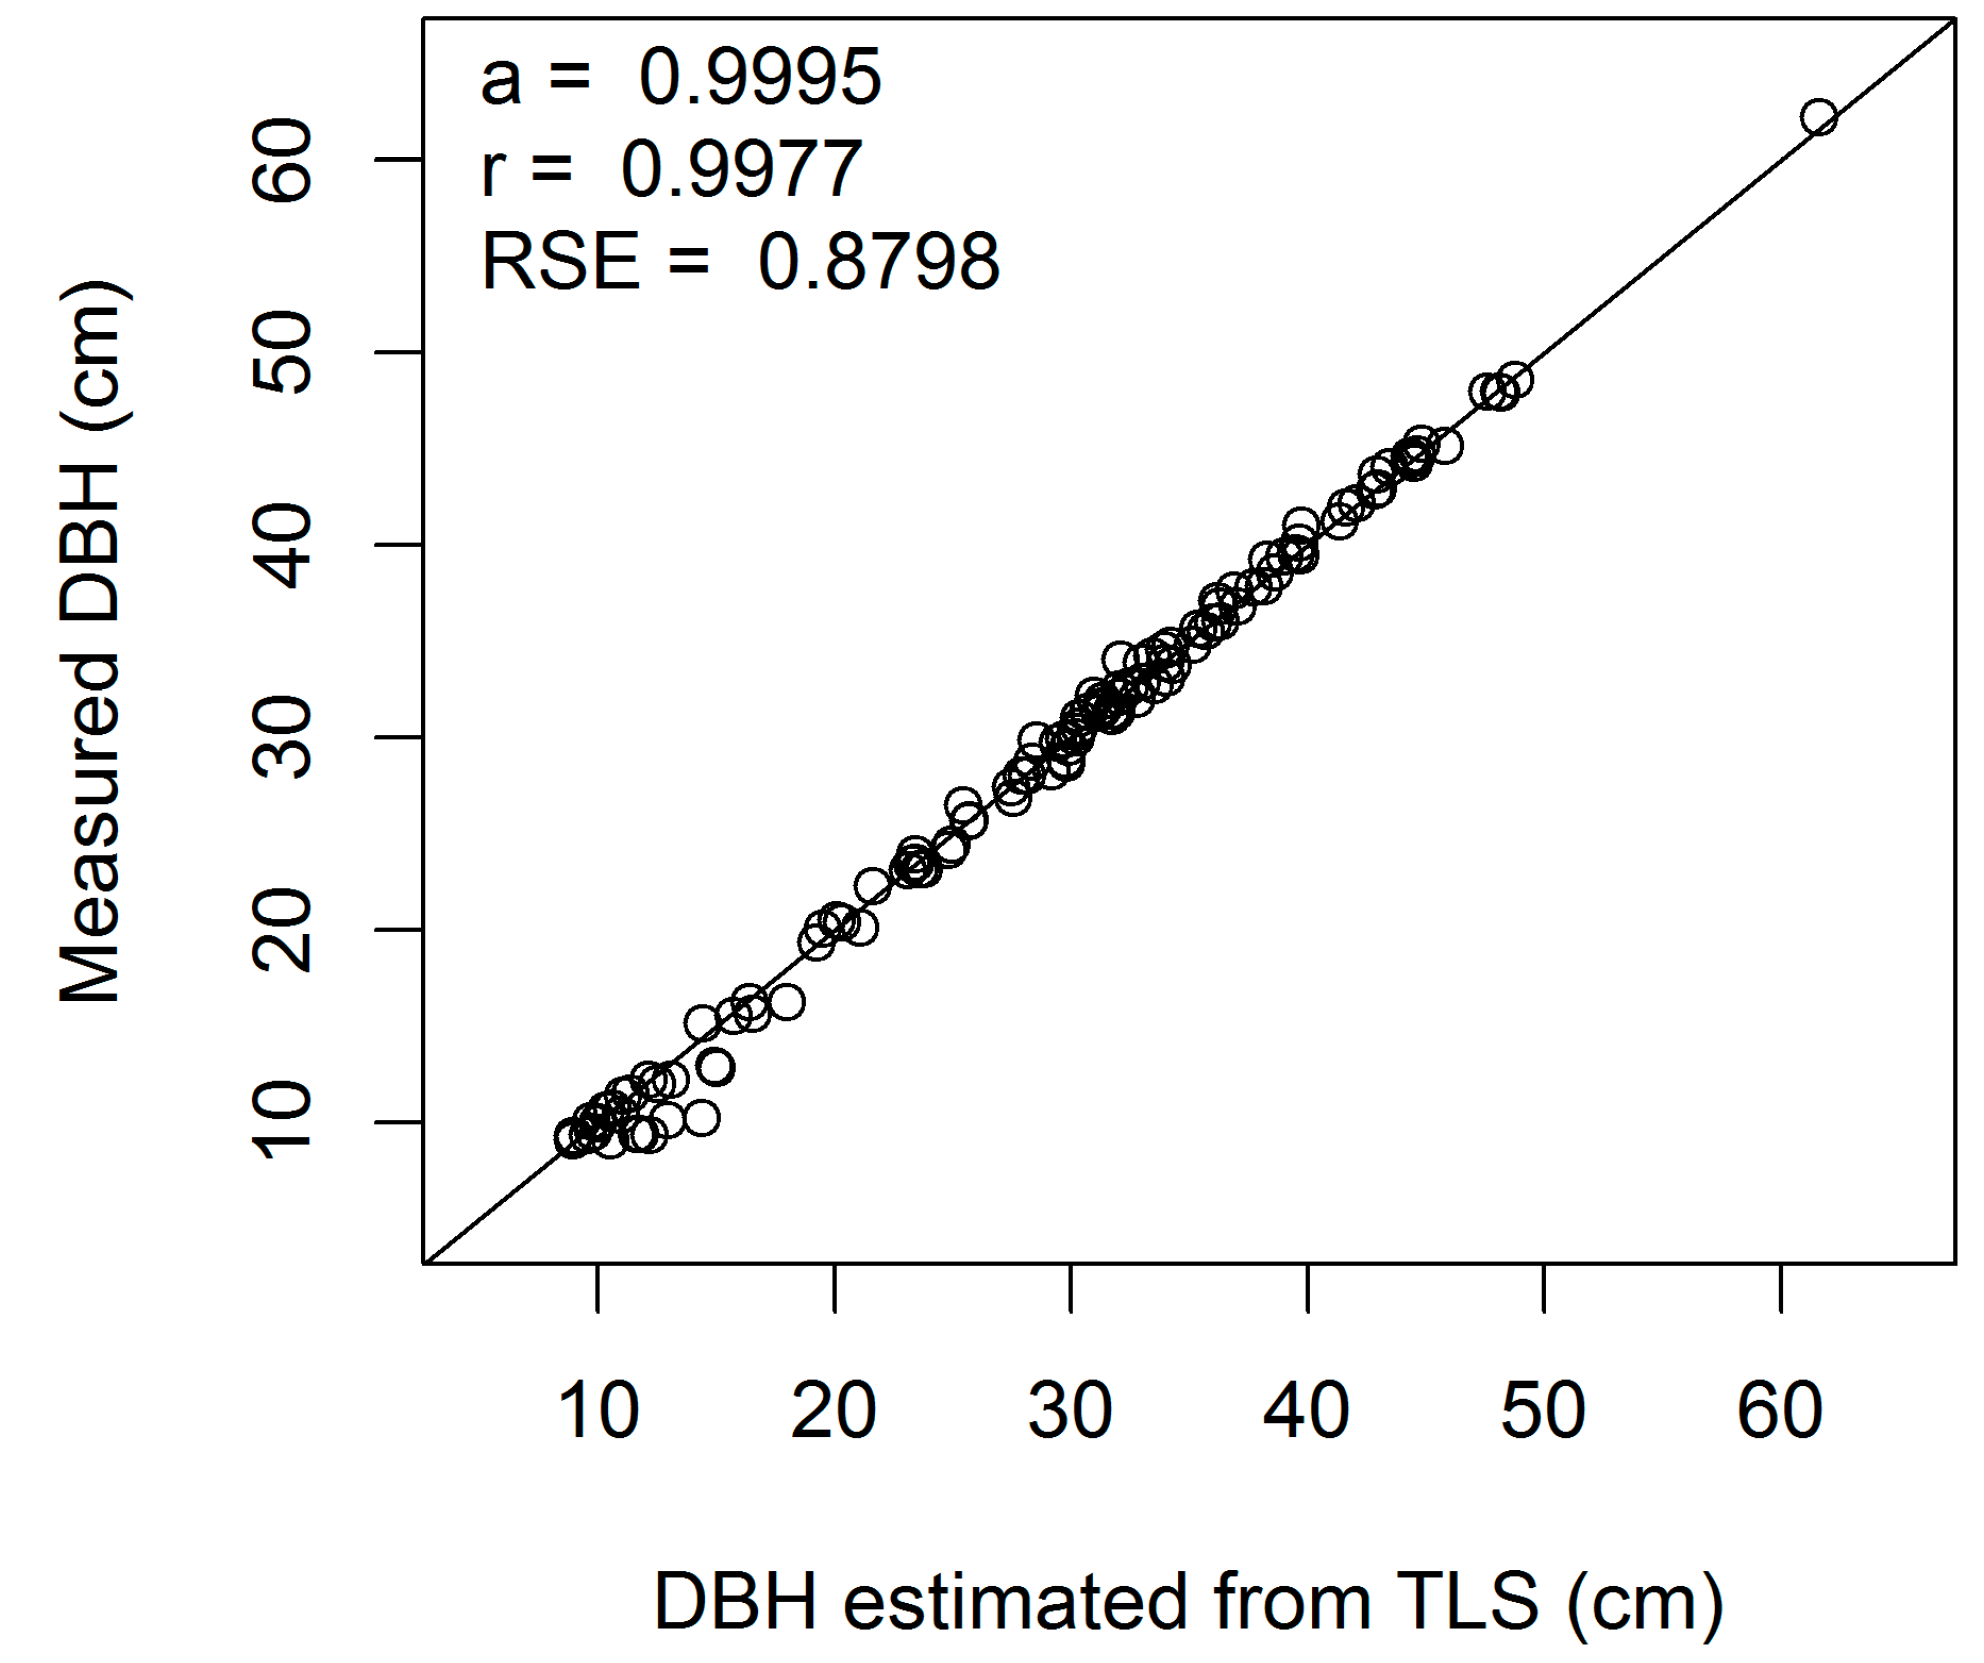
Figure A11.
Linear regression of measured on estimated DBH (cm) for European beech 20-cm cross-section (a, regression slope; r, correlation coefficient; RSE, residual standard error).
Figure A11.
Linear regression of measured on estimated DBH (cm) for European beech 20-cm cross-section (a, regression slope; r, correlation coefficient; RSE, residual standard error).
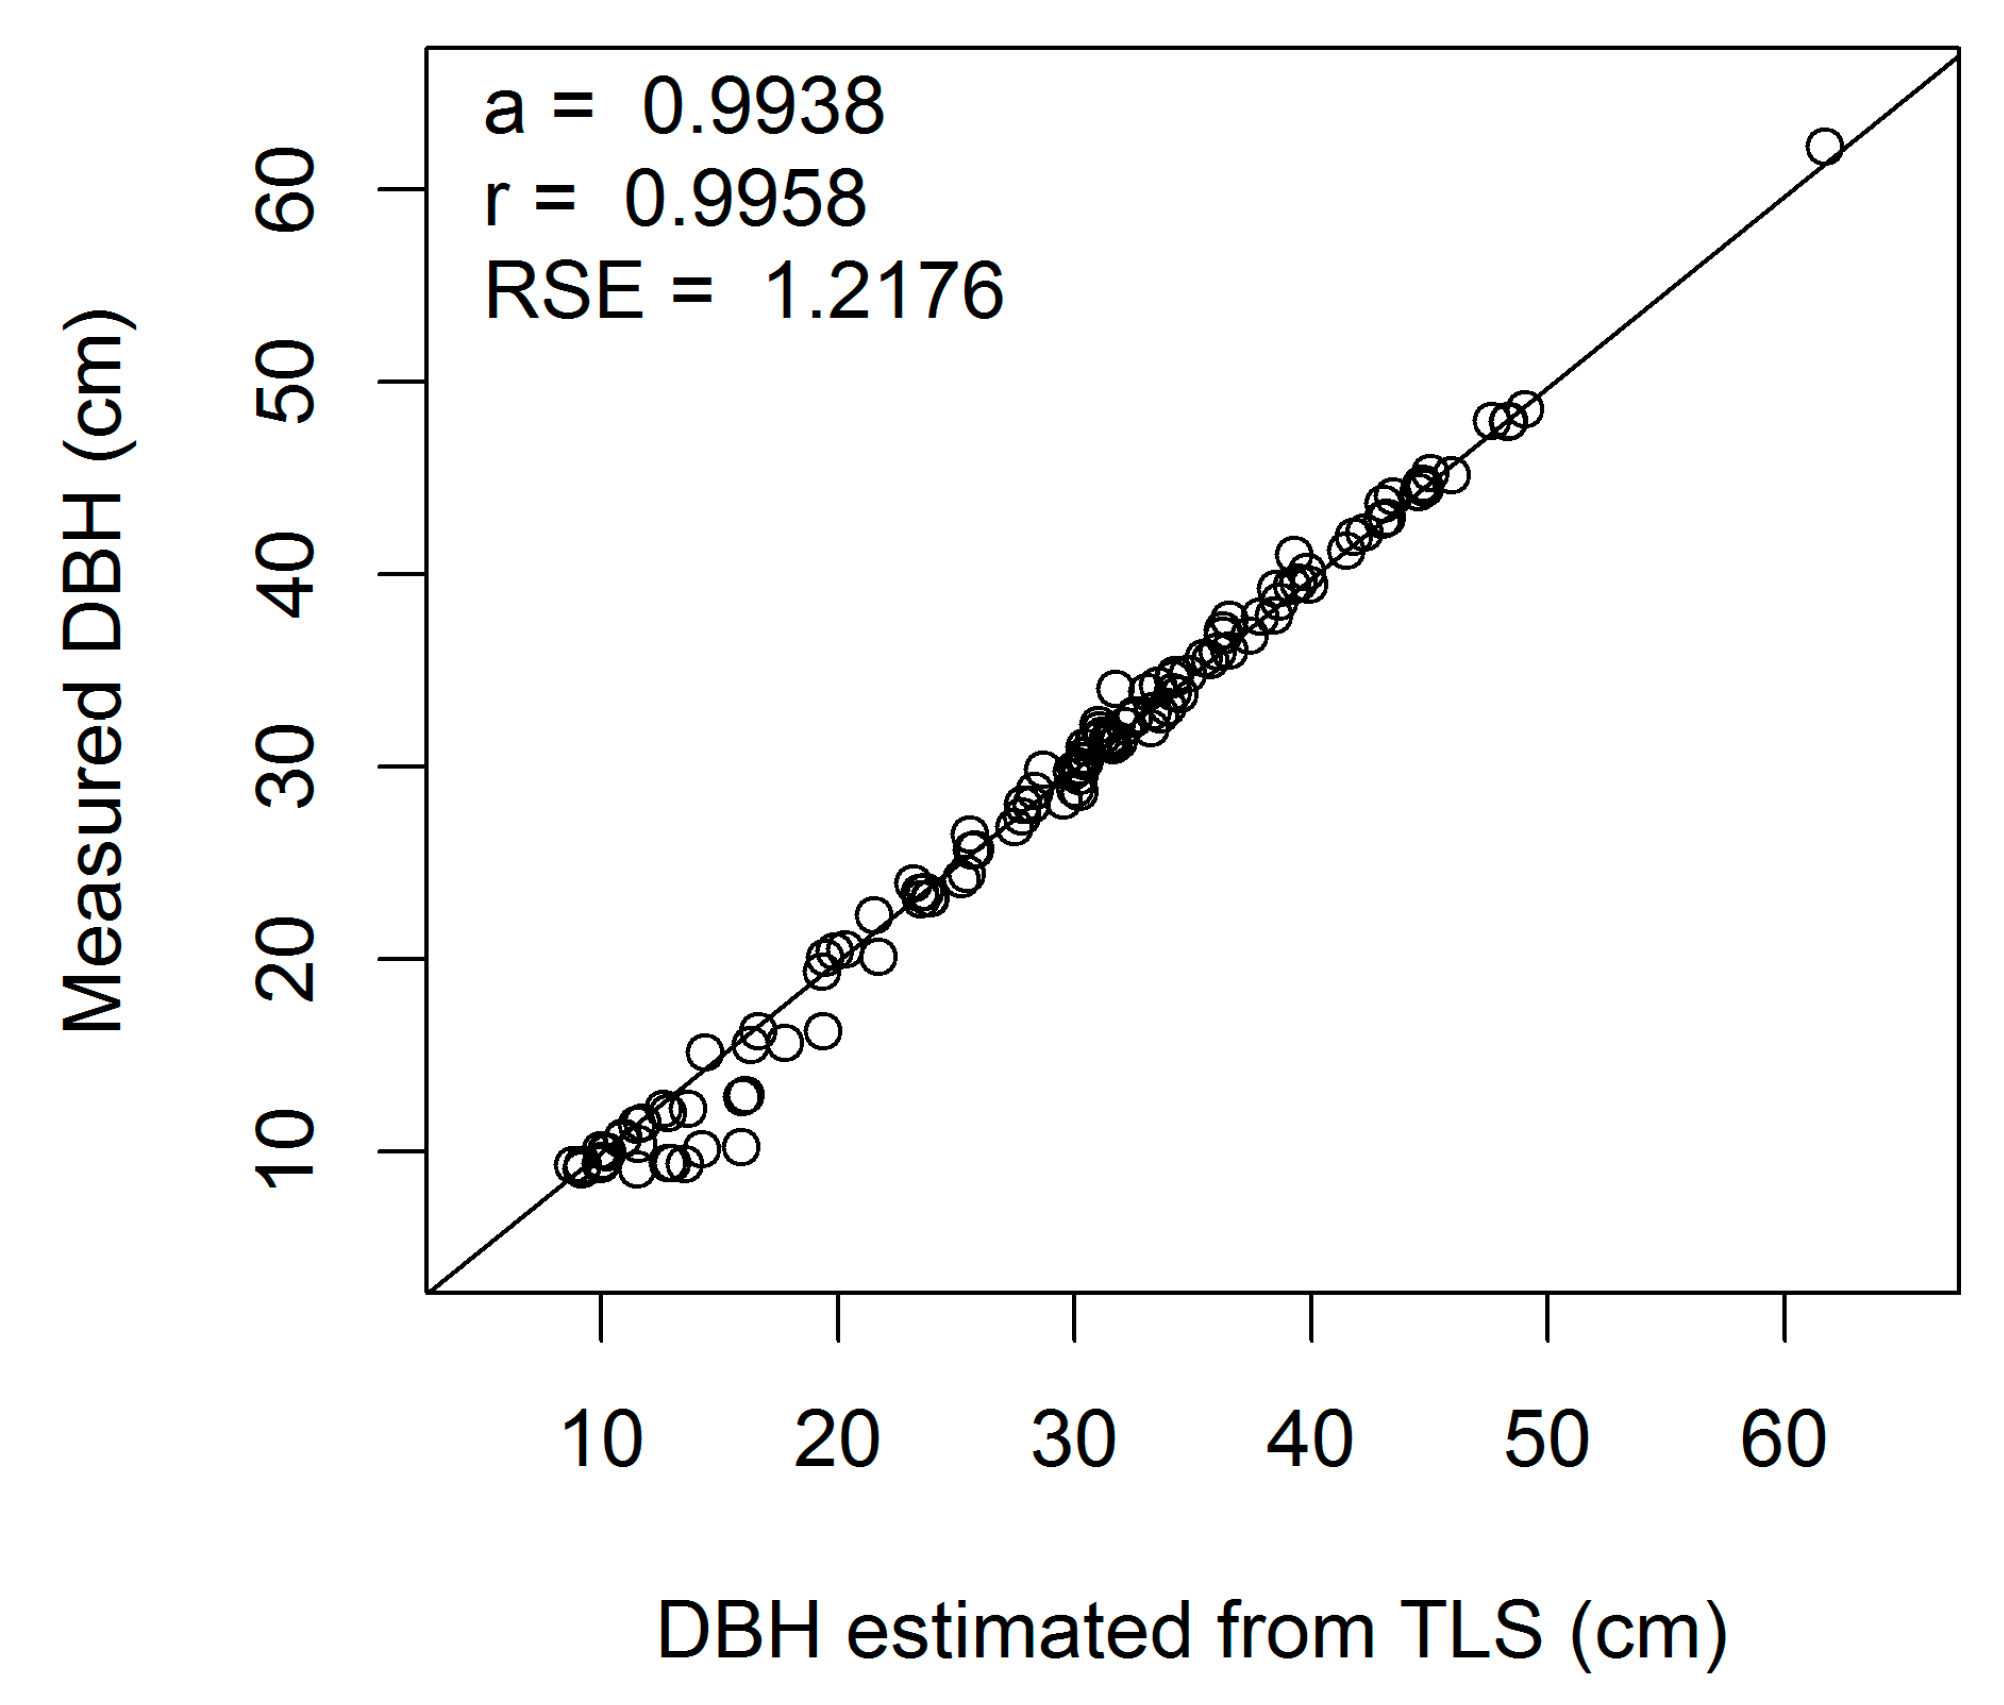
Figure A12.
Linear regression of measured on estimated DBH (cm) for European beech 30-cm cross-section (a, regression slope; r, correlation coefficient; RSE, residual standard error).
Figure A12.
Linear regression of measured on estimated DBH (cm) for European beech 30-cm cross-section (a, regression slope; r, correlation coefficient; RSE, residual standard error).
Figure A13.
Linear regression of measured on estimated DBH (cm) for European beech 40-cm cross-section (a, regression slope; r, correlation coefficient; RSE, residual standard error).
Figure A13.
Linear regression of measured on estimated DBH (cm) for European beech 40-cm cross-section (a, regression slope; r, correlation coefficient; RSE, residual standard error).
Figure A14.
Linear regression of measured on estimated DBH (cm) for European beech 50-cm cross-section (a, regression slope; r, correlation coefficient; RSE, residual standard error).
Figure A14.
Linear regression of measured on estimated DBH (cm) for European beech 50-cm cross-section (a, regression slope; r, correlation coefficient; RSE, residual standard error).
Figure A15.
Linear regression of measured on estimated DBH (cm) for European beech 60-cm cross-section (a, regression slope; r, correlation coefficient; RSE, residual standard error).
Figure A15.
Linear regression of measured on estimated DBH (cm) for European beech 60-cm cross-section (a, regression slope; r, correlation coefficient; RSE, residual standard error).
Figure A16.
Linear regression of measured on estimated DBH (cm) for European beech 70-cm cross-section (a, regression slope; r, correlation coefficient; RSE, residual standard error).
Figure A16.
Linear regression of measured on estimated DBH (cm) for European beech 70-cm cross-section (a, regression slope; r, correlation coefficient; RSE, residual standard error).
Figure A17.
Linear regression of measured on estimated DBH (cm) for European beech 80-cm cross-section (a, regression slope; r, correlation coefficient; RSE, residual standard error).
Figure A17.
Linear regression of measured on estimated DBH (cm) for European beech 80-cm cross-section (a, regression slope; r, correlation coefficient; RSE, residual standard error).
Figure A18.
Linear regression of measured on estimated DBH (cm) for European beech 90-cm cross-section (a, regression slope; r, correlation coefficient; RSE, residual standard error).
Figure A18.
Linear regression of measured on estimated DBH (cm) for European beech 90-cm cross-section (a, regression slope; r, correlation coefficient; RSE, residual standard error).
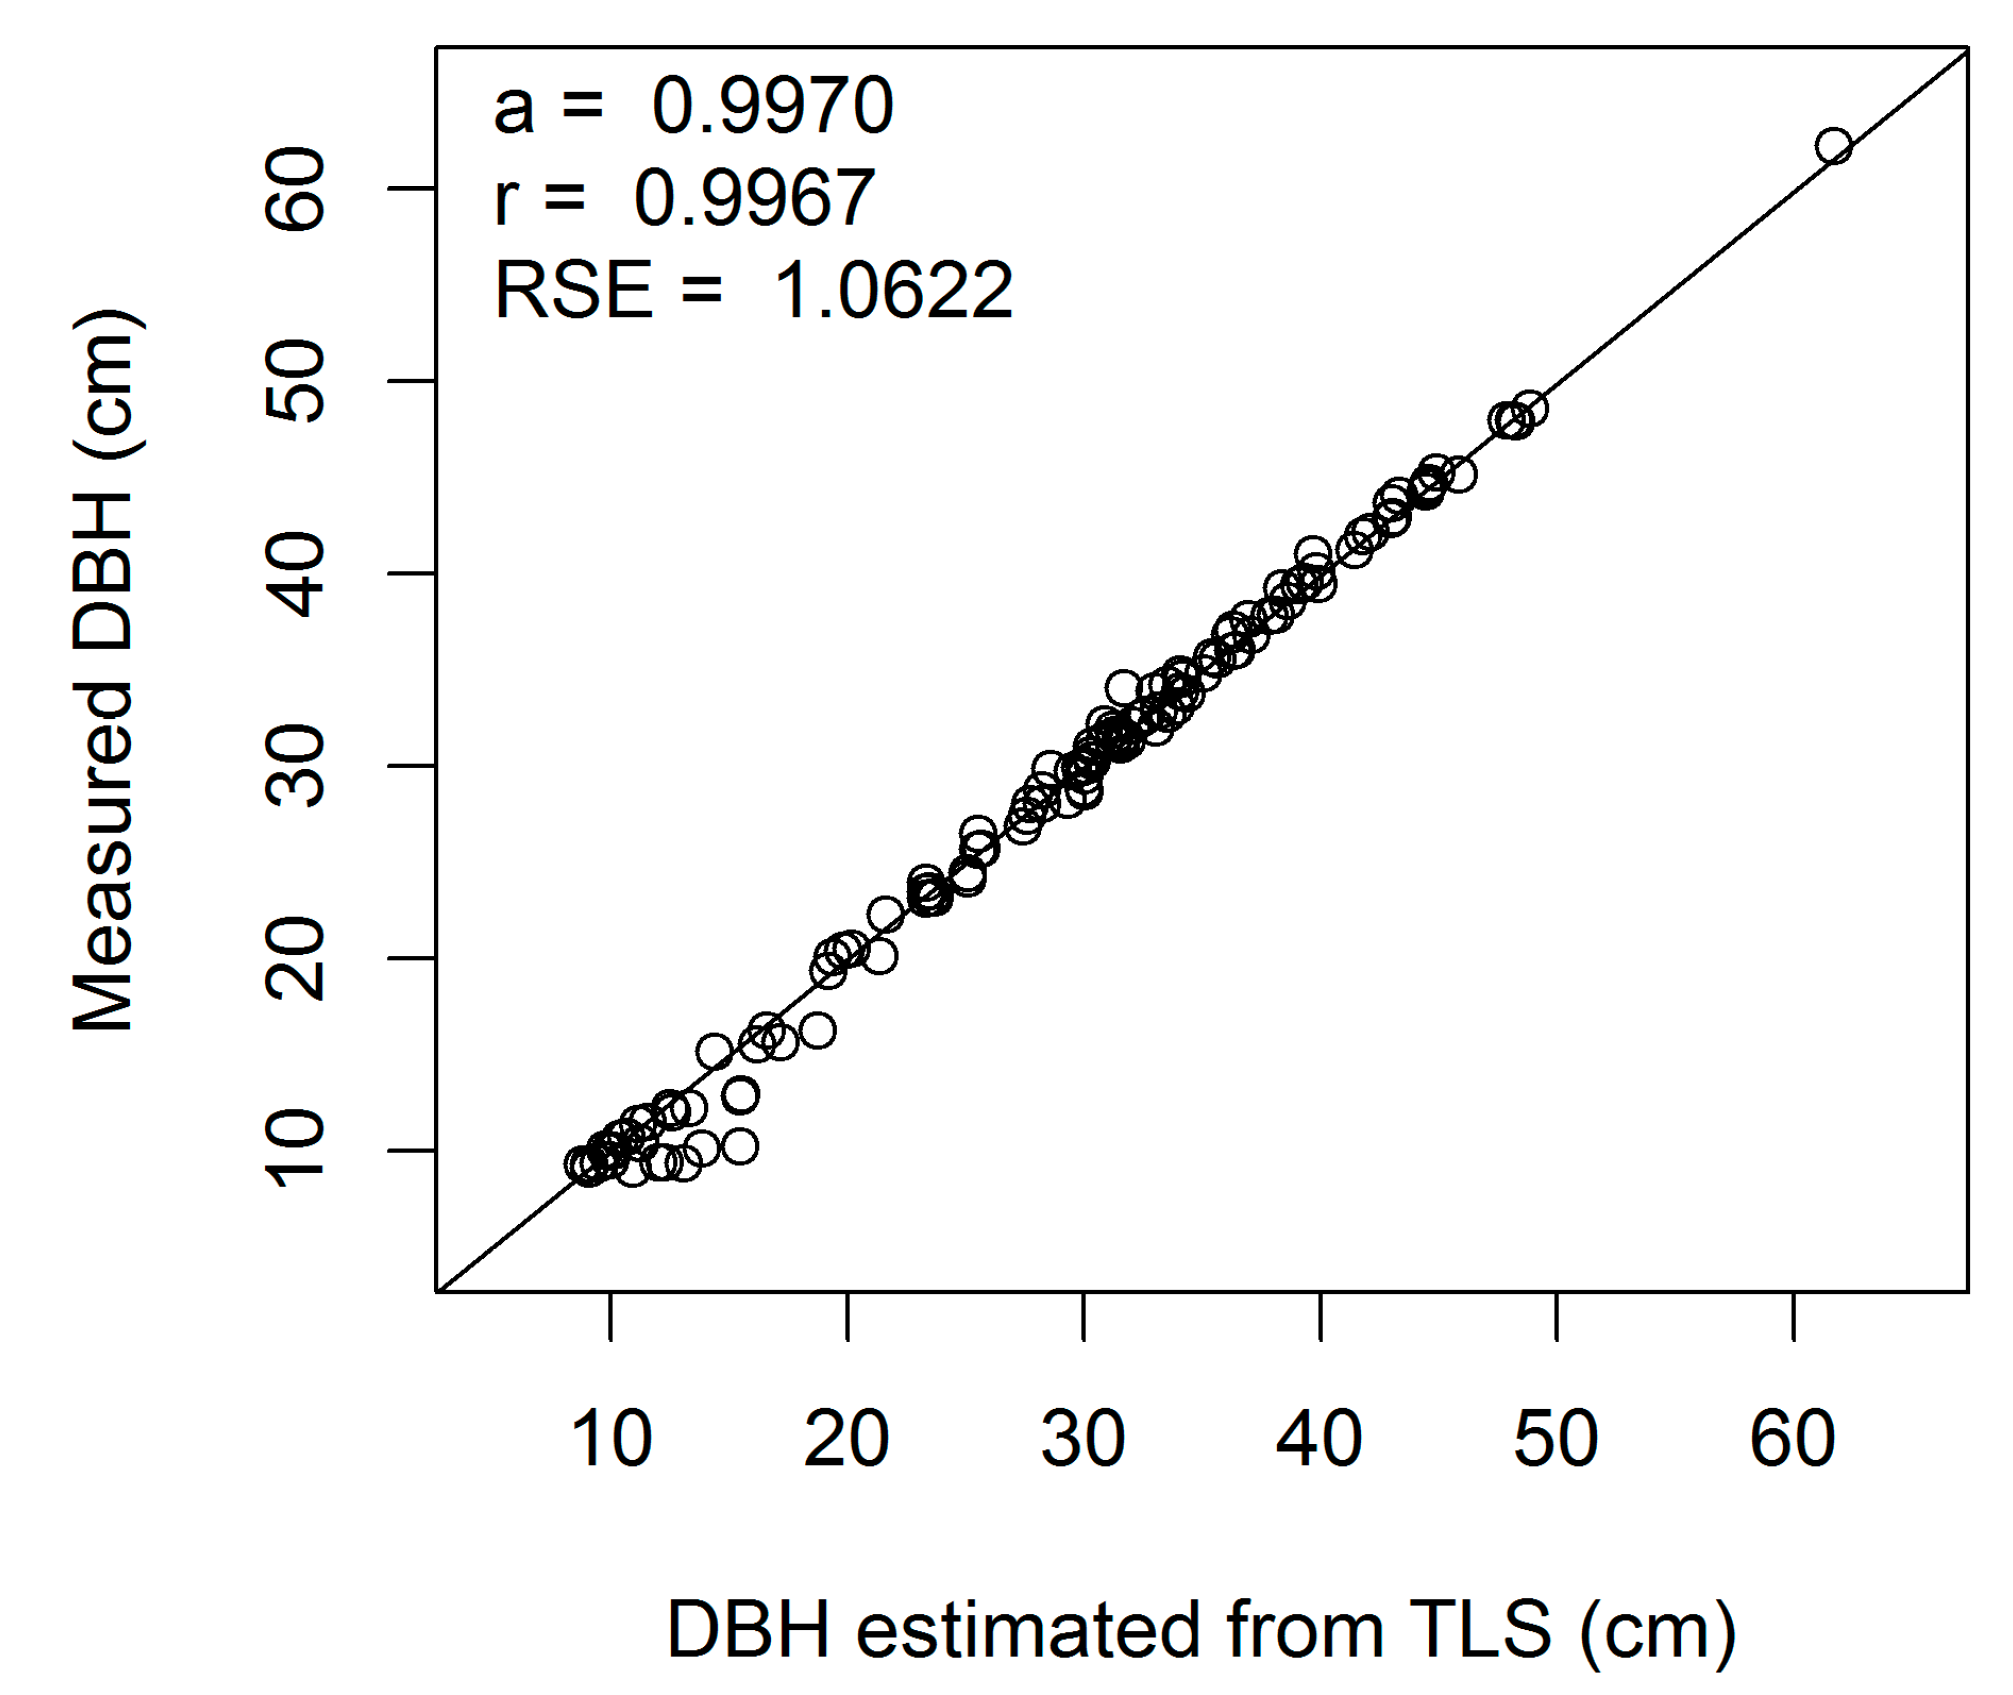
Figure A19.
Linear regression of measured on estimated DBH (cm) for European beech 100-cm cross-section (a, regression slope; r, correlation coefficient; RSE, residual standard error).
Figure A19.
Linear regression of measured on estimated DBH (cm) for European beech 100-cm cross-section (a, regression slope; r, correlation coefficient; RSE, residual standard error).
Appendix C
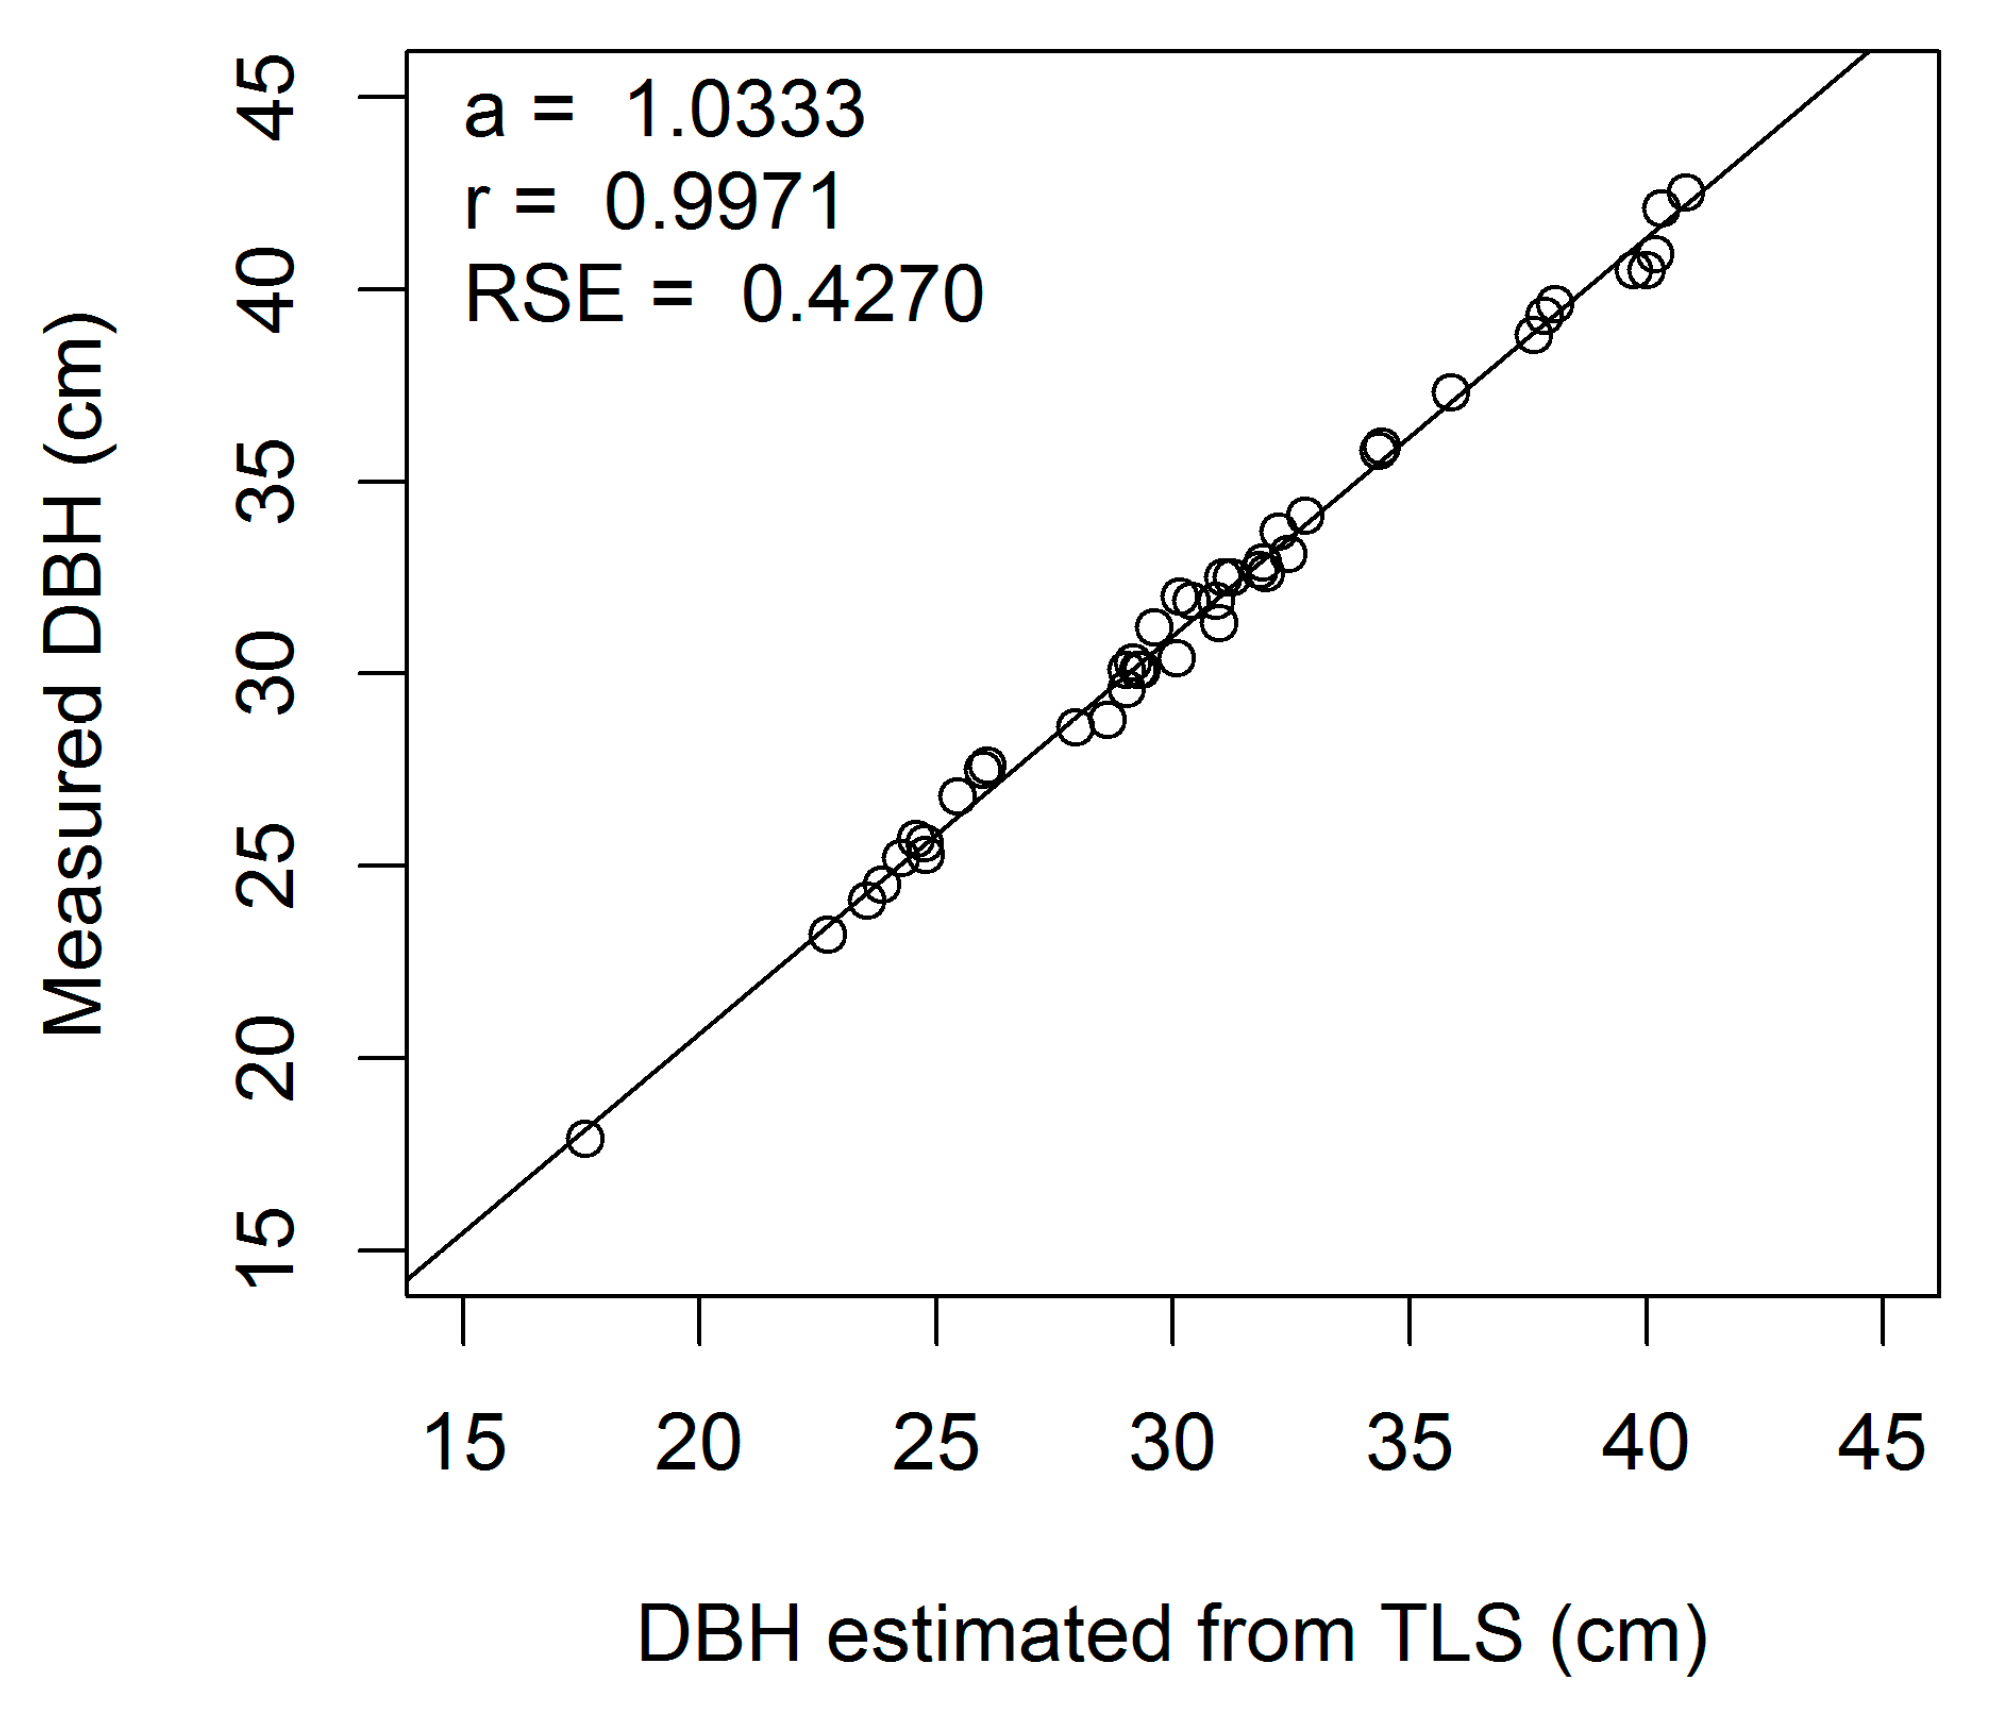
Figure A20.
Linear regression of measured on estimated DBH (cm) for sessile oak 1-cm cross-section (a, regression slope; r, correlation coefficient; RSE, residual standard error).
Figure A20.
Linear regression of measured on estimated DBH (cm) for sessile oak 1-cm cross-section (a, regression slope; r, correlation coefficient; RSE, residual standard error).
Figure A21.
Linear regression of measured on estimated DBH (cm) for sessile oak 2-cm cross-section (a, regression slope; r, correlation coefficient; RSE, residual standard error).
Figure A21.
Linear regression of measured on estimated DBH (cm) for sessile oak 2-cm cross-section (a, regression slope; r, correlation coefficient; RSE, residual standard error).
Figure A22.
Linear regression of measured on estimated DBH (cm) for sessile oak 3-cm cross-section (a, regression slope; r, correlation coefficient; RSE, residual standard error).
Figure A22.
Linear regression of measured on estimated DBH (cm) for sessile oak 3-cm cross-section (a, regression slope; r, correlation coefficient; RSE, residual standard error).
Figure A23.
Linear regression of measured on estimated DBH (cm) for sessile oak 4-cm cross-section (a, regression slope; r, correlation coefficient; RSE, residual standard error).
Figure A23.
Linear regression of measured on estimated DBH (cm) for sessile oak 4-cm cross-section (a, regression slope; r, correlation coefficient; RSE, residual standard error).
Figure A24.
Linear regression of measured on estimated DBH (cm) for sessile oak 5-cm cross-section (a, regression slope; r, correlation coefficient; RSE, residual standard error).
Figure A24.
Linear regression of measured on estimated DBH (cm) for sessile oak 5-cm cross-section (a, regression slope; r, correlation coefficient; RSE, residual standard error).
Figure A25.
Linear regression of measured on estimated DBH (cm) for sessile oak 6-cm cross-section (a, regression slope; r, correlation coefficient; RSE, residual standard error).
Figure A25.
Linear regression of measured on estimated DBH (cm) for sessile oak 6-cm cross-section (a, regression slope; r, correlation coefficient; RSE, residual standard error).
Figure A26.
Linear regression of measured on estimated DBH (cm) for sessile oak 7-cm cross-section (a, regression slope; r, correlation coefficient; RSE, residual standard error).
Figure A26.
Linear regression of measured on estimated DBH (cm) for sessile oak 7-cm cross-section (a, regression slope; r, correlation coefficient; RSE, residual standard error).
Figure A27.
Linear regression of measured on estimated DBH (cm) for sessile oak 8-cm cross-section (a, regression slope; r, correlation coefficient; RSE, residual standard error).
Figure A27.
Linear regression of measured on estimated DBH (cm) for sessile oak 8-cm cross-section (a, regression slope; r, correlation coefficient; RSE, residual standard error).
Figure A28.
Linear regression of measured on estimated DBH (cm) for sessile oak 9-cm cross-section (a, regression slope; r, correlation coefficient; RSE, residual standard error).
Figure A28.
Linear regression of measured on estimated DBH (cm) for sessile oak 9-cm cross-section (a, regression slope; r, correlation coefficient; RSE, residual standard error).
Figure A29.
Linear regression of measured on estimated DBH (cm) for sessile oak 10-cm cross-section (a, regression slope; r, correlation coefficient; RSE, residual standard error).
Figure A29.
Linear regression of measured on estimated DBH (cm) for sessile oak 10-cm cross-section (a, regression slope; r, correlation coefficient; RSE, residual standard error).
Figure A30.
Linear regression of measured on estimated DBH (cm) for sessile oak 20-cm cross-section (a, regression slope; r, correlation coefficient; RSE, residual standard error).
Figure A30.
Linear regression of measured on estimated DBH (cm) for sessile oak 20-cm cross-section (a, regression slope; r, correlation coefficient; RSE, residual standard error).
Figure A31.
Linear regression of measured on estimated DBH (cm) for sessile oak 30-cm cross-section (a, regression slope; r, correlation coefficient; RSE, residual standard error).
Figure A31.
Linear regression of measured on estimated DBH (cm) for sessile oak 30-cm cross-section (a, regression slope; r, correlation coefficient; RSE, residual standard error).
Figure A32.
Linear regression of measured on estimated DBH (cm) for sessile oak 40-cm cross-section (a, regression slope; r, correlation coefficient; RSE, residual standard error).
Figure A32.
Linear regression of measured on estimated DBH (cm) for sessile oak 40-cm cross-section (a, regression slope; r, correlation coefficient; RSE, residual standard error).
Figure A33.
Linear regression of measured on estimated DBH (cm) for sessile oak 50-cm cross-section (a, regression slope; r, correlation coefficient; RSE, residual standard error).
Figure A33.
Linear regression of measured on estimated DBH (cm) for sessile oak 50-cm cross-section (a, regression slope; r, correlation coefficient; RSE, residual standard error).
Figure A34.
Linear regression of measured on estimated DBH (cm) for sessile oak 60-cm cross-section (a, regression slope; r, correlation coefficient; RSE, residual standard error).
Figure A34.
Linear regression of measured on estimated DBH (cm) for sessile oak 60-cm cross-section (a, regression slope; r, correlation coefficient; RSE, residual standard error).
Figure A35.
Linear regression of measured on estimated DBH (cm) for sessile oak 70-cm cross-section (a, regression slope; r, correlation coefficient; RSE, residual standard error).
Figure A35.
Linear regression of measured on estimated DBH (cm) for sessile oak 70-cm cross-section (a, regression slope; r, correlation coefficient; RSE, residual standard error).
Figure A36.
Linear regression of measured on estimated DBH (cm) for sessile oak 80-cm cross-section (a, regression slope; r, correlation coefficient; RSE, residual standard error).
Figure A36.
Linear regression of measured on estimated DBH (cm) for sessile oak 80-cm cross-section (a, regression slope; r, correlation coefficient; RSE, residual standard error).
Figure A37.
Linear regression of measured on estimated DBH (cm) for sessile oak 90-cm cross-section (a, regression slope; r, correlation coefficient; RSE, residual standard error).
Figure A37.
Linear regression of measured on estimated DBH (cm) for sessile oak 90-cm cross-section (a, regression slope; r, correlation coefficient; RSE, residual standard error).
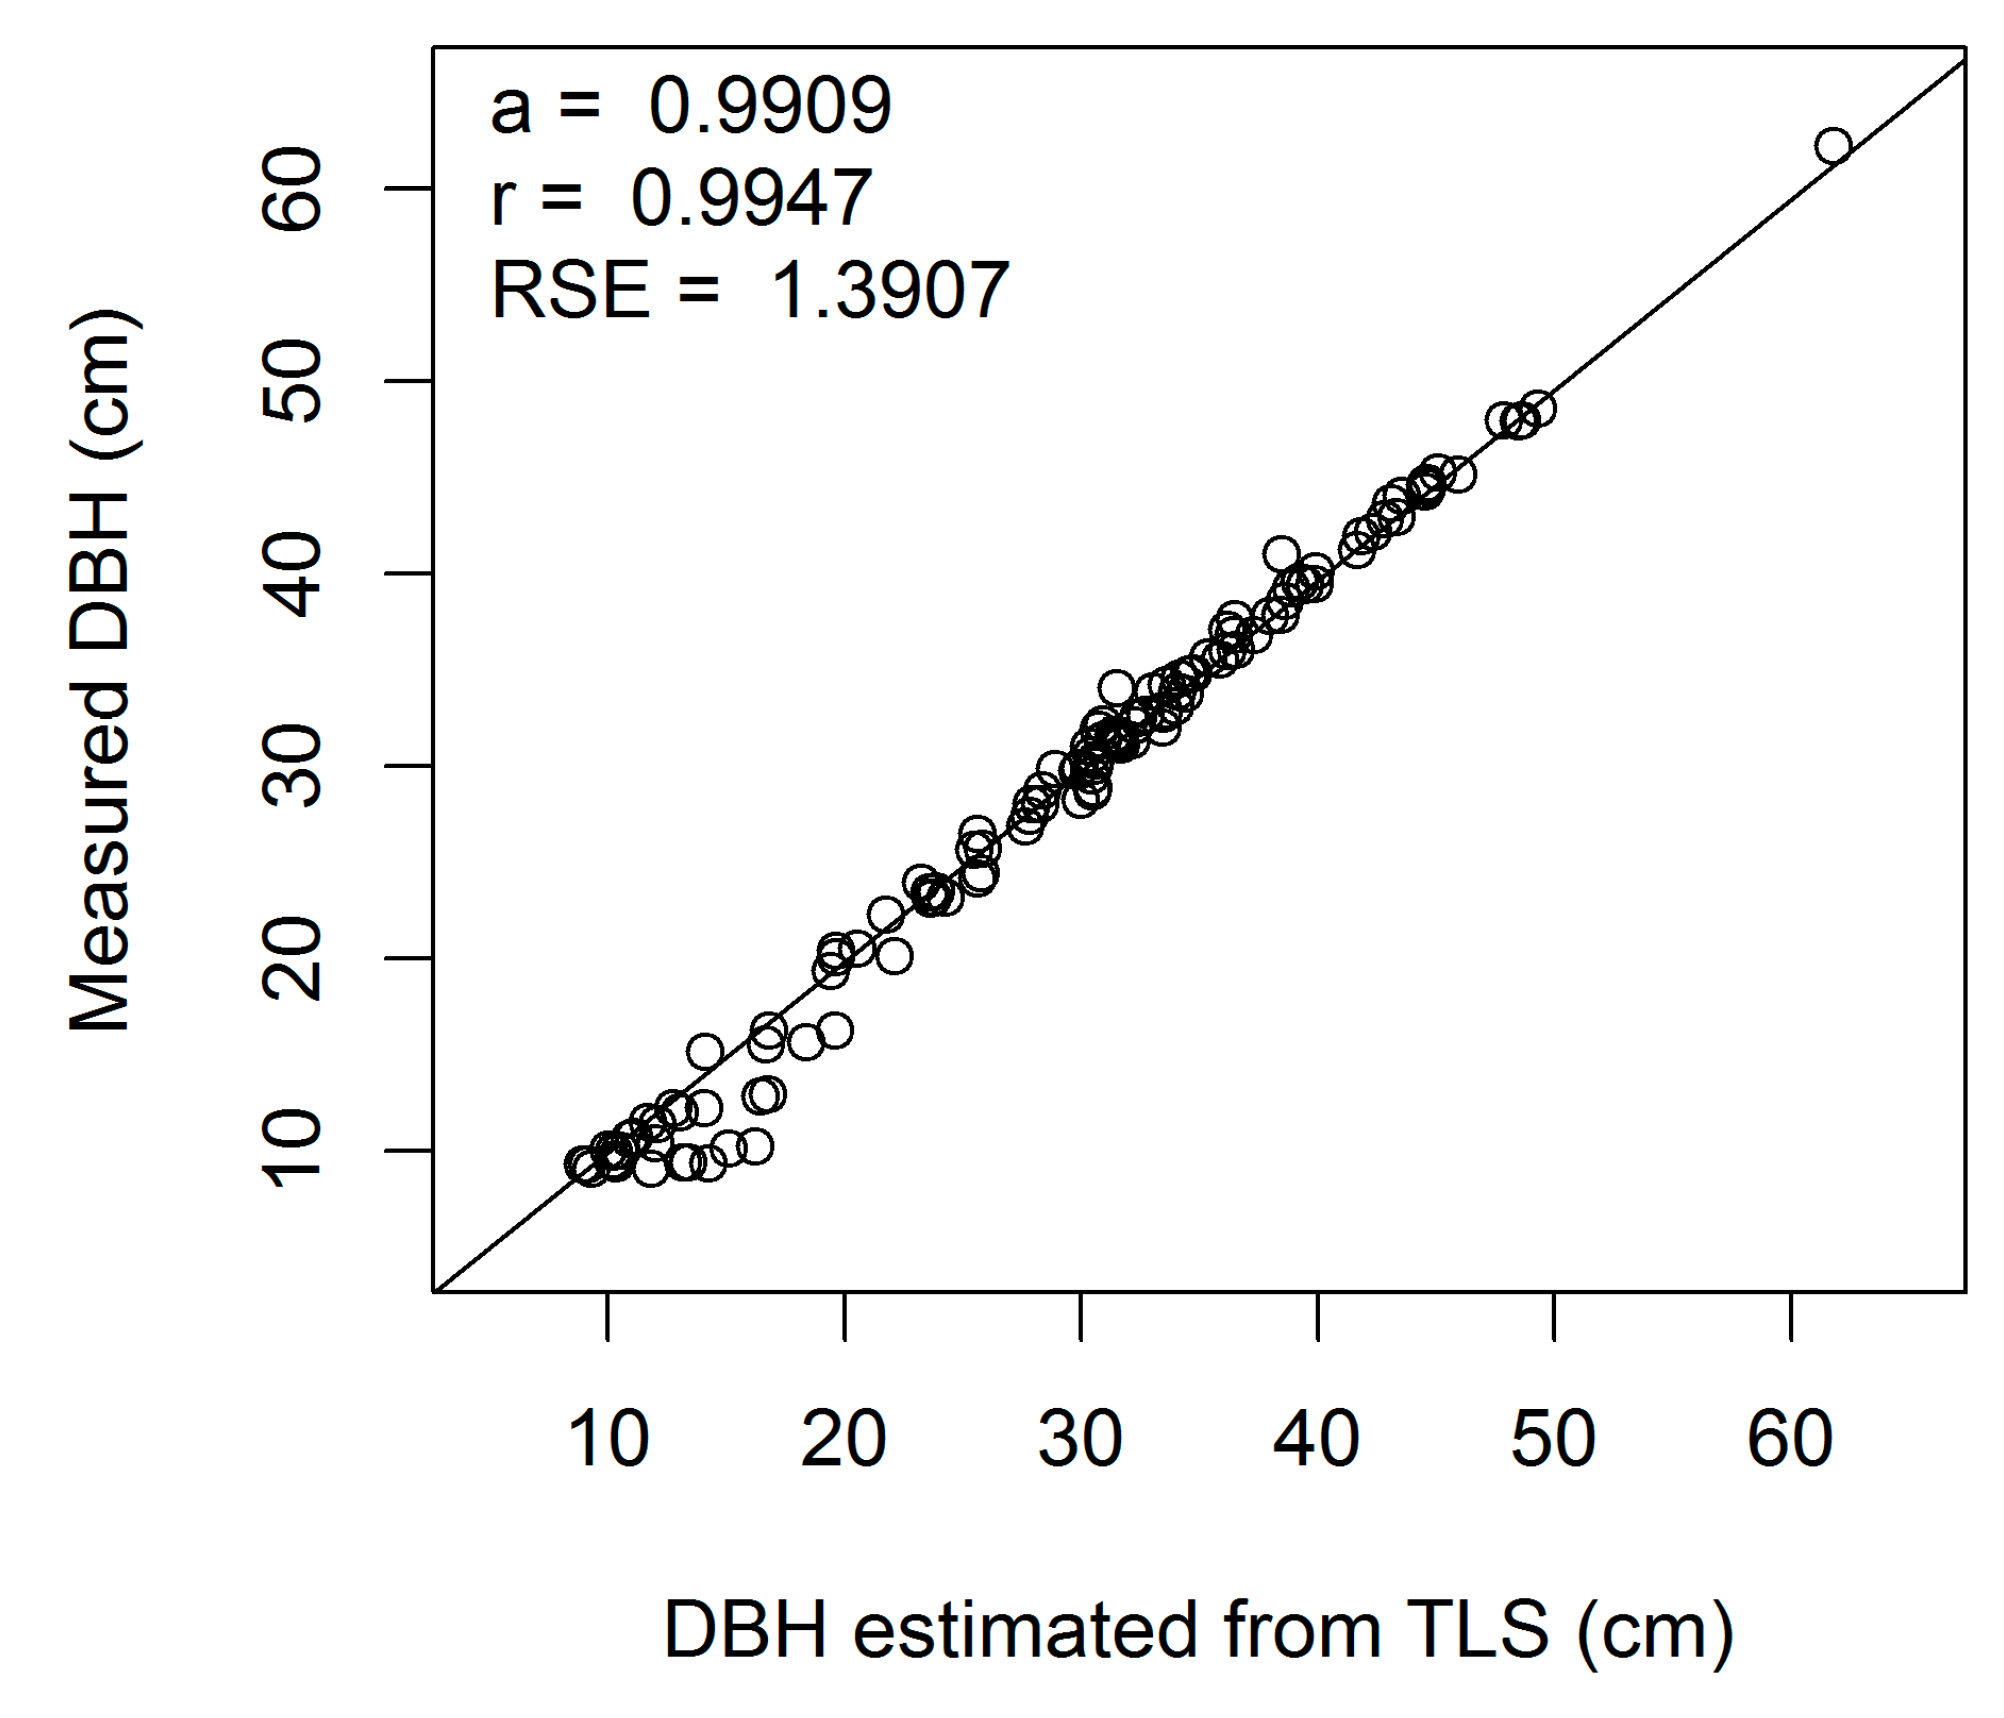
Figure A38.
Linear regression of measured on estimated DBH (cm) for sessile oak 100-cm cross-section (a, regression slope; r, correlation coefficient; RSE, residual standard error).
Figure A38.
Linear regression of measured on estimated DBH (cm) for sessile oak 100-cm cross-section (a, regression slope; r, correlation coefficient; RSE, residual standard error).


