Abstract
Although the data obtained from volunteered geographic information (VGI) are inherently different from public surveys, the quantity of the data are vast and the quality of the data are often poor. To improve the quality of VGI data, the positional accuracy and diversity and interaction of the number of users involved in the regional generation of the data are important. This research proposes a new approach for the accumulation of OpenStreetMap (OSM) data by using OSM Notes and attempts to analyze the geographical distribution and the characteristics of the contents of the contributions, quantitatively and qualitatively. Subsequently, the results demonstrated regional differences in OSM Notes, but it provided users with an understanding of the new features of quality management in OSM, even in regions where OSM activities are not necessarily active. In addition, it was also possible to discover new factors such as the time transition required for the correction and contribution of anonymous users. These results are expected to serve as a tool for users to communicate with each other to resolve data bugs that exist in OSM and provide future researchers with examples of user interaction in global OSM activities.
1. Introduction
Among the geospatial information generated through the Internet, there was an increase in the amount of data shared voluntarily. Volunteered geographic information (VGI), advocated by Goodchild [1] and disseminated in various academic fields, is noticeable as a methodology for practical data sharing using participatory GIS. In recent years, discussions on data quality, for example, the data location accuracy, spatial data inequalities, appropriate metadata and data model optimization, were included in VGI studies [2].
In particular, the OpenStreetMap (OSM) project, which began in the United Kingdom (UK) in 2004 to promote the “free” utilization of geospatial information, is a representative example of VGI. As OSM is an activity that respects grassroots activities, data accuracy is generally not guaranteed. However, as an example of VGI’s data evaluation studies [3], as reviewed by Senaratne et al. [2], there are ongoing studies that have evaluated the completeness of VGI data compared with real data, such as positional accuracy, topological relationships and open national data. Equally, it was demonstrated that it is important to include the involvement and collaborative development of the many contributors involved in regional data generation to improve the quality of VGI data [4]. As quantitative analyses of the data quality of OSM, there were many studies focusing on quality metrics [5], the analysis of network data [6] and research referring to the framework of quality analyses [7]. Early studies on user behavior and trends also included studies focusing on user preferences [8] and studies analyzing contributor behavior by country [9].
OSM has a notes function (OSM Notes) that serves as a communication method for comments and bug fixes on the input features. These data were visualized using “Neis Ones' Result Maps” [10], “Notes Review” [11] and “DE: Notes Map” [12]. These features are used to report data errors and provide additional information to be added to the OSM without an OSM user account. Users with OSM accounts can add further comments about OSM Notes and manage their status. Therefore, it could be expected that the geographical distribution of issues could be quickly analyzed using OSM Notes data in which user interaction is possible—and that an examination based on the quality improvement of VGI data could be possible. This could lead to the development of more suitable OSM data.
The purpose of this study is to identify global trends related to improving OSM data by identifying regional differences in OSM Notes. This introduces a new perspective, as many of the existing quantitative studies based on OSM data have tended to focus on regions with active OSM edits where more OSM editors and contributors tend to post more OSM Notes—as well as focusing on activities that improve OSM data, such as regions with higher resolution rates (rate of closed OSM Notes), duration of the resolution and characteristic OSM Notes content. We challenged ourselves to uncover data using an exploratory analyses that have seldom been addressed.
This study is organized as follows. Section 2 reviews the related work; Section 3 introduces the data sources and analysis techniques and Section 4 describes the geographical distribution of OSM Notes data and chronological trends. An exploratory analysis of some of the characteristics of the content and the clustering of the differences at the country level are analyzed in Section 5. Finally, discussions are given in Section 6 and conclusions of the study and future research topics are summarized in Section 7.
2. Related Work
This section describes some of the recent OSM quality assessments and analyses of the behavior of OSM Notes contributors. Quattrone et al. [13] focused on data maintenance at the national level and analyzed the frequency of updates and major tags, user IDs, changesets and time stamps. Yang et al. [14] conducted a temporal analysis of disproportional OSM contributions in Germany, France, the United States and the Netherlands. It became clear that the national data became more unequal over time in countries without data imports in OSM. On this point, Haklay [3], also analyzed the unevenness of the data in the UK and Yeboah et al. [15] also demonstrated the varying data quality of participatory mapping in the global south and argued that attention should be paid to areas other than those with high OSM data quality.
The contribution of enterprises to OSM data quality, as analyzed by Anderson et al. [16], is currently very widespread and the influence of enterprise editors on maps and their interactions with the OSM community are becoming more important. In their study, Anderson et al. attempted to develop a new analysis using a historical quarterly snapshot called “OSM-QA tiles” [17], which revealed global trends. Similarly, “OpenStreetMap Changeset Analyzer” (OSMCha) [18] is a web tool to help mappers analyze and review data changes in OSM. The objective of the tool is to help detect vandalism and act on faulty changes to the map data. Raifer et al. [19] also built the “OpenStreetMap History Database” (OSHDB) to provide a platform for the spatiotemporal analysis of OSM data and monitor the progress in the data collation and OSM user contributions.
Bégin et al. [20] researched the life cycle of OSM contributors by analyzing the editing history over four years. This featured an analysis of the impact of the editing history on the volume and frequency of contributions using different models. In the approach developed by Minghini and Frassinelli [21], the quality evaluation of OSM is based on a hybrid index. To answer the question “Is OSM up-to-date,” they included the date of creation (first edit), date of the last edit, number of versions/revisions, number of different contributors who edited that node or way and frequency of update in their hybrid index.
Although OSM Notes has several visualization projects [10,11,12,13] and documents regarding API acquisition [22], there is a limit to analyzing the data structurally because various responses to a single post are made in multiple languages and articles with detailed analyses are limited in number. As an example, “Neis Ones' Result Maps” expresses the latest basic statistics for each country [10]. “OpenStreetMap Notes: some interesting stats” includes a basic analysis of posting via Maps.me and an attempt to extract data from OSM Notes using SPSS [23].
As clues for the analysis in the following chapters, previous studies on bug reporting and user collaboration in general crowdsourcing include, for example, a review of bug localization [24]. A study that analyzed data from a non-emergency municipal services called Open311 attempted to conduct a geographic analysis of the activity of local residents to post about infrastructure damage in their city, primarily through smartphone applications [25,26]. These studies address the feature classification and geographic distribution estimation of bug reports and some of them also mention features of SPAM-like submissions.
As described above, most of the studies on OSM thus far have analyzed map editing activities and user characteristics on OSM and have also worked on data quality indexing. On the other hand, OSM Notes is a system for providing comments and status (open or closed) to a single post and it is difficult to understand the extraction method and characteristics of the data. This is because the data are not structured like OSM data in the sense that a certain number of posts are anonymous. In this study, we developed a script to convert OSM Notes dump data into a file that can be analyzed on GIS and clarified the geographical differences in the characteristics of OSM Notes, mainly by country, referring to existing studies.
3. Data Sources and Methods
This section describes the data sources and processes used in this research. Some OSM Notes visualization tools discussed in the previous section are essentially a search mechanism, so it is difficult to directly collect the global data needed for analysis. Therefore, we developed to create a script to parse the dump data. This is because it allows the dump data to be processed and analyzed arbitrarily, not limited to the data of the period. In this article, we collected the worldwide OSM Notes dump data (“.osn” format, approximately 782 MB) as of 15 April 2019, were obtained from Planet OSM [27], the OSM full data archive site. These data enables users to use OSM to input location information and comments on arbitrary posts of web pages and map applications. Specifically, it is intended to be used to report errors in the data and encourage the input of additional information not currently added to OSM (for example, street names) and guidelines—especially the prohibitions as illustrated in Table 1—were established for these purposes [28]. This list is basically a list of human-to-human communication about map editing in OSM, as well as inappropriate behavior for others to view and improve. As features of the note function, the importance of communication between users and for quality improvement were considered.

Table 1.
The usages of OpenStreetMap (OSM) Notes.
This feature allows initial posts to be made by users registered as anonymous and without an OSM account, but only users with an OSM account can revise or change Notes to open or closed. This procedure indicates an arbitrary post and adds a comment, but as illustrated in Table 2, many other properties can be included in the Notes data. Features of OSM Notes properties include OSM Notes ID, latitude and longitude, timestamp, as well as information about the username, user ID and status of the post. This makes it possible to trace the history of OSM Notes data from the archive data.

Table 2.
OSM Notes properties in OSM Notes API o.6.
OSM Notes contain a unique ID, the attributes of the first user to the post and a timestamp. OSM Notes also feature the distinction between Notes that are in the process of being modified or discussed and unresolved (open) and those that were resolved (closed). These data are provided in XML format on the archive site mentioned above, as well as the OSM original data, but it is not directly readable in QGIS, because the data model contains attributes not included in the OSM data.
In this research, we developed improve OSM Notes by referring to OSM XML formatted transformable script [29,30] to extract the appropriate attributes for a global geographic analysis of the contribution data and convert them to readable OSM data using QGIS. After dividing the data into two different types of status (open and closed) data, to extract the user who posted first and timestamp, the detailed attributes were converted into GIS data and the closing date was added as an attribute from the comment and the national attribute was added to the location information of OSM Notes by spatially coupling it with the national boundary data provided by the “thematicmapping” website [31]. These data were converted into a Geopackage format for analysis. When, “.osn” data are converted directly to a general-purpose format such as GeoJSON or SHP, the content of the text in the notes becomes very long and the text is broken in the middle. On the other hand, Geopackage is suitable for GIS data containing a large amount of text data because of the redundancy of the data columns.
4. Geographic Distribution and Time–Series Trends in OSM Notes
The following sections describe the geographic distribution of OSM Notes data: (1) an overview of the data trends, (2) an analysis of country-level data and (3) an analysis of time transition. Section 5 analyzes (1) the characteristics of anonymous users and (2) the tendency of posting using the maps.me application based on the results of Section 4.
4.1. Overview of the Global Trends
This section provides an overview of the overall trends in the extracted OSM Notes. Table 3 summarizes the OSM Notes dump files from April 2013 to April 2019. The total OSM Notes over this period were 1,726,403 posts. Of these, unresolved Notes (open) accounted for 24.06% (415,433) of the total and the resolved Notes (closed) accounted for 75.94% (1,310,970). The number of unique users who originally posted each note was 87,972 (open) and 152,384 (closed), indicating that closed Notes involved about 1.7 times more users. In particular, the first post can be made by an anonymous user and these consisted of 134,655 posts (open: 32.4%) and 496,693 posts (closed: 37.9%), which is about 3%–40% of the total. Incidentally, the largest number of posts by the same OSM user, was 3388 (open: 0.82%) and 18,268 (closed: 1.39%), showing no significant difference. The time elapses between the date of the first OSM Notes submission and April 15, 2019, were generally shorter for resolved (closed) submissions and an average of 17 days. The unresolved (open) data tended to be protracted due to some sort of failure or controversy in the OSM data, resulting in an average of 508 days. Similarly, looking at the number of edits, closed Notes had an average of 2.34 and open Notes had an average of 1.38. As for the words (characters) in OSM Notes, the number of characters in the Open submission is on average about 30 characters longer than that of those in the OSM Notes version. However, this trend was not calculated due to language differences and the actual word quantity and content of the words need to be closely examined.

Table 3.
Summary of open/closed OSM Notes from April 2013 to April 2019.
Figure 1a,b illustrates the total geographical distribution of open and closed OSM Notes and a detailed analysis of this figure is given in Section 4.2. The distribution densities were obtained using the kernel density estimation (KDE) method (50 km retrieval radius and 10 km output cell size).
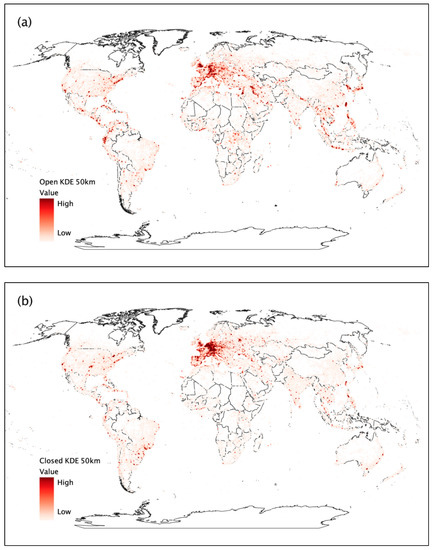
Figure 1.
Overview of OSM Notes posted (a) open and (b) closed using kernel density estimation (KDE).
Most of the data were roughly consistent with the data input range of OSM and were found to be abundant in Europe, North America and East Asia. If we focus on closed OSM Notes posts, the percentage was higher in Eastern Europe, India, southwest Australia, South America and South Africa.
Of the OSM Notes, 185,737 points (14.2% of the total closed submissions) were resolved in less than 1 day of posting or in 0 day. Many of these were simple notation errors and OSM attribute additions and the length of the text was typically short, averaging 130 characters. As shown, Figure 2 has similar features as can be found in Figure 1b, but Figure 2 is particularly common in most of Europe and the region around Moscow, Russia. The fact that 56,482 posts were made by anonymous users (30% of the total) and that most of the contributors were OSM users may have contributed to the early resolution of the problem.
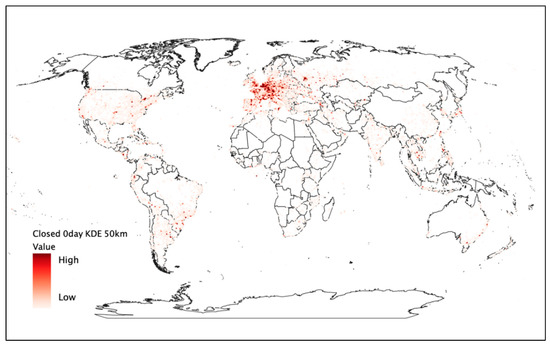
Figure 2.
Distribution of closed OSM Notes resolved in 0 day using KDE.
The country-level trends are explained in Section 4.2 and the country rankings for OSM Notes volume are pointed out here. Table 4 illustrates the number of open and closed Notes in the top ten countries and Germany, the United States and Russia had the most Notes. The rankings are roughly in line with OSM’s daily activity areas, although there were a few posts in Indonesia, Mexico and South Africa, where many data were compiled in recent years. The number of posts that do not apply to any country, such as contributions to the ocean, is 16,018 (open: 3.9%) and 38,864 (closed: 3.0%), which were extremely small. The geographic analysis in the following section describes the results of the analysis for the country or region where the OSM Notes postings occurred, but it should be noted that, due to the nature of the OSM Notes data, it is not possible to identify the region of residence of the user who posted the postings, which may differ from the place of origin of the OSM user.

Table 4.
Ranking of open/closed OSM Notes total number by country from April 2013 to April 2019.
4.2. Country-Level Trends
This section discusses the global overview of OSM Notes and the aggregate results at the national scale. Figure 3a,b illustrates the results of aggregating the geographical distribution of the posts illustrated in Figure 2 by country. The tops of the aggregate results for the number of submissions by country were generally in line with the trends illustrated in Table 4, but as evident in Figure 3, the number of unresolved (open) OSM Notes was relatively high in Iraq, Ukraine, Argentina and the Democratic Republic of Congo. In these countries, there were fewer OSM Notes that were resolved (closed), suggesting that some obstacles or additional information may be required to edit OSM. In contrast, looking at the distribution in Figure 4, it was evident that Germany had the most resolved OSM Notes (closed) and this was a large difference compared to other countries. In particular, the number of countries in Africa and Central America with high levels of closed Notes was relatively small, suggesting that there were many unresolved issues.
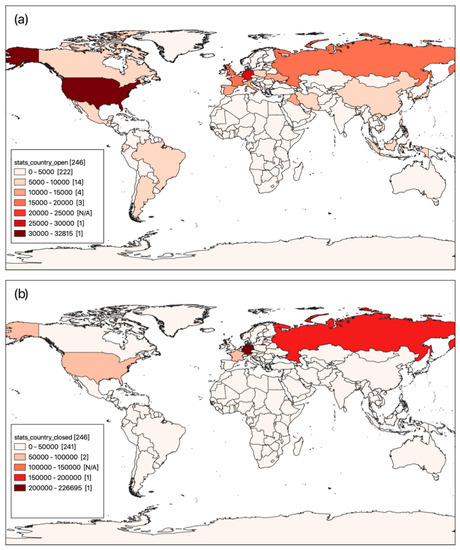
Figure 3.
Overview of (a) open and (b) closed OSM Notes posted by country.
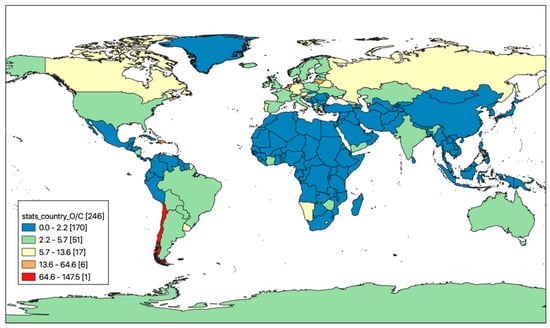
Figure 4.
Distribution of closed–open rates of OSM Notes by country.
In addition, it is necessary to consider the balance of the number of open and closed OSM Notes. This is because regions with extreme openness are still left behind for some reason when it comes to issues with OSM data. Figure 4 illustrates the distribution of the resolution rate by country based on the total number of closed and open Notes (C/O rates). In this analysis, we classified these rates into five groups using the Jenks natural breaks optimization method. The advantage of this method is that it is a method where the threshold is set at a value with a relatively large amount of change in the data, since the proportion of the data in each country varies widely. This figure suggests that countries with a large percentage of respondents have resolved the issues posted in the OSM Notes appropriately and countries with a percentage over 100% or close to 100% are particularly eager to resolve them. As a result, Cambodia, Chile, Luxembourg, the Netherlands, Armenia had the highest percentages in that order, which are summarized in Table 5 together with the other indicators.

Table 5.
Top 5 countries with high open/closed rates of OSM Notes.
In Table 5, Netherlands, in particular, had a high number of OSM Notes and a high number of unique users contributing to posts and anonymous contributions (Section 5). Cambodia had the highest percentage of closed Notes and the average processing time was 8 days, a very short time. Chile had the highest ratio of closed users in South America. Armenia was a relatively active region, with over 500 unique users, although the total number of posts was not very high. In Luxembourg, it was noteworthy that half of the total number of Notes were closed by anonymous users. The same trend was observed in the Netherlands.
On the other hand, in analyzing user interactions through OSM Notes posts, it was also important to understand how many users with OSM accounts were participating. Figure 5 illustrated the total number of unique users involved in the first OSM Notes submission. Russia and Germany were the highest, with approximately 15,000 users. The next most popular destination was the United Stated, followed by France and Ukraine, with over 5000 users. However, if we look at the ratio of unique users to the total number of OSM Notes posts, we could see that Europe and Russia had relatively small levels (less than 20% of posts) and OSM users were active in several African countries, as well as in countries in East Asia that were involved in crisis mapping or missing maps.

Figure 5.
Distribution number of OSM Notes posted by unique OSM account by country.
When the percentage of unique users who were involved in the first post was aggregated by country, the trends in each country appear to be slightly different, as illustrated in Figure 6. African countries such as Guinea-Bissau and Western Sahara had a small absolute number of posts, so even a small number of contributors could make a significant contribution when multiple users participate. Interestingly, there were more than 10,000 contributions from Asian countries such as India, Pakistan and Vietnam, but there were also many unique contributors in these countries. Crisis mapping and mapathon events were actively carried out in these countries and the inflow of many OSM users, including newcomers, was more advanced than in other countries.
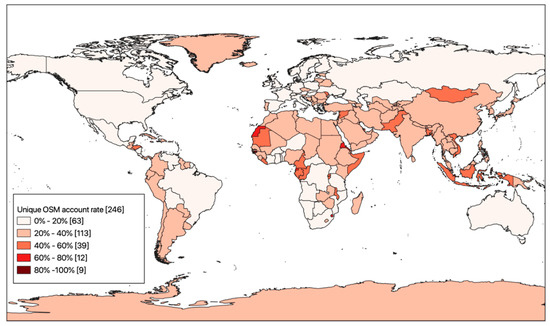
Figure 6.
Distribution rate of OSM Notes posted by unique OSM account by country.
4.3. Time Transition Trends
This section chronologically observes when records classified as closed in OSM Notes (Total: 1310,970) were posted (first input date) and resolved (closed). Figure 7 illustrates the date of the first submission in monthly order; Figure 8 also illustrates when the submitted OSM Notes were resolved (closed) in the same order. Focusing on Figure 7, the first major peaks for OSM Notes were on August 2014 (22,540). After that, the number of posts constantly increased from around July 2016 (32,736) and August 2016 (34,786) became the second-largest peak. When the contribution data of these dates was outlined, there was no exceptionally large event and there were comparatively many contributions in Europe and Brazil, but this was not unusual. However, in around April 2016, maps.me, OSM’s main offline application, added an “in-app map editor” feature, probably due to the related posts. Data from maps.me are reviewed in Section 5, together with the analysis of the anonymous posts.
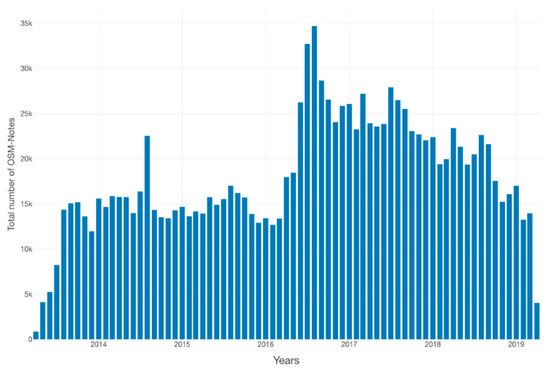
Figure 7.
Time transitions of OSM Notes open (first input) post.
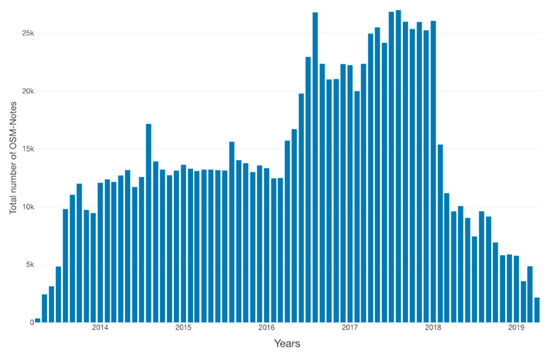
Figure 8.
Time transitions of OSM Notes closed (resolved) post.
From the time series changes resolved by the OSM Notes, as illustrated in Figure 8, the largest peaks were in August 2017 (27,991). Similar to Figure 7, these peaks were relatively high in Europe and Brazil, but were not so high. However, the increase in the contribution in July in each region coincides; this is likely because of mapping parties and active mappers during the summer vacation. These features are difficult to monitor on a global scale using OSM’s editing history alone, except for events in which crisis mapping was performed, but they represent the features of user interaction that can be assessed using OSM Notes.
In addition, looking at the time taken to resolve the closed OSM Notes, as illustrated in Figure 9, the trends for the average resolution time differs regionally. In Europe, Russia, Canada and Australia, each issue is resolved in a relatively short period. In contrast, in countries such as Saudi Arabia and Yemen, a relatively large number of OSM Notes were not resolved for an extended period (approximately 500 days or more), although this is partly due to the small number of contributions. In the case of countries that take longer to resolve Notes, the issues posted on OSM Notes may not have local contributors or can be identified accurately. Therefore, it is possible to observe the limits of “Armchair Mapping” represented by the evidence from satellite data.
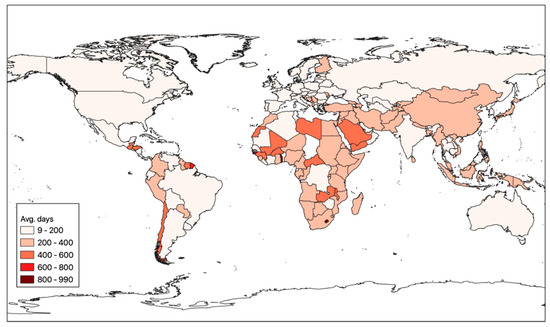
Figure 9.
Distribution of average days of OSM Notes closed (resolved) period by country.
5. Exploratory Analysis of OSM Notes Data
5.1. Anonymous Users’ OSM Notes
In this section, we discuss the trends and characteristics of anonymous contributions to OSM Notes. Figure 10 illustrates the results of the analysis of the contribution ratio of anonymous contributions by country. This ratio was calculated by counting only anonymous users who contributed to each open/closed post, first and dividing this by the total number of posts. Therefore, this trend demonstrates the characteristics of a country with a high participation of users who do not have OSM accounts. Countries such as Costa Rica (1793 cases, about 62.3%) and French Guiana (approximately 67.8%, 221 cases) in Central America and the Caribbean have the highest percentages, except for one post. The results also demonstrated that in European countries, both OSM users and anonymous users post Notes frequently. In contrast to the OSM user ratio illustrated in Figure 6, the contribution ratio of anonymous users is relatively high in Europe, where OSM users are more active. It also demonstrates that anonymous users are more active than OSM users in China and other Asian countries.
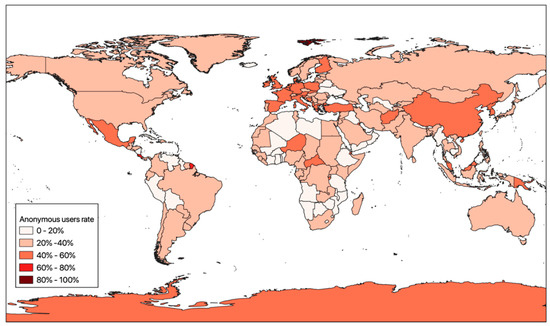
Figure 10.
Distribution rates of open/closed OSM Notes posted by anonymous users.
Next, the characteristics of the most submitted data from the closed OSM Notes data by anonymous users and OSM users, respectively, are shown. A box plot chart was used to compare the differences in number of days required for resolved (closed) OSM Notes and total number of characters between anonymous and non-anonymous user posts (Figure 11a,b). The distribution is generally similar, but most OSM user contributions have few shorter resolution days and more comments. This suggests that OSM users’ comments are generally more controversial when it comes to modifying OSM data. However, it took an average of 2 OSM Notes to resolve all cases. This indicates that posts by OSM users are more likely to provoke discussion on OSM Notes. On the other hand, there is no significant difference in the number of days it takes to solve an issue between anonymous and OSM users in any version, suggesting that easily solvable issues are not necessarily more often posted by anonymous users.
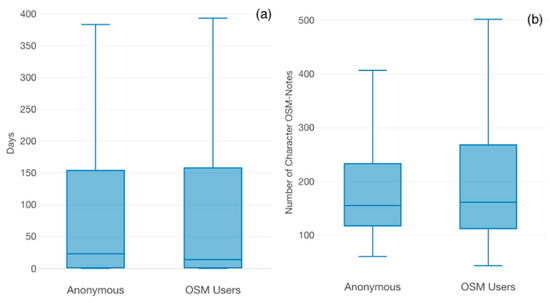
Figure 11.
Comparison of anonymous and OSM users’ closed OSM Notes (a) number of days required for resolution and (b) number of characters.
5.2. OSM Notes Trends Using Maps.me
This section analyzes the distribution of posts using the maps.me application along with the trends in posts by anonymous users. To identify these posts, a string of comments from OSM Notes was extracted. If users post OSM Notes in Maps.me, the hashtag #mapsme were automatically assigned and the posts containing this string in the OSM Notes were tabulated. As OSM comments are multilingual, it is generally challenging to analyze text on a global level. The overall statistics were 53,210 (12.8% of the total) for open OSM Notes and 78,420 (6.0% of the total) for closed OSM Notes each using the map.me application. As illustrated in Figure 12, when the analysis is based on the percentage of posts made using maps.me against OSM Notes, a slightly different trend is evident and the percentage is high in Middle Eastern and African countries, such as Liberia and Yemen. Although users from these countries do not post OSM Notes, data from maps.me, which is available offline and for smartphones, is relatively popular for local OSM data issue posts in these countries. This participation in OSM can be seen as a form of contributing, other than editing OSM data directly.
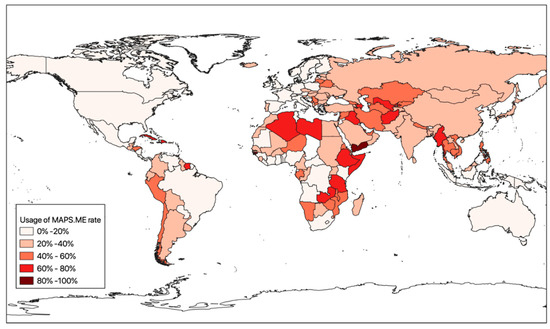
Figure 12.
Distribution rates of OSM Notes posted using maps.me.
5.3. Closed OSM Notes Including the Keyword of “SPAM”
Although such cases did not make up a high percentage of the total, 10,740 posts were identified globally that contained keywords related to SPAM in closed OSM Notes; this was 0.9% of the total. SPAM was explicitly included in the keywords and it could also be found in the case of vandalism using a list of meaningless characters. However, since it is difficult to determine differences between languages, we have focused on the keyword in this study.
Figure 13 shows the percentage of SPAM keywords included in closed posts by country; there were 126 countries where more than one post was confirmed. The comments of OSM Notes in this study are composed of multiple languages, so it is difficult to extract all SPAM text. However, since SPAM comments found in OSM Notes guidelines are reviewed and acted upon by data working group in OSM foundation, it is important to understand trends in OSM Notes, including SPAM keywords, in order to understand where communication impediments are occurring. The countries with particularly high numbers using this keyword are Cameroon, Azerbaijan and Monaco, in that order, with 10% to 22% of the total closed OSM Notes submissions. In particular, Cameroon and Azerbaijan have relatively high rates of such posts from anonymous users and maps.me.
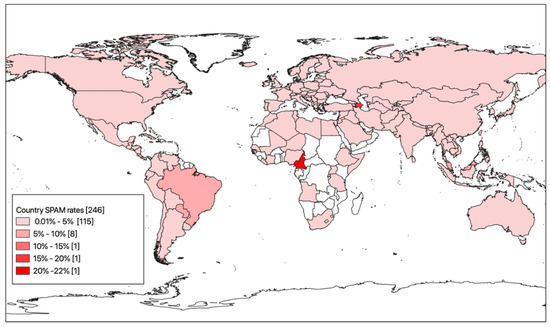
Figure 13.
Figure 13. Distribution rates of OSM Notes include of SPAM keyword.
Next, we describe a characteristic case of OSM Notes containing SPAM messages. Figure 14 shows the cases with the highest number of comments among the OSM Notes. There were 420 comments for #799041, which was the highest amount that included the SPAM keyword that had already been closed and that had undergone the most editorial revisions. The first was a comment on whether Kneipp Street in Freiburg, Germany, is a one-way street. However, there were many additional comments about the shops and communal facilities in this area and various posts were made during about two years after the first post in November 2016. At this point, comments in the middle part were accessible for anonymous users, so there were some disruptive comments. Now, anonymous users can no longer insert posts into unresolved OSM Notes. This is an extreme example of SPAM submissions, but at the same time, about 70 of the cases with “SPAM” as a keyword had more than 10 revisions.
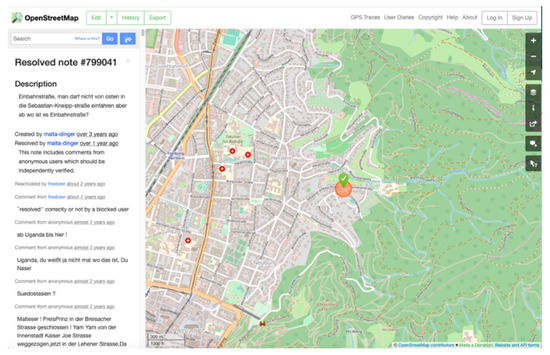
Figure 14.
The most revisions of an OSM Notes case in Germany.
6. Discussion
In this study, we focused on OSM Notes, as a supplementary tool to improve the quality of OSM and analyzed the overall situation mainly using the distribution by country. According to the collected data, 1,726,403 posts were posted during the period from April 2013 to April 2019, when OSM Notes began functioning. In particular, more than 150,000 OSM users contributed to OSM Notes, which had already been resolved (closed) and anonymous users contributed approximately one-third of all posts. In Europe, where OSM is most active, relatively, there were many contributions in Russia, the United States and South America. A detailed analysis of OSM users, anonymous users and data from maps.me in relation to the number of posts by country demonstrates that Asian, Middle Eastern and African countries also had many users. Similarly, it is now possible to analyze further details of the data, such as the resolution time and revised versions, by analyzing the resolved (closed) OSM Notes. In this study, data from the Middle East and Africa were included as it is expected that in the future, more OSM will emerge from these regions, but this was not always sufficient for the confirmation of the reasons behind problems in the OSM data. However, some countries in South America and Eastern Europe are actively using OSM Notes to resolve bugs and some countries have high-resolution rates.
On the other hand, a limitation of this study is that it cannot provide deep insight into the communication between contributors using OSM Notes. This is because the content of the data are multilingual and the data structure of the comment column was complicated and could not be easily extracted. However, as a means of examining the diversity of posted OSM Notes, we suggest the possibility of an additional analysis on the users who commented, focusing on the language used in the comments in addition to the country-specific differences that were examined in this study. Here, we show the geographical distribution of closed OSM Notes using Google Translate API to determine the language of the closed OSM Notes text, using German as an example as it has the most contributions after English (Figure 15). There are 205,846 closed OSM Notes posted in German, which represents 15.7% of the total. From the order of the number of submissions, it is clear that they are heavily entrenched in Europe, coming from Germany (181,886), Austria (11,785) and Switzerland (4583). On the other hand, contributions were also found in some countries of the Asian continent and the Americas, suggesting that German-speaking OSM users are participating globally.
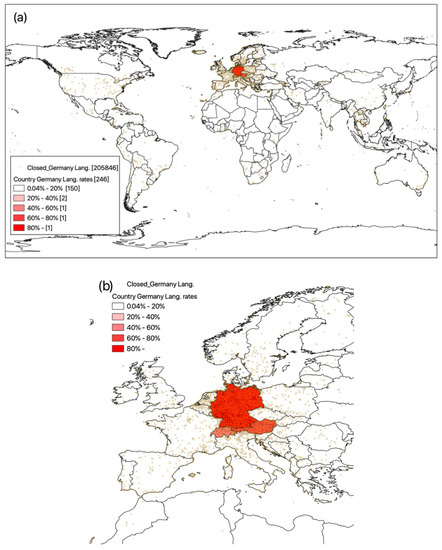
Figure 15.
Geographical distribution of closed OSM Notes text using German (a) worldwide and (b) European countries.
7. Conclusions
The exploratory analysis of OSM Notes in this study provides an understanding of how OSM users practiced quality management. The study discovered new factors to improve the quality of the data, required for the corrections process by anonymous users’ contributions. OSM Notes include detailed user interactions like the communication on proposed solutions to OSM problems. Subsequently, it has the potential to extend the interaction of VGI users. The purpose of this study was to identify regional differences in various aspects of OSM Notes and to make clear the global trends as the continuing activities to compile and improve OSM data.
The previous studies have mainly focused on visualizing of the spatial distribution of OSM Notes and these focused on getting overview of the situation. The advantage of this study especially shows the global trends in OSM Notes data on a country basis and analyses several factors that characterize individual data, OSM Notes can be used to clarify the geographic distribution of OSM data need improvements from multiple perspectives. However, to conduct a more detailed analysis, it would be necessary to analyze the text of the contents, one of unresolved issues of OSM Notes and correspondence between users. However, to conduct a more detailed analysis, it would be necessary to analyze the text of the contents, future predictions of unresolved OSM Notes and correspondence between users. In particular, it is important to undertake quantitative analysis of OSM user interactions. This is actually being discussing in crowdsourcing research, but there are no examples at least for OSM-Notes. Therefore, we believe that the OSM Notes extract script improved in this study can be analyzed from past historical data by improving it so that the text body can be further formatted and extracted.
In future research, text mining of the contents of OSM Notes should reveal more specifically the map features that require editing. However, as mentioned in the previous chapter, OSM Notes is used in a variety of languages, so it would be necessary to focus on linguistic differences in the analysis. More specifically, for example, the “fixme” tag could be used to modify OSM data and comparisons could be made with other data. In addition, since OSM user are not anonymous (with the exception of anonymous posts), it may be possible to investigate the connections between users through replies to comments. These analyses will provide clues to the personal networks of OSM users.
Author Contributions
Conceptualization, Toshikazu Seto; Formal analysis, Toshikazu Seto; Funding acquisition, Yuichiro Nishimura; Methodology, Toshikazu Seto; Resources, Hiroshi Kanasugi; Software, Hiroshi Kanasugi; Writing—original draft, Toshikazu Seto; Writing—review & editing, Yuichiro Nishimura. All authors have read and agreed to the published version of the manuscript.
Funding
This research was funded by the Japan Society for the Promotion of Science (JSPS) KAKENHI, Grant Number 18KT0049 and 18K11987.
Acknowledgments
The authors would like to thank all the contributors involved in OpenStreetMap project. We are also thankful for the suggestions of three anonymous reviewers that improved our work as well as for discussed at the academic track of the State of the Map 2019 conference. OSM-Notes dump data copyrighted OpenStreetMap contributors and available from “https://planet.openstreetmap.org/notes/”.
Conflicts of Interest
The authors declare no conflicts of interest.
References
- Goodchild, M.F. Citizens as sensors: The world of volunteered geography. GeoJournal 2007, 69, 211–221. [Google Scholar] [CrossRef]
- Senarane, H.; Mobasheri, A.; Ali, A.L.; Capineri, C.; Haklay, M. A review of volunteered geographic information quality assessment methods. Int. J. Geogr. Inf. Sci. 2017, 31, 139–167. [Google Scholar] [CrossRef]
- Haklay, M. How good is volunteered geographical information? A comparative study of OpenStreetMap and ordnance survey datasets. Environ. Plan. B Plan. 2010, 37, 682–703. [Google Scholar] [CrossRef]
- Haklay, M.; Basiouka, S.; Antoniou, V.; Ather, A. How many volunteers does it take to map an area well? The validity of Linus’ law to volunteered geographic information. Cartogr. J. 2010, 47, 315–322. [Google Scholar] [CrossRef]
- Mooney, P.; Corcoran, P.; Winstanley, A.C. Towards quality metrics for OpenStreetMap. In Proceedings of the 18th SIGSPATIAL International Conference on Advances in Geographic Information Systems, San Jose, CA, USA, 2–5 November 2010; pp. 514–517. [Google Scholar]
- Neis, P.; Zielstra, D.; Zipf, A. The street network evolution of crowdsourced maps: OpenStreetMap in Germany 2007–2011. Future Internet 2012, 4, 1–21. [Google Scholar] [CrossRef]
- Barron, C.; Neis, P.; Zipf, A. A comprehensive framework for intrinsic OpenStreetMap quality analysis. Trans. Gis. 2014, 18, 877–895. [Google Scholar] [CrossRef]
- Dodge, M.; Kitchin, R. Mapping experience: Crowdsourced cartography. Environ. Plan. A 2011, 45, 19–36. [Google Scholar] [CrossRef]
- Neis, P.; Zipf, A. Analyzing the contributor activity of a volunteered geographic information project—The case of OpenStreetMap. ISPRS Int. J. Geo-Inf. 2012, 1, 146–165. [Google Scholar] [CrossRef]
- Overview about Open/Closed OSM Notes (Neis Ones’ Result Maps). Available online: http://resultmaps.neis-one.org/osm-notes (accessed on 1 May 2020).
- Notes Review. Available online: https://ent8r.github.io/NotesReview/ (accessed on 1 May 2020).
- DE: Notes Map v2.5. Available online: https://greymiche.lima-city.de/osm_notes/ (accessed on 1 May 2020).
- Quattrone, G.; Dittus, M.; Capra, L. Work always in progress: Analysing maintenance practices in spatial crowd-sourced datasets. In Proceedings of the 2017 ACM Conference on Computer Supported Cooperative Work and Social Computing (CSCW’17); Association for Computing Machinery: New York, NY, USA, 2017; pp. 1876–1889. [Google Scholar]
- Yang, A.; Fan, H.; Jing, N.; Sun, Y.; Zipf, A. Temporal analysis on contribution inequality in OpenStreetMap: A comparative study for four countries. ISPRS Int. J. Geo-Inf. 2016, 5, 5. [Google Scholar] [CrossRef]
- Yeboah, G.; Rafael, T.; Vangelis, P.; Porto, J.A. Analysis of OpenStreetMap data quality at different stages of a participatory mapping process: Evidence from informal urban settings. In Proceedings of the Academic Track at the State of the Map 2019, Heidelberg, Germany, 15 September 2019; pp. 7–8. [Google Scholar]
- Anderson, J.; Sarkar, D.; Palen, L. Corporate editors in the evolving landscape of OpenStreetMap. ISPRS Int. J. Geo-Inf. 2019, 8, 232. [Google Scholar] [CrossRef]
- OSM-QA Tiles. Available online: https://osmlab.github.io/osm-qa-tiles/ (accessed on 1 May 2020).
- OSM Changeset Analyzer (OSMCha). Available online: https://osmcha.org/ (accessed on 1 May 2020).
- Raifer, M.; Troilo, R.; Kowatsch, F.; Auer, M.; Loos, L.; Marx, S.; Przybill, K.; Fendrich, S.; Mocnik, F.; Zipf, A. OSHDB: A framework for spatio-temporal analysis of OpenStreetMap history data. Open Geospat. DataSoftw. Stand. 2019, 4, 1–12. [Google Scholar] [CrossRef]
- Bégin, D.; Devillers, R.; Roche, S. The life cycle of contributors in collaborative online communities—The case of OpenStreetMap. Int. J. Geogr. Inf. Sci. 2018, 32, 1611–1630. [Google Scholar] [CrossRef]
- Minghini, M.; Frassinelli, F. OpenStreetMap history for intrinsic quality assessment: Is OSM up-to-date? Open Geospat. DataSoftw. Stand. 2019, 4, 9. [Google Scholar] [CrossRef]
- OpenStreetMap contributors. OpenStreetMap Notes Planet Dump. Available online: https://planet.openstreetmap.org/notes/ (accessed on 1 May 2020).
- OpenStreetMap Notes: Some Interesting Stats. Available online: https://www.openstreetmap.org/user/joost%20schouppe/diary/43057 (accessed on 1 May 2020).
- Al-Batlaa, A.; Abdullah-Al-Wadud, M.; Anwar, M. A method to suggest solutions for software bugs. ICIEV IciVPR 2019, 169–172. [Google Scholar]
- Xu, L.; Kwan, M.P.; McLafferty, S.; Wang, S. Predicting demand for 311 non-emergency municipal services: An adaptive space-time kernel approach. Appl. Geogr. 2017, 89, 133–141. [Google Scholar] [CrossRef]
- Offenhuber, D. Infrastructure legibility: A comparative analysis of Open311-based citizen feedback systems. Camb. J. Reg. Econ. Soc. 2014, 8, 93–112. [Google Scholar] [CrossRef]
- Planet OSM. Available online: http://planet.openstreetmap.org/Notes/ (accessed on 1 May 2020).
- Notes-OpenStreetMap Wiki. Available online: https://wiki.openstreetmap.org/wiki/Notes (accessed on 1 May 2020).
- Osn2osm. Available online: https://github.com/tbicr/osn2osm/ (accessed on 1 May 2020).
- Osn2osm in 2019. Available online: https://github.com/sekilab/osn2osm/ (accessed on 1 May 2020).
- Thematicmapping World Borders. Available online: http://thematicmapping.org/downloads/world_borders.php/ (accessed on 1 May 2020).
© 2020 by the authors. Licensee MDPI, Basel, Switzerland. This article is an open access article distributed under the terms and conditions of the Creative Commons Attribution (CC BY) license (http://creativecommons.org/licenses/by/4.0/).