Article

Spatiotemporal Analysis of Taxi-Driver Shifts Using Big Trace Data

1
State Key Laboratory for Information Engineering in Surveying, Mapping and Remote Sensing, Wuhan University, Wuhan 430079, China
2
School of Geography and Information Engineering, China University of Geosciences, Wuhan 430078, China
3
Institute of Space and Earth Information Science, The Chinese University of Hong Kong, Hong Kong, China
4
School of Urban Design, Wuhan University, Wuhan 430070, China
5
Urban Informatics & Spatial Computing Lab, Department of Informatics, New Jersey Institute of Technology, Newark, NJ 07102, USA
*
Author to whom correspondence should be addressed.
ISPRS Int. J. Geo-Inf. 2020, 9(4), 281; https://doi.org/10.3390/ijgi9040281
Submission received: 21 February 2020 / Revised: 27 March 2020 / Accepted: 17 April 2020 / Published: 24 April 2020

Abstract

:
In taxi management, taxi-driver shift behaviors play a key role in arranging the operation of taxis, which affect the balance between the demand and supply of taxis and the parking spaces. At the same time, these behaviors influence the daily travel of citizens. An analysis of the distribution of taxi-driver shifts, therefore, contributes to transportation management. Compared to the previous research using the real shift records, this study focuses on the spatiotemporal analysis of taxi-driver shifts using big trace data. A two-step strategy is proposed to automatically identify taxi-driver shifts from big trace data without the information of drivers’ identities. The first step is to pick out the frequent spatiotemporal sequential patterns from all parking events based on the spatiotemporal sequence analysis. The second step is to construct a Gaussian mixture model based on prior knowledge for further identifying taxi-driver shifts from all frequent spatiotemporal sequential patterns. The spatiotemporal distribution of taxi-driver shifts is analyzed based on two indicators, namely regional taxi coverage intensity and taxi density. Taking the city of Wuhan as an example, the experimental results show that the identification precision and recall rate of taxi-driver shift events based on the proposed method can achieve about 95% and 90%, respectively, by using big taxi trace data. The occurrence time of taxi-driver shifts in Wuhan mainly has two high peak periods: 1:00 a.m. to 4:00 a.m. and 4:00 p.m. to 5:00 p.m. Although taxi-driver shift behaviors are prohibited during the evening peak hour based on the regulation issued by Wuhan traffic administration, experimental results show that there are still some drivers in violation of this regulation. By analyzing the spatial distribution of taxi-driver shifts, we find that most taxi-driver shifts distribute in central urban areas such as Wuchang and Jianghan district.

1. Introduction

As an important part of the urban public transport system, taxis are very important for the daily travel of citizens, especially in the bustling cities [1,2,3]. However, with the fast development of urbanization, problems such as the contradiction of taxi supply and customer demand, the low efficiency of taxi operation, and poor service of the taxi industry are becoming more and more obvious, especially in developing countries such as China. Research on how to improve the operating efficiency of the urban taxi system and optimize the public transport services is of significant importance in order to create a green and harmonious public traffic system [4]. One of the big improvements that could make urban taxis more efficient is regulating taxi-driver shift behaviors. Taxi-driver shift refers to the process of changing shifts of taxi drivers. Taxi-driver shift behavior are caused by the fact that taxi drivers share the same taxi and take turns using the taxi for a living. Typically, taxi drivers spontaneously reach a consensus on the specific shift time based on profit distribution and break time, and then conduct taxi-driver shifts to complete the taxi operation throughout the day. At present, there are no unified and appropriate taxi-driver shift locations in China’s big cities. The locations of taxi-driver shifts depending on the convenience are simply decided by the oral agreement of both drivers and are usually fixed. In order to balance the income of each driver in a day, a period of active travel in city is usually guaranteed in each driver’s shift. Therefore, the most direct and effective method chosen by most drivers is to take shifts in the middle of the evening rush hour so that both sides can share the benefits of prime time. However, due to these common habits of taxi drivers in taxi-driver shift behaviors, many taxi drivers may be on their way to deliver the taxi to the next partnered driver during the evening rush hour. When the taxi drivers in the whole city are engaged in the taxi-driver shift activities during this period, the whole city will be in the state of no taxi service. Thus, the phenomenon of passenger rejection in rush hour is very common, and it is difficult for the public to get a taxi, which brings serious inconvenience to public travel. Therefore, the taxi-driver shift event as a basic part of taxi operation process is not only an important link of work shifts but also plays an important role in equilibrating the demand and supply of taxis [5,6,7,8]. In addition, a taxi often has a parking state of waiting for the next driver during a taxi-driver shift activity. So, thousands of urban taxis will occupy a large amount of urban land in a collective shift period, resulting in the shortage of land resources and congestion in big cities. To alleviate the problem, China’s major provincial capitals have enacted laws in the past decade that prohibit taxis from taking shifts during the evening rush hours, but these have shown little effect. At the same time, some scholars have done relevant research seeking to improve this problem. Most of the existing research for taxi-driver shift events intends to improve the taxi service performance by building models to explicitly consider taxi-driver shift schedule. For instance, researchers claimed that taxi drivers worked on a shift basis, with eight hours per shift, and most of the taxis operate on two or three shifts by more than one driver every day [9,10]. The taxi-driver shift schedule was usually used to divide the operation time of a taxi in a day into different shifts. Then, the service model of taxis can be constructed based on the factors of each work shift such as taxi operating cost, service intensity, waiting time, weather condition and so on [6,9,11,12]. Beyond that, a few studies proposed to establish the model to obtain the optimized schedule or parking spots for taxi-driver shifts [13,14]. For example, Meng et al. [13] constructed a model of taxi-driver shift behavior by analyzing customer demand of taxis under different weather conditions and travel intensity of citizens. Then, the taxi-driver shift model was used to provide information about the optimized parking spots for taxi-driver shift activities. Li et al. [14] applied an optimized fuzzy clustering method to obtain the districts of traffic zone and then used the shortest path algorithm to obtain the best parking spot of the taxi-driver shift in each district. Sun et al. [15] analyzed the spatiotemporal distribution of taxi-driver shift event in Beijing city by using the taxis’ GPS data and IC card information of taxi drivers. Although they provided a case study of taxi-driver shift event analysis, most taxi trajectories do not record the information of drivers, such as his or her employee number, from the perspective of privacy protection. Spatiotemporal distribution analysis of taxi-driver shift events by using taxi GPS trajectories without taxi drivers’ IC card data still faces challenges, including how to detect the taxi-driver shift activities from all parking events and explore its distribution features in the context of space–time to assist decision-making for governments or policymakers.
The objective of this study is to automatically detect taxi-driver shift activities using big trace data collected by taxis and further analyze their spatiotemporal distribution features. Its significance lies in the intelligent detection and identification of the distribution of taxi-driver shifts to promote the management of urban traffic and facilitate people’s travel. It also contributes to the acquisition of dynamic traffic information in the construction of smart cities. To detect taxi-driver shift activities, a two-step strategy has been designed. First, the frequent spatiotemporal sequential pattern mining algorithm was used to detect the frequent spatiotemporal sequences from all parking events. Then, a Gaussian model was constructed based on the prior knowledge of taxi-driver shift events to further identify taxi-driver shift events from all frequent spatiotemporal sequences in the second step. The spatiotemporal distribution of the detected taxi-driver shift events is analyzed based on two indicators: regional coverage intensity and density. Taking Wuhan city as an example, the experimental results show that the taxi-driver shift events have two high peak periods: from 1:00 a.m. to 4:00 a.m. and 4:00 p.m. to 5:00 p.m. About 10.35% of the taxi-driver shifts seriously violated the regulation issued by Wuhan traffic administration. In addition, the experimental results show that the parking locations of most taxi-driver shift events distribute in a central urban area, which is in accordance with the drivers’ goal of increasing income. Meanwhile, the Wuchang district and Jianghan district have the strongest intensity and density distributions of taxi-driver shifts, respectively. These results will help policymakers and governments decide when and where to step up road patrols and prevent traffic jams. Our main contributions in this paper are as follows:
  • A two-step strategy is designed in this study to automatically detect taxi-driver shift activities from big trace data, without drivers’ identity information. The experimental results showed that the identification accuracy and recall of taxi-driver shift activities in the city of Wuhan can reach about 95% and 90%, respectively. This identification method can monitor the distribution of urban taxi-driver shifts in a timely manner and detect the occurrence of taxi-driver shifts at a low cost, thus providing technical support for intelligent traffic management in the future.
  • The spatiotemporal distribution of the detected taxi-driver shift events is analyzed based on two indicators: regional coverage intensity and density. The statistical results of taxi-driver shift events in the context of space-time can assist in traffic management and taxi supervision, such as checking the illegal taxi-driver shift behaviors and serving as a reference for the site selection of parking lots for taxi-driver shifts, and thus alleviate the problems caused by the taxi-driver shifts and promote the convenience of the city.
The rest of this paper is organized as follows. Section 2 demonstrates the proposed method for detecting taxi-driver shift events using big trace data. Section 3 evaluates the effectiveness of the proposed method and analyzes the spatiotemporal distribution of taxi-driver shift events by using big trace data collected by taxis in the city of Wuhan. Finally, Section 4 concludes the findings and discusses future work.

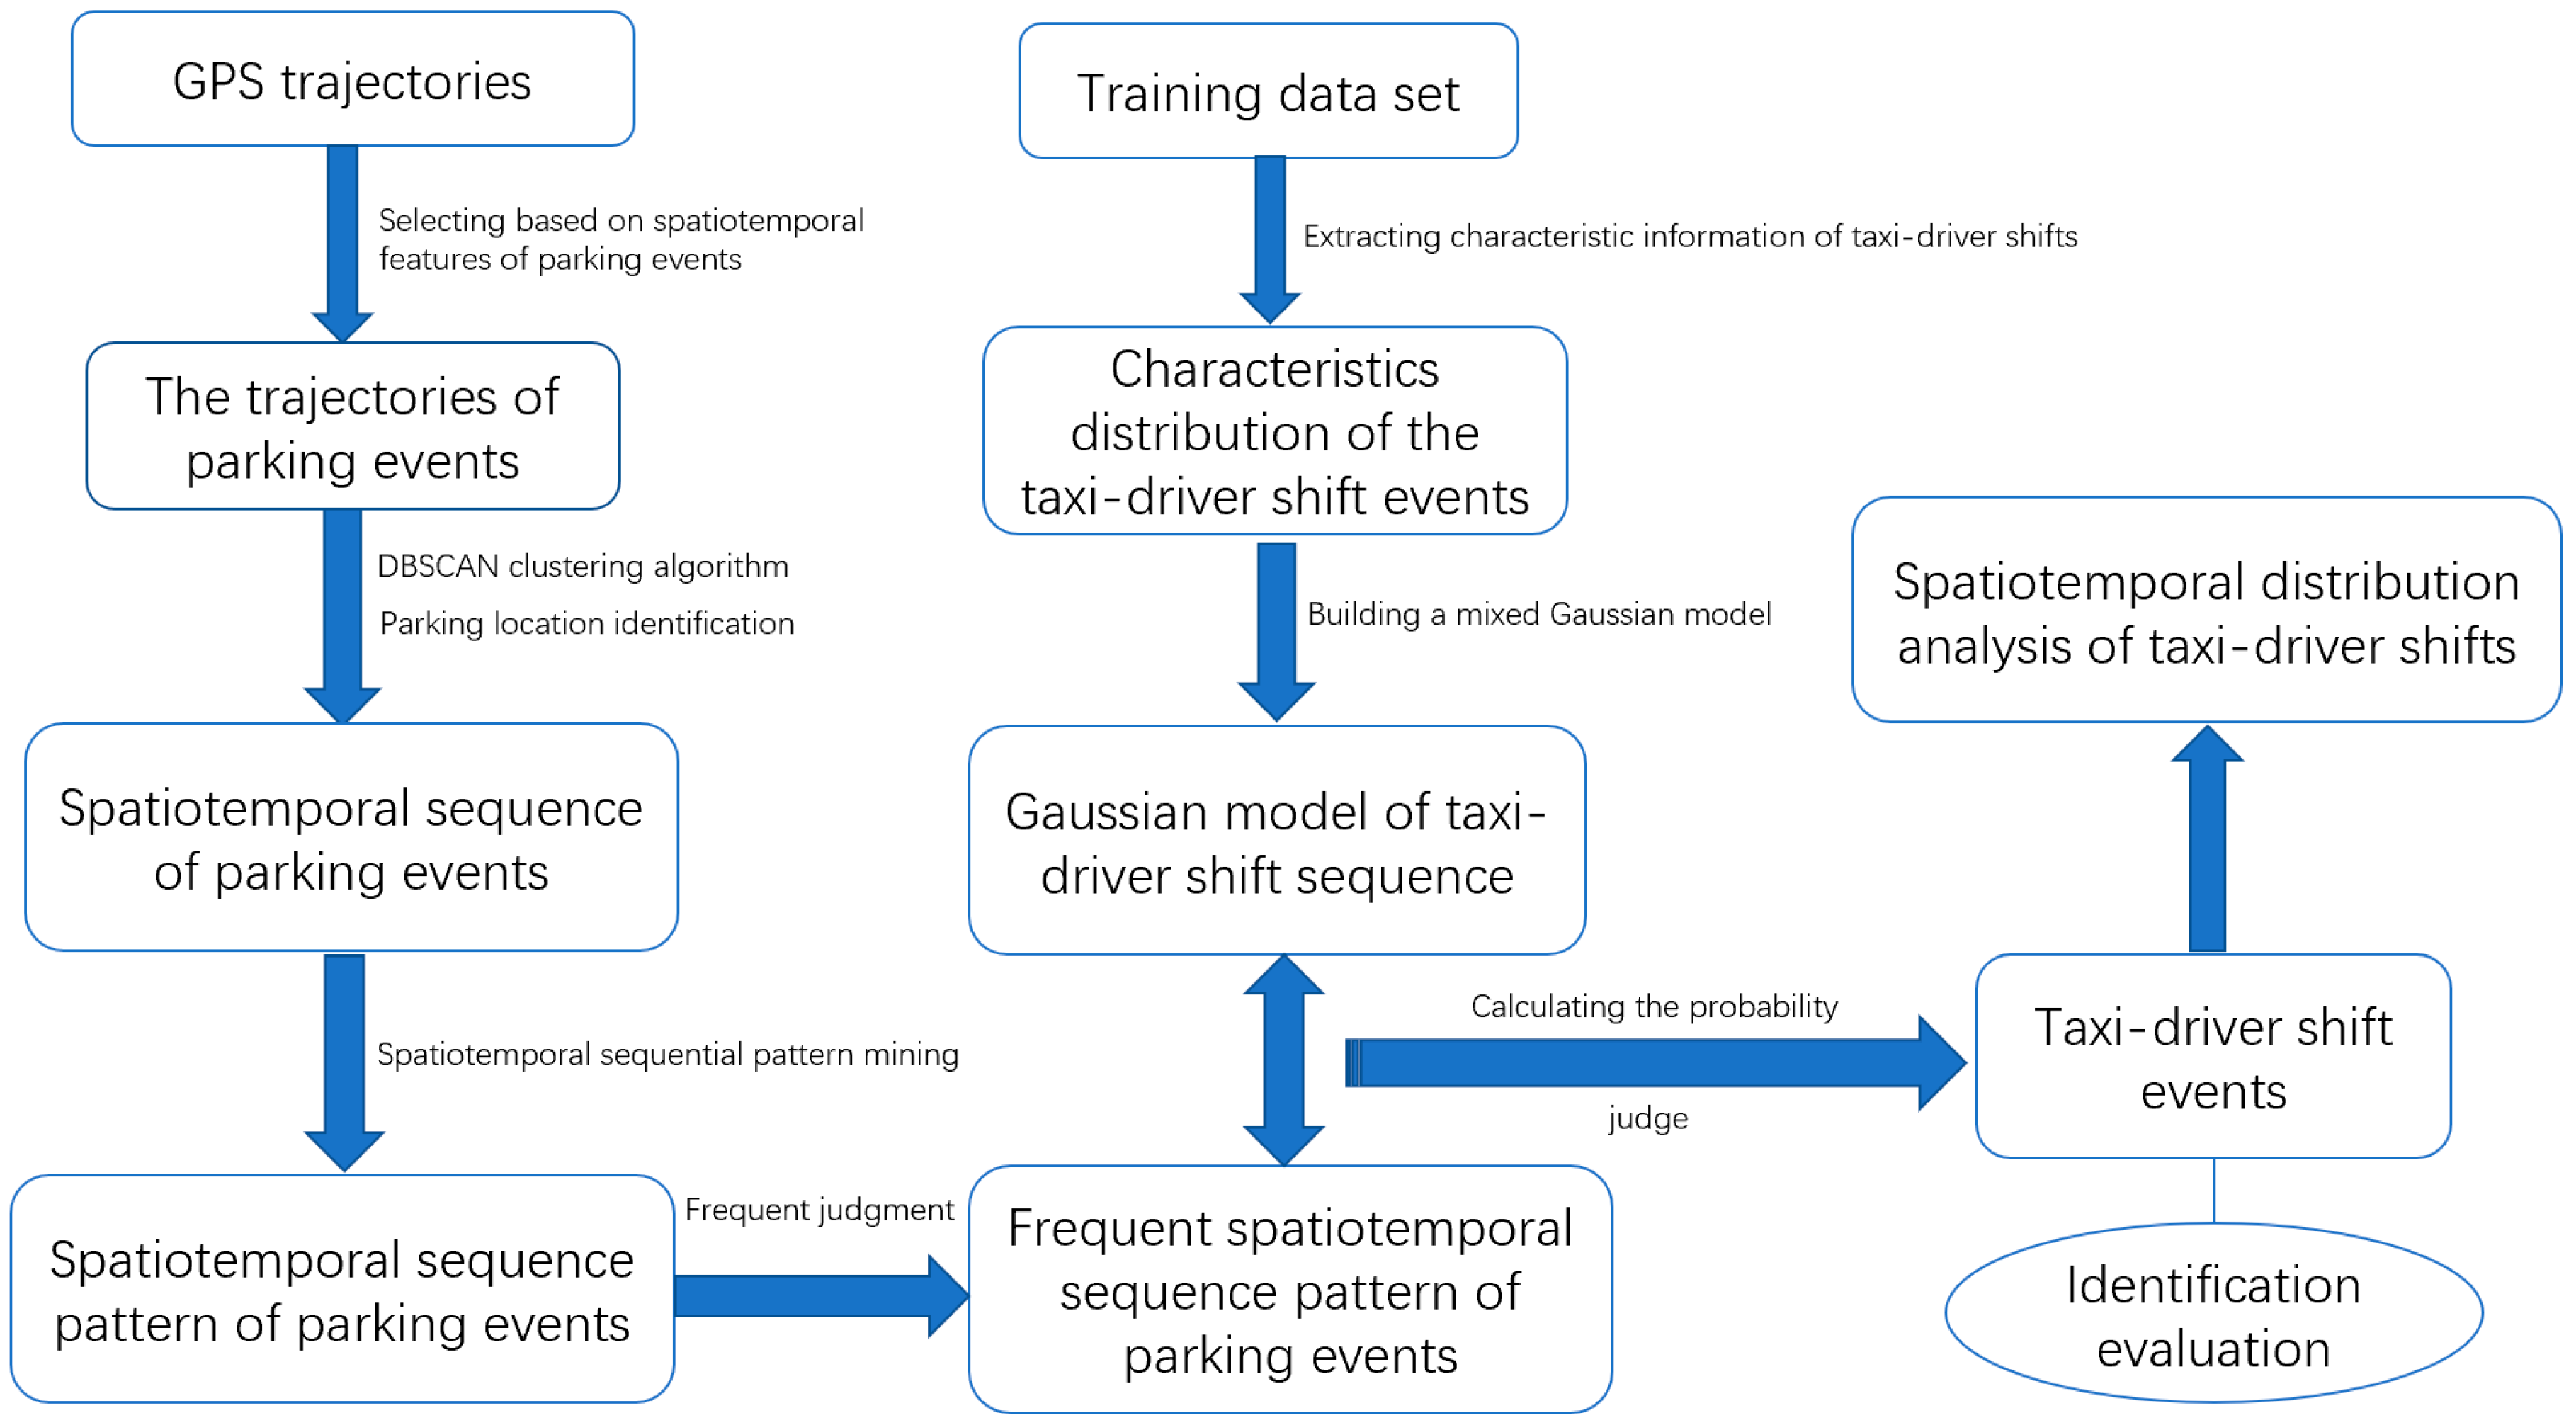
2. The Methodology of Taxi-Driver Shift Activity Detection
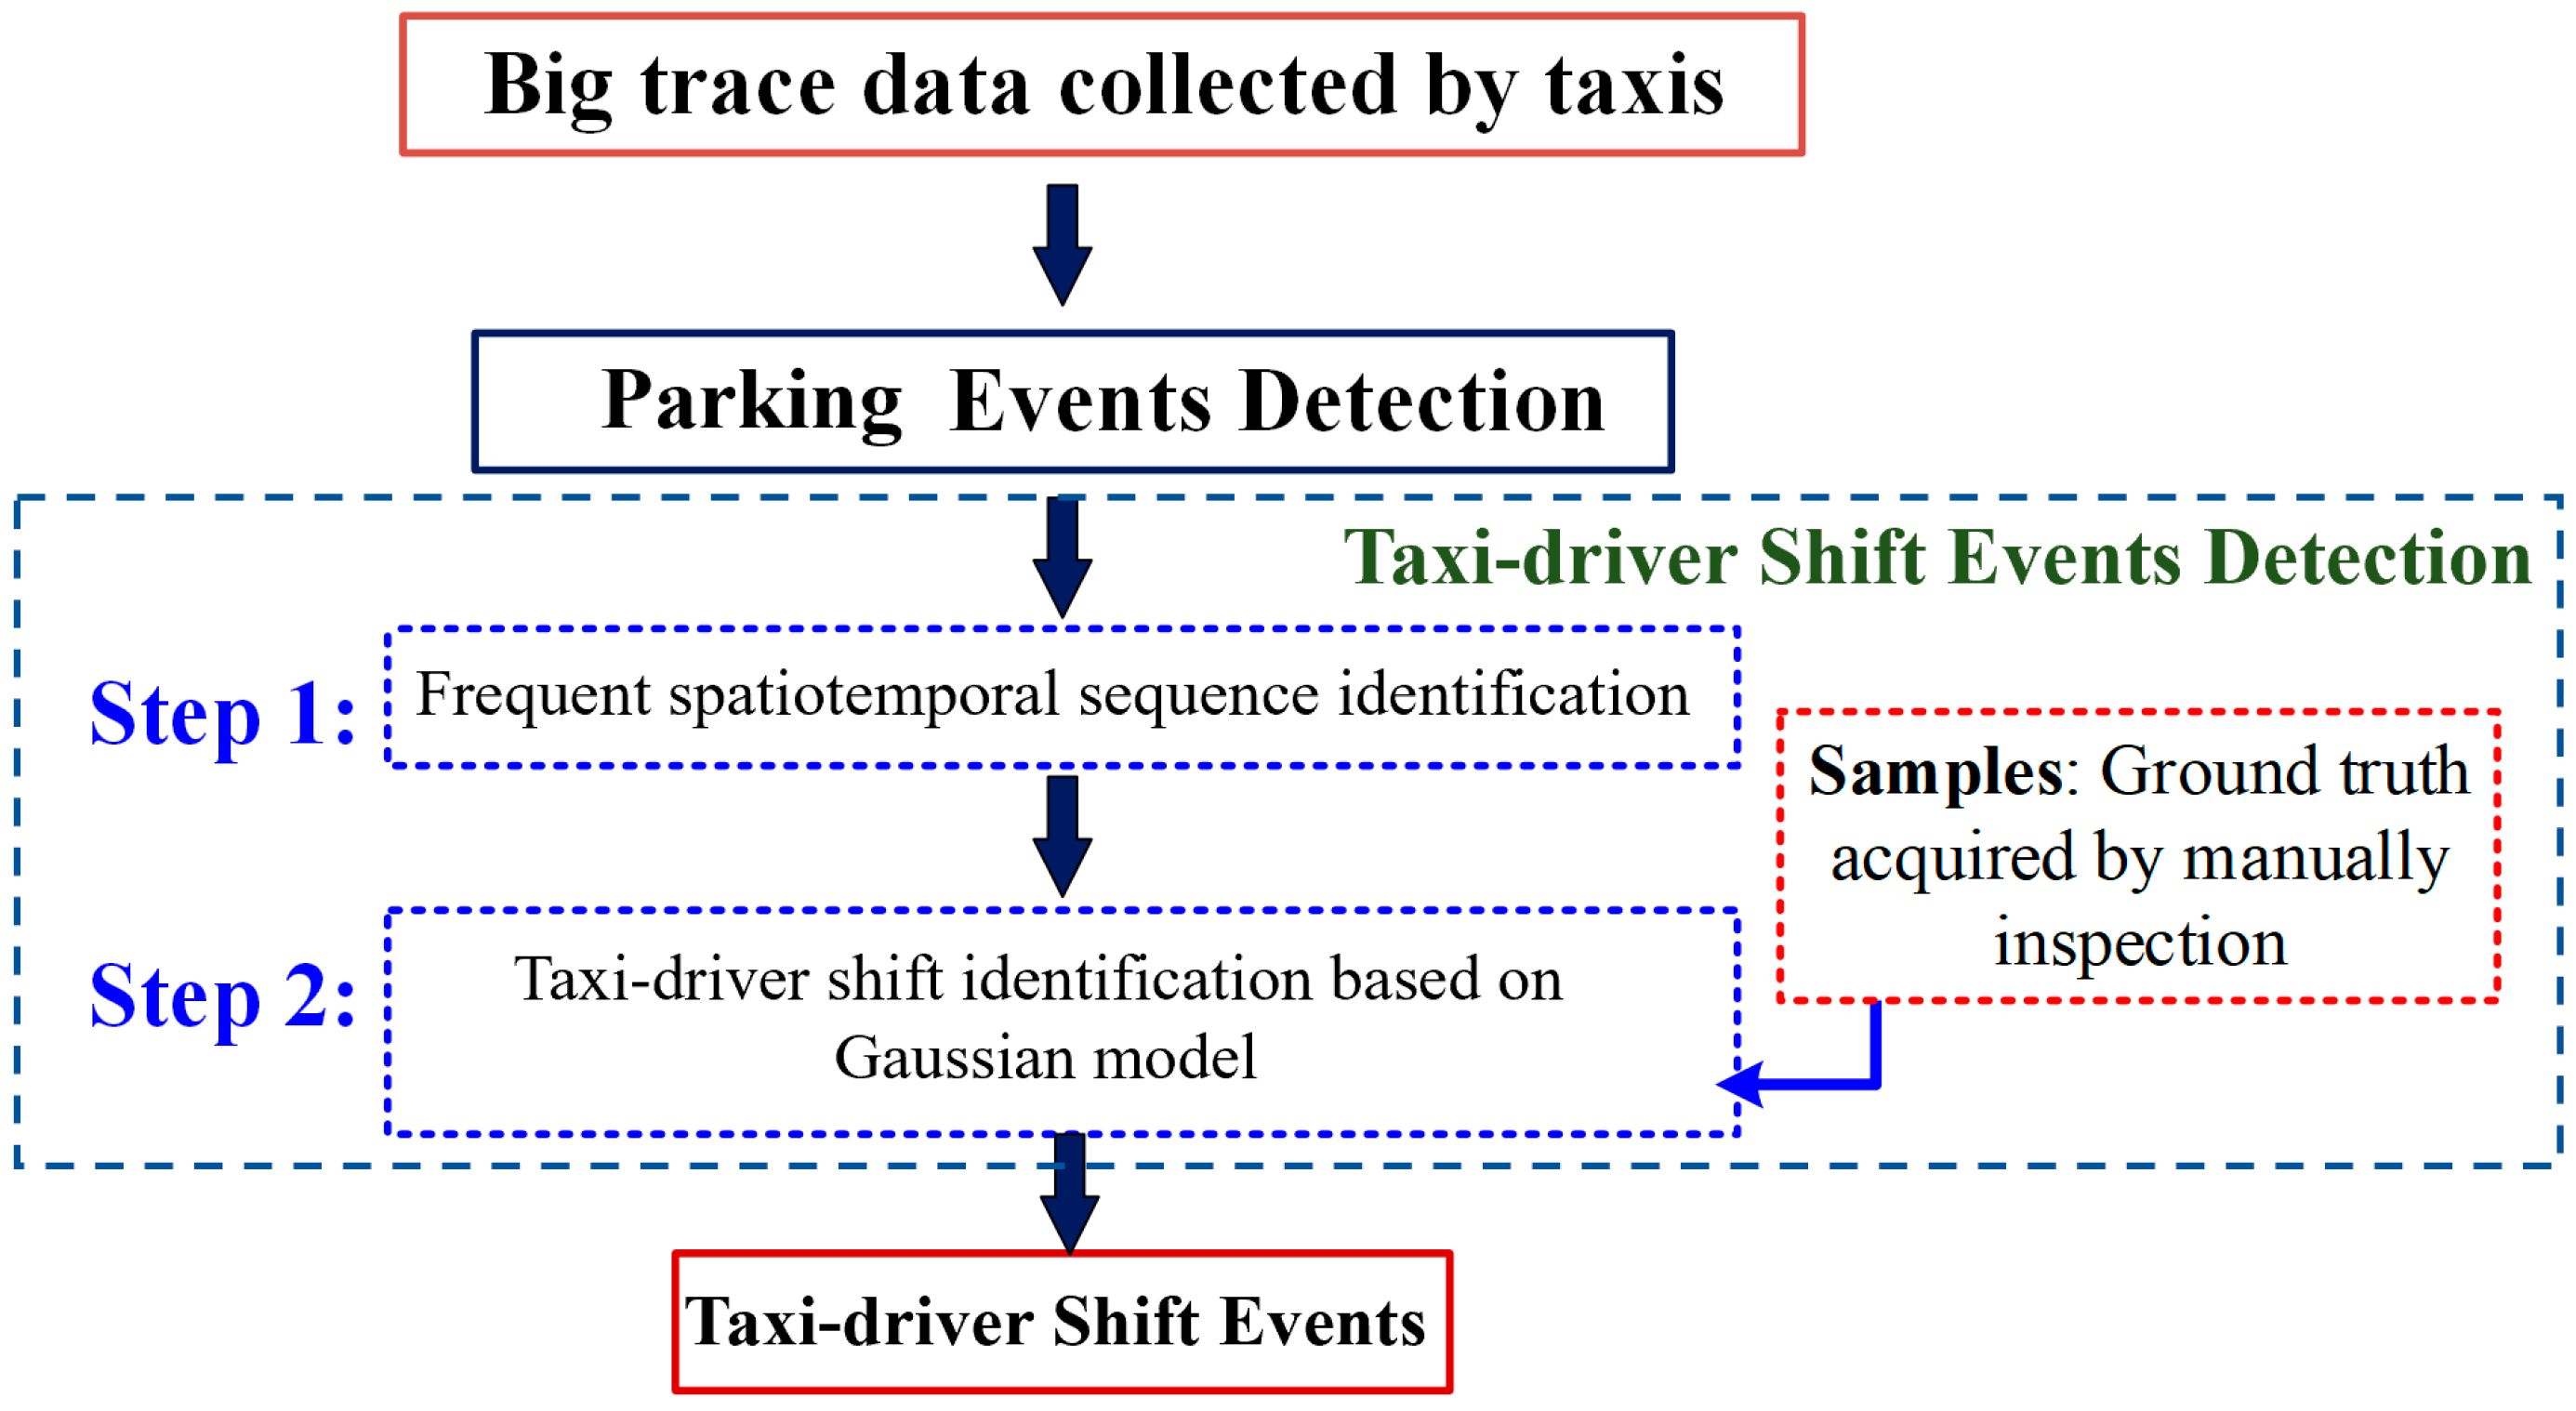
2.1. Overview

As shown in Figure 1, a two-step strategy was proposed to automatically detect taxi-driver shift events from big trace data. First, the theory of spatiotemporal sequence analysis is applied to pick out the frequent spatiotemporal sequences from all parking events. Then, taxi-driver shift events are identified from all frequent spatiotemporal sequences by using the Gaussian model. Here, the prior knowledge used for constructing the Gaussian model was obtained from the ground truth which was confirmed by manual inspection.

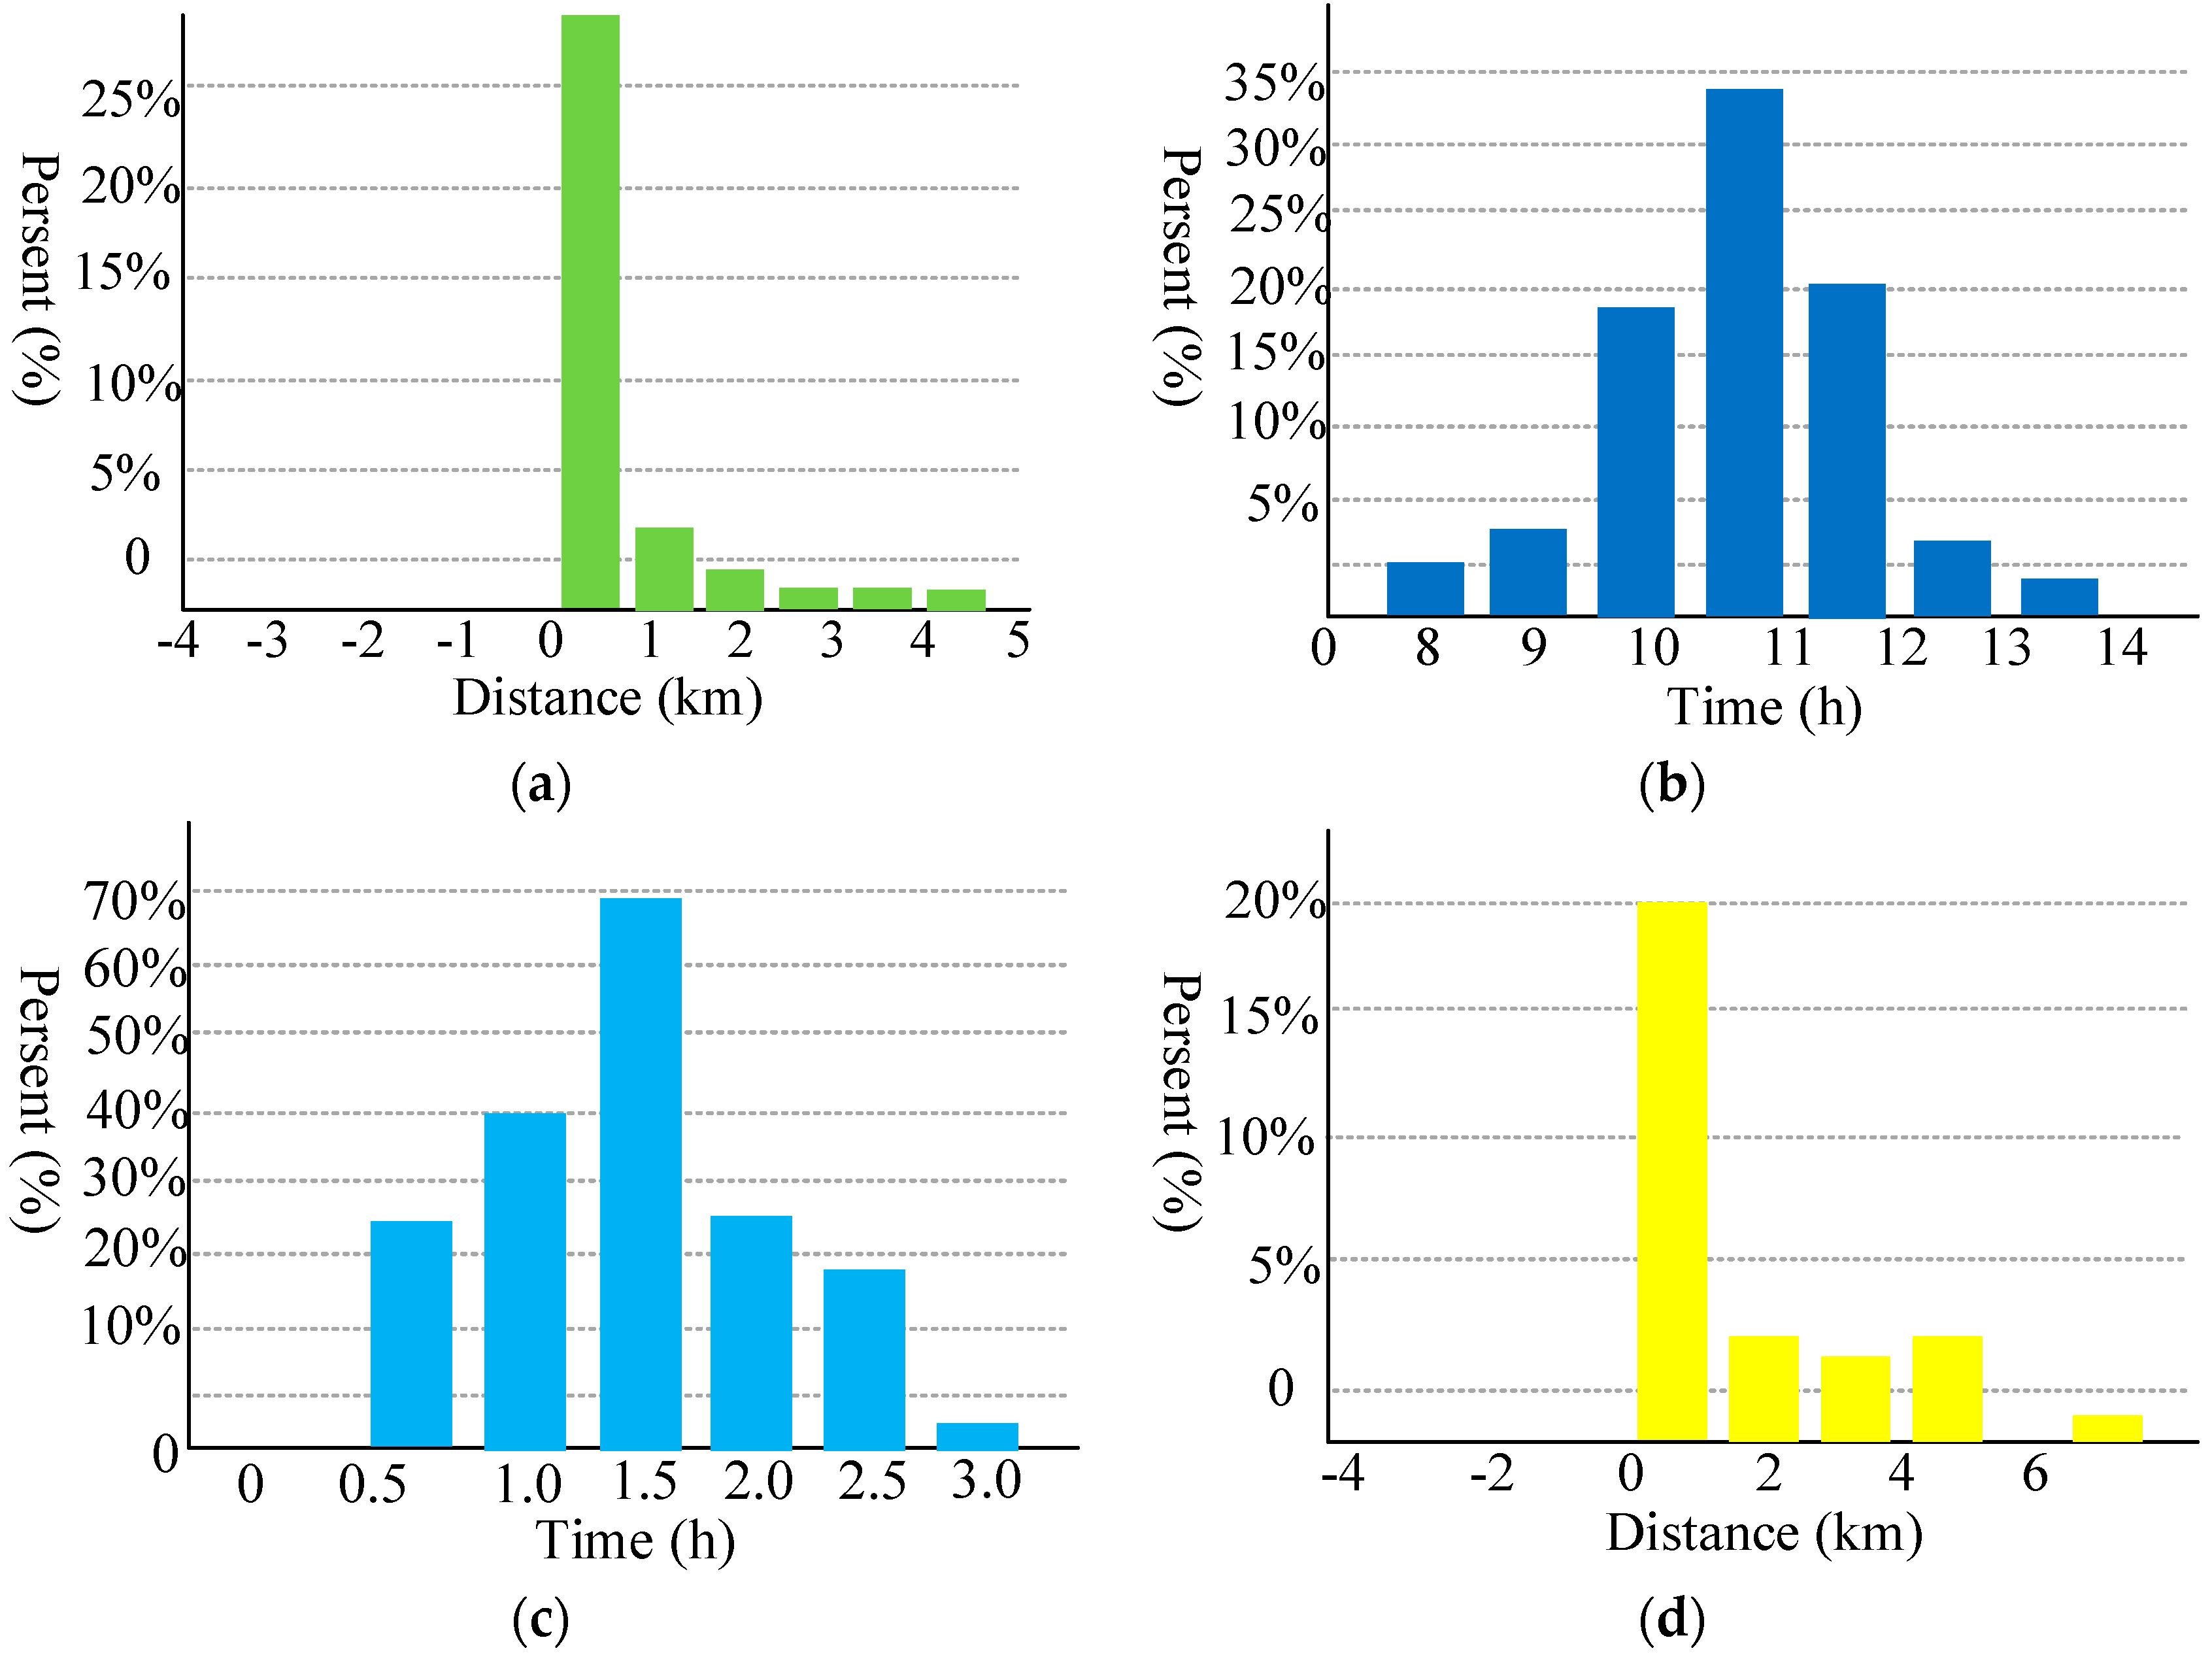
2.2. Taxi-Driver Shift Behavior Analysis

Parking events frequently occur during a day of taxi operation, such as taking shifts, picking up passengers, having a meal, refueling, and idling due to traffic jam. The information of these parking events mixes in one vehicle trajectory, which brings challenges for taxi-driver shift event detection. The taxi-driver shift activities are produced by job-sharing, as most taxis operate on two or three shifts by more than one driver every day. For individual taxis, the time and place of taxi-driver shifts is regular, and drivers sharing a taxi usually take shifts at about the same time and place every day based on their own convenience. However, the shift schedule and place vary across individual taxis or drivers [9]. For example, there are about 20,000 taxis in Wuhan city, and each taxi adopts a two-shift operation mode. These taxis may take shifts at different specific times and locations, but in general, the shift times are similar. Because the income of taxi drivers is related to the travel intensity of citizens, each shift in Wuhan city includes peak travel to equilibrate the income of each driver [16]. The behavior of taxi-driver shift activities in this study is illustrated from two aspects: time and space.

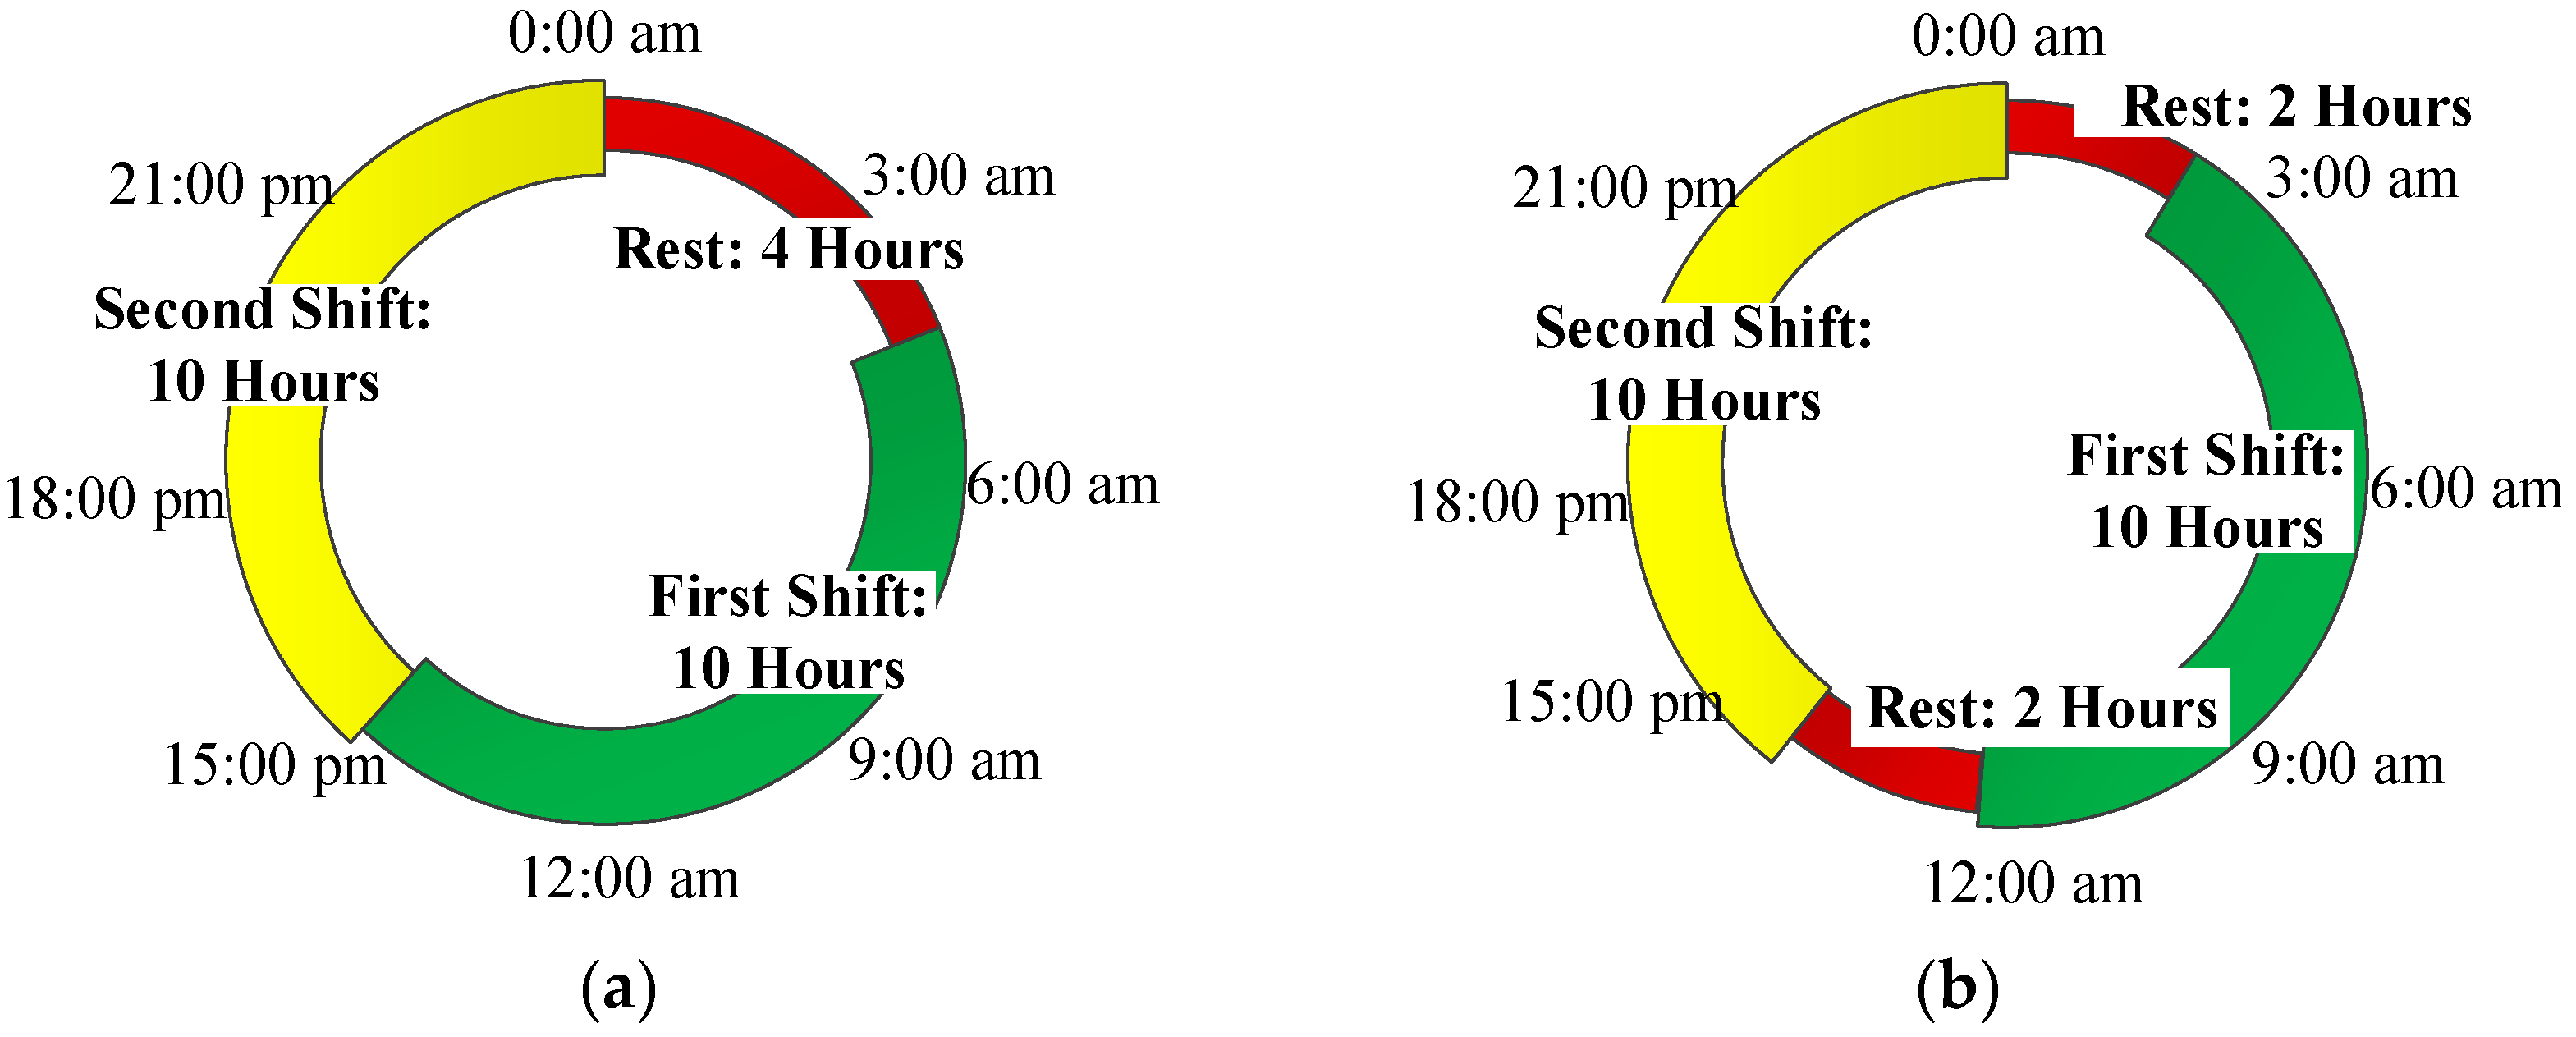
2.2.1. Schedule of Taxi-Driver Shift Activities

Taking Wuhan city as a case, a full operation cycle for a taxi takes 24 h and runs on a two-shift operation mode. Most taxi drivers work for 10 h per day, and they will choose to rest during non-rush hours [10]. Based on the rule of travel activities of citizens, the two-shift operation mode of taxi drivers may contain two possibilities because of the rest schedules, as shown in Figure 2. One is to have a rest in the morning from 0:00 a.m. to 4:00 a.m. (see Figure 2a), and the other is to take a break in the morning from 0:00 a.m. to 2:00 a.m. and at the noon from 12:00 a.m. to 2:00 p.m. (see Figure 2b). In the first instance, the first shift ranges from 4:00 a.m. to 3:00 p.m. and the second shift ranges from 3:00 p.m. to 0:00 a.m. In the second instance, the first shift ranges from 2:00 a.m. to 12:00 a.m. and the second shift ranges from 2:00 p.m. to 0:00 a.m.

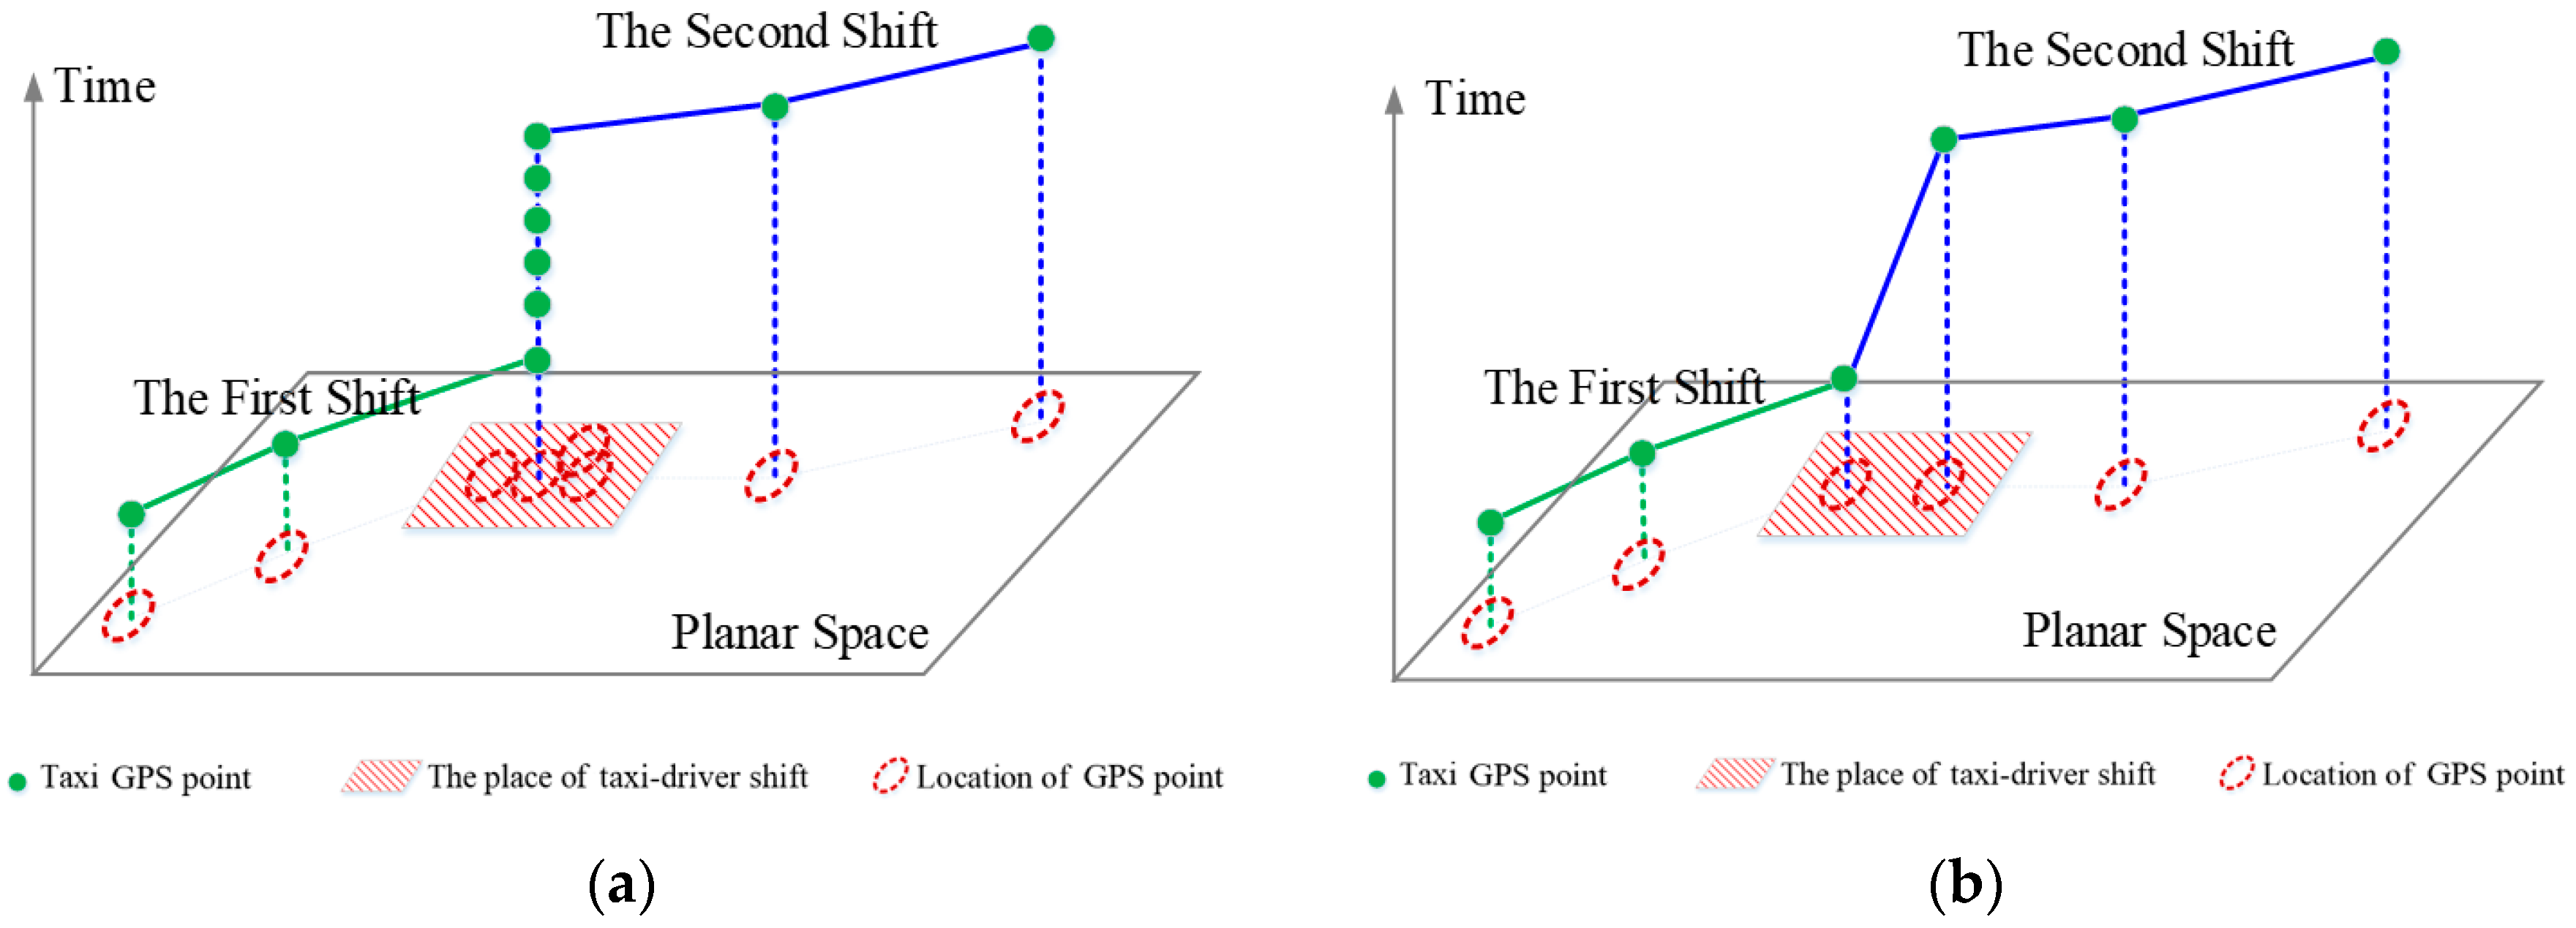
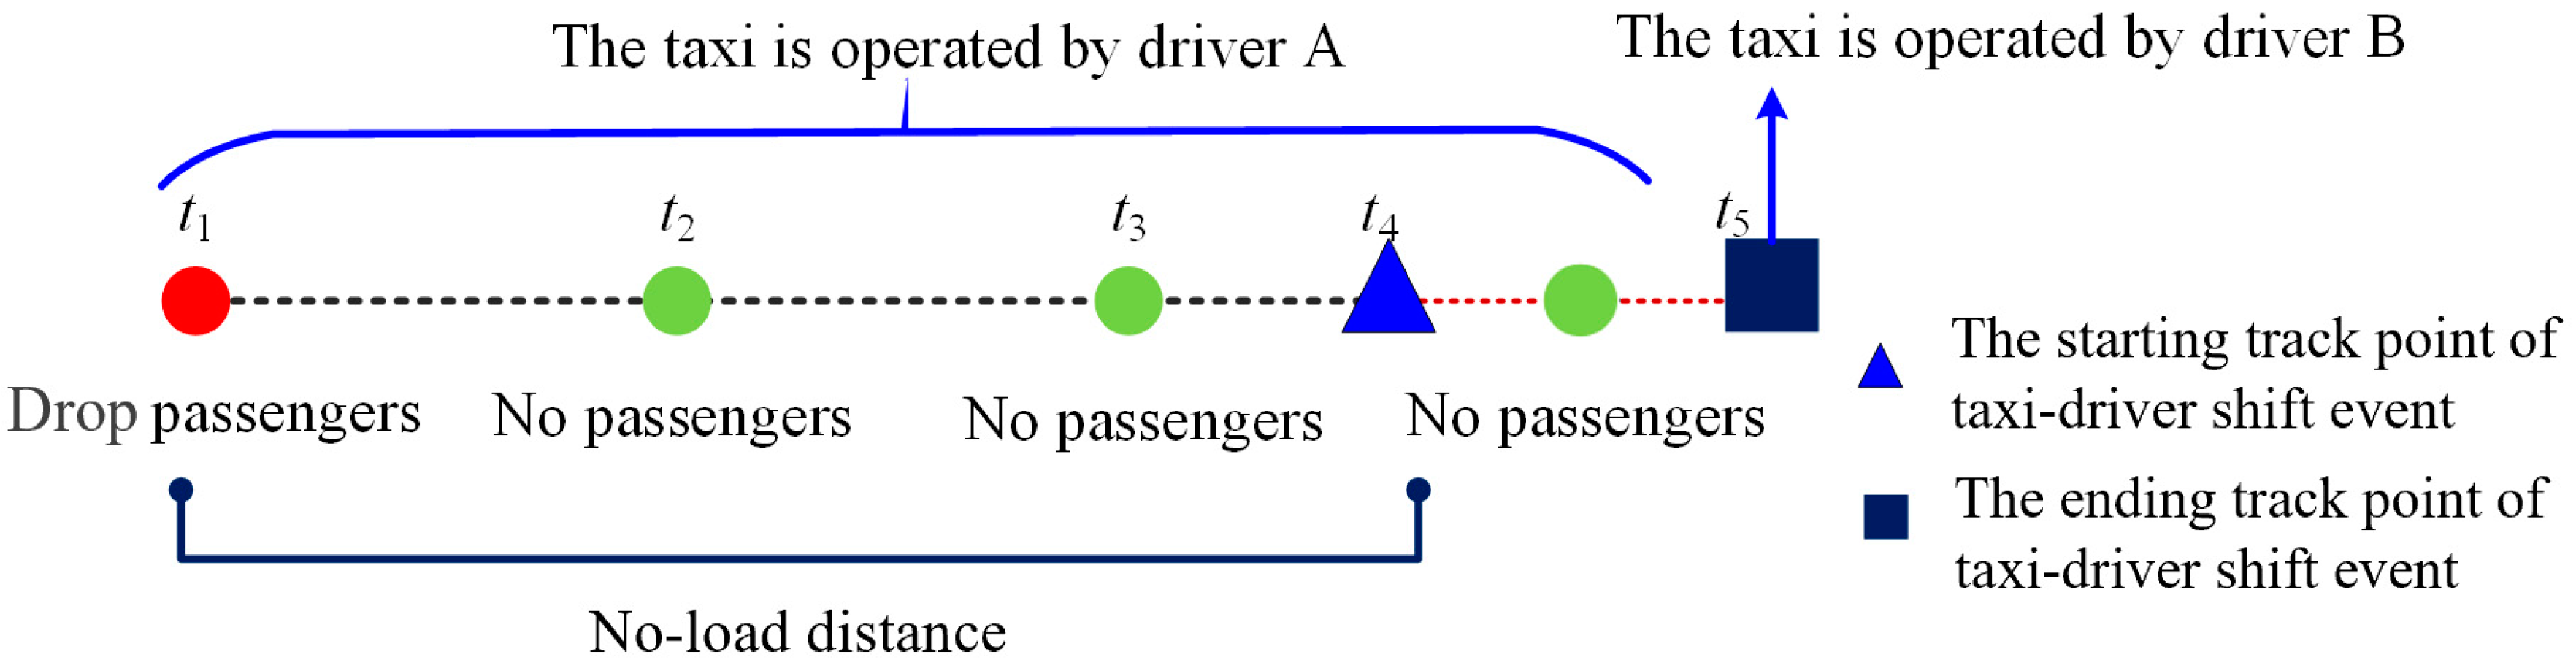
2.2.2. GPS Data Recording During Taxi-Driver Shift Activities

For taxi GPS trajectories, there are two kinds of data record formats for taxi-driver shift activities, as shown in Figure 3. The first one is to record many GPS points located in the same shift place as the power of the GPS device is on, as shown in Figure 3a. In addition, in the case of the power failure of the GPS device, there are only two GPS track points that are collected during the taxi-driver shift event occurrence. One is collected in the previous shift, and the other is obtained at the beginning of the current shift (see Figure 3b). For most of the taxis, the shift place for drivers who operate one taxi is fixed, although the shift schedule may change with the operation situation [14].

2.3. The Methodology of Taxi-Driver Shift Activity Detection

Based on the above analysis, the taxi-driver shift activities of a taxi in a full operation cycle is regarded as a sequential event. The length of this sequential event is equal to the number of shifts. For example, the length of the sequential event for taxis in Wuhan is 2 because of running on a two-shift operation mode. For a taxi, the shift operation mode occurs every day and it is cyclically repetitive. Based on the time sequence theory, the taxi-driver shift activity belongs to a frequency sequence [17]. It needs to be stressed that the frequent spatiotemporal sequences not only contain taxi-driver shift activities but also contain the other parking events. However, taxi-driver shift events have their own characteristics that other parking events do not have, which gives us an opportunity to identify them. Therefore, to accurately detect taxi-driver shift activities from all parking events, this paper proposes a two-step strategy to detect taxi-driver shift activities. The first step is to detect the frequent spatiotemporal sequential patterns from all parking events. Then, a Gaussian model is constructed based on the prior knowledge of taxi-driver shift events to further identify which frequent spatiotemporal sequential patterns belong to the taxi-driver shift activity in the second step.

2.3.1. Frequent Spatiotemporal Sequences Identification

In this study, the parking event that occurred during taxi operation is denoted as Pe, where Pe = (l, t) and l and t are the location and time of Pe occurring, respectively. Based on the method proposed by Giannotti et al. [17], the spatiotemporal sequence of taxi-driver shift activity is marked as TAS (Temporally Annotated Sequence). In this study, the GPS trajectory of taxis is denoted as T. The information of all parking events, including the occurrence location and time, is contained in the trajectory T. To obtain the sequences of events from a whole trajectory T, we first segment T into a series of subsequences (denoted as Tk) based on the operation cycle of taxis. Since there are 24 h in an operation cycle of a taxi, each Tk is collected in 24 h. Then, we find all parking events from each Tk. The following steps show how to detect frequent spatiotemporal sequential patterns from all parking events.
Step 1: Any two adjacent parking events (Pei and Pei + 1) in a full operation cycle of taxis can compose a spatiotemporal sequence, which is denoted as TTAS in this paper. The length of TTAS is equal to 2 and can be denoted as TTAS = (P, Δt), where P = (Pei, Pei + 1), Pei = (li, ti), Pei + 1 = (li + 1, ti + 1), and Δt is the transition time between Pei and its corresponding event Pei + 1.
Step 2: For any two spatiotemporal sequences TTAS1 and TTAS2, where TTAS1 = (P1, Δt1) and TTAS2 = (P2, Δt2), if their occurrence locations are same, i.e., l1 = l2, and transition time is less than the time threshold τ, i.e., |Δt1Δt2| ≤ τ, that means TTAS1 is exactly contained in TTAS2 and denoted as TTAS1 τ TTAS2.
Step 3: The location and transition time of the parking event compose the spatiotemporal sequence pattern, which is denoted as Patt = (L, TI), where L is the location set of the parking event occurrence, and TI is the time interval of the transition times. For a given spatiotemporal sequence TTAS, if the occurrence location of TTAS is the same as Patt, and its transition time is contained in TI, then we say that TTAS matches with Patt, denoted as TTAS Patt. For taxi-driver shift events, the spatiotemporal sequence patterns can be denoted as Pattshift. All spatiotemporal sequence patterns of parking events for a taxi can be denoted as Pt = (Patt1, Patt2,…, Pattn).
Step 4: The number of taxi operation days is denoted as d. The spatiotemporal sequences set is denoted as J, and TTAS* is the matched spatiotemporal sequences with the spatiotemporal sequence pattern Patti (PattiPt). The τ-support of Patti can be computed as follows (see Equation (1)). If sp(Patti) > τ, the sequence pattern Patti is regarded as a frequent spatiotemporal sequential pattern.
s p ( P a t t i ) = | { T T A S * J | T T A S * P a t t i } | | d |

2.3.2. Taxi-Driver Shift Activity Identification Based on Gaussian Model

Theoretically, the value of τ-support of Pattshift should be 1 and higher than other spatiotemporal sequence patterns such as picking up passengers, having a meal, and vehicle gas-filling. In fact, when both drivers who share a taxi take a break and ask others to replace them to keep the taxi operation, the taxi-driver shift location and time will change greatly, which is not in the mutual inclusion relation with the usual spatiotemporal sequence of taxi-driver shift events, resulting in that the value of τ-support of Pattshift of these activities could be less than 1. To accurately detect taxi-driver shift activities from all frequent spatiotemporal sequential patterns, we manually selected real samples of taxi-driver shift events from the training dataset and analyzed their behavioral characteristics from four aspects: interval distance, interval time, transition time, and average no-load distance. The interval distance (denoted as f1) indicates the distance between the parking locations of taxi-driver shift activities of one taxi. For two shifts in a day, the interval distance is the distance between the parking locations for the two shifts. The interval time (denoted as f2) is the duration of each shift. For example, the duration of the first shift or the second shift is regarded as the interval time, as shown in Figure 2. The transition time (denoted as f3) refers to the duration of a taxi-driver shift event, from the first driver delivering the vehicle to the second driver starting the operation, as shown in Figure 3. In Figure 4, the value of transition time is ( t 5 t 4 ). No-load distance is the distance from the starting location of taxi-driver shift activity to the site of the previous driver who drops off the passengers, as shown in Figure 4. The average no-load distance of a taxi when it is in idle load (denoted as f4) is the average no-load distance of two shift events in a day.
Based on the above definitions of shift behavior features, we extract the prior knowledge from the training samples of taxi-driver shift events obtained by manual investigation. The statistical results show that the interval distances of all taxi-driver shift samples are within 5 km, and about 80% are within 1 km, as shown Figure 5a. The interval time ranges from 8 to 12 h, and the average value is about 10.5 h (see Figure 5b). The transition times of about 90% taxi-driver shift activities are greater than 0.8 h (see Figure 5c). The average no-load distance of taxi-driver shift activity is less than 1 km, as shown in Figure 5d. There are many cars with a no-load distance of 0, which is due to the fact that many taxi drivers will mark the meter to full load before the shift. In this way, they show a rejection signal to passengers when they are busy changing shift. The probability histograms of these behavior characteristics present Gaussian-like distributions—especially for f2 and f3.
Based on the above analyses, this study proposed to apply the Gaussian model to further identify taxi-driver shift events from all frequent sequential patterns, as shown in Equation (2).
p ( x ) = 1 ( 2 π ) n | C | exp [ 1 2 ( x μ ) T T A S C 1 ( x μ ) ]
where x is the feature vector of parking events which includes the interval distance, interval time, transition time, and average no-load distance; C is the covariance matrix of these features; μ is composed by the average value of each features, μ = (μ1, μ2, μ3, μ4). The feature vector x can be denoted as: x = (f1, f2, f3, f4), where f1, f2, f3, and f4 correspond to the above four features.
P ( P a t t i = P a t t s h i f t | P a t t i P t ) = T k P a t t i p ( x )
P a t t s h i f t = max ( P ( P a t t i ) )
The probability of the frequent spatiotemporal sequential patterns Patti (i = 1, 2,…,n) belonging to taxi-driver shift activity is computed in Equation (3). We think that the Patti is taxi-driver shift activity only when its probability is higher than others, as shown in Equation (4).

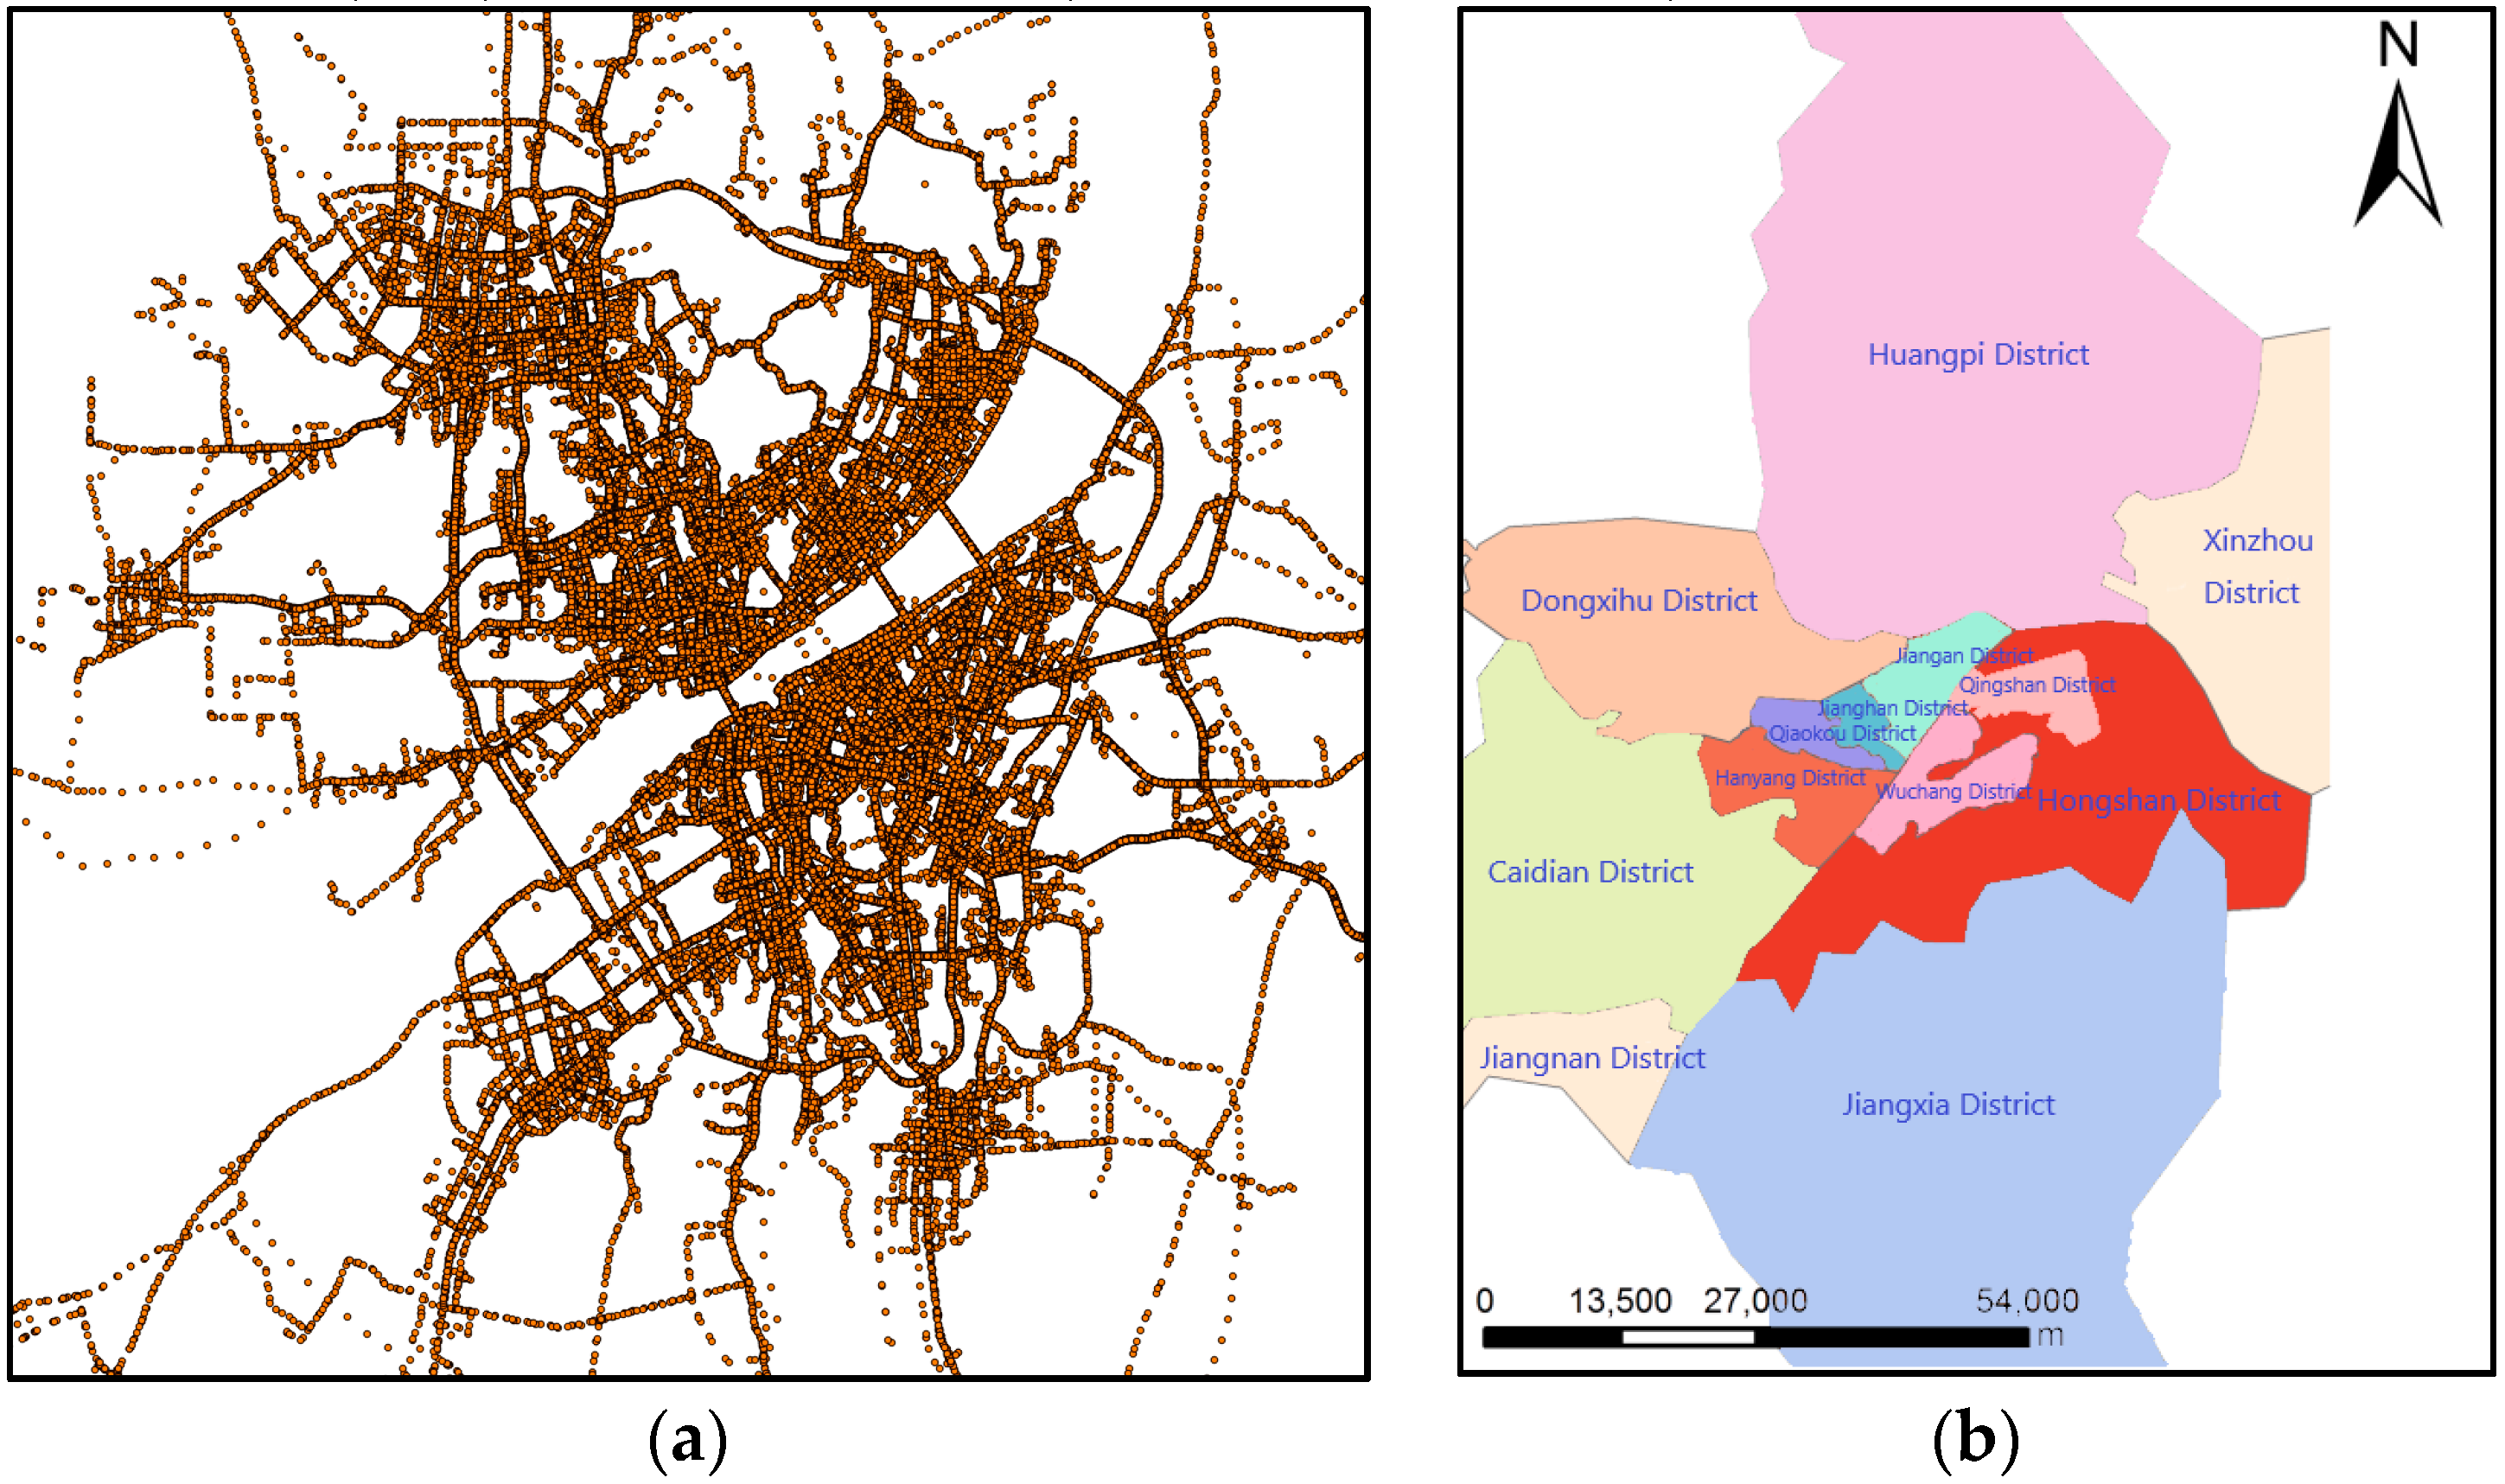
3. Case Study: Identification and Spatiotemporal Analysis of Taxi-Driver Shift Events in Wuhan City

In this study, the proposed method was tested by using real-world taxi trajectories collected from 1 August to 7 August in 2013. These vehicle trajectories were generated by 2000 taxis in the city of Wuhan, China, as shown in Figure 6. The administrative map of Wuhan city in 2013 is provided by the Wuhan planning bureau and used to display the spatial distribution of the detected taxi-driver shift events. Based on the administrative map, there are 13 districts in Wuhan city, seven of them are located in the central urban area, including Jiangan district, Jianghan district, Qingshan district, Qiaokou district, Hanyang district, Wuchang district, and Hongshan district, as shown in Figure 6.
In order to better explain the experimental process, the experimental steps are organized, as detailed below.
In the first step, we extracted the time and location of parking events from the GPS trajectories of the 2000 taxis based on the features of parking events. The spatiotemporal sequences of the parking events of the 2000 taxis were obtained and can be organized as spatiotemporal sequence patterns of the parking events. Then, we mined the frequent spatiotemporal sequential patterns of parking events by frequency measurement principle. In the second step, 1400 taxi-driver shift events of 100 taxis with real shift records from 1 August to 7 August in 2013 were manually calibrated as training data to obtain the Gaussian distribution of the characteristics of taxi-driver shift events, such as interval distance, interval time, transition time, and average no-load distance. Then we built the Gaussian mixture model to further identify taxi-driver shift events from all frequent spatiotemporal sequential patterns, as shown in Equation (2). The probability that each frequent spatiotemporal sequential pattern belongs to the taxi-driver shift patterns was calculated according to Equations (3) and (4) to identify the taxi-driver shift events. In order to further evaluate the identification accuracy of this method, we used the track data of 385 taxis with real taxi-driver shift records from 1 August 2013 to 7 August 2013 as testing data to calculate the precision and recall rate of this method. The ground truth of these taxi-driver shift events for training and testing was obtained by manual identification and field investigation. Finally, we analyzed the spatiotemporal distribution of the detected shift events of the 2000 taxis from different time and space scales. All the above processes are shown in the Figure 7.

3.1. Data Preprocessing and Parameters Discussion

In this study, the positioning accuracy of the GPS trajectories was about 10–15 m, and they were collected at a sampling interval of about 5–60 s [18]. Each GPS track point is represented by g(t, gxy, h, op), where t, gxy(xg, yg), h and op are the time stamps, geographic coordinates, heading angle (0°–360°), and occupied state, respectively, for a GPS point. The occupied state op of a taxi includes two types: occupied with the passenger (marked with 1) or not (marked with 0). A GPS trajectory is comprised of a set of corresponding GPS track points, denoted as T = (g1gn), where n is the number of GPS track points belonging to the trajectory. Because GPS trajectories were collected by taxis equipped with commonplace GPS devices instead of professional high-accuracy positioning systems. There are some outliers caused by GPS drifting mixed in the raw data set, which might exacerbate the uncertainty in feature extraction results and affect the detection of taxi-driver shift events. To this end, we adopted the method proposed by Yang et al. [19] to remove outliers, and the preprocessed data were used for experiments detailed in Section 3.1.1.

3.1.1. Parking Event Extraction from GPS Trajectories

We first extracted parking events from GPS track data of the 2000 taxis. The parking events implied in the GPS trajectories were extracted by analyzing the features of parking behavior such as speed, time, and location, etc. In general, the speed of all parking events is zero. This is the first constraint for extracting the parking events from GPS trajectories. Secondly, based on field investigations, the time constraint for parking events in Wuhan city is usually more than 2 min. Thus, the time constraint for parking events extraction was set as 120 s in this study. Besides, as previously mentioned in Section 2, the GPS tracking point was collected by taxis with a fixed sampling rate. The minimal sampling rate of the GPS track point used in this study was 40 s. The parking event for a taxi will at least be recorded by two adjacent GPS track points. That is, the minimal traveling time of a parking event from beginning to end recorded by the GPS device is about 80 s. Based on the statistics, the average maximum road speed for taxis in the urban area is about 50 km/h, so the maximal traveling distance of a parking event from beginning to end will usually be no more than 1200 m. Therefore, the distance constraint for parking events extraction was set at 1200 m. Finally, according to the analysis of the preceding context, the GPS tracking points of parking events have two collection conditions: the power of the GPS device is on or the power of the GPS device is failure. In the first instance, the GPS device will collect many points when the taxi stops somewhere. These GPS points are collected in the same place but present a density distribution due to GPS location error. To accurately determine the location where the parking event occurred, we proposed to apply the DBSCAN clustering method to extract the locations of all parking events. Specifically, the neighborhood radius of the DBSCAN clustering algorithm in this study was set as 100 m, and the minimal clustering points of events was set as 3 based on the prior knowledge of samples. These locations with corresponding parking events composed a location set (L).

3.1.2. Taxi-Driver Shift Event Detection Based on the Two-Step Strategy

The location set L is composed of a series of parking events. Based on the spatiotemporal sequence theory, we first extracted the spatiotemporal sequences of all parking events and got the set of TTAS. Then, the transition time threshold τ was set as 60 min, the value of time interval of transition times TI was set as 150 min, and the threshold of τ-support was set as 0.5 based on the prior knowledge of samples. Then, we detected the spatiotemporal sequence patterns based on the length constraint and then computed the τ-support of all spatiotemporal sequence patterns. Based on the threshold of τ-support, we obtained frequent spatiotemporal sequential patterns. The samples of real taxi-driver shift events generated by 100 taxis were used as training data to extract the four-dimensional Gaussian distribution of four features (f1, f2, f3, f4). The covariance matrix C of these features is shown in Equation 5. The average of the value of four features were μ = (1.43 km, 10.58 h, 0.82 h, 0.96 km). The taxi-driver shift events were detected based on the above method of the Gaussian model (see Equations (2) and (3)).
C = [ 1.2826 0.0656 0.2102 0.0811 0.0656 2.1568 0.0091 0.0464 0.2102 0.0091 0.3012 0.0430 0.0811 0.0464 0.0430 2.9842 ]
Subsequently, we used the above parameters and this Gaussian model to detect taxi-driver shift events from GPS trajectories collected from 2000 taxis in Wuhan from 1 August to 7 August 2013. Through the experiments, 1808 cars with shift events were identified, with a total of 23,414 taxi-driver shift events. The proportion of identified vehicles was approximately greater than 90%. The experimental results showed that the average number of taxi-driver shift events identified within a full operation cycle of taxis was about greater than 1.8, which is closer to the standard value 2. To further evaluate the proposed method, we used the track data of 385 taxis with real taxi-driver shift records from 1 August 2013 to 7 August 2013 as testing data to calculate the identification precision and recall rate based on confusion matrix classification evaluation. The precision rate is the ratio of the number of correctly detected shift events to the number of detected shift events. The recall rate is the ratio of correctly detected shift events to the number of real shift events. The statistics showed that the identification precision and recall rate of taxi-driver shift events by using the proposed method were about 95.00% and 90.00%, respectively. However, there was also about a 5% chance of incorrectly identifying taxi-driver shift events, and about 10% of the taxi-driver shift events were not identified. In urban areas, it is a challenging task to accurately recognize taxi-driver shift events from GPS trajectories without the ID (identification card) information of each taxi driver. These mistakes and missing identification of taxi-driver shifts are mainly due to a small number of drivers who do not conduct taxi-driver shift behaviors regularly. That is, a small number of drivers who operate one taxi will ask other drivers to replace them for a short time so that they can rest. In that case, the time and location of the taxi-driver shift occurrence will be changed many times, making the identification accuracy and recall rate lower.

3.2. Exploring the Spatiotemporal Distribution of the Detected Taxi-Driver Shift Events

Based on the proposed method in this study, more than 20,000 taxi-driver shift events were detected from the GPS trajectories generated by 2000 taxis from 1 August to 7 August 2013. The spatiotemporal distribution of these taxi-driver shift events reflects the implementation of taxi operation policy and the rationality of urban infrastructure distribution from a unique perspective. For example, the city government of Wuhan issued a taxi operation policy prohibiting taxi-driver shift activities during the evening rush hour to reduce the difficulty of taking cabs at 6:00 p.m. We can determine whether all taxi drivers are compliant with this regulation by analyzing the spatiotemporal distribution of the detected taxi-driver shift events. The following subsections detail how we analyze the distribution of taxi-driver shift events from two aspects: time and space.

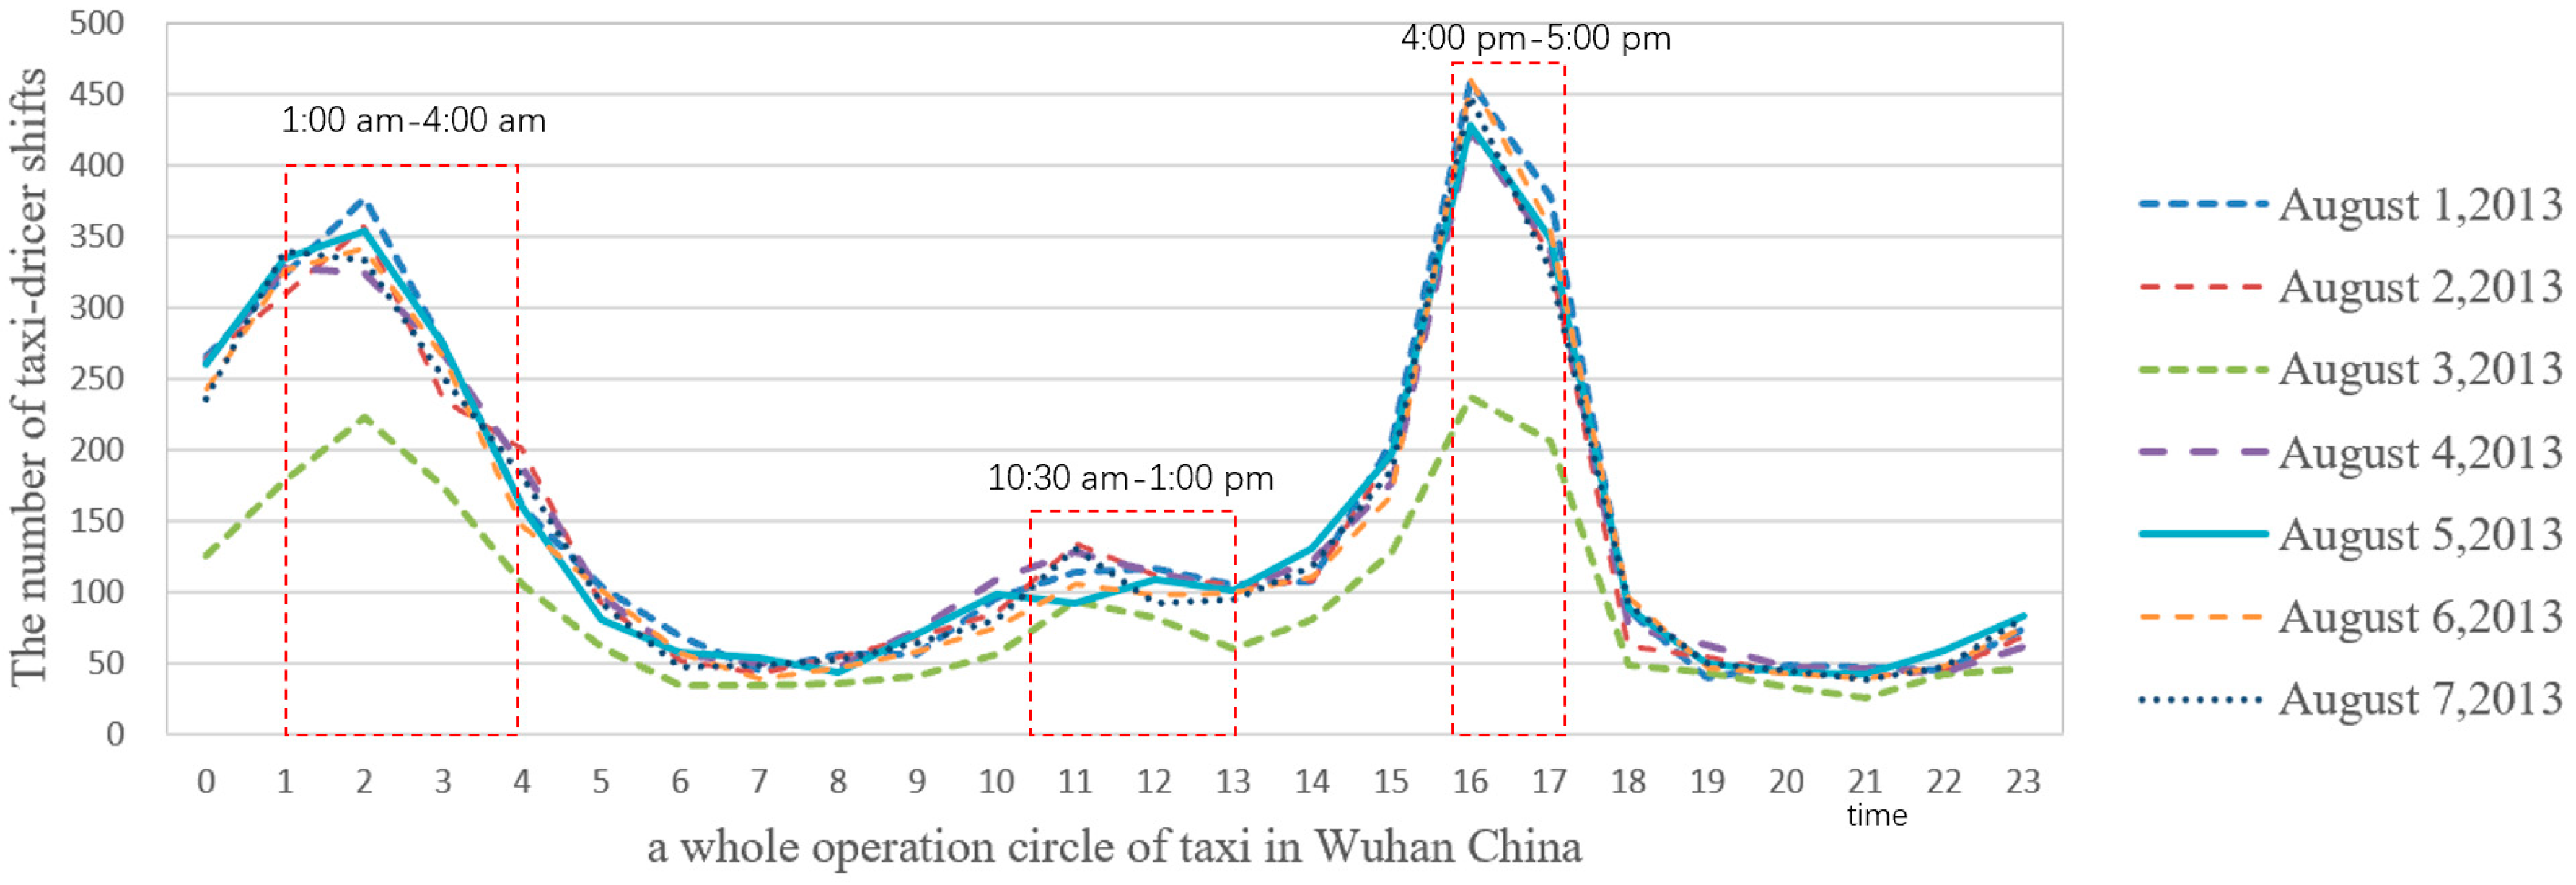
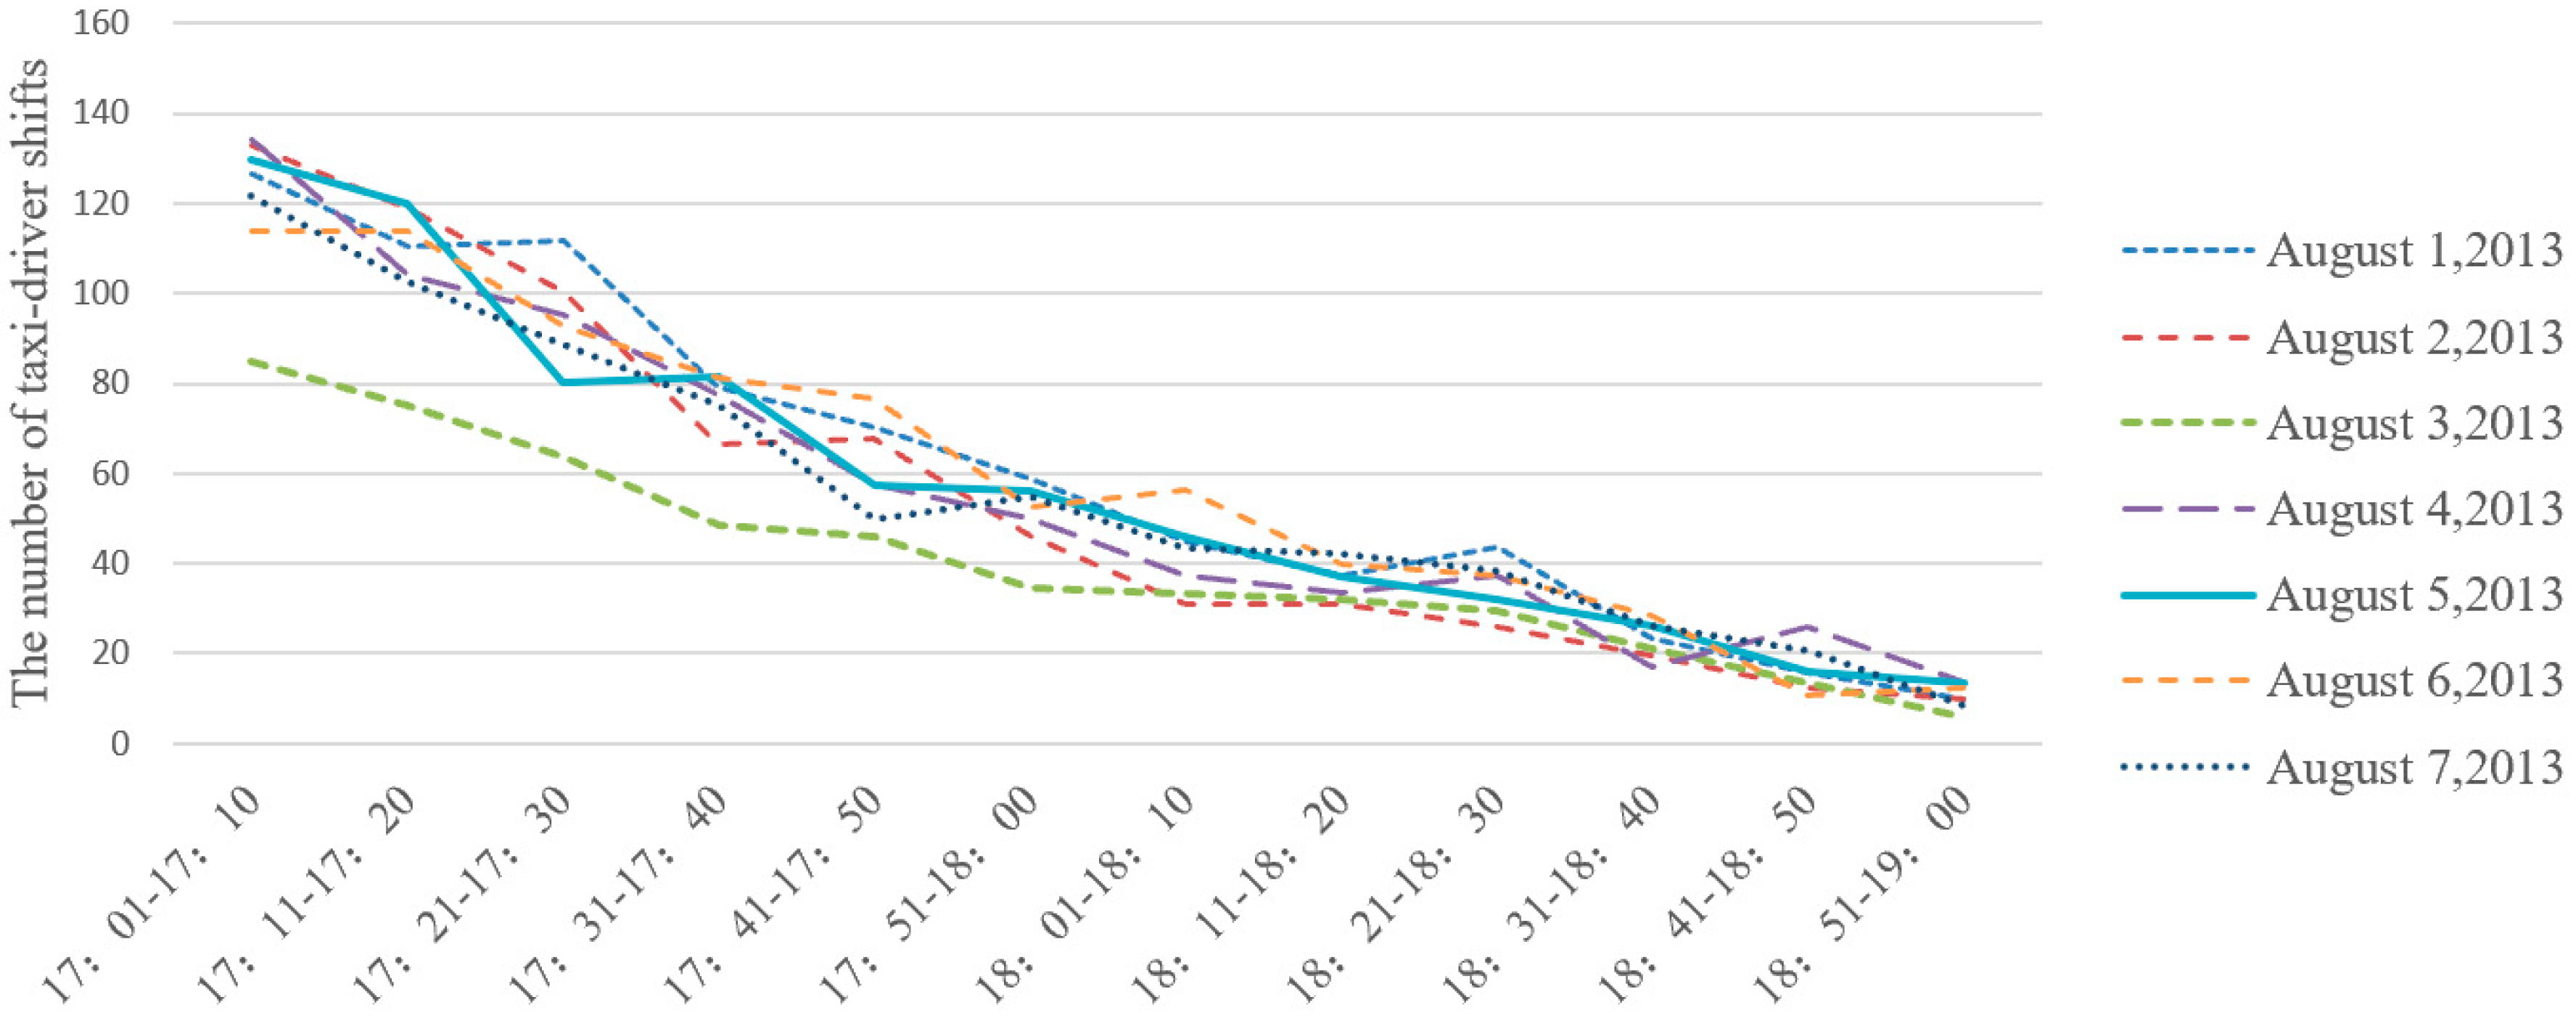
3.2.1. Time Distribution of Taxi-Driver Shift Activities in Wuhan City

Figure 8 shows the statistics of taxi-driver shift events that occurred from 1–8 August 2013. Based on the statistical results, taxi-driver shift activities in Wuhan, China mainly occur in three time periods: 1:00 a.m. to 4:00 a.m., 4:00 p.m. to 5:00 p.m., and 10:30 a.m. to 1:00 p.m. The number of taxi-driver shift events in the third period is far less than in the other two time periods, as shown in Figure 8. This means that most of the taxi drivers choose to change shifts in the early morning or off-peak hours in the afternoon. During the early morning, the traveling willingness of citizens is the lowest in a day, and the demand for taxis, in turn, is the lowest in the full operation cycle. However, the OD (Origin-Destination) number of taxis increased gradually from 4:00 p.m. to 5:00 p.m., and the intensity of taxi-driver shift activities occurred also increased. Thus, it will cause difficulty in taking cabs if taxi drivers extend the transition time in the afternoon. Besides, the number of taxi-driver shift events that occurred on 3 August 2018, was lower than on the other days. The reason for that is because this was a Saturday, and drivers might choose to have a break. That means they might reduce the working time of each shift or ask for others to cover for them.

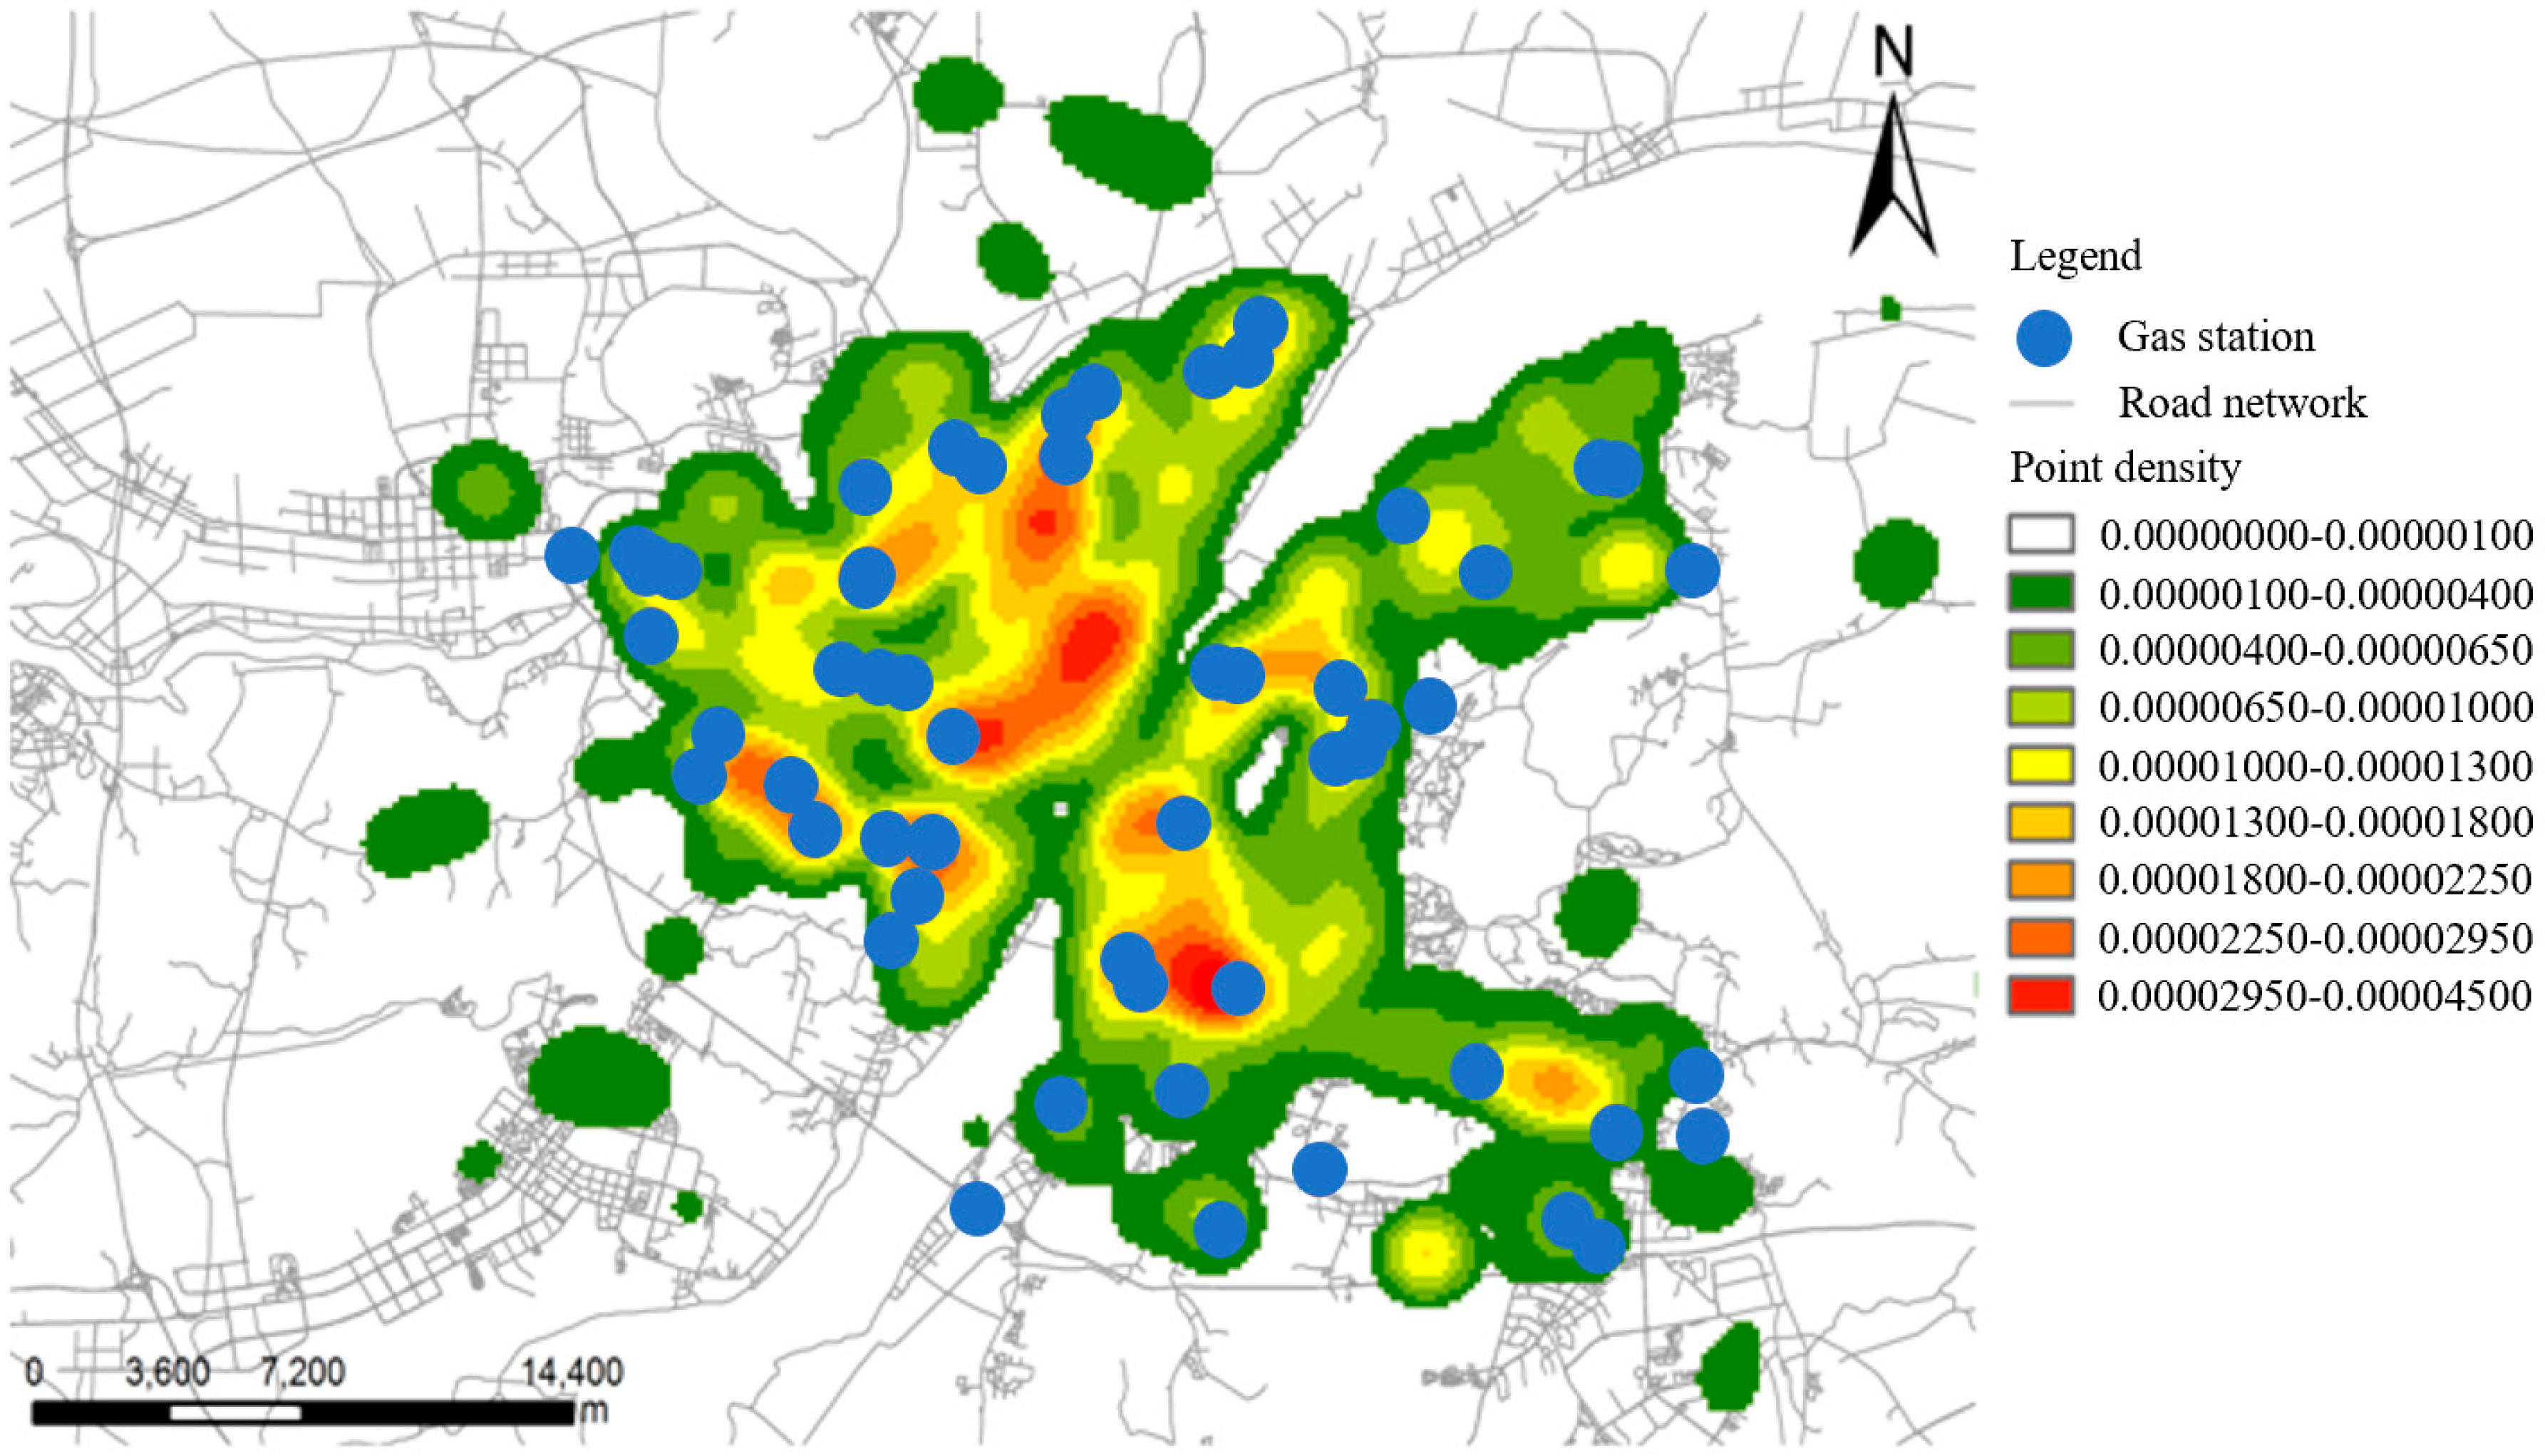
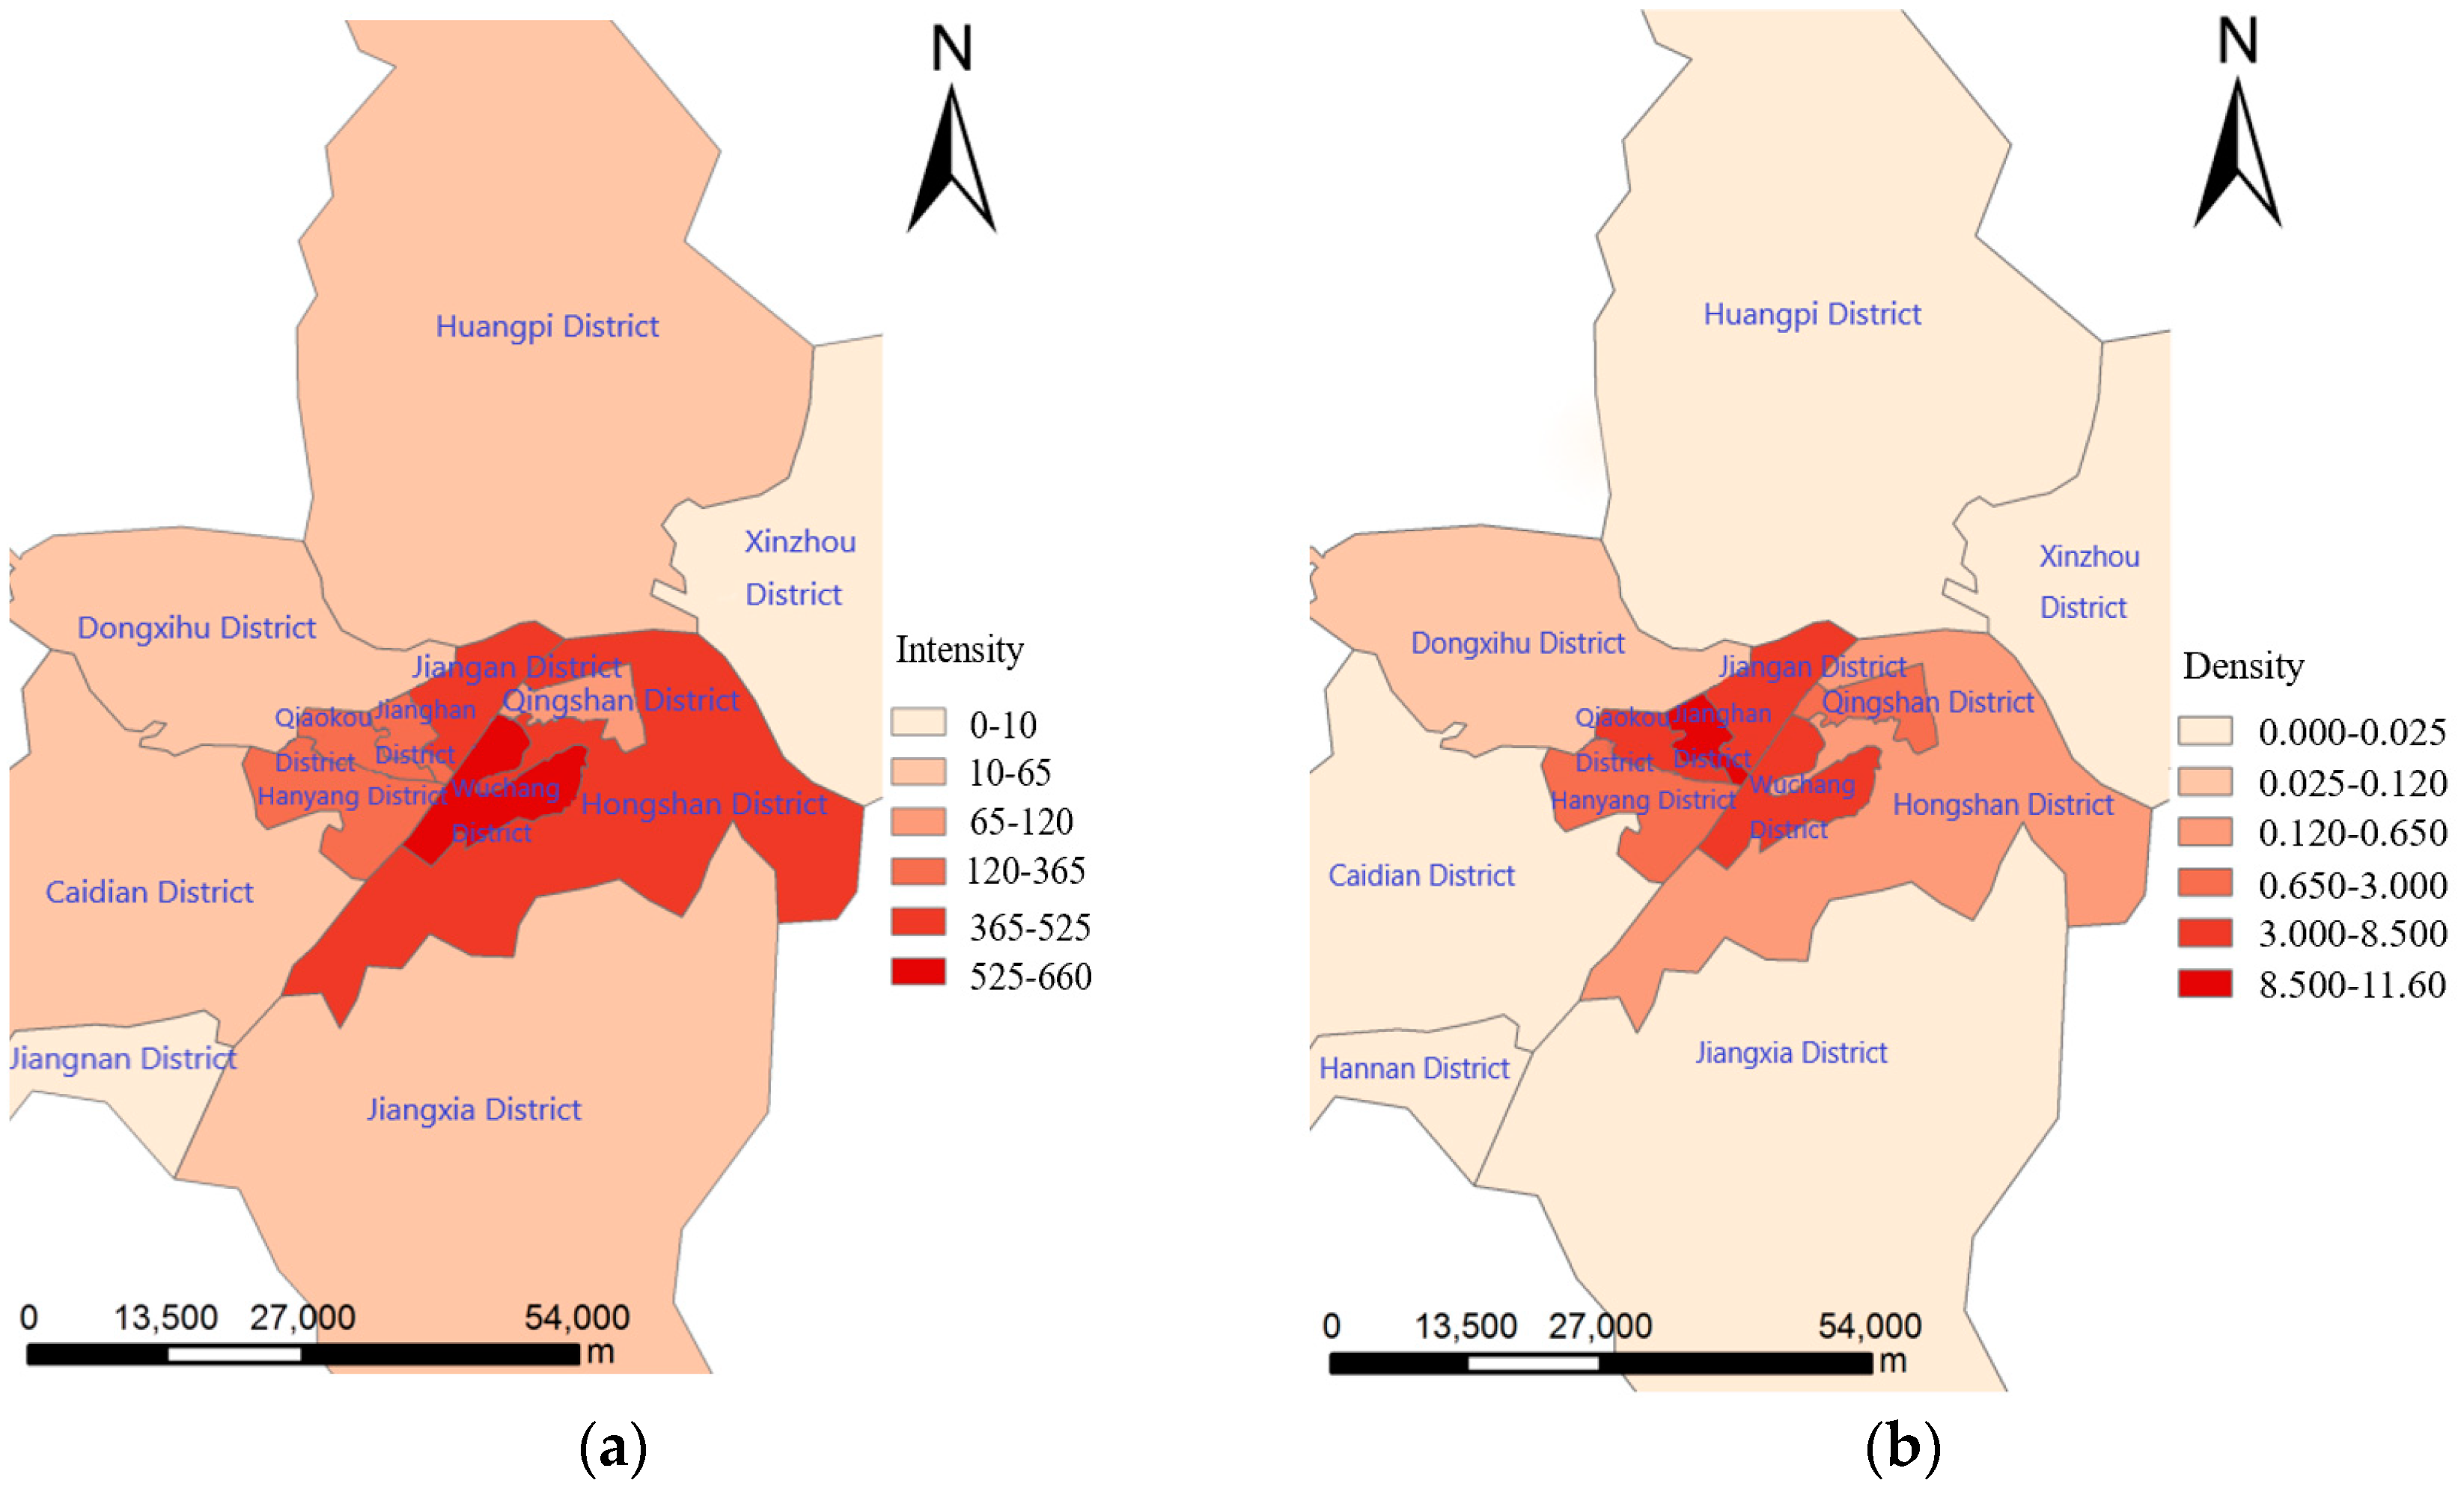
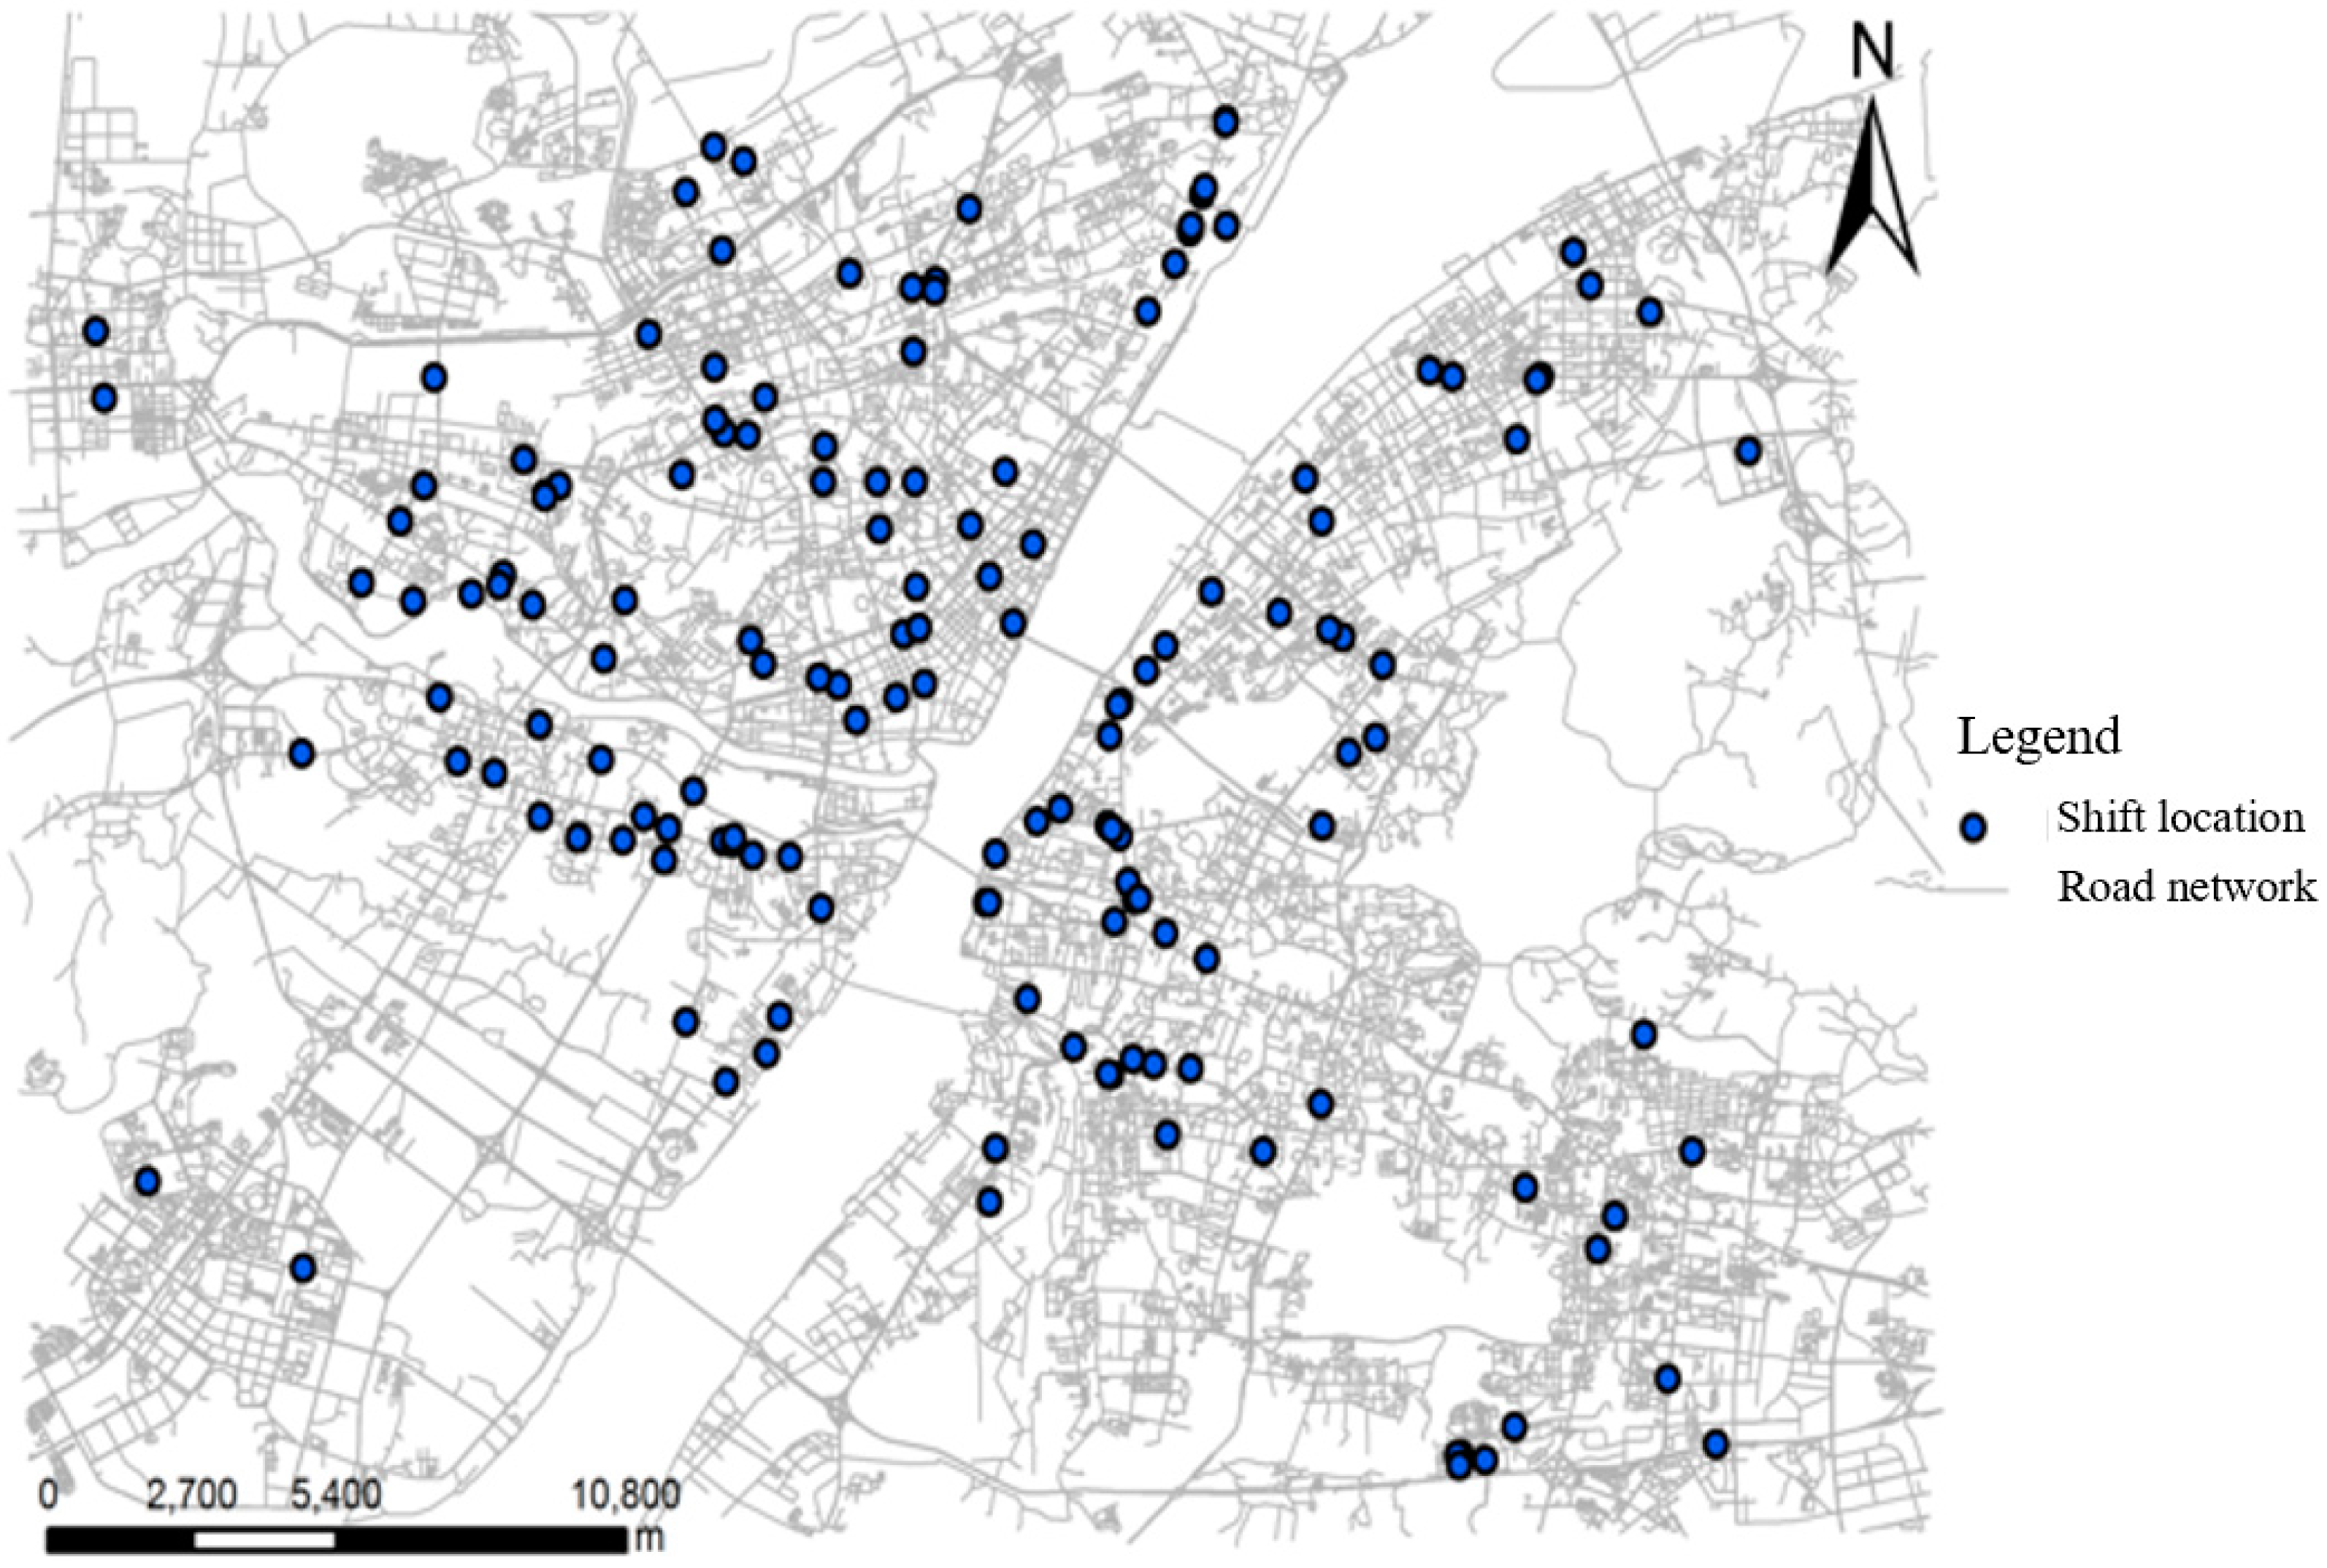
3.2.2. Spatial Distribution of Taxi-Driver Shift Activities in Wuhan City

The density and intensity of taxi-driver shift events are used as the indicators to assist in qualitative analysis for taxi-driver shift spatial distribution. Specially, taxi-driver shift density means the number of taxi-driver shift events in the unit area of the administrative zoning map of Wuhan city. To get the density of taxi-driver shift events, we divided the whole administrative zoning map of Wuhan city into many rectangles with 1000 m length and 1000 m width and then computed the density of taxi-driver shift events per unit area. The intensity of taxi-driver shift events indicates the sum of taxi-driver shift events in each administrative area of this municipality. Figure 9 shows the density of taxi-driver shift events overlapped with the road network and a part of POI (e.g., gas station) data in Wuhan. As can be seen in Figure 9, most of the taxi-driver shift events occurred in the central city area. The density of taxi-driver shift events distributed in each district presented a relatively uniform distribution, except in Qingshan district. In addition, taxi-driver shift events distributed in the central city area are clustered around on several roads, including Xiongchu Avenue, Jiefang Avenue, Houhu Avenue, and Hanyang Avenue. Those roads are all located on the edge of bustling financial districts. Here, a booming business center means that the demand for taxis is tremendously high and that the income potential for drivers is consequentially increased. Meanwhile, as shown in Figure 9, we found that the parking locations of taxi-driver shift events and gas stations in Wuhan had a high correlativity. The reason for this drivers abiding to an unwritten rule: taxi drivers who operate one taxi must fill the car up with gas before they hand the car over to the other.
For further analysis of the differences in the spatial distribution of the taxi-driver shift events in each administrative district, we computed the intensity and density of taxi-driver shift events in each district, as shown in Figure 10. As discussed, there are 13 districts in Wuhan city, and the central urban area mainly includes 7 districts: Jiangan District, Jianghan District, Qiaokou District, Hanyang District, Wuchang District, Hongshan District, and Qingshan District. As illustrated in Figure 10, Wuchang District has the highest intensity of taxi-driver shift events. This is because there are many business centers distributed over this area, including the Zhongnan business district, Xudong business district, Jiedaokou business district, and Chu River and Han Street business district. There are also many universities, such as Wuhan University, Wuhan University of Technology, and the Central China Normal University. The prosperous economy and huge crowds in this district that favor its passenger source over the other places. Therefore, most drivers choose to hand the car over to the other driver in the Wuchang district. In Figure 10, we can see that the intensity of taxi-driver shift events in the Jianghan District is not the highest, but its density is the highest because of its size. This high density of taxi-driver shift activities alerted us that governments or administrators should strengthen road patrol and prevent traffic jams in this area, especially in the rush hours.
Compared with the central urban area of Wuhan, the intensity of taxi-driver shift events distributed in the peri-urban districts such as Huangling District, Dongxihu District, and Caidian District is low. There are two main reasons for the low intensity of taxi-driver shift events in these places. First, the population living in these places is lower than the central urban area. For example, the populations of Caidian District and Wuchang District are about 460,000 and 1,250,000 in 2013, respectively. Thus, the number of potential customers in Wuchang is higher than Caidian District. Secondly, most residents of the region in the peri-urban area are farmers and self-employed. Their income and occupation determine their trip mode. In general, they may be more willing to take public transit or drive their private cars.

3.3. Violations Analysis of Taxi-Driver Shift Events

As already noted, taxi-driver shift activities are prohibited during the evening rush hour from 5:00 p.m. to 7:00 p.m. based on the taxi operation policy issued by the city government of Wuhan in 2012. Those breaking the law face fines (e.g., about 500–1000 RMB) and downtime of 15 days. To crack down on the practice, the office of traffic management of Wuhan sent 10 inspecting teams to check the violation activities every day. This paper proposed a method to automatically identify taxi-driver shift events from GPS trajectories and provide the location and time of violation behaviors based on the spatiotemporal analysis of the detected results. For example, taking 10 min as the time interval, we counted the number of taxi-driver shift events from 5:00 p.m. to 7:00 p.m., as shown in Figure 11. It should be stressed that these taxi-driver shift events used for analyzing violation activities were all identified correctly based on the GPS data generated by the 2000 taxi on 1–7 August 2013. The results shown that about 19.83% of taxi-driver shift events in all detected shift events violated this regulation of taxi operation. An average of about 663 taxi-driver shifts break the rules every day. The number of taxi-driver shift events declined rapidly from 5:00 p.m. to 7:00 p.m. During the period from 5:00 p.m. to 5:30 p.m., there were about 47.78% of taxi-driver shift events in all illegal taxi-driver shift events violating the regulation. Considering traffic jams and distance between two drivers, those drivers who are a half-hour late during the taxi-driver shift period will be regarded as violation of the regulation. Beyond that time, drivers will be considered as committing “serious irregularities”. In such a case, the percent of violation is about 10.35% in all shift activities.
Figure 12 shows the location of the serious violations of taxi-driver shift activities during the study period of 1–7 August 2013. Based on the visualization results, the distribution of the parking locations of these serious irregularities is relatively homogeneous. Many parking locations were distributed in some hidden places where they would not normally be found by the inspecting teams. That means it is very hard to crack down on all violation activities of taxi-driver shift if the inspecting teams just depend on the filed investigation. The spatiotemporal analysis of taxi-driver shift events proposed in this paper, therefore, can assist in detecting the parking locations and time of the serious irregularities as well as assist governments to improve the traditional methods for traffic management.

4. Conclusions

As an important component of taxi management, taxis shifts play a vital role in urban transportation. However, research results for taxi-driver shift event detection and spatiotemporal analysis based on big trace data are not widely available, so this study is motivated by the need to address this topic. The methods proposed in this paper use taxi trace data without drivers’ identity information to analyze the spatiotemporal distribution of taxi-driver shift activities. The mechanism of automatic detection of taxi-driver shift events includes two steps: frequent spatiotemporal sequential pattern mining and taxi-driver shift identification based on the Gaussian model. Taking the city of Wuhan as an example, the spatiotemporal distribution of taxi-driver shifts is analyzed in detail using big trace data of 2000 taxis collected in 2013. To evaluate the distribution of taxi-driver shift events, the indicators of taxi regional coverage intensity and density are applied in the following analysis. The experimental results show that the identification precision and recall of taxi-driver shift activities in the city of Wuhan could achieve about 95% and 90%, respectively. The occurrence time of taxi-driver shift events in Wuhan mainly has two high peak periods: 1:00 a.m. to 4:00 a.m. and 4:00 p.m. to 5:00 p.m. About 10.35% of the taxi-driver shift events in all detected shift events seriously violated the regulation issued by Wuhan traffic administration, although it is prohibited to take shift during the evening rush hours. Besides, the results indicate that parking locations of most taxi-driver shift events are distributed in the central urban area, which is in accordance with the drivers’ goal of increasing income. The strongest intensity and density of taxi-driver shift events were distributed in the Wuchang district and Jianghan district, respectively. To prevent traffic jams in these areas, especially in the evening rush hours, governments or administrators should strengthen road patrol in these areas.
In conclusion, this study investigated the spatiotemporal distribution of taxi-driver shift events using big trace taxi data. The results illustrate that the proposed method is effective in taxi-driver shift identification. Meanwhile, the analyses of taxi-driver shift events are useful for policymakers and governments in planning traffic dispersion and taxi supervision. However, the present study also has some limitations. First, the method of taxi-driver shift detection is based on the prior knowledge of taxi-driver shift behaviors, which may be influenced by sample differences and lead to certain errors in the results. Second, given the limitations of the research conditions, the results of taxi-driver shift distribution in the context of space-time are analyzed only by using trace data; therefore, some explanations for taxi-driver shift event distribution in the city of Wuhan may have be controversial.

Author Contributions

Conceptualization, Luling Cheng and Xue Yang; methodology, Luling Cheng, Xue Yang and Qian Duan; software, Luling Cheng; validation, Luling Cheng, Xue Yang and Luliang Tang; formal analysis, Xinyue Ye and Zihan Kan; investigation, Xinyue Ye and Xia Zhang; resources, Luliang Tang; data curation, Zihan Kan; writing—original draft preparation, Luling Cheng and Xue Yang; writing—review and editing, Luling Cheng; visualization, Luling Cheng; supervision, Luliang Tang and Xia Zhang; funding acquisition, Xue Yang. All authors have read and agreed to the published version of the manuscript.

Funding

This research was funded by the National Natural Science Foundation of China grant number (No. 41971405, 41901394, 41671442), National Key Research and Development Plan of China grant number (2017YFB0503604, 2016YFE0200400), and the Fundamental Research Funds for the Central Universities, China University of Geosciences (Wuhan) grant number (No.162301182737).

Conflicts of Interest

The authors declare no conflict of interest.

References

  1. Wang, X.; He, F.; Yang, H.; Gao, H.O. Pricing strategies for a taxi-hailing platform. Transp. Res. Part E Logist. Transp. Rev. 2016, 93, 212–231. [Google Scholar] [CrossRef]
  2. Esbenshade, J.; Shifrin, E. The Leased Among Us: Precarious Work, Local Regulation, and the Taxi Industry. Labor Stud. J. 2018. [Google Scholar] [CrossRef]
  3. Sun, D.; Zhang, K.; Shen, S. Analyzing spatiotemporal traffic line source emissions based on massive didi online car-hailing service data. Transp. Res. Part D Transp. Environ. 2018, 62, 699–714. [Google Scholar] [CrossRef]
  4. Kamargianni, M.; Li, W.; Matyas, M.; Schäfer, A. A critical review of new mobility services for urban transport. Transp. Res. Procedia 2016, 14, 3294–3303. [Google Scholar] [CrossRef] [Green Version]
  5. Fuji, H.; Xiang, J.; Tazaki, Y.; Levedahl, B.; Suzuki, T. Trajectory planning for automated parking using multi-resolution state roadmap considering non-holonomic constraints. In Proceedings of the 2014 IEEE Intelligent Vehicles Symposium Proceedings, Dearborn, MI, USA, 8–11 June 2014; pp. 407–413. [Google Scholar]
  6. Zhang, D.; Sun, L.; Li, B.; Chen, C.; Pan, G.; Li, S.; Wu, Z. Understanding taxi service strategies from taxi GPS traces. IEEE Trans. Intell. Transp. Syst. 2015, 16, 123–135. [Google Scholar] [CrossRef]
  7. He, T.; Bao, J.; Li, R.; Ruan, S.; Li, Y.; Tian, C.; Zheng, Y. Detecting Vehicle Illegal Parking Events using Sharing Bikes’ Trajectories. In Proceedings of the ACM SIGKDD, London, UK, 19–23 August 2018. [Google Scholar]
  8. Bock, F.; Di Martino, S.; Origlia, A. Smart Parking: Using a Crowd of Taxis to Sense On-Street Parking Space Availability. IEEE Trans. Intell. Transp. Syst. 2019. [Google Scholar] [CrossRef]
  9. Yang, H.; Ye, M.; Tang, W.H.; Wong, S.C. A Multiperiod Dynamic Model of Taxi Services with Endogenous Service Intensity. Oper. Res. 2005, 53, 501–515. [Google Scholar] [CrossRef]
  10. Zhang, W.; Zhang, X.; Feng, Z.; Liu, J.; Zhou, M.; Wang, K. The Fitness-to-drive of Shift-work Taxi Drivers with Obstructive Sleep Apnea: An Investigation of Self-Reported Driver Behavior and Skill. Transp. Res. Part F 2018, 59, 545–554. [Google Scholar] [CrossRef]
  11. Deng, C.C.; Ong, H.L.; Ang, B.W.; Goh, T.N. A modelling study of a taxi service operation. Int. J. Oper. Prod. Manag. 1992, 12, 65–78. [Google Scholar] [CrossRef]
  12. Kamga, C.; Yazici, M.A.; Singhal, A. Hailing in the rain: Temporal and weather-related variations in taxi ridership and taxi demand-supply equilibrium. In Proceedings of the Transportation Research Board 92nd Annual Meeting (No. 13-3131), Washington, DC, USA, 13–17 January 2013. [Google Scholar]
  13. Meng, P.C.; Tang, X.C.; Yang, Q.; Xu, Y. The mathematical model of taxi drivers-shift change. Math. Pract. Theory 2010, 40, 247–252. [Google Scholar]
  14. Li, Y.M.; Wang, J.Y. Determining the optimized location for taxi drivers-shift change using a clustering methodology. Sci. Technol. Assoc. Forum 2012, 10, 94–96. [Google Scholar]
  15. Sun, R.; Yu, H.T.; Du, Y. Spatial analysis algorithm for taxi drivers-shift. In Proceedings of the Annual Conference of ITS China, Henan, China, 23–24 June 2012. [Google Scholar]
  16. Tang, L.; Zheng, W.; Wang, Z.; Hong, X.U.; Hong, J.; Dong, K. Space time analysis on the pick-up and drop-off of taxi passengers based on GPS big data. Geo Inf. Sci. 2015, 17, 1179–1186. [Google Scholar]
  17. Giannotti, F.; Nanni, M.; Pedreschi, D. Efficient Mining of Temporally Annotated Sequences. In Proceedings of the Siam International Conference on Data Mining, Bethesda, MD, USA, 20–22 April 2006; pp. 346–357. [Google Scholar]
  18. Yang, X.; Tang, L.; Niu, L.; Zhang, X.; Li, Q. Generating lane-based intersection maps from crowdsourcing big trace data. Transp. Res. Part C Emerg. Technol. 2018, 89, 168–187. [Google Scholar] [CrossRef]
  19. Yang, X.; Tang, L.; Zhang, X.; Li, Q. A Data Cleaning Method for Big Trace Data Using Movement Consistency. Sensors 2018, 18, 824. [Google Scholar] [CrossRef] [PubMed] [Green Version]
Figure 1. Architecture of taxi-driver shift event detection based on big trace data.
Ijgi 09 00281 g001
Figure 2. Two-shift operation mode in China: (a) the shift operation mode in the first instance; (b) the shift operation mode in the second instance.
Ijgi 09 00281 g002
Figure 3. Taxi GPS data collection during taxi-driver shift activities: (a) the GPS data collection when the GPS device is on; (b) the GPS data collection when the GPS device is failure.
Ijgi 09 00281 g003
Figure 4. Schematic diagram of a taxi-driver shift behavior.
Ijgi 09 00281 g004
Figure 5. The probability histograms of behavior characteristics using taxi-driver shift samples: (a) interval distance (f1), (b) interval time (f2), (c) transition time (f3), and (d) average no-load distance (f4).
Ijgi 09 00281 g005
Figure 6. Experimental datasets: (a) taxi trajectories collected in a workday in the city of Wuhan, China; (b) the administrative map of Wuhan city.
Ijgi 09 00281 g006
Figure 7. Experimental flowchart.
Ijgi 09 00281 g007
Figure 8. Temporal distribution of taxi-driver shift events in Wuhan, China from 1–8 August 2013.
Ijgi 09 00281 g008
Figure 9. Spatial distribution of parking locations for taxi-driver shift events that occurred 1–7 August 2013.
Ijgi 09 00281 g009
Figure 10. Spatial distribution of parking locations for taxi-driver shift events in each administrative district. (a) The intensity of taxi-driver shift events distributed in each administrative district of Wuhan. (b) The density of taxi-driver shift events distributed in each administrative district of Wuhan.
Ijgi 09 00281 g010
Figure 11. The number of taxi-driver shift events during the 5:00 p.m. to 7:00 p.m. period from 1 to 7 August in 2013.
Ijgi 09 00281 g011
Figure 12. Spatial distribution of serious violations of taxi-driver shift activities.
Ijgi 09 00281 g012

