Article

Testing a Comprehensive Volcanic Risk Assessment of Tenerife by Volcanic Hazard Simulations and Social Vulnerability Analysis

1
School of Environmental Science and Spatial Informatics, China University of Mining and Technology, Xuzhou 221116, China
2
Department of Geography & Earth System Science, Vrije Universiteit Brussel, 1050 Brussels, Belgium
*
Author to whom correspondence should be addressed.
ISPRS Int. J. Geo-Inf. 2020, 9(4), 273; https://doi.org/10.3390/ijgi9040273
Submission received: 21 March 2020 / Revised: 7 April 2020 / Accepted: 16 April 2020 / Published: 22 April 2020

Abstract

:
Volcanic activity remains highly detrimental to populations, property and activities in the range of its products. In order to reduce the impact of volcanic processes and products, it is critically important to conduct comprehensive volcanic risk assessments on volcanically active areas. This study tests a volcanic risk assessment methodology based on numerical simulations of volcanic hazards and quantitative analysis of social vulnerability in the Spanish island of Tenerife, a well-known tourist destination. We first simulated the most likely volcanic hazards in the two eruptive scenarios using the Volcanic Risk Information System (VORIS) tool and then evaluated the vulnerability using a total of 19 socio-economic indicators within the Vulnerability Scoping Diagram (VSD) framework by combining the analytic hierarchy process (AHP) and the entropy method. Our results show good agreement with previous assessments. In two eruptive scenarios, the north and northwest of the island were more exposed to volcanic hazards, and the east registered the highest vulnerability. Overall, the northern municipalities showed the highest volcanic risk in two scenarios. Our test indicates that disaster risk varies greatly across the island, and that risk reduction strategies should be prioritized on the north areas. While refinements to the model will produce more accurate results, the outputs will still be beneficial to the local authorities when designing policies for volcanic risk reduction policies in Tenerife. This study tests a comprehensive volcanic risk assessment for Tenerife, but it also provides a framework that is applicable to other regions threatened by volcanic hazards.

1. Introduction

More than 500 million people worldwide live in the proximity of active volcanoes, and this number is expected to keep increasing due to rapid population growth and urban expansion [1]. Meanwhile, there were more than 9000 confirmed eruptions during the period from 2009 to 2018 [2]. Products from these eruptions can harm living creatures and destroy buildings within minutes [3], and 6 million lives have been claimed globally by volcanic eruptions [4]. As such, volcanic risk assessment is essential in volcanically active areas, particularly those with large transient populations such as tourists, which might not be aware of hazards and emergency procedures. Volcanic islands, such as the Canaries, are especially vulnerable due to isolation, limited space and economic dependency on tourism.
Volcanic risk assessment is a complex issue, as it relies heavily on a multitude of geological, volcanological, geochemical and meteorological data, as well as socio-economic data describing the vulnerability of the elements that may be at risk [5]. Volcanic hazard and risk maps are key tools for volcanic emergency management, the former illustrating hazards at any particular location and the latter characterizing the spatial variation of vulnerability of exposed elements [6]. A volcanic hazard assessment typically involves the estimation of the probability of future eruptions as well as simulation of future eruptive scenarios. Bayesian event trees are often used to estimate the probability of future short- and long-term eruptions with historical records and geological and geophysical data [7,8]. The simulation of eruptive activity refers mainly to model the distribution of eruptive materials by inputting field data into numerical models [9,10]. In addition to hazard analysis, vulnerability analysis (aka vulnerability assessment) is the other component of risk assessment and refers to evaluating the vulnerability of elements (e.g., communities, systems and assets) exposed to volcanic hazards [1,11]. Volcanic risk assessment requires comprehensive consideration of volcanic hazards and vulnerability [11,12].
Risk assessment is critical for volcanic islands, as it can provide knowledge of the impact of potential volcanic hazards and identify vulnerable populations and areas. This is particularly important in areas populated by international visitors with little or no hazard awareness and risk perception. Though profiled as an internationally recognized tourist destination, Tenerife is considered the most risky volcanic area in Spain [13]. Seismic activity on the island rose in April and May 2004 and increased unrest at Teide volcano was reported in January 2005, with tons of carbon dioxide emissions per day [14]. This signals the potential for volcanic risk in Tenerife, so there is an urgent need of continuous risk assessment and risk reduction efforts.
Several studies have examined volcanic hazards and risk on Tenerife, but in a fragmented manner. Using Geographic Information System (GIS) and physical simulation models, Gomez-Fernandez [15,16] simulated lava flows in three areas of Tenerife. Araña et al. [9] discriminated different volcanic hazard levels on Tenerife by simulating ash fall and lava flows but did not consider social vulnerability. Despite taking vulnerability into account, Marti et al. [17] evaluated the impact of simulated volcanic hazards only on the buildings in Icod de los Vinos. Marrero et al. [18] assessed the number of potential fatalities caused by pyroclastic density currents (PDCs, mixtures of fragmented volcanic particles, hot gases and ash that spread from a volcano at high speeds [19,20]) from the central volcanic complex, but this assessment exclusively investigated the impact of one hazard, PDCs, on population. A comprehensive recent volcanic risk assessment was performed by Scaini et al. [12], but again was limited to a small area consisting of Icod de los Vinos, San Juan de la Rambla and La Guancha. While all these studies provide important data, no comprehensive volcanic hazard risk assessment identifying vulnerable and high-risk areas has been undertaken for the whole volcanic island to date. Although it is challenging to realize such an ambitious goal, we wish to build a comprehensive volcanic risk assessment framework based on volcanic hazard simulations and social vulnerability analysis and test it with the entire island of Tenerife. Specific objectives are as follows: (1) to simulate the distribution of lava flows, ash fall and PDC using the Volcanic Risk Information System (VORIS) tool [21]; (2) to evaluate the social vulnerability of Tenerife’s 31 municipalities based on the VSD (Vulnerability Scoping Diagram) framework; and (3) to assess the hazard-special risks of Tenerife by analyzing both volcanic hazards and social vulnerability. Although the volcanic risk assessment framework is tested with Tenerife in this study, the flexibility of this framework allows it to be easily transferred to other volcanic areas.

2. Study Area and Data

2.1. Study Area

Located 100 km off the northwest coast of Africa (Figure 1a), Tenerife is the largest among the seven Canary Islands. It covers approximately 2034 km2 and has ~900,000 inhabitants in its 31 municipalities (Figure 1b; Table 1). Thanks to its favorable temperatures through the year (18-28°C), beautiful beaches and unique geological landscape (Figure 2), Tenerife has attracted approximately five million tourists on a yearly basis [10]. Tenerife also hosts the largest active volcano of the archipelago, the Teide-Pico Viejo volcanic complex [14].
The geological evolution of Tenerife started with a basaltic shield volcano (>12 Ma to present), which forms the bulk of the island, but was largely submerged [18,22]. Basaltic volcanism continues through the NW rift and NE rift [23]. The central complex comprises the Las Cañadas edifice and the active Teide-Pico Viejo stratovolcanoes (18 Ka to present) [24]. The phonolitic volcanism builds the Las Cañadas edifice (>3.5 Ma to 18 Ka), which appeared after the phase of basaltic shield. The active Teide-Pico Viejo evolved from basaltic to phonolitic [25].
Tenerife volcano remains active, and an eruption is very likely on the island [14]. Eruptive products, particularly ash fall, lava flows and PDCs, could have a significantly detrimental impact on the society and economy of Tenerife [24,26]. Therefore, we simulated these three key volcanic hazards for risk assessment in this study.

2.2. Data

2.2.1. Geospatial Data

The geospatial data used in this study consist of remote sensing images, 30 m resolution digital elevation model (DEM), vector data of administrative boundaries and annual wind data. Landsat 8 OLI (Operational Land Imager) data were used in this study. Remote sensing data (acquisition date: 2017-04-17 and path/row: 207/40, 207/41) were downloaded at no charge from the United States Geological Survey website (USGS, https://earthexplorer.usgs.gov/). DEM was required for simulating volcanic hazards and deriving a slope map, while the vector data were used to crop the DEM data. Both the DEM and vector data were freely obtained from the Instituto Geográfico Nacional (http://www.ing.es). Annual wind speed and direction data were freely obtained from the University of Wyoming Department of Atmospheric Science sounding database (http://weather.uwyo.edu/upperair/sounding.html) and used to simulate ash fall.
The Landsat 8 image was used to derive the distribution of buildings on Tenerife. The distribution of buildings was used for obtaining the population density of each municipality (see Section 3.2.2), which was calculated by the total population of a municipality divided by its area of buildings. The image classification was performed with random forest (RF), a robust machine learning algorithm that produces better image classifications than many other classifiers [28,29,30] in order to accurately map buildings (Figure 3). Using the high-resolution satellite images in Google Earth Pro as reference data, we were able to construct a confusion matrix and calculated the overall accuracy (0.88) and Kappa coefficient (0.81). Since the Kappa coefficient was greater than 0.70 [31], the classification result was acceptable.

2.2.2. Geological Data

It would be preferable if all the potential cones and vents are considered for hazard simulations. Although they can be identified through visually interpreting remote sensing image data such as Sentinel-2 and Landsat 8, fieldwork-based validation is required for such an approach. As such, we referred to the study of Marti and Felpeto [22], which provides a reliable distribution of vents and vent alignments of mafic and felsic eruptions. The locations of vents and vent alignments were extracted by manual vectorization and shown in Figure 4. All vents and vent alignments are younger than 35 Ka, as it represents the maximum period for the Teide-Pico Viejo stratovolcanoes and an upper time limit for the massive appearance of phonolites on these volcanoes [22]. However, the youngest eruptions in south has been dated as 96±5 Ka [23]; south vents were, therefore, not considered. Among the considered vents and vent alignments, felsic ones were used in eruptive Scenario 1 and mafic ones in eruptive Scenario 2.

2.2.3. Socio-economic Statistics

In order to build a social vulnerability assessment system, social-economic statistical data were required to retrieve indicators. Based on previous studies [1,12] and the availability of data, we collected a variety of social-economic statistical data on infrastructure, economics, administration and population (Table 2) for extracting indicators required for social vulnerability analysis (see Section 3.2.1). Because it was challenging to obtain data all acquired in 2017, data acquired in neighboring years were replaced instead. We assume that the effect was limited in the context of Tenerife.

3. Methods

3.1. Volcanic Hazard Simulations

To accurately forecast the distribution of volcanic hazards, useful and powerful tools for volcanic hazard analysis are essential [32]. A variety of volcanic hazard assessment tools have been developed during the past few decades, many of which are specific to a single hazard type, e.g., Q-LavHA [33] for lava flows, Tephra 2 [34,35] and Hazmap [36] for tephra, the Energy Cone [37,38], and the Energy Line [39] models for pyroclastic density currents (PDCs). While these tools may more or less accurately map the distribution and impact of a given volcanic hazard type, they do not allow an assessment of multiple hazards and their associated risk. With a need for more comprehensive volcanic hazard assessments, programs capable of simulating multiple volcanic hazards have been developed, such as the Volcanic Hazards Assessment Support System (VHASS) [32] and the Volcanic Risk Information System (VORIS) [21]. Despite being simple and flexible, VHASS is unable to simulate lava flows. The VORIS tool, a Geographic Information System (GIS)-based volcanic hazard simulation system [40], provides this option. Due to the ease of use and operation in a GIS environment, it is effective in both volcanic hazard simulations and risk assessment [32,41]. It has been successfully applied in risk assessments of many different volcanoes such as Valles Caldera [11], Nyamuragira [42] and São Miguel Island [43]. As such, we made use of the VORIS tool in this study to simulate a variety of volcanic hazards.

3.1.1. Eruptive Scenarios

Depending on the composition of magma and the type of eruption, the eruptions of Tenerife result in different products. The eruptive history of Tenerife is characterized by two major different eruptive styles, one is effusive basaltic eruptions mainly along NE-SW and NW-SE ridges, and the other is explosive phonolitic eruptions from the central edifice [9]. Based on eruptive mechanisms of future eruption in Tenerife analyzed by Carracedo et al. [23], vents on the northwest ridge have a higher probability of basaltic and intermediate Strombolian eruptions, while vents on the northeast ridge have a lower probability. Although vents on the northwest ridge may occur in Holocenic eruptive activity and vents on the northwest ridge may occur in Pleistocene eruptive activity, vents on two ridges are likely to bring volcanic hazards, so we hypothesized violent Strombolian eruption from vents on two ridges.
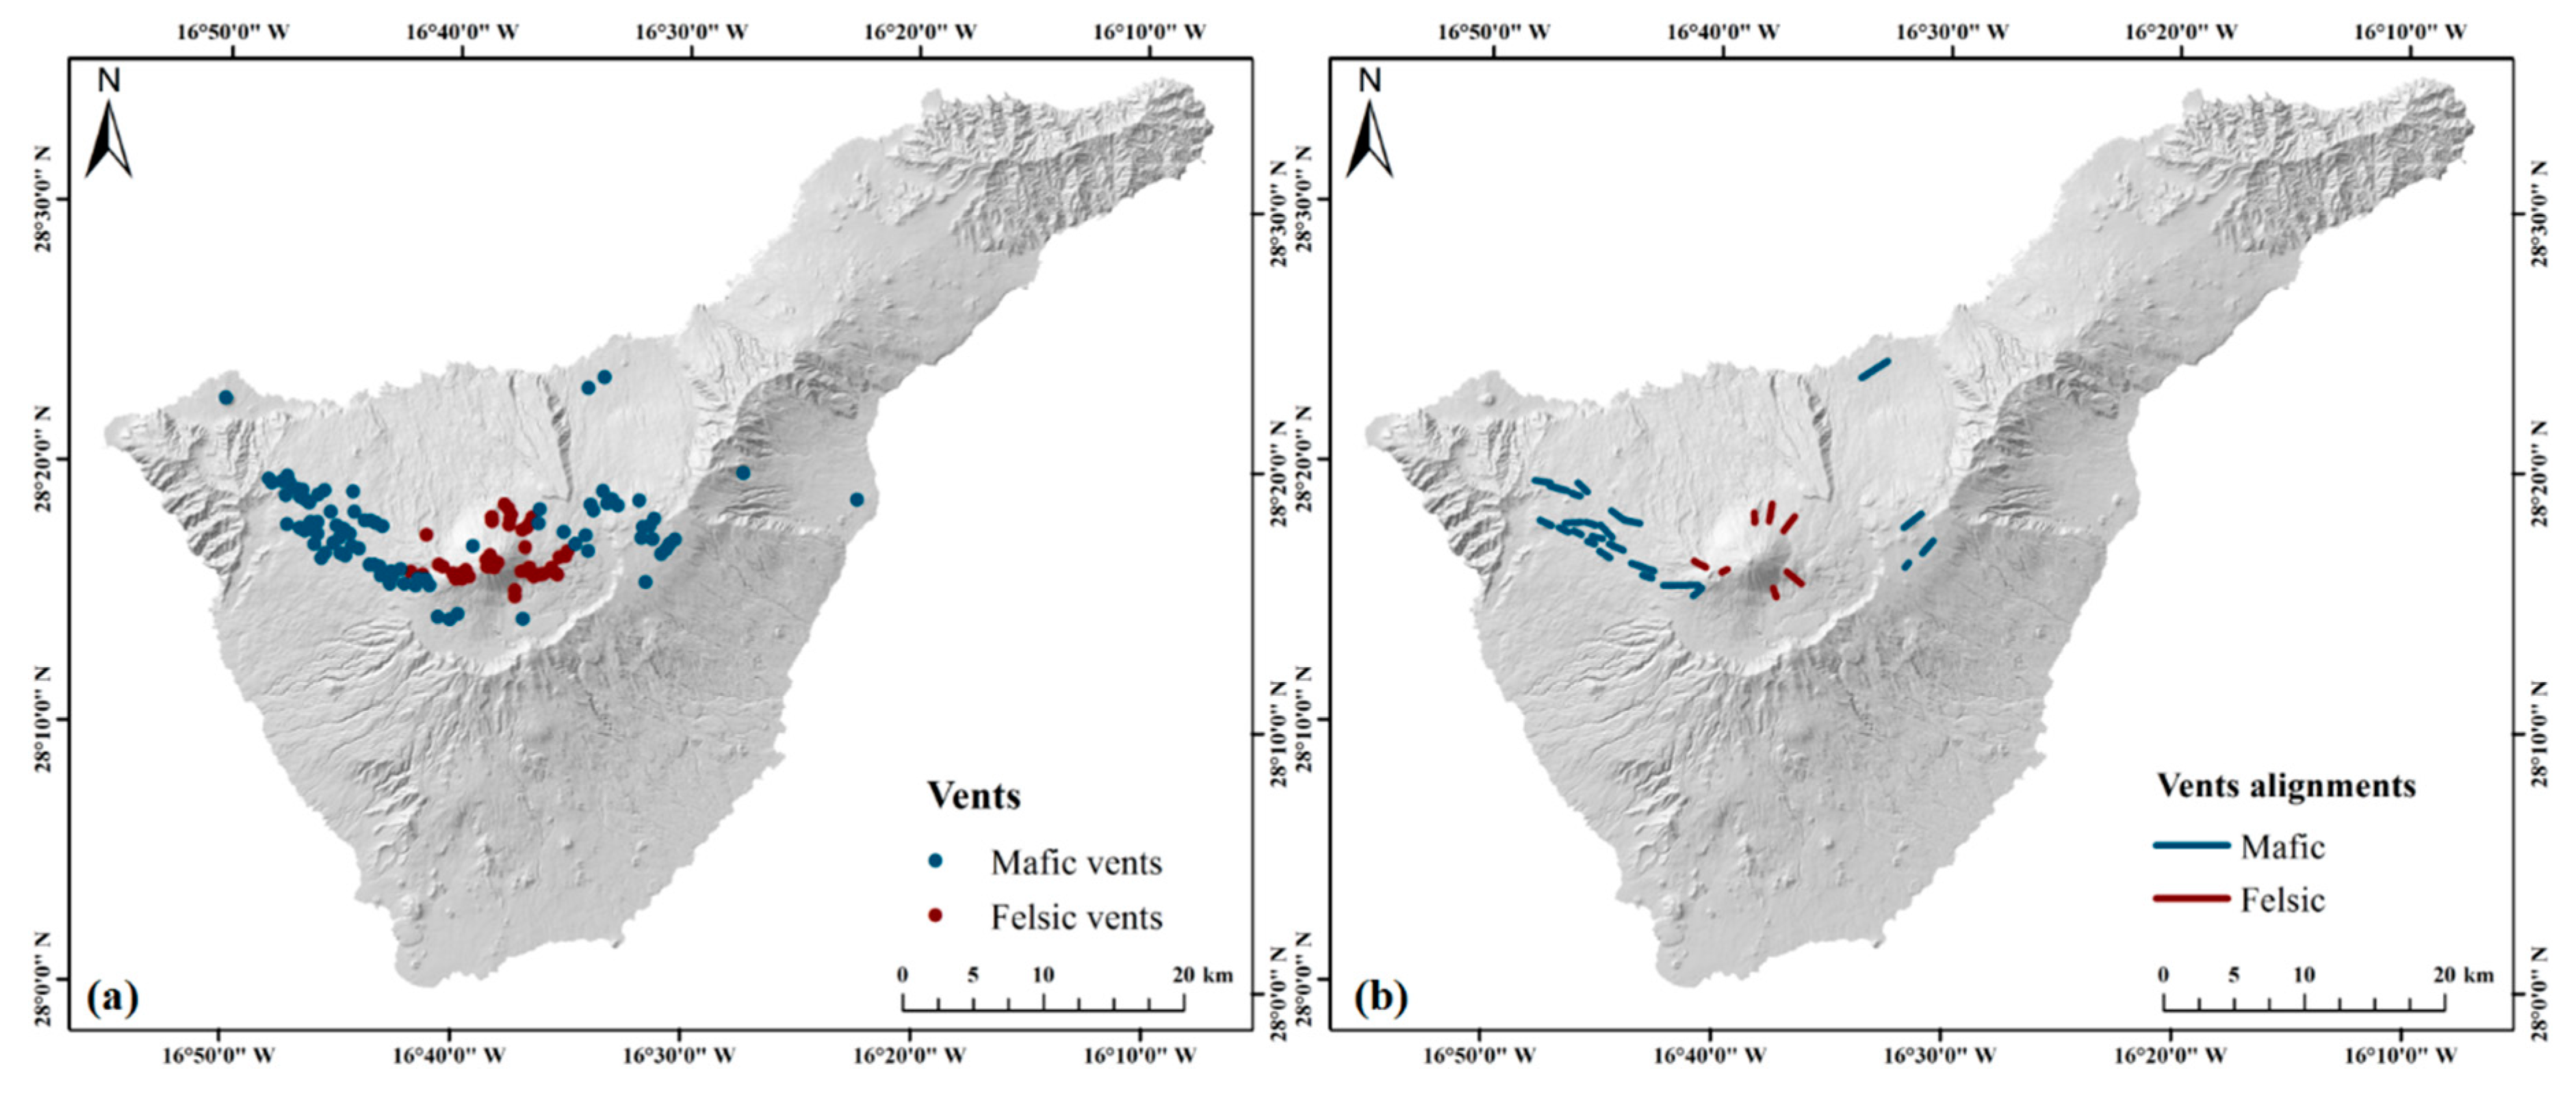
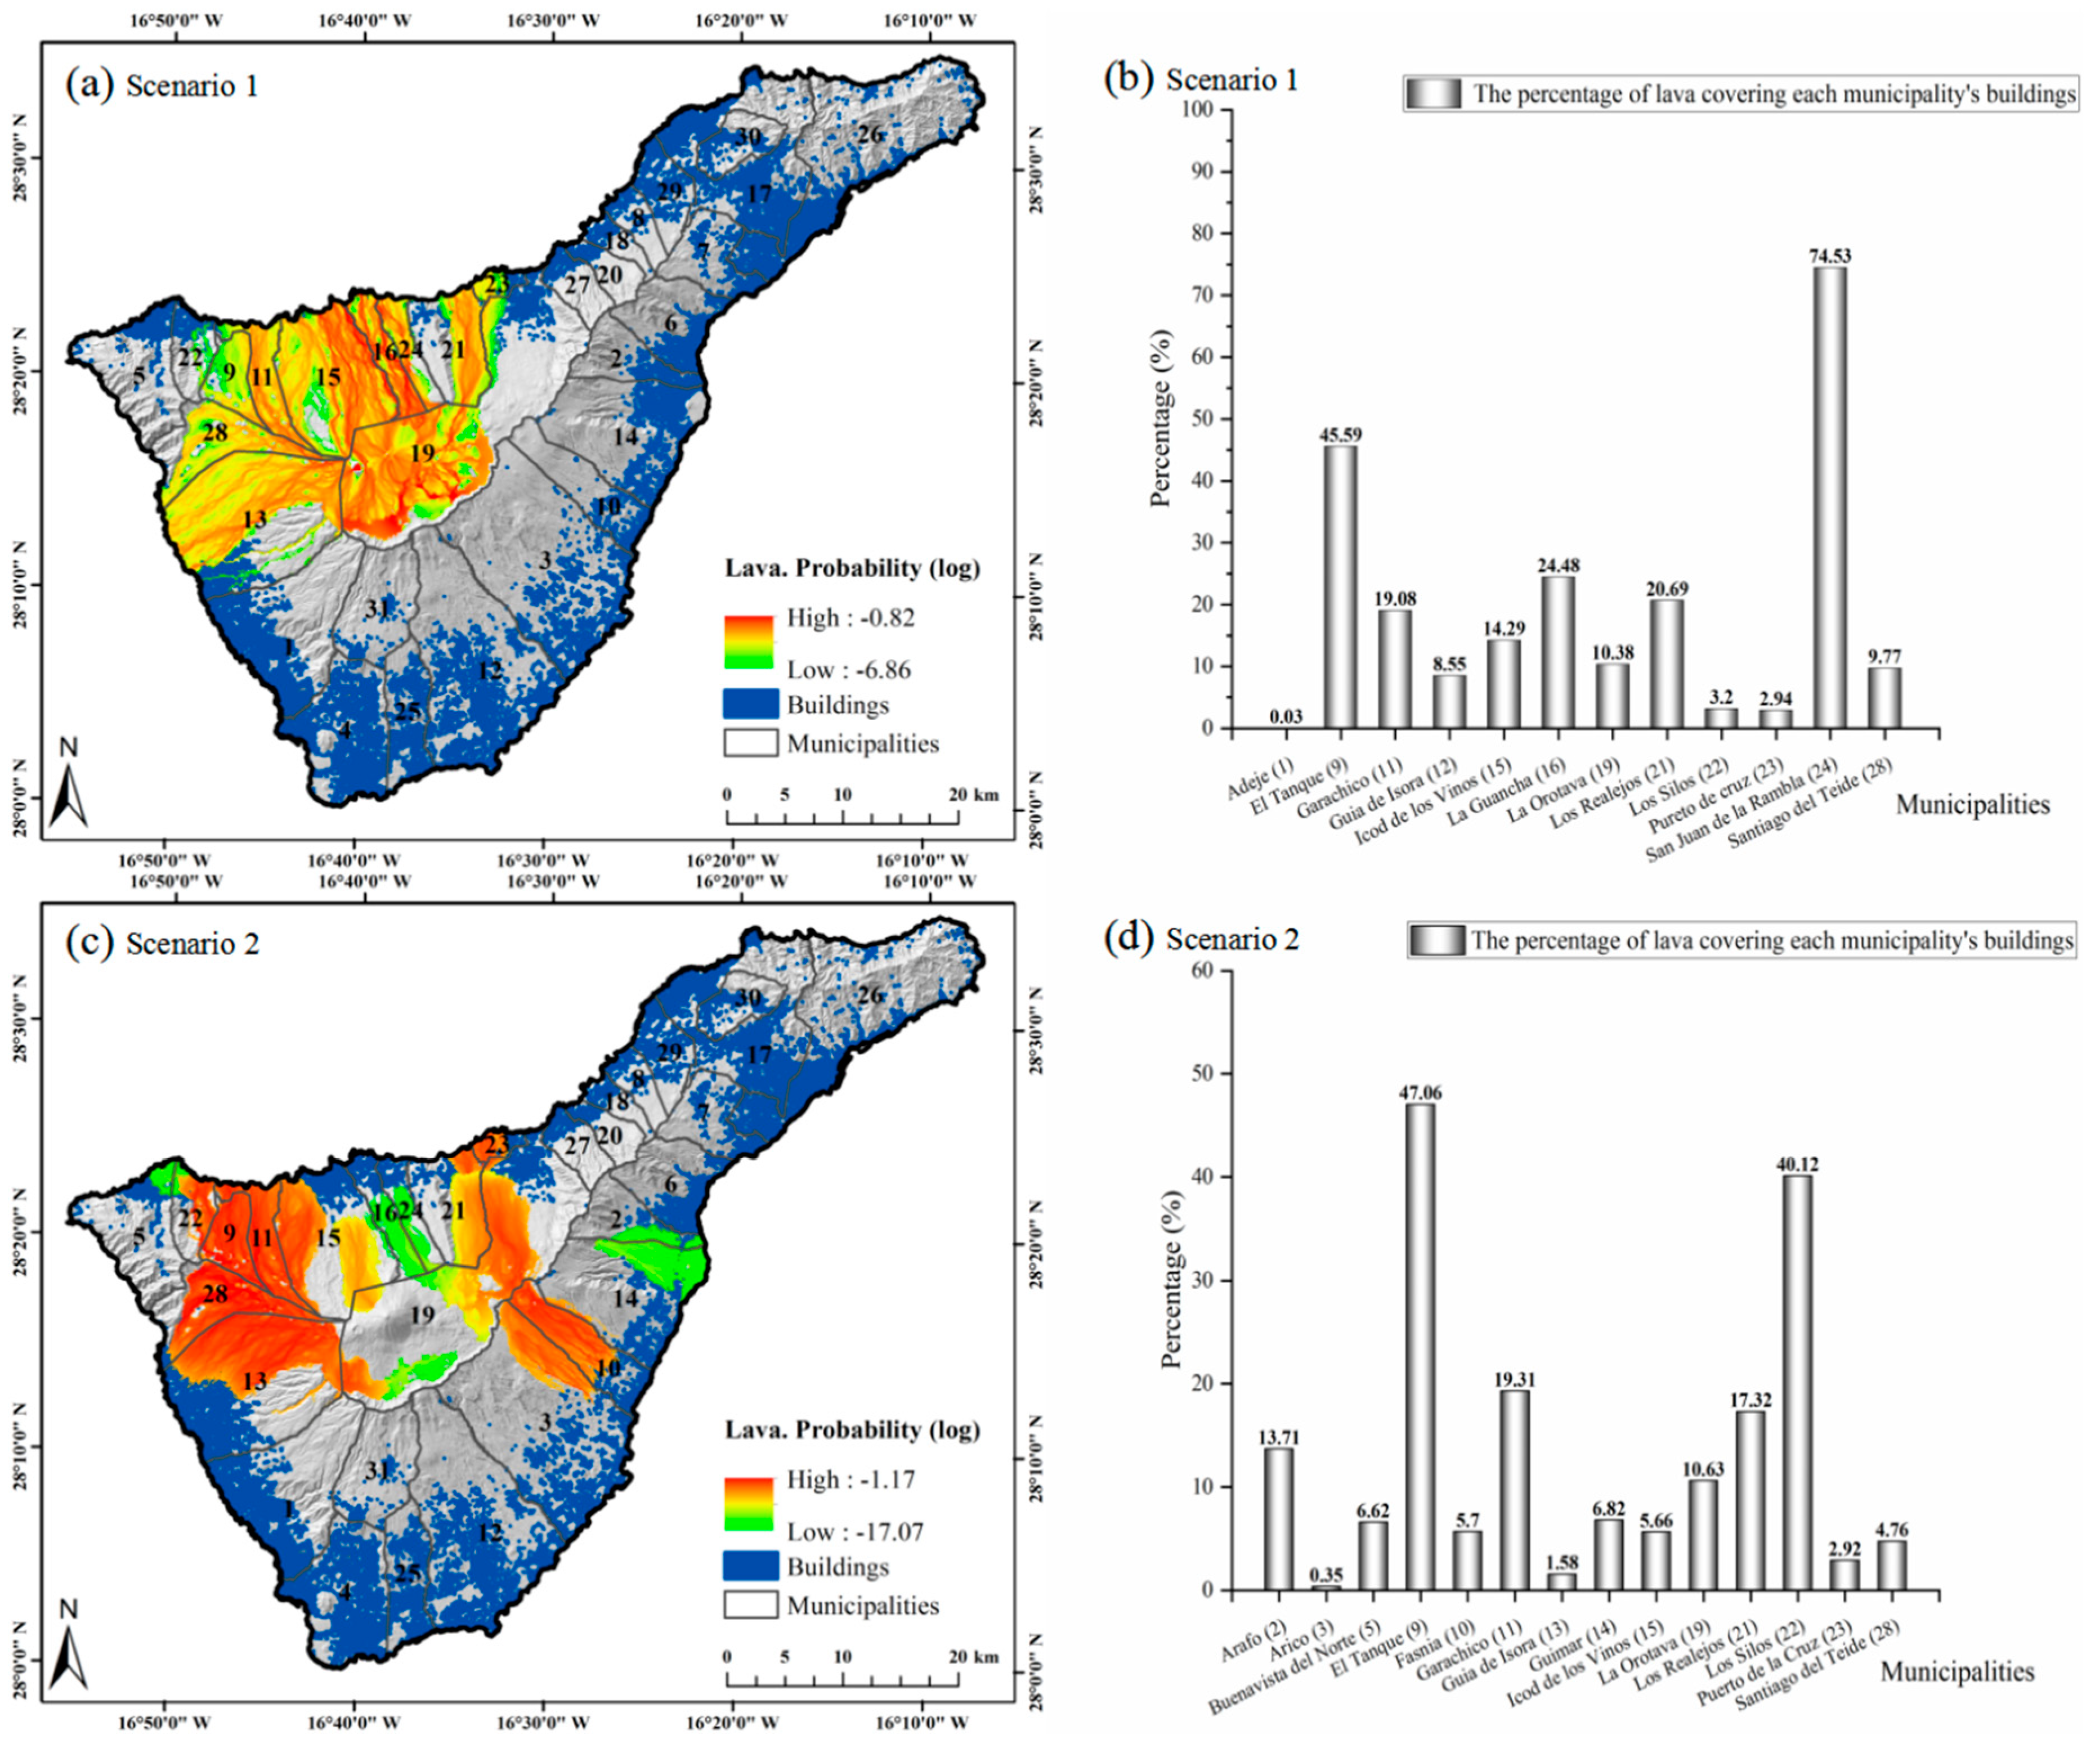
  • Scenario 1: Sub-Plinian eruption at the central edifice. With ash fall dispersing in the atmosphere and on the ground, an explosive eruption produces an 8 km eruptive column which later forms a PDC after collapse. Associated to this eruption is a phonolitic lava flow from the central edifice.
  • Scenario 2: Strombolian eruption in the basalt ridges in the NE-SW and NW-SE directions. The eruption is weaker (eruptive column 3 km high) than that at the central edifice. Basaltic lava flows downstream from high-susceptibility vents on the two ridges [12].
Volcanic hazards in the two eruptive scenarios (lava flows, PDC and ash fall in Scenario 1; lava flows and ash fall in Scenario 2) were simulated using the VORIS tool [21]. The input parameters for the two eruptive scenarios are shown in Table 3.

3.1.2. Lava Flows

The location of future vents is critical for hazard simulations and risk assessment [42]. The first step in hazard simulations is to evaluate the susceptibility (the spatial probability that the opening of a future vent is generated [44]). Susceptibility analysis methods include the new age model [45] and probabilistic method [22]. Due to the lack of relevant data, the location of future vents in this study was determined by the probabilistic method [22]. The assumption of susceptibility analysis is based on the fact that the volcanic stress field has not changed significantly since the last eruption. The new vents will not be far away from previous ones [22,46]. First, the probability density functions (PDFs) of vents and vent alignments are calculated through the Gaussian kernel function (the smoothing parameters of mafic vents, felsic vents, mafic alignments and felsic alignments are 500 m, 300 m, 1 km and 2 km [22] respectively). Then, the spatial intensity of volcanism is a linear combination of PDFs with weights assigned according to the relevance of vents and vent alignments to volcanic susceptibility (0.7 for the weight of vent PDFs and 0.3 for vent alignment PDFs [22]). Finally, the spatial intensity of volcanism is used to generate the volcanic susceptibility through a non-homogeneous Poisson process. The spatial probabilities of Tenerife’s future vents (Figure 5) was generated by using the Susceptibility module in the VORIS tool [40].
The simulation of lava flows is based on a probabilistic maximum slope model [21]. Many examples of probabilistic lava flow modelling in different active volcanic areas can be found in literature [47,48,49]. In this model, topographic factor plays a major role in the flow direction of lava. In the process of calculating all possible paths of lava flows, two basic rules are followed: (1) under the premise of positive elevation difference, lava can flow to one of the eight surrounding pixels; and (2) the greater the elevation difference of the pixels is, the greater the probability of flowing to the pixel is. The dynamics of lava flows are controlled by the parameters such as the maximum flow distance, flow height and thickness [40]. The main parameters of lava flow simulation are listed in Table 3. The topographic factor used for lava flows simulation is the 30 m resolution DEM dataset. The VORIS tool [40] was used to simulate lava flows.

3.1.3. Ash Fall

The advection-diffusion model [45] designed for Plinian-style eruptions was used to simulate the deposition of ash fall. The model is based on the fact that the movement of ash particles is controlled by the advection of wind, the diffusion of particles and the final settling velocity of particles after the ash is erupted into the air [40]. The initial state of ash particles in the vertical direction of the eruptive vent is constrained by parameters such as eruptive amount, column height, particle size and A-parameter [11]. The A parameter describes the mass concentration of particles at the height of the eruptive column and was set to 5 in this study, following the study of Alcorn et al. [11]. The diffusion of ash particles in the horizontal direction is constrained by multiple parameters, such as eruptive scale, particle size, atmospheric conditions and horizontal diffusion coefficient (Table 3).
Meteorological conditions such as wind direction and wind speed are important factors affecting the distribution of ash fall [50,51]. Scholars have used different methods for this parameter, such as randomly extracting one day of data from years of meteorological records [10,12,17,52] or using years of average wind direction and wind speed [9]. The method used was adjusted after Alcorn et al. [11]. The average wind direction and wind speed of four seasons were used to simulate ash fall in our study. The overall ash fall simulation results were generated by summing the seasonal ash fall simulation results with an equal weight of 0.25. The wind direction and speed data of the Guimar Meteorological Observatory located in Tenerife (station number: 60018) acquired at different elevations in 2017 are given in Table 4.
With the parameters, the VORIS tool [40] was used to simulate ash fall distribution according to the eruptive scenarios, and an ash fall distribution map with 30 m resolution was produced.

3.1.4. Pyroclastic Density Currents

The energy cone model [37] was used to simulate the PDC, which is constrained by topography, collapse equivalent height (Hc) and collapse equivalent angle (αc). The collapse equivalent angle is calculated by equivalent collapse height (Hc) and jump length (L) [40]:
α c = actan ( Hc L ) ,
According to the description of the previous eruptive scenarios, we only simulated a large PDC from the main crater of the central edifice. The main parameters are shown in Table 3.

3.2. Social Vulnerability Assessment

Methods for vulnerability analysis include the multi-criteria evaluation (MCE) [11], Self-Organizing Map [1] and Vulnerability Scoping Diagram (VSD) [53,54]. Here we adopted the VSD approach proposed by Polsky et al. [55], who define it as exposure, sensitivity and (adaptive) capability to compare assessments with dissimilar measures. Compared to a single-factor analysis, the VSD framework is more suitable for a comprehensive vulnerability analysis [28]. The VSD framework decomposes and organizes assessment data into sub-target layer, feature layer and indicator presentation, characterized by high integration with concepts, indicators and data, and has wide applicability [47]. Within the VSD framework, we constructed a social vulnerability assessment system for Tenerife. The calculation formula for vulnerability is as follows:
Vulnerability = E x p o s u r e × S e n s i t i v i t y C a p a b i l i t y ,
Exposure is the degree of external interference or stress that the system receives as a result of hazard [55]. Areas with high exposure are difficult to self-regulate and are more sensitive to higher vulnerability and disaster risk. As it is often reflected through human activity, exposure in the study was characterized by population density, total number of tourists, agriculture and gross domestic product (GDP).
Sensitivity is the degree to which natural-human systems are affected by environmental changes, determined by the type and characteristics of the systems [55]. Areas with higher susceptibility are more likely to be more vulnerable and destroyed. Sensitivity is mainly reflected in demographic, environmental and social aspects through the following indicators: the population of low education, the population under 14 and over 65, the disabled population, the Spanish-speaking tourists, the slope, the number of vehicles per capita, the number of groundwater sources, the density of the road network, the length of the underground cable, and so forth.
Capability refers to the ability of the system to deal with, adapt to stress and the consequences of coercion [55]. Greater adaptability implies a greater probability that the system will return to equilibrium. It can be improved through human intervention or adaptive management. We here decided to use the disaster emergency evacuation capability, represented by the per capita income and the municipal fiscal revenue, and the post-disaster reconstruction capability, represented by the number of firefighters and police officers, in order to characterize the adaptability of volcanic vulnerability in the study area.

3.2.1. Indicators

The VSD framework consists of exposure, sensitivity and capability, each represented by several different indicators [56]. It is almost impossible to collect all indicators that characterize social vulnerability. Based on previous studies on Tenerife and beyond [1,11,12,57], data availability, time and resources, a total of 19 indicators were used to construct a social vulnerability assessment model for Tenerife (Table 5). These indicators were rigorously selected from socio-economic statistical data as they are relatively representative and easily accessible. They can be applied to other volcanic areas after some adaption.

3.2.2. Data Pre-Processing

As data for the indicators were acquired in different units from multiple sources, it is necessary to standardize the original data to make the indicators comparable. In this study, the normalized method proposed by Wu et al. [53] was used for standardization.
If the indicator is a positive contributor to vulnerability,
Y i = X i M i n i M a x i M i n i ,
and if the indicator is a negative contributor to vulnerability,
Y i = M a x i X i M a x i M i n i ,
where Xi and Yi represent the actual and standardized values of the indicator, respectively, and Maxi and Mini represent the maximal and minimal values of the indicator respectively.

3.2.3. Determining the Weight for Each Indicator

In an indicator-based vulnerability assessment, the weight of each indicator is essential to produce a logical result. Common methods for determining indicator weights include the analytic hierarchy process (AHP), Delphi method [11], the principal component analysis, entropy method and grey correlation method [1]. These methods are criticized either for being subjective or for ignoring expertise. Alternatively, it seems better to adopt a comprehensive approach that combines the two groups of methods. The weight for each indicator in the vulnerability assessment was determined by averaging the weight calculated through the AHP and the entropy method (Equation (5)). For details on the AHP and entropy method, please refer to Saaty [58], Xu et al., [59], Zhao et al. (2018) [60] and references therein.
W = ( w A H P + w E n t r o p y ) / 2 ,
where W (Table 6) denotes the overall weight of the first indicator, WAHP denotes the weight calculated by the AHP, and WEntropy denotes the weight calculated by the entropy method.
In this study, a comprehensive index-based method [61] was used to calculate the values of exposure, sensitivity and capability for each municipality. For example, the formula for calculating the exposure of each municipality is as follows:
E i = j = 1 n f j i w j i ,
where Ei is the value of exposure of municipality i, fji is the value of indicator j of municipality i, wji is the total weight value of indicator j of municipality i, and n is the number of indicators (n = 19 in this study). Similarly, we calculated the values of sensitivity and capability of each municipality. Then the vulnerability was estimated according to Equation (2).

3.3. Volcanic Risk Model

Following previous studies [26,62,63,64], the risk assessment in this study consisted of hazard simulation realized by the VORIS tool and vulnerability analysis based on the VSD framework. The risk is the product of hazard and vulnerability (Equation (7)) [65].
Risk = H a z a r d × V u l n e r a b i l i t y ,
Before calculating the volcanic risk of each eruptive scenario, we needed to standardize the hazards and social vulnerability. Both lava flow and PDC hazard maps were reclassified. Areas affected by lava flows or PDC were assigned a value 5, and areas that have not been affected were assigned a value of 1. Based on the tephra grading standards of Scaini et al. [12], the ash fall hazard map was divided into five grades by cumulative thickness, ranging from grade 1 (representing cumulative thickness of tephra < 0.001 m) to 5 (≥0.5 m). By applying Equation (7), volcanic risk was calculated on a pixel basis, and five volcanic risk maps were produced, three for Scenario 1 and two for Scenario 2. This was realized through spatial analysis in ArcGIS. According to Jenks natural breaks classification method, risk values were reclassified into five grades, namely extremely high, high, medium, medium low and low

4. Results

4.1. Volcanic Hazard Simulations

4.1.1. Lava Flow Simulations

We simulated three volcanic hazards (lava flows, PDC ash fall) in Scenario 1 and two volcanic hazards (lava flows and ash fall) in Scenario 2. In Scenario 1, lava flows on Tenerife were mainly distributed in the northwest, north and central parts (Figure 6a) and were not affected elsewhere. A total of 12 municipalities were under the impact of the lava flows. Among them, the percentage of buildings affected (Figure 6b) in Adeje (No. 1) was the smallest (only 0.03%), and the percentage of buildings affected in San Juan de la Rambla (No. 24) had the largest proportion at 74.53%.
In Scenario 2, lava flows were mainly along the ridges in the NE-SW and NW-SE directions (Figure 6c). The vast areas of east and southwest Tenerife were inundated by lava flows. Compared with Scenario 1, the central and northern regions were less affected. The largest percentage of lava covering buildings was 47.06% in El Tanque (No. 9), and the smallest percentage was 0.35% in Arico (No. 3) (Figure 6d). In both scenarios, the southern region, e.g., Adeje (No. 1), Arona (No. 4), San Miguel de Abona (No. 25) and Vilaflor (No. 31), was not influenced by lava flows thanks to the Las Cañadas Caldera scarp, which blocks the southward movement of lava from the central edifice.

4.1.2. PDC Simulation

In Scenario 1, the PDC was distributed in the north of Tenerife (Figure 7a). While buildings of four municipalities, i.e., San Juan de la Rambla (No. 24), La Guancha (No. 16), Icod de Los Vinos (No. 15) and Los Realejos (No. 21), were (nearly) all inundated with the pyroclastic flow, some were partially affected, e.g., Puerto de la Cruz (No. 23), Guia de Isora (No. 13) and Garachico (No. 11) (Figure 7b). Both Guia de Isora and Pureto de cruz were the lightest affected municipalities (the percentages of buildings covered were 0.04% and 0.53%, respectively).

4.1.3. Ash Fall Simulations

In the two eruptive scenarios, we simulated volcanic ash fall in four seasons (Figure 8 and Figure 9). Furthermore, the overall ash fall maps for the two scenarios were generated by averaging the seasonal ash fall simulations (Figure 10). Compared with lava flows and PDC, ash fall had the widest influence. As a result of the impact from wind direction and wind speed, ash fall in Scenario 1 was mainly distributed in the north of Tenerife, e.g., Icod de los Vinos (No. 15), Los Realejos (No. 21) and La Guancha (No. 16), with a maximal thickness of 3.00 m (Figure 10a), while ash fall in Scenario 2 was mainly distributed in the north and northwest of Tenerife, e.g., Los Silos (No. 22), Santiago del Teide (No. 28), La Garachico (No. 11) and EI Tanque (No. 9), with a maximal thickness of 0.74 m (Figure 10b). The northeast of Tenerife was affected by ash fall in Scenario 1, but not in Scenario 2. The east of Tenerife was influenced by ash fall in Scenario 2 more than in Scenario 1. In both eruptive scenarios, the south, southeast and southwest of Tenerife were not under the impact of ash. Following the classification method proposed by Scaini et al. (2014) [12], we divided the volcanic ash thickness into five levels, from level I (thinnest) to level V (thickest).

4.2. Social Vulnerability

4.2.1. Exposure Index

Following the procedure described in Section 3.2, we calculated the exposure index of Tenerife with the selected indicators (Table 6) and produced an exposure grading map using the Jenks natural breaks classification method (Figure 11a). Low exposure index was observed in the five northwest municipalities. Municipalities with high exposure were mainly located in the east part of the island, while three of the five municipalities with extremely high exposure were in the northeast.

4.2.2. Sensitivity Index

The sensitivity grading map of Tenerife was similarly produced (Figure 11b). Only the municipalities of La Orotava (No. 19) and Arona (No. 4) had extremely high sensitivity. Six municipalities, mainly in the northwest of Tenerife, were characterized with high sensitivity, including Santa Cruz de Tenerife (No. 26) and Granadilla de Abona (No. 12). The exposure index of the remaining municipalities ranged from low to medium.

4.2.3. Capability Index

The capability grading map of Tenerife was similarly obtained and shown in Figure 11c. The level of extremely high capability was observed in Santa Cruz de Tenerife (No. 26) and the level of high capability in Adeje (No. 1) and Laguna (No. 17). However, the capability of Tenerife to deal with volcanic hazards was weak, and 90% of the municipalities’ capability index was at the medium or below the medium level.

4.2.4. Vulnerability of Tenerife

The vulnerability of Tenerife (Figure 12) was calculated as per Equation (2) and divided into five levels by the Jenks natural breaks classification method. The level of extremely high vulnerability was observed in San Juan de la Rambla (No. 24), Arico (No. 3) and Santa Ursula (No. 17). The level of high vulnerability was observed in Santa Curz de Tenerife (No. 26), Adeje (No. 1), Los Soils (No. 22) and Santiago del Teide (No. 28). Municipalities with high vulnerability were mainly located in the NE, while the level of medium vulnerability was distributed in central and southern areas.

4.3. Volcanic Risk Assessment

By applying the risk model given in Section 3.3, the hazard-specific risk maps of Tenerife were produced for each eruptive scenario and shown in Figure 11 and Figure 12. The spatial distribution of volcanic risk is clear. In Scenario 1, the extremely high risk from lava flows was mainly distributed in the north and northwest, while low-, medium-low- and medium-risk areas were in the south and northeastern side (Figure 13a). In addition to extremely high risk from PDC in north Tenerife and Arico (No. 3), small areas in Guia de Isora (No. 13) were also characterized as extremely high-risk (Figure 13b). For volcanic ash related risk, extremely high- and high-risk areas were concentrated in the north and northeastern parts of Tenerife (Figure 13c). Due to the distribution volcanic ash, Arafo (No. 2) had high-, medium- and medium-low risks.
In Scenario 2, extremely high and high risk from lava flows were mainly distributed along the NE-SW and NW-SE ridges. The north of Buenavista del Norte (No. 5) and part of Arafo (No. 2) and Guimar (No. 14) were at extremely high risk due to lava coverage (Figure 14a). The risk from ash fall was extremely high in the northwest, north and southeast of Tenerife, but relatively lower in the densely populated areas in the northeast and south, e.g., Santa Cruz de Tenerife (No. 26), La Laguna (No. 17) and Arona (No. 4) (Figure 14b).

5. Discussion

5.1. Volcanic Hazard Analysis

We simulated volcanic hazards for two eruptive scenarios (Scenario 1 included lava flows, PDC and ash fall; Scenario 2 included lava flows and ash fall) in this study. We note that our lava-affected areas in two scenarios were different from that of Araña et al. [9]. Their lava flows covered most of Tenerife, while our lava-affected areas were on the northwest and north (Figure 5). Such difference can be explained by the different eruptive types and vents used. In this study, the central edifice adopting the Sub-Plinian type was applied to the central edifice, the Strombolian type to the two ridges and the 2 ka Sub-Plinian eruption of Montaña Blanca to the Araña [66]. Lava-affected areas in Scenario 1 were similar to results simulated by Martí et al. [10]. Lava-affected areas in two scenarios were consistent with the distribution predicted by Carracedo et al. [23]. For ash fall, both wind direction and wind speed played an important role in the spread of ash fall [51]. Unlike previous studies [12,17], we selected the average wind direction and wind speed for the four seasons of Tenerife in 2017. We assumed that this would be more accurate than the simulation using wind direction and wind speed on a certain day. Based on Tenerife’s geological conditions and eruptive history, the PDC of the central edifice was simulated (Figure 7a). The spatial distribution of simulated ash fall and PDC at Teide-Pico Viejo volcanic complex was in good agreement with that of Martí et al. [10], as we both selected the Sub-Plinian eruption for simulation.

5.2. Social Vulnerability Analysis

Vulnerability consists of a variety of components, which depend on the context of the research. Scaini et al. [12] assessed the physical vulnerability of sub-systems such as population, buildings and transportation in the three northern cities of Tenerife. Other studies have assessed community vulnerabilities from a socio-economic [11] or demographic [48] perspective. We adopted the socioeconomic perspective in this study, as this would be more appropriate for a comprehensive volcanic risk assessment. In order to more accurately analyze the spatial distribution of vulnerability in Tenerife, this study used buildings in each municipality as the evaluation unit rather than the entire municipality.
In this study, social vulnerability is an indicator of the ability of a group of people or a community to respond to and recover from a disaster. Based on the VSD framework, the vulnerability of Tenerife was divided into three components, namely exposure, sensitivity and capability. The three factors resulted in the spatial variability of Tenerife’s vulnerability (Figure 12). For example, Santa Curz de Tenerife (No. 26) had extremely high exposure (mainly because of high population) (Figure 11a) and high sensitivity (mainly because of low education and young/old population) (Figure 11b), but its high capability (Figure 11c) resulted in low vulnerability in this populated municipality. While La Orotava (No. 19) and Arona (No. 4) had high exposure (large agricultural acreage) and sensitivity (many disabled individuals), the two municipalities had moderate vulnerability due to moderate capability. Different from the two municipalities, San Juan de la Rambla (No. 24) had low exposure, sensitivity and capability, which makes it extremely vulnerable. It is suggested that the vulnerability assessment should be based on consideration of all the three components.

5.3. Volcanic Risk Management

How to improve public understanding about their vulnerability to volcanic hazards, how to take effective measures and strategies to mitigate the vulnerability and what emergency response should be made when volcanic events occur are important components of volcanic risk management [67]. In both eruptive scenarios, the northwest, north of Tenerife and Arico (No. 3) had extremely high volcanic risk (Figure 12and Figure 13). The extremely high volcanic risk in the northwestern and northern areas was due of volcanic hazards (including lava flows, PDC and ash fall). Although not affected by the volcanic hazards, Arico’s extremely high volcanic risk was due to extremely high vulnerability. The three types of volcanic hazards had different characteristics. PDCs are characterized by fast speed, high temperature and strong destructive power [68,69,70]. They tend to easily mix rocks, soil and water along the way to form secondary hazards such as lahars [71]. The high temperature and low speed of lava flow can be mitigated by engineering measures [11,26]. According to previous research, volcanic ash can seriously affect people’s health [72,73], buildings [53,59], infrastructure [60] and pollute water sources [61]. In particular, the potential impact of ash fall on the northern airport of Tenerife should be carefully considered, as the northern airport is affected by tephra in eruptive Scenario 1.
To manage volcano risks more effectively, it is necessary to improve the capability of individuals and local governments to deal with volcanic disasters [62]. In addition to improving the knowledge of local residents on dealing with volcanic events, tourists flowing into this island should also be advised as per age, gender, education and so on [62], which will contribute to disaster risk reduction on Tenerife.

5.4. Limitations

There are some limitations in this study, and cautions should be exercised. Firstly, more geological constraints should be put into the numerical simulations of volcanic hazards such as geodynamic movements, earthquake patterns and so forth. We only used old vents for eruption simulations, and not all possible locations (e.g., fumaroles, faults and springs) were considered. Secondly, it would be ideal if all the socio-economic statistics used for constructing the vulnerability assessment system were collected in the same year, but this is challenging in the case of Tenerife. However, we believe that such effect on vulnerability assessment is limited. In addition, physical vulnerability, for example the quality of buildings on this island, was not considered because we were unable to collect such data. Finally, it is important to highlight that our risk assessment was performed in the context of multiple volcanic hazards. The relationship between these volcanic hazards was not examined, and no overall hazard/risk maps were therefore presented here. Considering their interaction and associated secondary hazards, this could be a direction for future research in the risk assessment of Tenerife.
We present a comprehensive volcanic risk assessment framework by simulating volcanic hazards and quantifying social vulnerability in two eruptive scenarios for the island of Tenerife. In relation to future eruptions on Tenerife, the two scenarios for simulating volcanic hazards in this study cannot consider all the possibilities, but they support volcanic risk assessment that assists volcanic risk management on this island.

6. Conclusions

In this study, we tested a comprehensive volcanic risk assessment of the volcanic island of Tenerife based on the numerical simulation of volcanic hazards in two eruptive scenarios (Scenario 1 included lava flows, ash fall and PDC; Scenario 2 included lava flows and ash fall) and the vulnerability analysis with 19 socio-economic indicators in the VSD framework. The key findings and main conclusions are as follows:
  • In Scenario 1, volcanic hazards would be more likely to occur in NE ridges and north. Northern municipalities are affected by three volcanic hazards, while northeast municipalities are mainly affected by ash fall. In Scenario 2, NE, NW ridges and east municipalities are influenced by lava flows. Ash fall is mainly distributed in the northwest and north.
  • High vulnerability is expected in the southeast and northeast of Tenerife, such as Arico, Santa Ursula and Puerto de la Cruz. The socio-economic structure of such municipalities should be fully optimized to reduce volcano risk.
  • In Scenario 1, high risk for three volcanic hazards is expected in the north of Tenerife, including the municipalities of La Guancha, Icode de los Vinos and San Juan de la Rambla. In Scenario 2, high risk for lava and ash fall is expected in the northwest and the east. Volcanic risk management should be strengthened in such municipalities.
Although Tenerife volcanic activity is not currently active, a comprehensive risk assessment with volcanic hazards and social vulnerability can lay a foundation for risk management of future eruptions. Our study suggests that it should be necessary to enhance the management of the volcanic risk on Tenerife. By taking measures such as optimizing the distribution and construction of urban infrastructure, ensuring public services at the time of volcanic events, planning urban land use reasonably and avoiding human activity in volcanically active areas, the volcanic risk would be significantly reduced.
Furthermore, we would like to emphasize again that although the presented hazard simulations and vulnerability assessment might not be highly accurate due to the abovementioned limitations, the methodology adopted in this study, given its flexibility, may be transferred to other volcanic areas, including those at imminent risk. Both the volcanic hazard and social vulnerability factors in this volcanic risk assessment framework can be adapted in light of research needs and the characteristics of volcanic areas.

Author Contributions

Conceptualization, Weiqiang Liu, Long Li and Longqian Chen; Methodology, Weiqiang Liu and Long Li; Software, Weiqiang Liu and Yunqiang Liu; Formal Analysis, Weiqiang Liu, Long Li, Lina Yuan and Han Li; Resources, Long Li and Lina Yuan; Data Curation, Weiqiang Liu, Yunqiang Liu and Han Li; Writing—Original Draft Preparation, Weiqiang Liu, Long Li, Mingxin Wen and Jia Wang; Writing—Review & Editing, Long Li, Longqian Chen; Visualization, Mingxin Wen, Jia Wang; Supervision, Long Li and Longqian Chen; Funding Acquisition, Longqian Chen and Long Li. All authors have read and agreed to the published version of the manuscript.

Funding

This research was supported by the Fundamental Research Funds for the Central Universities (Grant No.: 2018QNB06).

Acknowledgments

We would like to thank the Instituto Canario de Estadística for freely providing socioeconomic data required in this study and Sophie Mossoux with Vrije Universiteit Brussel for sharing the Q-LavHA plug-in with us. We appreciate the discussion with Matthieu Kervyn with VUB and Carmen Solana with the University of Portsmouth who share their volcanological expertise but do not take any responsibility for the conclusions of the study. Comments from four reviewers, one of whom is Gianluca Groppelli with Istituto di Geologia Ambientale e Geoingegneria, are greatly appreciated for substantially improving the study and manuscript.

Conflicts of Interest

The authors declare no conflicts of interest.

References

  1. Maharani, Y.N.; Lee, S.; Ki, S.J. Social vulnerability at a local level around the Merapi volcano. Int. J. Disaster Risk Reduct. 2016, 20, 63–77. [Google Scholar] [CrossRef] [Green Version]
  2. Global Volcanism Program, Smithsonian Institution. Volcanoes of the World Database. Available online: https://volcano.si.edu/search_eruption.cfm (accessed on 19 October 2018).
  3. Warsini, S.; Mills, J.; Usher, K. Solastalgia: Living with the Environmental Damage Caused By Natural Disasters. Prehosp. Disaster Med. 2014, 29, 87–90. [Google Scholar] [CrossRef] [PubMed]
  4. Witham, C.S. Volcanic disasters and incidents: A new database. J. Volcanol. Geotherm. Res. 2005, 148, 191–233. [Google Scholar] [CrossRef]
  5. Bartolini, S.; Becerril, L.; Martí, J. A new Volcanic managEment Risk Database desIgn (VERDI): Application to El Hierro Island (Canary Islands). J. Volcanol. Geotherm. Res. 2014, 288, 132–143. [Google Scholar] [CrossRef] [Green Version]
  6. Lirer, L.; Petrosino, P.; Alberico, I.; Postiglione, I. Long-term volcanic hazard forecasts based on Somma-Vesuvio past eruptive activity. Bull. Volcanol. 2001, 63, 45–60. [Google Scholar] [CrossRef]
  7. Geyer, A.; Blanco, M.J.; Martí, J.; Felpeto, A.; Aspinall, W.P.; Baxter, P.; Pacheco, J.; Sobradelo, R.; Cole, P.; Ortiz, R.; et al. A long-term volcanic hazard event tree for Teide-Pico Viejo stratovolcanoes (Tenerife, Canary Islands). J. Volcanol. Geotherm. Res. 2008, 178, 543–552. [Google Scholar]
  8. Sobradelo, R.; Martí, J. Bayesian event tree for long-term volcanic hazard assessment: Application to Teide-Pico Viejo stratovolcanoes, Tenerife, Canary Islands. J. Geophys. Res. Solid Earth 2010, 115, 1–12. [Google Scholar] [CrossRef]
  9. Araña, V.; García, A.; Astiz, M.; Felpeto, A.; Abella, R.; Ortiz, R. Zonation of the main volcanic hazards (lava flows and ash fall) in Tenerife, Canary Islands. A proposal for a surveillance network. J. Volcanol. Geotherm. Res. 2002, 103, 377–391. [Google Scholar] [CrossRef]
  10. Martí, J.; Sobradelo, R.; Felpeto, A.; García, O. Eruptive scenarios of phonolitic volcanism at Teide-Pico Viejo volcanic complex (Tenerife, Canary Islands). Bull. Volcanol. 2012, 74, 767–782. [Google Scholar] [CrossRef]
  11. Alcorn, R.; Panter, K.S.; Gorsevski, P.V. A GIS-based volcanic hazard and risk assessment of eruptions sourced within Valles Caldera, New Mexico. J. Volcanol. Geotherm. Res. 2013, 267, 1–14. [Google Scholar] [CrossRef] [Green Version]
  12. Scaini, C.; Felpeto, A.; Martí, J.; Carniel, R. A GIS-based methodology for the estimation of potential volcanic damage and its application to Tenerife Island, Spain. J. Volcanol. Geotherm. Res. 2014, 278–279, 40–58. [Google Scholar] [CrossRef] [Green Version]
  13. Scandone, R.; Bartolini, S.; Martí, J. A scale for ranking volcanoes by risk. Bull. Volcanol. 2016, 78, 1–8. [Google Scholar] [CrossRef]
  14. Martí, J.; Ortiz, R.; Gottsmann, J.; Garcia, A.; De La Cruz-Reyna, S. Characterising unrest during the reawakening of the central volcanic complex on Tenerife, Canary Islands, 2004-205, 0and implications for assessing hazards and risk mitigation. J. Volcanol. Geotherm. Res. 2009, 182, 23–33. [Google Scholar] [CrossRef]
  15. Gómez-Fernández, F. Application of a GIS algorithm to delimit the areas protected against basic lava flow invasion on Tenerife Island. J. Volcanol. Geotherm. Res. 2000, 103, 409–423. [Google Scholar] [CrossRef]
  16. Gomez-Fernandez, F. Development of a Volcanic Risk Assessment Information System for the Prevention And Management Of Volcanic Crisis: Stating The Fundamentals. WIT Trans. Inf. Commun. Technol. 1970, 21. [Google Scholar] [CrossRef]
  17. Marti, J.; Spence, R.; Calogero, E.; Ordoñez, A.; Felpeto, A.; Baxter, P. Estimating building exposure and impact to volcanic hazards in Icod de los Vinos, Tenerife (Canary Islands). J. Volcanol. Geotherm. Res. 2008, 178, 553–561. [Google Scholar] [CrossRef]
  18. Marrero, J.M.; García, A.; Llinares, A.; Rodriguez-Losada, J.A.; Ortiz, R. A direct approach to estimating the number of potential fatalities from an eruption: Application to the Central Volcanic Complex of Tenerife Island. J. Volcanol. Geotherm. Res. 2012, 219–220, 33–40. [Google Scholar] [CrossRef]
  19. PHIVOLCS. Introduction to Volcanoes. Available online: https://www.phivolcs.dost.gov.ph/index.php/volcano-hazard/introduction-to-volcanoes (accessed on 1 March 2020).
  20. Branney, M.; Acocella, V. Calderas. In The Encyclopedia of Volcanoes; Academic Press: Amsterdam, The Netherlands, 2015; pp. 299–315. [Google Scholar]
  21. Felpeto, A.; Martí, J.; Ortiz, R. Automatic GIS-based system for volcanic hazard assessment. J. Volcanol. Geotherm. Res. 2007, 166, 106–116. [Google Scholar] [CrossRef]
  22. Marti, J.; Felpeto, A. Methodology for the computation of volcanic susceptibility. An example for mafic and felsic eruptions on Tenerife (Canary Islands). J. Volcanol. Geotherm. Res. 2010, 195, 69–77. [Google Scholar] [CrossRef]
  23. Carracedo, J.C.; Rodríguez Badiola, E.; Guillou, H.; Paterne, M.; Scaillet, S.; Pérez Torrado, F.J.; Paris, R.; Fra-Paleo, U.; Hansen, A. Eruptive and structural history of Teide Volcano and rift zones of Tenerife, Canary Islands. Bull. Geol. Soc. Am. 2007, 119, 1027–1051. [Google Scholar] [CrossRef] [Green Version]
  24. Martí, J.; Geyer, A.; Andujar, J.; Teixidó, F.; Costa, F. Assessing the potential for future explosive activity from Teide-Pico Viejo stratovolcanoes (Tenerife, Canary Islands). J. Volcanol. Geotherm. Res. 2008, 178, 529–542. [Google Scholar] [CrossRef]
  25. Martí, J. Las Cañadas caldera, Tenerife, Canary Islands: A review, or the end of a long volcanological controversy. Earth-Sci. Rev. 2019, 196, 102889. [Google Scholar] [CrossRef]
  26. Solana, M.C. Development of unconfined historic lava flow fields in Tenerife: Implications for the mitigation of risk from a future eruption. Bull. Volcanol. 2012, 74, 2397–2413. [Google Scholar] [CrossRef]
  27. Li, L.; Solana, C.; Canters, F.; Chan, J.C.W.; Kervyn, M. Impact of environmental factors on the spectral characteristics of lava surfaces: Field spectrometry of basaltic lava flows on Tenerife, Canary Islands, Spain. Remote Sens. 2015, 7, 16986–17012. [Google Scholar] [CrossRef] [Green Version]
  28. Li, L.; Solana, C.; Canters, F.; Kervyn, M. Testing random forest classification for identifying lava flows and mapping age groups on a single Landsat 8 image. J. Volcanol. Geotherm. Res. 2017, 345, 109–124. [Google Scholar] [CrossRef] [Green Version]
  29. Cui, Y.; Li, L.; Chen, L.; Zhang, Y.; Cheng, L.; Zhou, X.; Yang, X. Land-use carbon emissions estimation for the Yangtze River Delta Urban Agglomeration using 1994–2016 Landsat image data. Remote Sens. 2018, 10, 1334. [Google Scholar] [CrossRef] [Green Version]
  30. Zhou, X.; Li, L.; Chen, L.; Liu, Y.; Cui, Y.; Zhang, Y.; Zhang, T. Discriminating urban forest types from Sentinel-2A image data through linear spectral mixture analysis: A case study of Xuzhou, East China. Forests 2019, 10, 478. [Google Scholar] [CrossRef] [Green Version]
  31. Janssen, L.L.F.; Van der Wel, F.J.M. Accuracy assessment of satellite derived land-cover data: A review. Photogramm. Eng. Remote Sens. 1994, 60, 419–426. [Google Scholar]
  32. Takarada, S. The Volcanic Hazards Assessment Support System for the Online Hazard Assessment and Risk Mitigation of Quaternary Volcanoes in the World. Front. Earth Sci. 2017, 5, 1–14. [Google Scholar] [CrossRef]
  33. Mossoux, S.; Saey, M.; Bartolini, S.; Poppe, S.; Canters, F.; Kervyn, M. Q-LAVHA: A flexible GIS plugin to simulate lava flows. Comput. Geosci. 2016, 97, 98–109. [Google Scholar] [CrossRef]
  34. Bonadonna, C.; Connor, C.B.; Houghton, B.F.; Connor, L.; Byrne, M.; Laing, A.; Hincks, T.K. Probabilistic modeling of tephra dispersal: Hazard assessment of a multiphase rhyolitic eruption at Tarawera, New Zealand. J. Geophys. Res. Solid Earth 2005, 110, 1–21. [Google Scholar] [CrossRef]
  35. Biass, S.; Frischknecht, C.; Bonadonna, C. A fast GIS-based risk assessment for tephra fallout: The example of Cotopaxi volcano, Ecuador. Nat. Hazards 2012, 65, 497–521. [Google Scholar] [CrossRef] [Green Version]
  36. Macedonio, G.; Costa, A.; Longo, A. A computer model for volcanic ash fallout and assessment of subsequent hazard. Comput. Geosci. 2005, 31, 837–845. [Google Scholar] [CrossRef]
  37. Malin, M.C.; Sheridan, M.F. Computer-Assisted Mapping of Pyroclastic Surges. Science 1982, 217, 637–640. [Google Scholar] [CrossRef] [PubMed]
  38. García, O.; Marti, J.; Aguirre, G.; Geyer, A.; Iribarren, I. Pyroclastic density currents from Teide-Pico Viejo (Tenerife, Canary Islands): Implications for hazard assessment. Terra Nov. 2011, 23, 220–224. [Google Scholar] [CrossRef]
  39. Toyos, G.P.; Cole, P.D.; Felpeto, A.; Martí, J. A GIS-based methodology for hazard mapping of small volume pyroclastic density currents. Nat. Hazards 2007, 41, 99–112. [Google Scholar] [CrossRef]
  40. Felpeto, A. A GIS-Based Tool for Volcanic Hazard Assessment User’s Guide; 2007. Available online: http://www.gvb-csic.es/GVB/VORIS/VORIS_2_0_1_guide.pdf (accessed on 18 April 2020).
  41. Bisson, M.; Paolillo, A.; Tadini, A.; Sulpizio, R.; Zanchetta, G. Volcanoclastic flow hazard assessment in highly populated areas: A GIS-based approach applied to Torre del Greco municipality (Somma-Vesuvius, Italy). Geosci. J. 2018, 22, 501–522. [Google Scholar] [CrossRef]
  42. Syavulisembo, A.M.; Havenith, H.B.; Smets, B.; D’Oreye, N.; Marti, J. Preliminary assessment for the use of VORIS as a tool for rapid lava flow simulation at Goma Volcano Observatory, Democratic Republic of the Congo. Nat. Hazards Earth Syst. Sci. 2015, 15, 2391–2400. [Google Scholar] [CrossRef] [Green Version]
  43. Gaspar, J.; Guest, J.E.; Queiroz, G.; Pacheco, J.; Pimentel, A.; Gomes, A.; Marques, R.; Felpeto, A.; Ferreira, T.; Wallenstein, N. Eruptive frequency and volcanic hazards zonation in Sao Miguel Island, Azores. Geol. Soc. Lond. Mem. 2015, 44, 155–166. [Google Scholar] [CrossRef]
  44. Bartolini, S.; Geyer, A.; Martí, J.; Pedrazzi, D.; Aguirre-Díaz, G. Volcanic hazard on Deception Island (South Shetland Islands, Antarctica). J. Volcanol. Geotherm. Res. 2014, 285, 150–168. [Google Scholar] [CrossRef] [Green Version]
  45. Bebbington, M.S.; Cronin, S.J. Spatio-temporal hazard estimation in the Auckland Volcanic Field, New Zealand, with a new event-order model. Bull. Volcanol. 2011, 73, 55–72. [Google Scholar] [CrossRef]
  46. Becerril, L.; Martí, J.; Bartolini, S.; Geyer, A. Assessing qualitative long-Term volcanic hazards at Lanzarote Island (Canary Islands). Nat. Hazards Earth Syst. Sci. 2017, 17, 1145–1157. [Google Scholar] [CrossRef] [Green Version]
  47. Favalli, M.; Chirico, G.D.; Papale, P.; Pareschi, M.T.; Boschi, E. Lava flow hazard at Nyiragongo volcano, D.R.C. 1. Model calibration and hazard mapping. Bull. Volcanol. 2009, 71, 363–374. [Google Scholar] [CrossRef]
  48. Herault, A.; Vicari, A.; Ciraudo, A.; Del Negro, C. Forecasting lava flow hazards during the 2006 Etna eruption: Using the MAGFLOW cellular automata model. Comput. Geosci. 2009, 35, 1050–1060. [Google Scholar] [CrossRef]
  49. Tarquini, S.; Favalli, M. Mapping and DOWNFLOW simulation of recent lava flow fields at Mount Etna. J. Volcanol. Geotherm. Res. 2011, 204, 27–39. [Google Scholar] [CrossRef]
  50. Folch, A.; Felpeto, A. A coupled model for dispersal of tephra during sustained explosive eruptions. J. Volcanol. Geotherm. Res. 2005, 145, 337–349. [Google Scholar] [CrossRef]
  51. Oishi, M.; Nishiki, K.; Geshi, N.; Furukawa, R.; Ishizuka, Y.; Oikawa, T.; Yamamoto, T.; Nanayama, F.; Tanaka, A.; Hirota, A.; et al. Distribution and mass of tephra-fall deposits from volcanic eruptions of Sakurajima Volcano based on posteruption surveys. Bull. Volcanol. 2018, 80, 42. [Google Scholar] [CrossRef]
  52. Jenkins, S.; Magill, C.; McAneney, J.; Hurst, T. Multistage volcanic events: Tephra hazard simulations for the Okataina Volcanic Center, New Zealand. J. Geophys. Res. Earth Surf. 2008, 113. [Google Scholar] [CrossRef]
  53. Wu, J.; Lin, X.; Wang, M.; Peng, J.; Tu, Y. Assessing agricultural drought vulnerability by a VSD Model: A case study in Yunnan Province, China. Sustainability 2017, 9, 918. [Google Scholar] [CrossRef] [Green Version]
  54. Nicholas, K.A.; Durham, W.H. Farm-scale adaptation and vulnerability to environmental stresses: Insights from winegrowing in Northern California. Glob. Environ. Chang. 2012, 22, 483–494. [Google Scholar] [CrossRef]
  55. Polsky, C.; Neff, R.; Yarnal, B. Building comparable global change vulnerability assessments: The vulnerability scoping diagram. Glob. Environ. Chang. 2007, 17, 472–485. [Google Scholar] [CrossRef]
  56. Wang, B.; Ke, R.Y.; Yuan, X.C.; Wei, Y.M. China’s regional assessment of renewable energy vulnerability to climate change. Renew. Sustain. Energy Rev. 2014, 40, 185–195. [Google Scholar] [CrossRef]
  57. Armaș, I.; Gavriș, A. Social vulnerability assessment using spatial multi-criteria analysis (SEVI model) and the Social Vulnerability Index (SoVI model)—A case study for Bucharest, Romania. Nat. Hazards Earth Syst. Sci. 2013, 13, 1481–1499. [Google Scholar] [CrossRef] [Green Version]
  58. Saaty, T.L. How to make a decision: The analytic hierarchy process. Eur. J. Oper. Res. 1990, 48, 9–26. [Google Scholar] [CrossRef]
  59. Xu, H.; Wang, M.; Shi, T.; Guan, H.; Fang, C.; Lin, Z. Prediction of ecological effects of potential population and impervious surface increases using a remote sensing based ecological index (RSEI). Ecol. Indic. 2018, 93, 730–740. [Google Scholar] [CrossRef]
  60. Zhao, J.; Ji, G.; Tian, Y.; Chen, Y.; Wang, Z. Environmental vulnerability assessment for mainland China based on entropy method. Ecol. Indic. 2018, 91, 410–422. [Google Scholar] [CrossRef]
  61. Beroya-Eitner, M.A. Ecological vulnerability indicators. Ecol. Indic. 2016, 60, 329–334. [Google Scholar] [CrossRef]
  62. Favereau, M.; Robledo, L.F.; Bull, M.T. Analysis of risk assessment factors of individuals in volcanic hazards: Review of the last decade. J. Volcanol. Geotherm. Res. 2018, 357, 254–260. [Google Scholar] [CrossRef]
  63. Rego, I.E.; Pereira, S.M.; Morro, J.; Pacheco, M.P. Perceptions of seismic and volcanic risk and preparedness at São Miguel Island (Azores, Portugal). Int. J. Disaster Risk Reduct. 2018, 31, 498–503. [Google Scholar] [CrossRef]
  64. Isaia, R.; Ricci, T.; Davis, M.S.; Barberi, F.; Nave, R. Volcanic risk perception in the Vesuvius population. J. Volcanol. Geotherm. Res. 2008, 172, 244–258. [Google Scholar]
  65. Blaikie, P.; Cannon, T.; Davis, I.; Wisner, B. At Risk: Natural Hazards, People Vulnerability and Disasters, 1st ed.; Taylor & Francis: Abingdon, UK, 1994. [Google Scholar]
  66. Ablay, G.J.; Ernst, G.G.J.; Marti, J.; Sparks, R.S.J. The ∼2 ka subplinian eruption of Montaña Blanca, Tenerife. Bull. Volcanol. 1995, 57, 337–355. [Google Scholar]
  67. Wood, N.; Soulard, C. Variations in population exposure and sensitivity to lahar hazards from Mount Rainier, Washington. J. Volcanol. Geotherm. Res. 2009, 188, 367–378. [Google Scholar] [CrossRef]
  68. Blong, R. Volcanic Hazards: A Sourcebook on the Effects of Eruptions; Academic Press: Sydney, Australia; Orlando, FL, USA, 1984. [Google Scholar]
  69. Clarke, A.B.; Voight, B. Pyroclastic current dynamic pressure from aerodynamics of tree or pole blow-down. J. Volcanol. Geotherm. Res. 2000, 100, 395–412. [Google Scholar] [CrossRef] [Green Version]
  70. Wilson, G.; Wilson, T.M.; Deligne, N.I.; Cole, J.W. Volcanic hazard impacts to critical infrastructure: A review. J. Volcanol. Geotherm. Res. 2014, 286, 148–182. [Google Scholar] [CrossRef] [Green Version]
  71. Baxter, P.J.; Picquout, A.; Lavigne, F.; Spence, R.; Jenkins, S.; Surono; Komorowski, J.C. The Merapi 2010 eruption: An interdisciplinary impact assessment methodology for studying pyroclastic density current dynamics. J. Volcanol. Geotherm. Res. 2013, 261, 316–329. [Google Scholar]
  72. Martin, R.S.; Watt, S.F.L.; Pyle, D.M.; Mather, T.A.; Matthews, N.E.; Georg, R.B.; Day, J.A.; Fairhead, T.; Witt, M.L.I.; Quayle, B.M. Environmental effects of ashfall in Argentina from the 2008 Chaitén volcanic eruption. J. Volcanol. Geotherm. Res. 2009, 184, 462–472. [Google Scholar] [CrossRef]
  73. Wilson, T.M.; Cole, J.W.; Stewart, C.; Cronin, S.J.; Johnston, D.M. Ash storms: Impacts of wind-remobilised volcanic ash on rural communities and agriculture following the 1991 Hudson eruption, southern Patagonia, Chile. Bull. Volcanol. 2011, 73, 223–239. [Google Scholar] [CrossRef]
Figure 1. Location of the Canary Islands (a) and the island of Tenerife, which consists of 31 municipalities (Caldera rim, south, NE-SE and NE-SW rifts, the reader is referred to Carracedo et al. [23]). (b) Full names of Tenerife’s municipalities are given in Table 1.
Ijgi 09 00273 g001
Figure 2. Volcanic landscape on Tenerife. (a) Historical lava flows within the Las Cañadas caldera. (b) Lava in proximity to Garachico, a northwestern Tenerife municipality once destroyed by lava flows but later re-built on them. (c) Historical PDCs. (d) Historical tephra. Photos were taken by Prof. Dr. Matthieu Kervyn in Dr. Long Li’s fieldwork on Tenerife in November 2013 [27].
Ijgi 09 00273 g002
Figure 3. The distribution of buildings on Tenerife, extracted by random forest classification.
Ijgi 09 00273 g003
Figure 4. The distribution of vent locations (a) and vent alignments (b) on Tenerife, extracted from Marti and Felpeto [22] for hazard simulations.
Ijgi 09 00273 g004
Figure 5. The vent susceptibility maps indicating the probabilities of future vent locations. (a) Susceptibility for Scenario 1. (b) Susceptibility for Scenario 2.
Ijgi 09 00273 g005
Figure 6. (a) The distribution of simulated lava flows in Scenario 1. (b) The percentage of lava covering each municipality’s buildings in Scenario 1. (c) The distribution of simulated lava flows in Scenario 2. (d) The percentage of lava covering each municipality’s buildings in Scenario 2. For the reader’s convenience, the number labels (see Table 1) are always placed after the place names in the text.
Ijgi 09 00273 g006
Figure 7. (a) The distribution of a simulated PDC in Scenario 1. (b) The percentage of buildings affected by PDC in municipalities.
Ijgi 09 00273 g007
Figure 8. The distribution of simulated ash fall in Scenario 1. (a) First season; (b) second season; (c) third season; (d) fourth season.
Ijgi 09 00273 g008
Figure 9. The distribution of simulated ash fall in Scenario 2. (a) First season; (b) second season; (c) third season; (d) fourth season.
Ijgi 09 00273 g009
Figure 10. (a) The overall distribution of simulated ash fall in Scenario 1. (b) The overall distribution of simulated ash fall in Scenario 2.
Ijgi 09 00273 g010
Figure 11. Vulnerability assessment of Tenerife. (a) Exposure grading map; (b) sensitivity grading map; (c) capability grading map.
Ijgi 09 00273 g011
Figure 12. Vulnerability grading of Tenerife.
Ijgi 09 00273 g012
Figure 13. Volcanic risk grading map of Tenerife in Scenario 1. (a) Risk from lava flows. (b) Risk from PDC. (c) Risk from ash fall.
Ijgi 09 00273 g013
Figure 14. Volcanic risk grading map of Tenerife in Scenario 2. (a) Risk from lava flows. (b) Risk from ash fall.
Ijgi 09 00273 g014
Table 1. Municipalities of Tenerife. The number labels are used consistently to represent their respective municipalities in the figures of this article.
NumberFull NameNumberFull NameNumberFull Name
1Adeje11Garachico21Los Realejos
2Arafo12Granadilla de Abona22Los Silos
3Arico13Guia de Isora23Puerto de la Cruz
4Arona14Guimar24San Juan de la Rambla
5Buenavista del Norte15Icod de los Vinos25San Miguel de Abona
6Candelaria16La Guancha26Santa Cruz de Tenerife
7El Rosario17La Laguna27Santa Ursula
8El Sauzal18La Matanza de Acentejo28Santiago del Teide
9El Tanque19La Orotava29Tacoronte
10Fasnia20La Victoria de Acentejo30Tegueste
31Vilaflor
Table 2. Data used for social vulnerability assessment.
CategoryData and IndicatorsYear
Infrastructure● Number of vehicles
● Road length
● Number of groundwater sources
● Number of hospitals
● Underground cable length
2017
2017
2017
2017
2017
Socio-economic data● GDP
● Per capita income
● Revenue
● Agricultural planting area
2015
2015
2016
2017
Administration● Number of firefighters
● Number of polices
2012
2012
Population● Total population
● Disabled population
● Number of passengers
● Number of Spanish passengers
● Employed population
● Low education population
● Population under 14 years old and over 65 years old
2017
2016
2017
2017
2017
2017
2017
Notes: The socio-economic statistics were freely obtained from the Instituto Canario de Estadística (http://www.gobiernodecanaris.org).
Table 3. Main input parameters used for simulating two eruptive scenarios, i.e., a Sub-Plinian eruption at the central vents and a Strombolian eruption at the NE-SW and NW-SE basaltic rift. The reader is referred to Martí et al. [10] for the maximum length of lava flows in Scenario 1 and to Scaini et al. [12] for the other parameters as well as the explanation of all the parameters.
Scenario 1Scenario 2
Ash fall
Volume0.05 km30.001 km3
Column height8 km3 km
Mean grain size (φ) ±1σ−2 ± 1.50 ± 1.5
Horizontal atmospheric diffusion750 m2/s1500 m2/s
Lava flows
Maximum length30 km10 km
Height correction10 m3 m
Iterations5 × 1045 × 104
Pyroclastic density currents
Collapse equivalent height100 m
Heim coefficient0.212
Table 4. Wind direction and speed data used for the simulation of the two eruptive scenarios. Note that the wind direction is expressed by angle (0° represents the North wind, 90° the East wind, 180° the South wind, and 270° the West wind.).
Scenario 1Altitude
(m)
Wind Direction
(°)
Wind Speed
(m/s)
Scenario 2Altitude
(m)
Wind Direction
(°)
Wind Speed
(m/s)
First season5001186.6First season5001186.6
20001597.810001595.6
50002319.520001597.8
700025313.2300021011.05
10,00027422.62350019810.28
Second season500815.3Second season500815.3
20001968.310001623.9
50002569.720001968.3
700023212.230002338.3
10,00023217.235002288.8
Third season5001044.6Third season5001044.6
20001477.010001565.0
50002146.620001477.0
70002007.030001976.0
10,00021210.535001908.5
Fourth season500975.2Fourth season500975.2
20001417.710001434.9
50002007.820001417.7
700024210.3300016310.3
10,00023816.535001879.9
Table 5. Variables selected for assessing social vulnerability.
VariablesEffectReferences
Density of populationA high population density means that more of the population might be exposed to hazards.[1,11,12,57]
Total number of passengers[12]
Number of Spanish passengersSpeaking the local language helps to easily get the information about hazards and evacuation.[11,12]
Employed populationEmployment contributes to a faster recovery from disasters.[1,11,12,57]
Population under 14 years old and over 65 years oldYoung and old residents may require more assistance during a hazard event.[1,11,12,57]
Disabled populationDisability suggests a need for additional support and assistance in coping with hazard impacts.[1,12,57]
SlopeSteep slopes increase evacuation difficulty.[12]
Vehicles per capitaThese factors ensure rapid mobility in evacuation.[1,12]
Density of road network[11,12]
Road grade[11,12]
Number of groundwater sourcesGroundwater and underground cables help to maintain basic needs of residents during and after hazards.[11,12]
Underground cable length[11,12]
Number of hospitalsMedical services are needed during emergencies and in recovery.[1,12,35]
Number of firemenFiremen and police can rescue people in time and maintain social stability.[12]
Number of police[12]
RevenueIncome contributes to a faster recovery from disaster.[11,12]
Per capita income[1,11,12]
Agricultural planting areaAgriculture and economy suffer from hazards.[12,35]
GDP[1,11,12]
Table 6. Weight of each Tenerife social vulnerability assessment indicator (where WEntropy denotes the entropy-based weight, WAHP denotes the AHP-based weight, and W denotes the overall weight). While a positive symbol indicates that these indicators increase vulnerability, a minus symbol implies a negative effect on vulnerability.
GoalObjectives IndicatorsWEntropyWAHPW
Tenerife social vulnerability assessmentExposure Density of population (+)0.2260.5580.392
Total number of passengers (+)0.0900.0570.073
Agricultural planting area (+)0.4640.1220.293
GDP (+)0.2200.2630.242
SensitivityDemographic sensitivityLow education population (+)0.2420.0580.150
Employed population (−)0.0120.0920.052
Population under 14 years old and over 65 years old (+)0.2210.1500.186
Disabled population0.1420.3020.222
Number of Spanish passengers (−)0.0360.0310.034
Environmental sensitivitySlope (+)0.0560.1060.081
Social sensitivityVehicles per capita (−)0.0180.0200.019
Density of road network (−)0.0140.0210.018
Road grade (−)0.1320.0010.067
Number of groundwater sources (−)0.0110.0500.031
Hospital (−)0.0510.1090.080
Underground cable length (−)0.0640.0500.057
Capability Number of firemen (−)0.4420.1150.279
Number of police (−)0.1850.0760.131
Revenue (−)0.1860.5640.375
Per capita income (−)0.1870.2440.216

