Potential Water Harvesting Sites Identification Using Spatial Multi-Criteria Evaluation in Maysan Province, Iraq


Abstract
1. Introduction
2. Materials and Methods
2.1. Study Area
2.2. Dataset
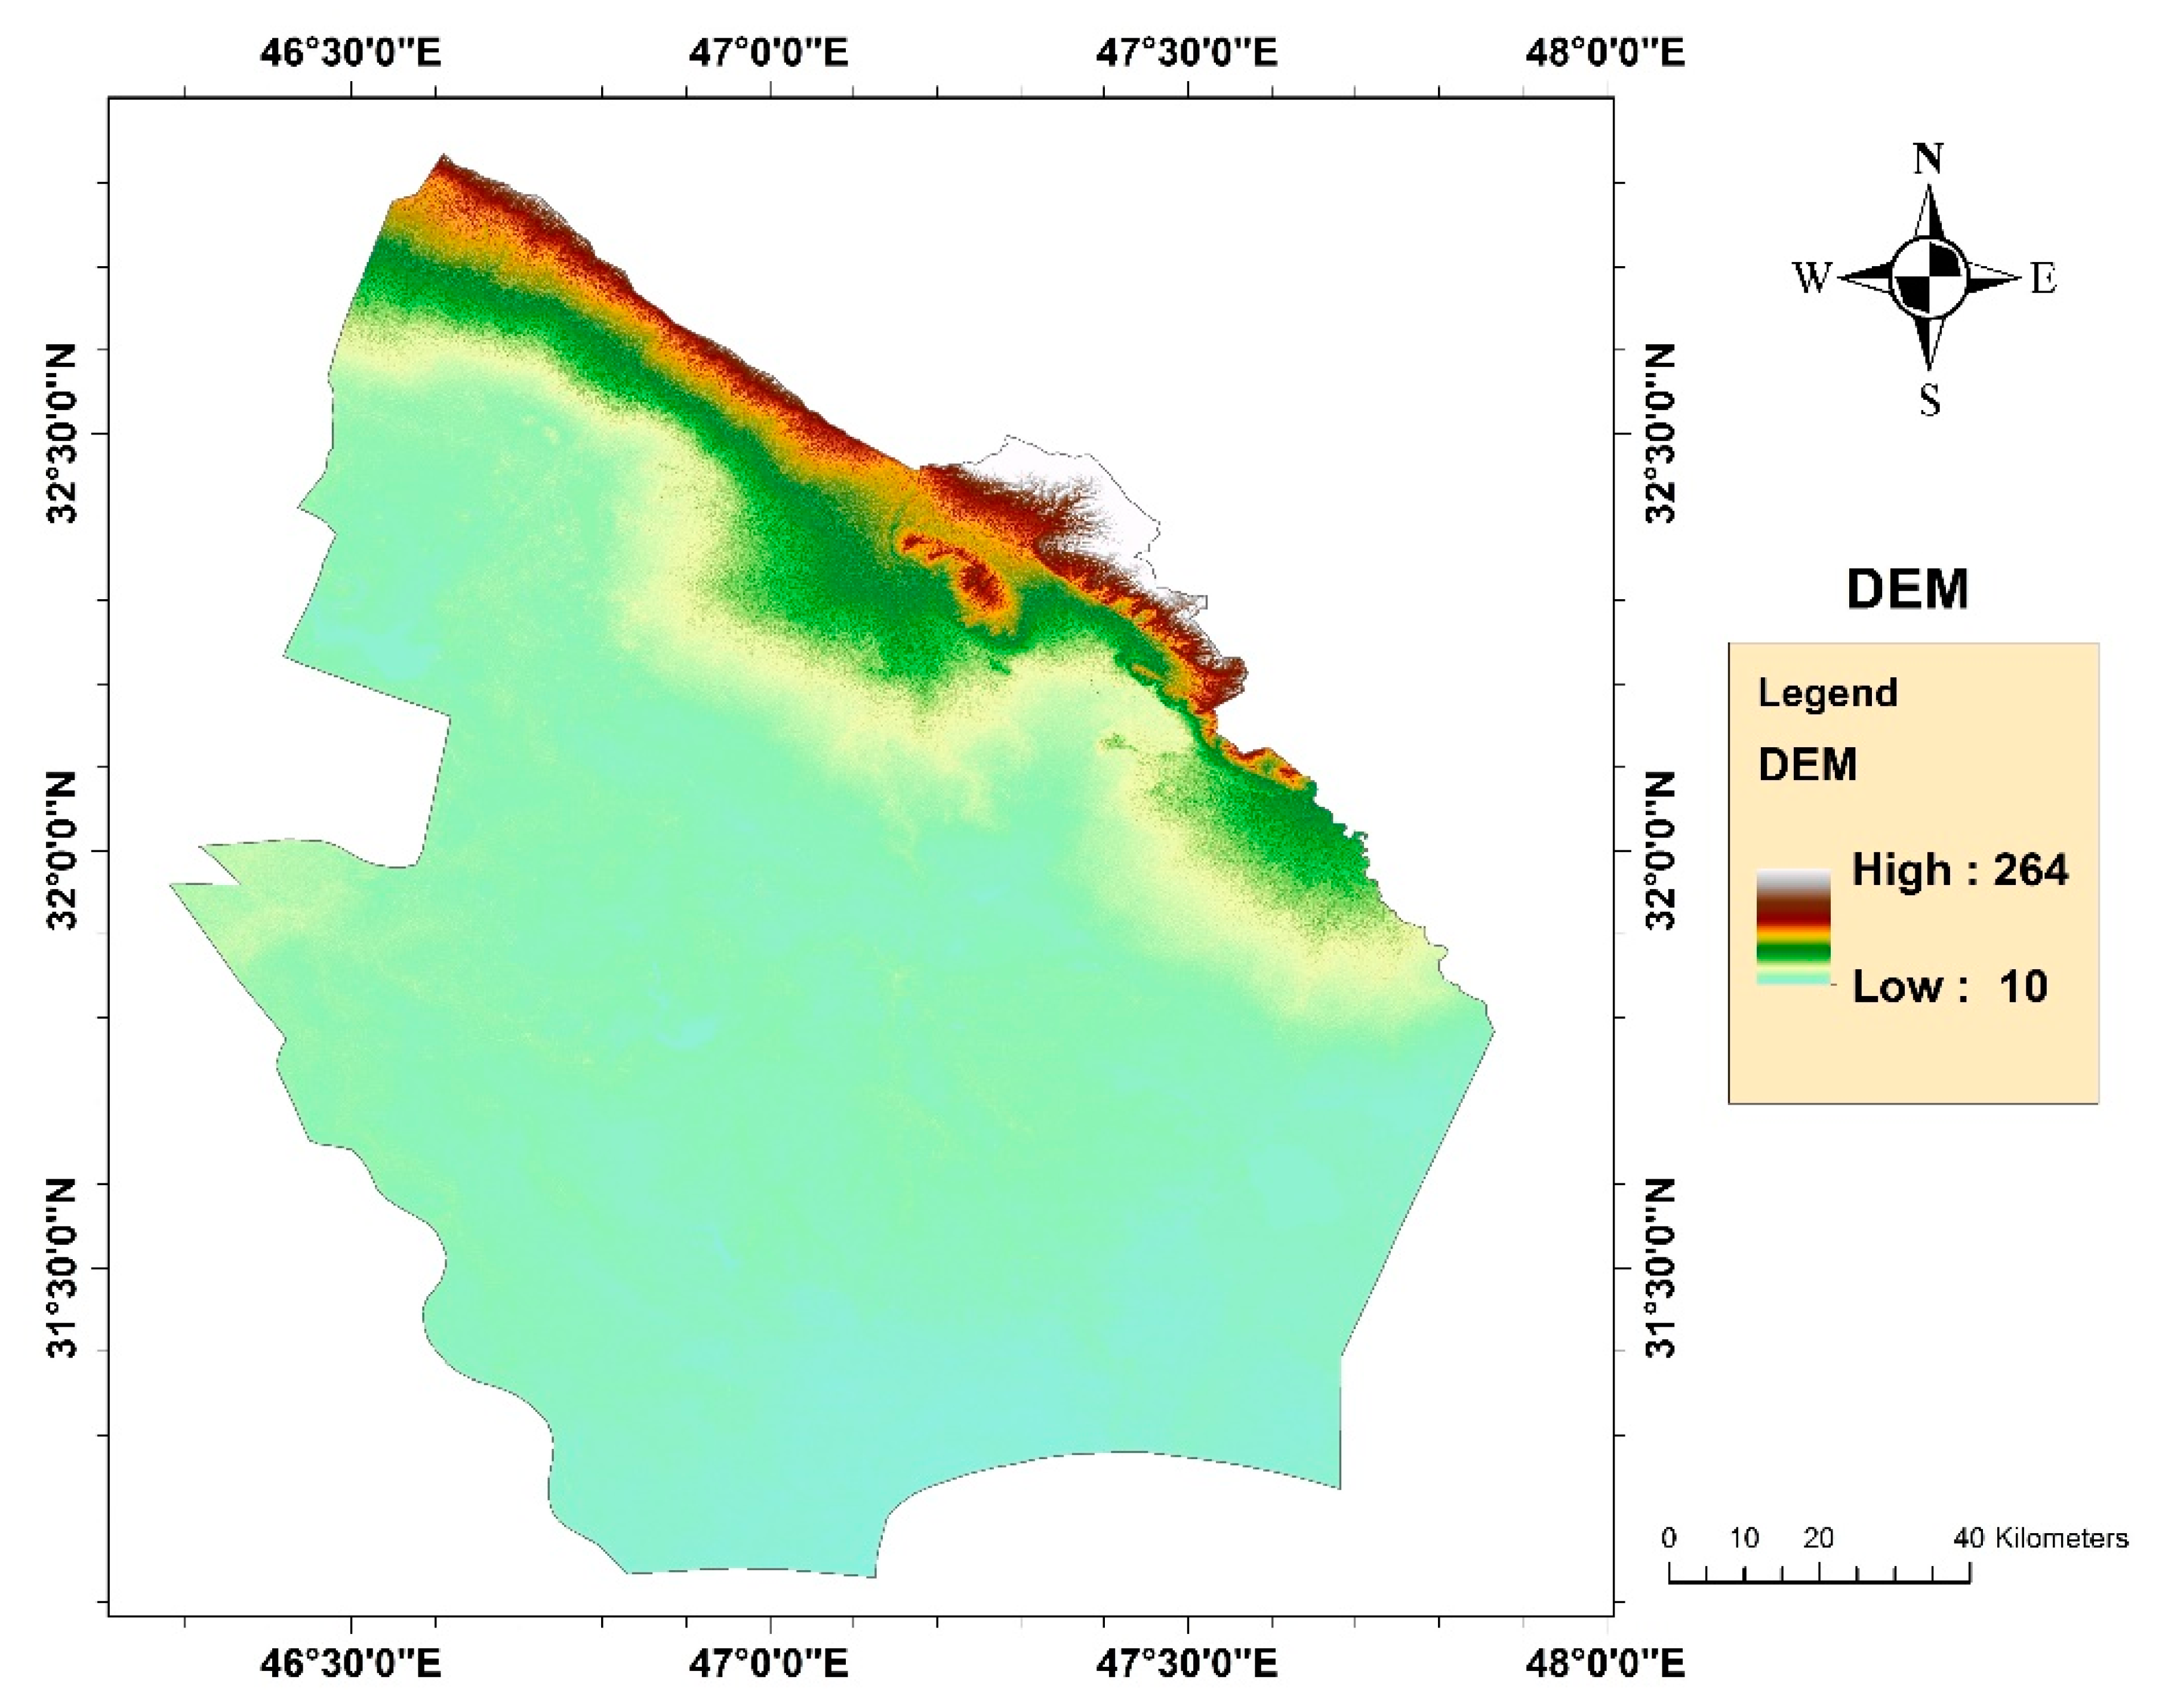
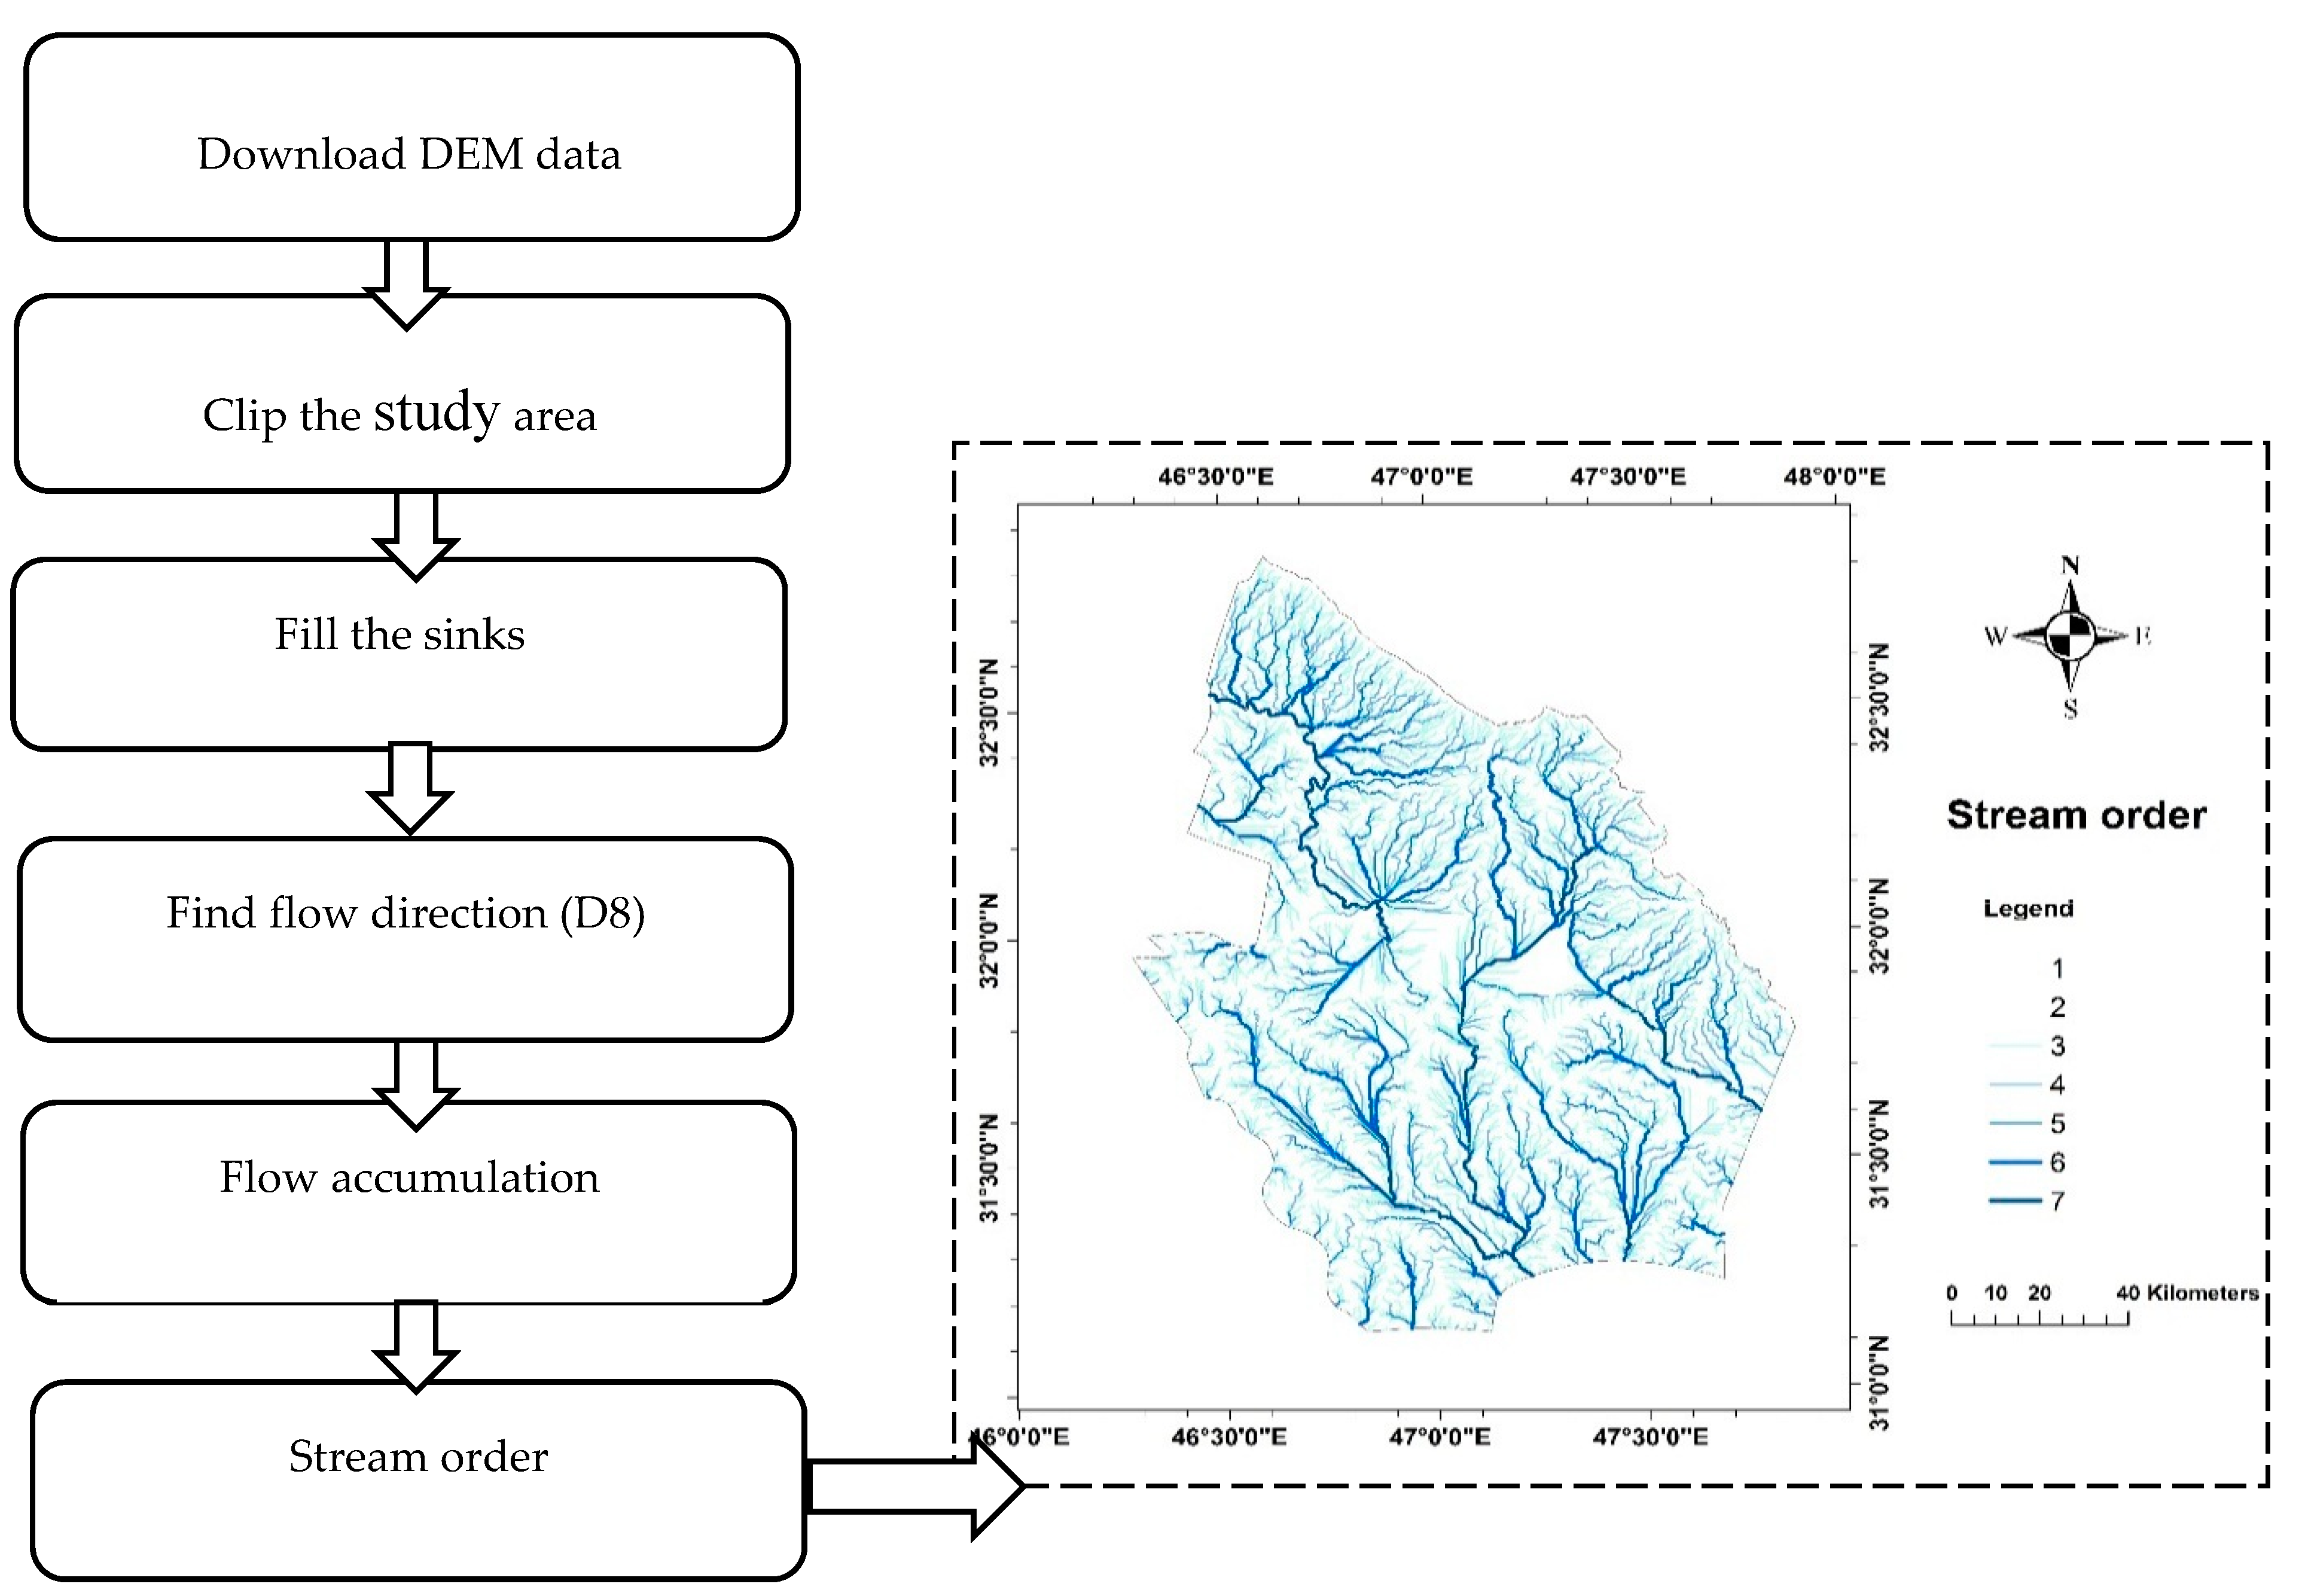
2.2.1. DEM
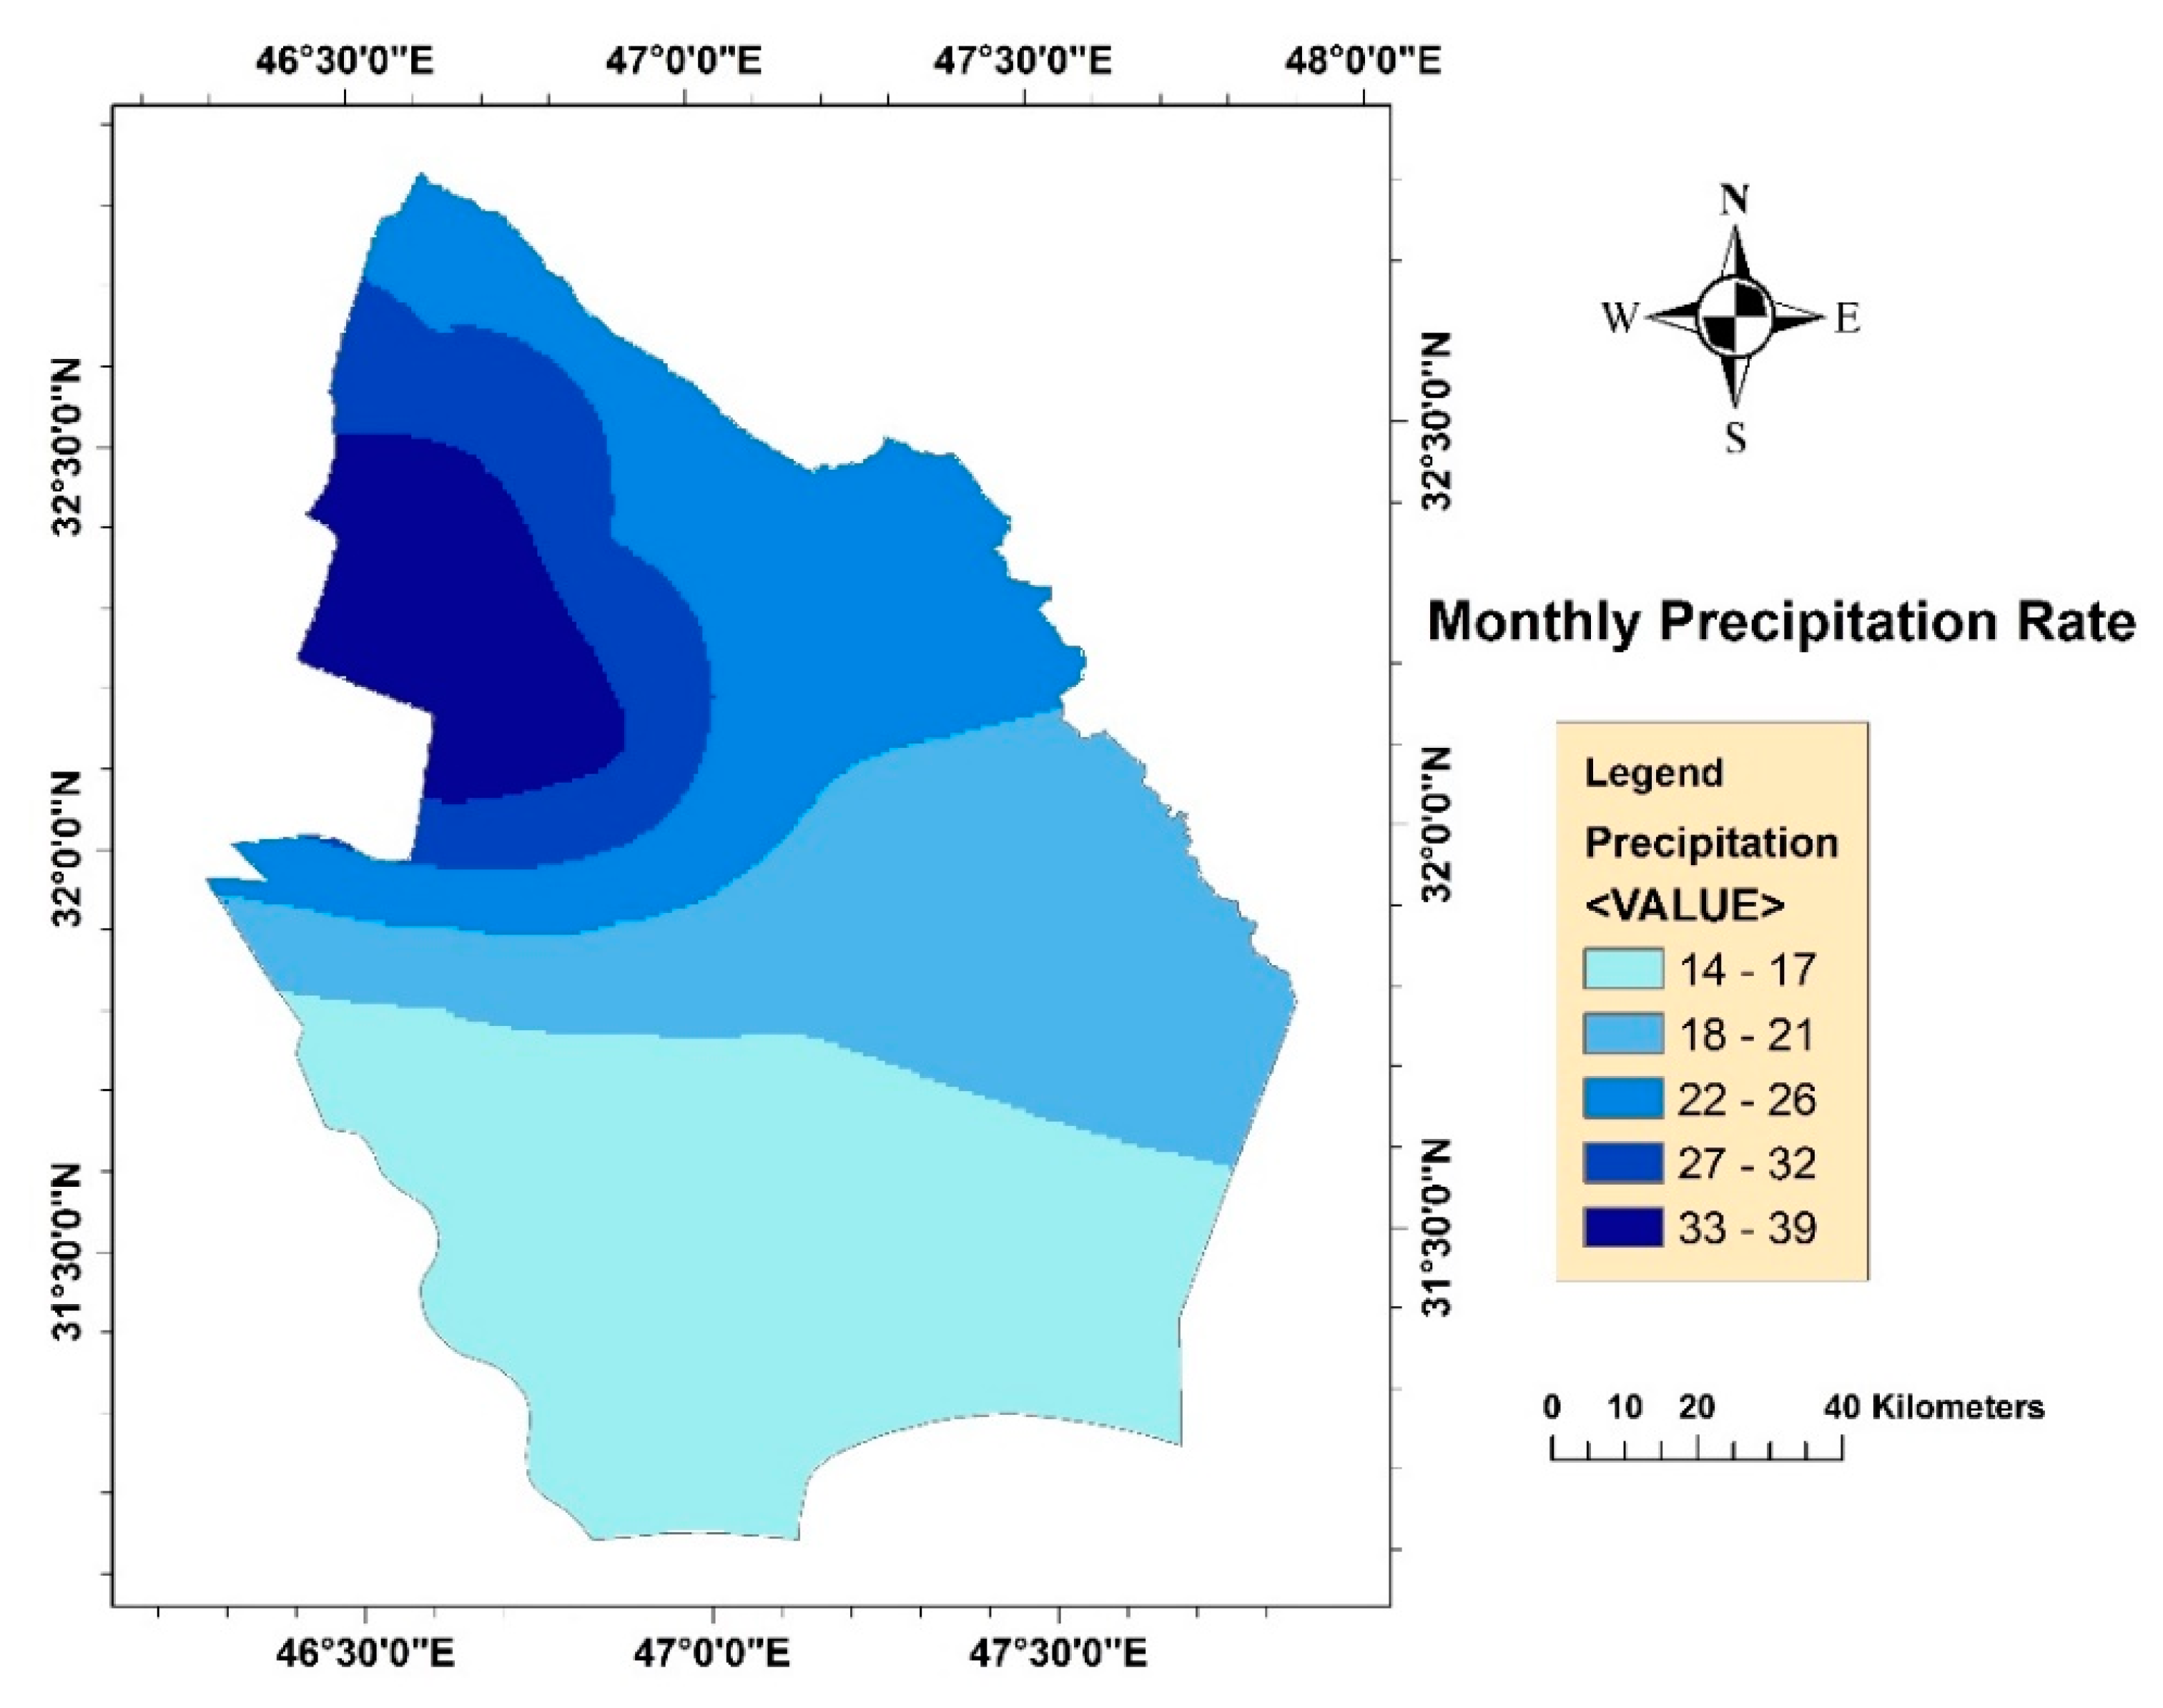
2.2.2. Satellite-Based Climate Data
2.2.3. Land Cover Data
2.3. Multi-Criteria Evaluation
2.4. Fuzzy Logic
2.4.1. Fuzzy Membership
2.4.2. Fuzzy Overlay
2.5. Criteria Identification
3. Results and Discussion
3.1. Criteria Standardization
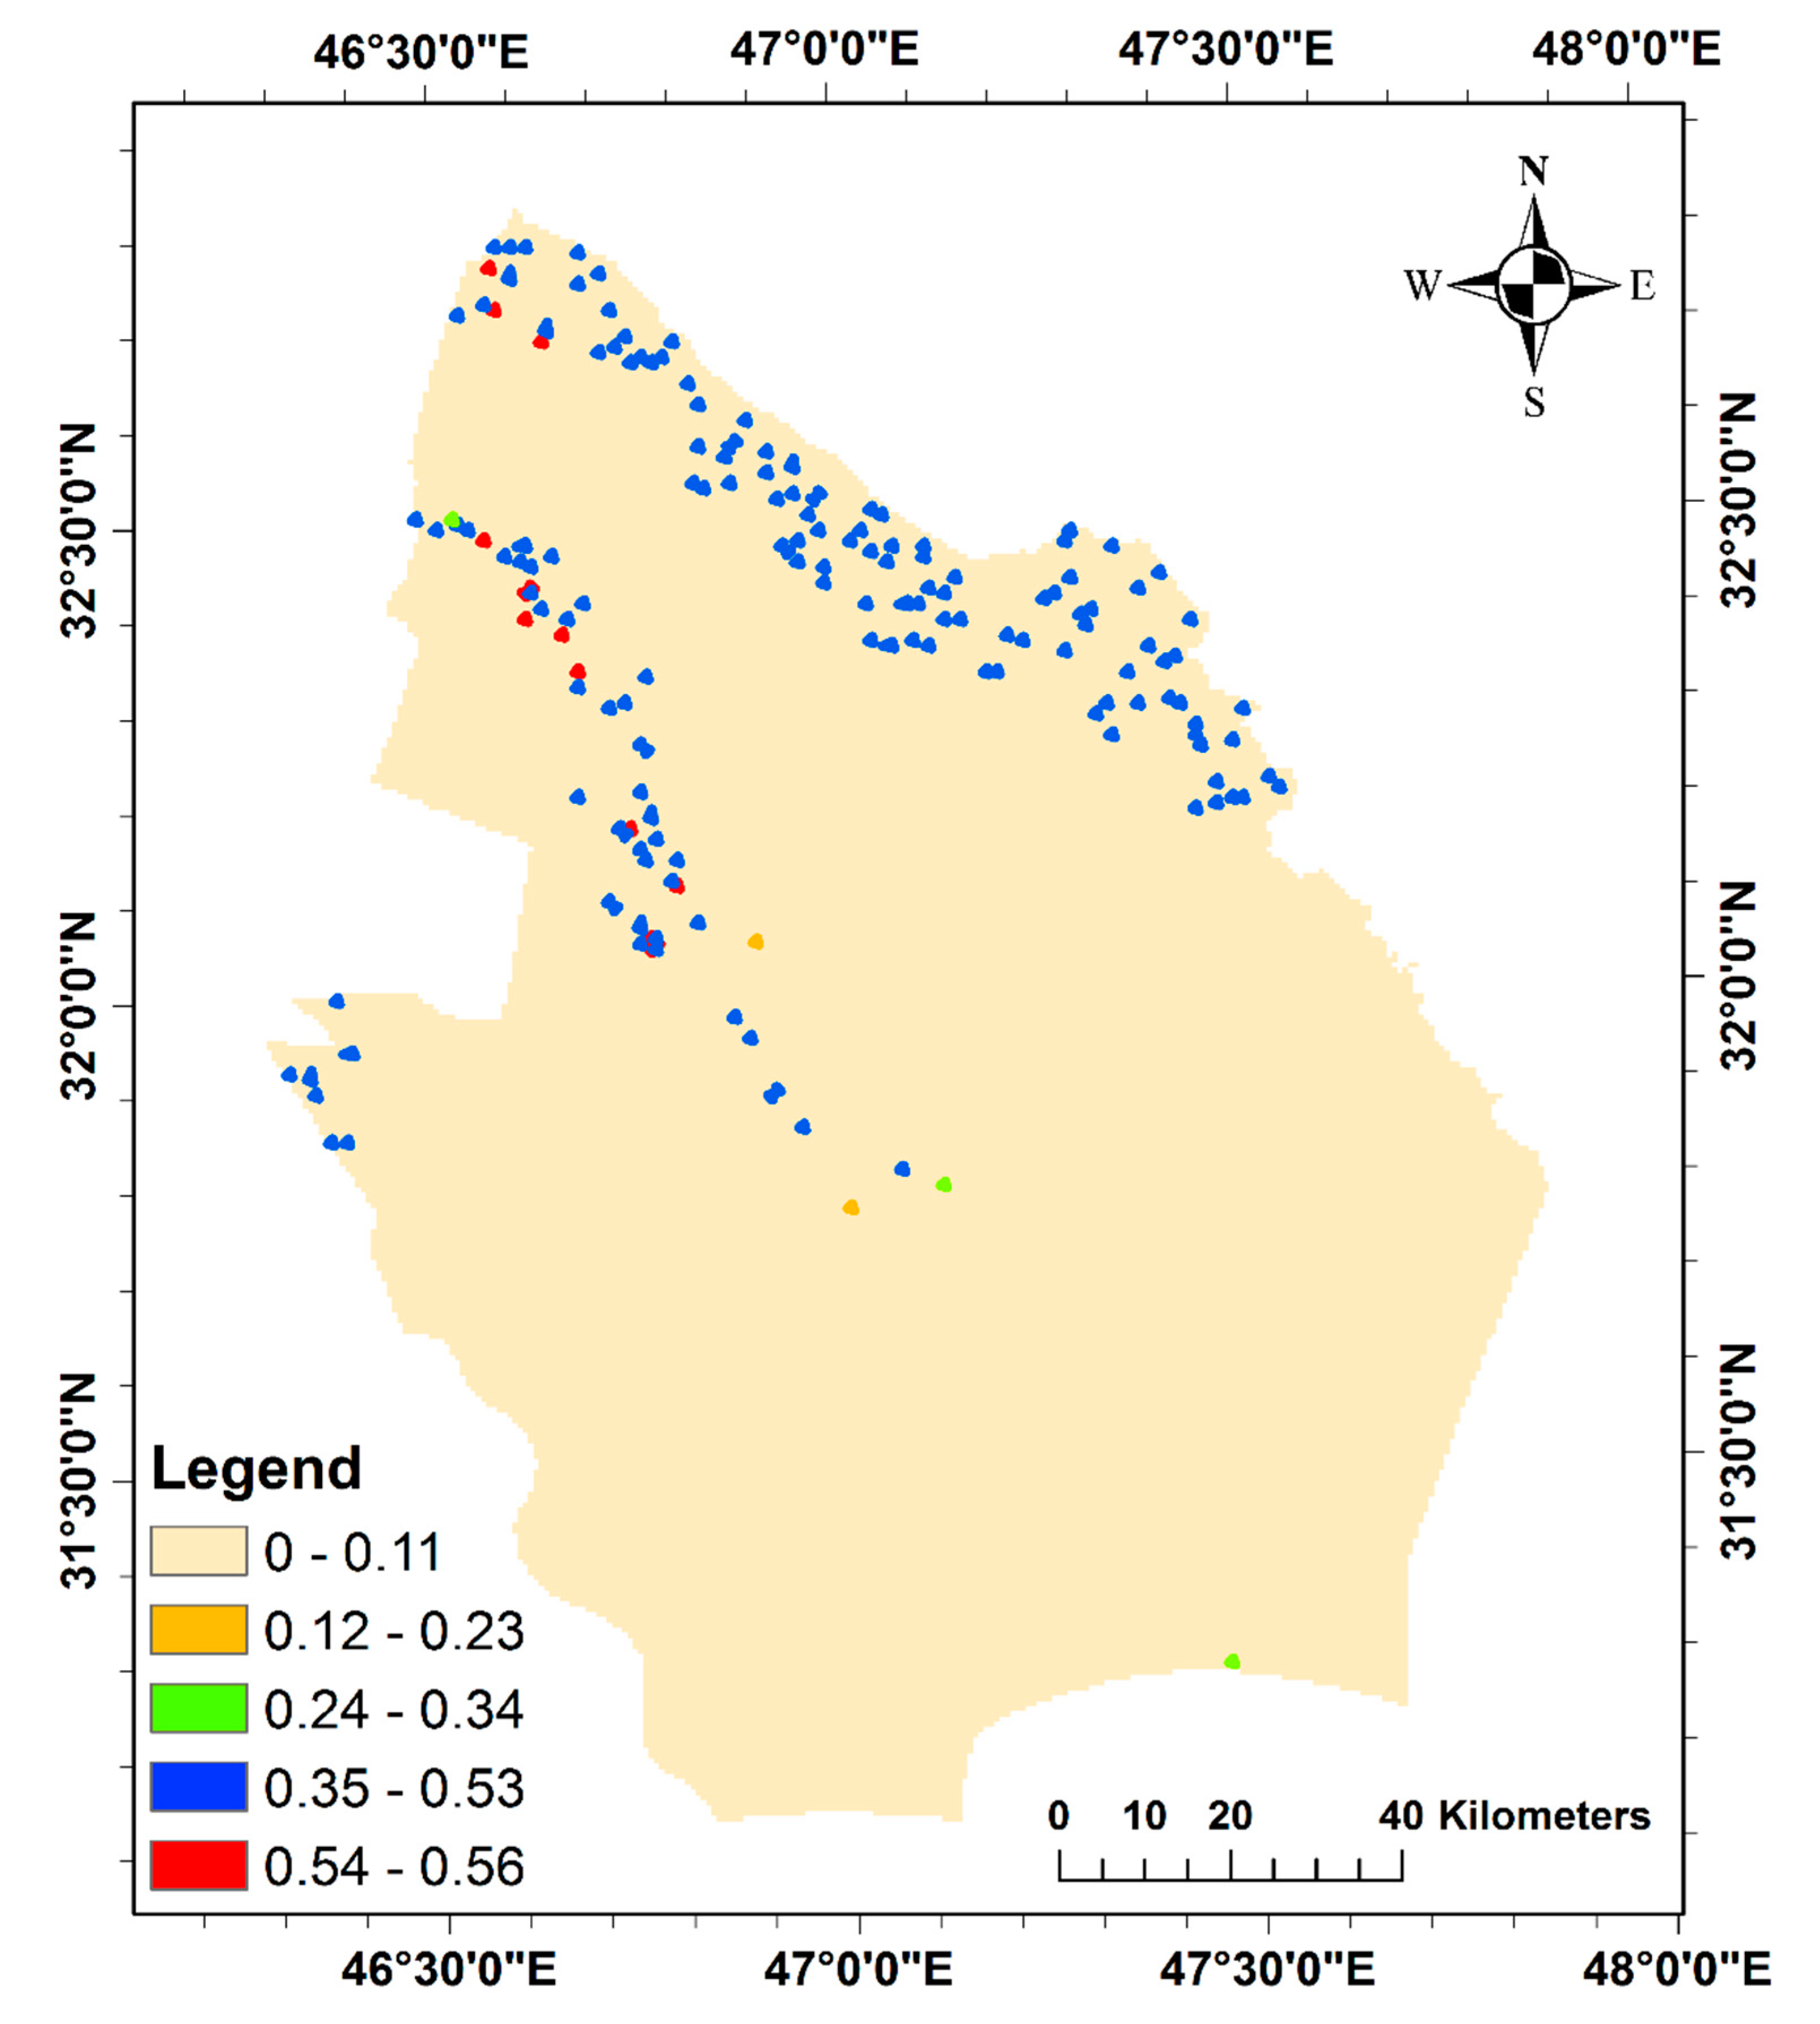
3.2. Sites Selection
4. Conclusions
Author Contributions
Funding
Conflicts of Interest
References
- Watkins, K. Human Development Report 2006—Beyond Scarcity: Power, Poverty and the Global Water Crisis; United Nations Development Programme (UNDP): New York, NY, USA, 2006. [Google Scholar]
- Qi, Q.; Marwa, J.; Mwamila, T.B.; Gwenzi, W.; Noubactep, C. Making Rainwater Harvesting a Key Solution for Water Management: The Universality of the Kilimanjaro Concept. Sustainability 2019, 11, 5606. [Google Scholar] [CrossRef]
- World Economic Forum. The Global Risks Report 2019, 14th ed.; World Economic Forum: Geneva, Switzerland, 2019. [Google Scholar]
- Kummu, M.; Ward, P.J.; De Moel, H.; Varis, O. Is physical water scarcity a new phenomenon? Global assessment of shortage over the last two millennia. Environ. Res. Lett. 2010, 5. [Google Scholar] [CrossRef]
- Liu, J.; Yang, H.; Gosling, S.N.; Kummu, M.; Flörke, M.; Pfister, S.; Hanasaki, N.; Wada, Y.; Zhang, X.; Zheng, C.; et al. Water scarcity assessments in the past, present, and future. Earth Future 2017, 5, 545–559. [Google Scholar] [CrossRef] [PubMed]
- Grey, D.; Sadoff, C.W. Sink or Swim? Water security for growth and development. Water Policy 2007, 9, 545–571. [Google Scholar] [CrossRef]
- Al-Muqdadi, S.; Omer, M.; Abo, R.; Naghshineh, A. Dispute over Water Resource Management—Iraq and Turkey. J. Environ. Prot. 2016, 7, 1096–1103. [Google Scholar] [CrossRef]
- Alwan, I.A.; Karim, H.H.; Aziz, N.A. Agro-Climatic Zones (ACZ) Using Climate Satellite Data in Iraq Republic. In IOP Conference Series: Materials Science and Engineering; IOP: London, UK, 2019. [Google Scholar]
- Al-Sabah, B.J.; Halboose, A.T.; Al-Gaffor, S.A.; Hassan, T.K.; Mohammed, A.J.; Sajjet, A.L. Seasonal alteration of some nutrient elements for Tigris River in Misan. J. Dhi Qar Sci. 2011, 2, 127–133. [Google Scholar]
- International Organization for Migration (IOM). Assessing Water Shortage-Induced Displacement in Missan, Muthanna, Thi-Qar and Basra; International Organization for Migration: Geneva, Switzerland, 2019. [Google Scholar]
- Emergency Response Coordination Centre (ECHO). Iraq—Flood (DG ECHO, WHO, IRCS, NOAA) (ECHO Daily Flash of 9 April 2019; Emergency Response Coordination Centre: Rome, Italy, 2019. [Google Scholar]
- Iraqi Red Crescent Society. Wasit and Maysan Are Most Affected by Torrents and the Iraqi Red Crescent Mobilizes its Relief Teams to Provide Shelter, Food and Relief Assistance; Iraqi Red Crescent Society: Baghdad, Iraq, 2019. [Google Scholar]
- Mekdaschi, S.R.; Liniger, H. Water Harvesting: Guidelines to Good Practice; Centre for Development and Environment (CDE): Rome, Italy, 2013. [Google Scholar]
- Rahman, A. Recent Advances in Modelling and Implementation of Rainwater Harvesting Systems towards Sustainable Development. Water 2017, 9, 959. [Google Scholar] [CrossRef]
- Al-Abadi, A.M.; Al-Shammaa, A.M.; Aljabbari, M.H. A GISbased DRASTIC model for assessing intrinsic groundwater vulnerability in northeastern Missan governorate, southern Iraq. Appl. Water. Sci. 2014, 7, 89–101. [Google Scholar] [CrossRef]
- Isioye, O.A.; Shebe, M.W.; Momoh, U.; Bako, C.N. A multi criteria decision support system (MDSS) for identifying rainwater harvesting site(s) in Zaria, Kaduna state, Nigeria. Int. J. Adv. Sci. Eng. Technol. Res. 2012, 1, 53–57. [Google Scholar]
- Freni, G.; Liuzzo, L. Effectiveness of Rainwater Harvesting Systems for Flood Reduction in Residential Urban Areas. Water 2019, 11, 1389. [Google Scholar] [CrossRef]
- Shanableh, A.; Al-Ruzouq, R.; Yilmaz, A.G.; Siddique, M.; Merabtene, T.; Imteaz, M.A. Effects of Land Cover Change on Urban Floods and Rainwater Harvesting: A Case Study in Sharjah, UAE. Water 2018, 10, 631. [Google Scholar] [CrossRef]
- Gupta, K.K.; Deelstra, J.; Sharma, K.D. Estimation of Water Harvesting Potential for a Semiarid Area Using GIS and Remote Sensing; IAHS: Wallingford, UK, 1997. [Google Scholar]
- Jabr, W.M.; El-Awar, F.A. GIS & analytic hierarchy process for siting water harvesting reservoirs, Beirut, Lebanon. J. Environ. Eng. 2005, 122, 515–523. [Google Scholar]
- Mbilinyi, B.; Tumbo, S.; Mahoo, H.; Mkiramwinyi, F. GIS-based decision support system for identification potential sites for rainwater harvesting. Phys. Chem. Earth 2007, 32, 1074–1081. [Google Scholar] [CrossRef]
- Sayl, K.N.; Muhammad, N.S.; El-Shafie, A. Robust approach for optimal positioning and ranking potential rainwater harvesting structure (RWH): A case study of Iraq. Arab. J. Geosci. 2017, 10, 413. [Google Scholar] [CrossRef]
- Al-Abadi, A.M.; Shahid, S.; Ghalib, H.B.; Handhal, A.M. A GIS-Based Integrated Fuzzy Logic and Analytic Hierarchy Process Model for Assessing Water-Harvesting Zones in Northeastern Maysan Governorate, Iraq. Arab. J. Sci. Eng. 2017, 42, 2487–2499. [Google Scholar] [CrossRef]
- Bakir, M.; Xingnan, Z. GIS and Remote Sensing Applications for Rainwater Harvesting in The Syrian Desert (Al-Badia). In Proceedings of the Twelfth International Water Technology Conference, IWTC12, Alexandria, Egypt, 27–30 March 2008. [Google Scholar]
- Rahi, K.A.; Al-Madhhachi, A.-S.T.; Al-Hussaini, S.N. Assessment of Surface Water Resources of Eastern Iraq. Hydrology 2019, 6, 57. [Google Scholar] [CrossRef]
- Alwan, I.A.; Kareem, I.R.; Mohamed, M.J. Modeling Water Harvesting System Using Soil Water Assessment Tool (SWAT)(Case Study in Iraq). In Proceedings of the 2nd International Conference of Buildings, Construction and Environmental Engineering (BCEE2-2015), Beirut, Lebanon, 17–18 October 2015; p. 51. [Google Scholar]
- Khayyun, T.S.; Alwan, I.A.; Hayder, A.M. Hydrological model for Hemren dam reservoir catchment area at the middle River Diyala reach in Iraq using ArcSWAT model. Appl. Water Sci. 2019, 9, 133. [Google Scholar] [CrossRef]
- Xu, Y.; Sun, J.; Zhang, J.; Xu, Y.; Zhang, M.; Liao, X. Combining AHP with GIS in synthetic evaluation of environmental suitability for living in China’s 35 major cities. Int. J. Geogr. Inf. Sci. 2012, 26, 1603–1623. [Google Scholar] [CrossRef]
- Malczewski, J. GIS-based multi-criteria decision analysis: A survey of the literature. Int. J. Geogr. Inf. Sci. 2006, 20, 703–726. [Google Scholar] [CrossRef]
- Malczewski, J. GIS-based land-use suitability analysis: A critical overview. Prog. Plan. 2004, 62, 3–65. [Google Scholar] [CrossRef]
- Srivastava, V.; Srivastava, H.B.; Lakhera, R.C. Fuzzy gamma based geomatic modelling for landslide hazard susceptibility in a part of Tons river valley, northwest Himalaya, India. Geomat. Nat. Hazards Risk 2010, 1, 225–242. [Google Scholar] [CrossRef]
- Chen, Y.; Khan, S.; Paydar, Z. To retire or expand? A Fuzzy GIS-based spatial multi-criteria evaluation framework for irrigated agriculture. Irrig. Drain. 2010, 59, 174–188. [Google Scholar] [CrossRef]
- Rikalovic, A.; Cosic, I.; Lazarevic, D. GIS Based Multi-Criteria Analysis for Industrial Site Selection. Procedia Eng. 2014, 69, 1054–1063. [Google Scholar] [CrossRef]
- Adham, A.; Riksen, M.; Ouessar, M.; Ritsema, C. Identification of suitable sites for rainwater harvesting structures in arid and semi-arid regions: A review. Int. Soil Water Conserv. Res. 2016, 4, 108–120. [Google Scholar] [CrossRef]
- Aziz, N.A.; Hasan, R.H.; Abdulrazzaq, Z.T. Optimum Site Selection for Groundwater wells using Integration between GIS and Hydrogeophysical Data. Eng. Technol. J. 2018, 36, 596–602. [Google Scholar] [CrossRef]
- Alwan, I.A.; Karim, H.H.; Aziz, N.A. Groundwater Aquifer Suitability for Irrigation Purposes Using Multi-Criteria Decision Approach in Salah Al-Din Governorate/Iraq. AgriEngineering 2019, 1, 303–323. [Google Scholar] [CrossRef]
- Agbasi, O.E.; Aziz, N.A.; Abdulrazzaq, Z.T.; Etuk, S.E. Integrated Geophysical Data and GIS Technique to Forecast the Potential Groundwater Locations in Part of South Eastern Nigeria. Iraqi J. Sci. 2019, 60, 1013–1022. [Google Scholar]
- Al-Abadi, A. Hydrological and Hydrogeological Analysis of Northeaster Missan Governorate, South of Iraq Using Geographic Information System. Ph.D. Thesis, Baghdad University, Baghdad, Iraq, 2012. [Google Scholar]
- Jassim, S.Z.; Goff, J.C. Geology of Iraq; Dolin, Prague and Moravian Museum: Brno, Czech Republic, 2006. [Google Scholar]
- Bellen, R.C.; Dunnington, H.V.; Wetzel, R.; Morton, D. Lexique Stratigraphique International, Asie. Iraq. Int. Geol. Conger. Comm. Stratigr. 1959, 3, 333. [Google Scholar]
- NASA. The Shuttle Radar Topography Mission (SRTM) Collection User Guide. 2015. Available online: https://lpdaac.usgs.gov/documents/179/SRTM_User_Guide_V3.pdf (accessed on 29 February 2020).
- Strahler, A.N. Hypsometric (area-altitude) analysis of erosional topology. Geolsoc. Am. Bull. 1952, 63, 1117–1142. [Google Scholar] [CrossRef]
- Alwan, I.A.; Ziboon, A.; Khalaf, A.G. Comparison of Nine Meteorological Drought Indices Over Middle Euphrates Region During Period from 1988 To 2017. Int. J. Eng. Technol. 2018, 7, 602–607. [Google Scholar] [CrossRef]
- Abdulrazzaq, Z.T.; Hasan, R.H.; Aziz, N.A. Integrated TRMM data and Standardized Precipitation Index to Monitor the Meteorological Drought. Civ. Eng. J. 2019, 5, 1590–1598. [Google Scholar] [CrossRef]
- Beaudoing, H.; Rodell, M.; NASA/GSFC/HSL. GLDAS Noah Land Surface Model L4 3 Hourly 0.25 × 0.25 Degree V2.1; Goddard Earth Sciences Data and Information Services Center (GES DISC): Greenbelt, MD, USA, 2016. [Google Scholar]
- Rodell, M.; Houser, P.R.; Jambor, U.E.A.; Gottschalck, J.; Mitchell, K.; Meng, C.J.; Arsenault, K.; Cosgrove, B.; Radakovich, J.; Bosilovich, M.; et al. The Global Land Data Assimilation System. Bull. Am. Meteorol. Soc. 2004, 85, 381–394. [Google Scholar] [CrossRef]
- Carlson, T.N.; Ripley, D.A. On the relation between NDVI, fractional vegetation cover, and leaf area index. Remote Sens. Environ. 1997, 62, 241–252. [Google Scholar] [CrossRef]
- Albarakat, R.; Lakshmi, V. Comparison of Normalized Difference Vegetation Index Derived from Landsat, MODIS, and AVHRR for the Mesopotamian Marshes Between 2002 and 2018. Remote Sens. 2019, 11, 1245. [Google Scholar] [CrossRef]
- Eastman, J.R.; Jiang, H.; Toledano, J. Multi-Criteria and Multi-Objective Decision Making for Land Allocation Using GIS. In Multicriteria Analysis for Land-Use Management; Springer: Berlin/Heidelberg, Germany, 1998; pp. 227–251. [Google Scholar]
- Voogd, H. Multi-Criteria Evaluation for Urban and Regional Planning; Pion: London, UK, 1983. [Google Scholar]
- Zadeh, L.A. Fuzzy sets. Inf. Control 1965, 8, 338. [Google Scholar] [CrossRef]
- Shahabi, H.; Hashim, M.; Ahmad, B.B. Remote sensing and GIS-based landslide susceptibility mapping using frequency ratio, logistic regression, and Fuzzy logic methods at the central Zab basin, Iran. Environ. Earth Sci. 2015, 8647, 8647. [Google Scholar] [CrossRef]
- Critchley, W.; Siegert, K.; Chapman, C.; Finkel, M. Water Harvesting, a Manual Guide for the Design and Construction of Water Harvesting Schemes for Plant Production; Food and Agriculture Organization of The United Nations: Rome, Italy, 1991; Available online: www.fao.org/docrep/u3160e/u3160e07.htm (accessed on 18 March 2020).
- Sayl, K.N.; Muhammad, N.S.; El-Shafie, A. Identification of Potential Sites for Runoff Water Harvesting; Thomas Telford Ltd.: London, UK, 2019; Volume 172, pp. 135–148. [Google Scholar]
- Al-Ardeeni, M.A. Selecting Potential Water Harvest Sites Using GIS and Remote Sensing In Al-Tharthar Valley, West Nineveh, Iraq. Tikrit J. Pure Sci. 2018, 20, 142–150. [Google Scholar]
- Al-Adamat, R. GIS as a decision support system for siting water harvesting ponds in the basalt aquifer/NE Jordan. J. Environ. Assess. Policy Manag. 2008, 10, 189–206. [Google Scholar] [CrossRef]
- Oweis, T.Y.; Prinz, D.; Hachum, A.Y. Rainwater Harvesting for Agriculture in the Dry Areas; CRC Press: Boca Raton, FL, USA, 2012. [Google Scholar]
- Tauer, W.; Humborg, G. Runoff Irrigation in the Sahel Zone: Remote Sensing and Geographic Information Systems for Determining Potential Sites; Margraf: Weikersheim, Germany, 1992. [Google Scholar]
- Effat, H.A.; Hassan, O.A. Designing and evaluation of three alternatives highway routes using the analytical hierarchy process and the least-cost path analysis, application in Sinai Peninsula, Egypt. Egypt. J. Remot. Sens. Space Sci. 2013, 16, 141–151. [Google Scholar] [CrossRef]


| No. | Criteria | Source | Criteria | FLM |
|---|---|---|---|---|
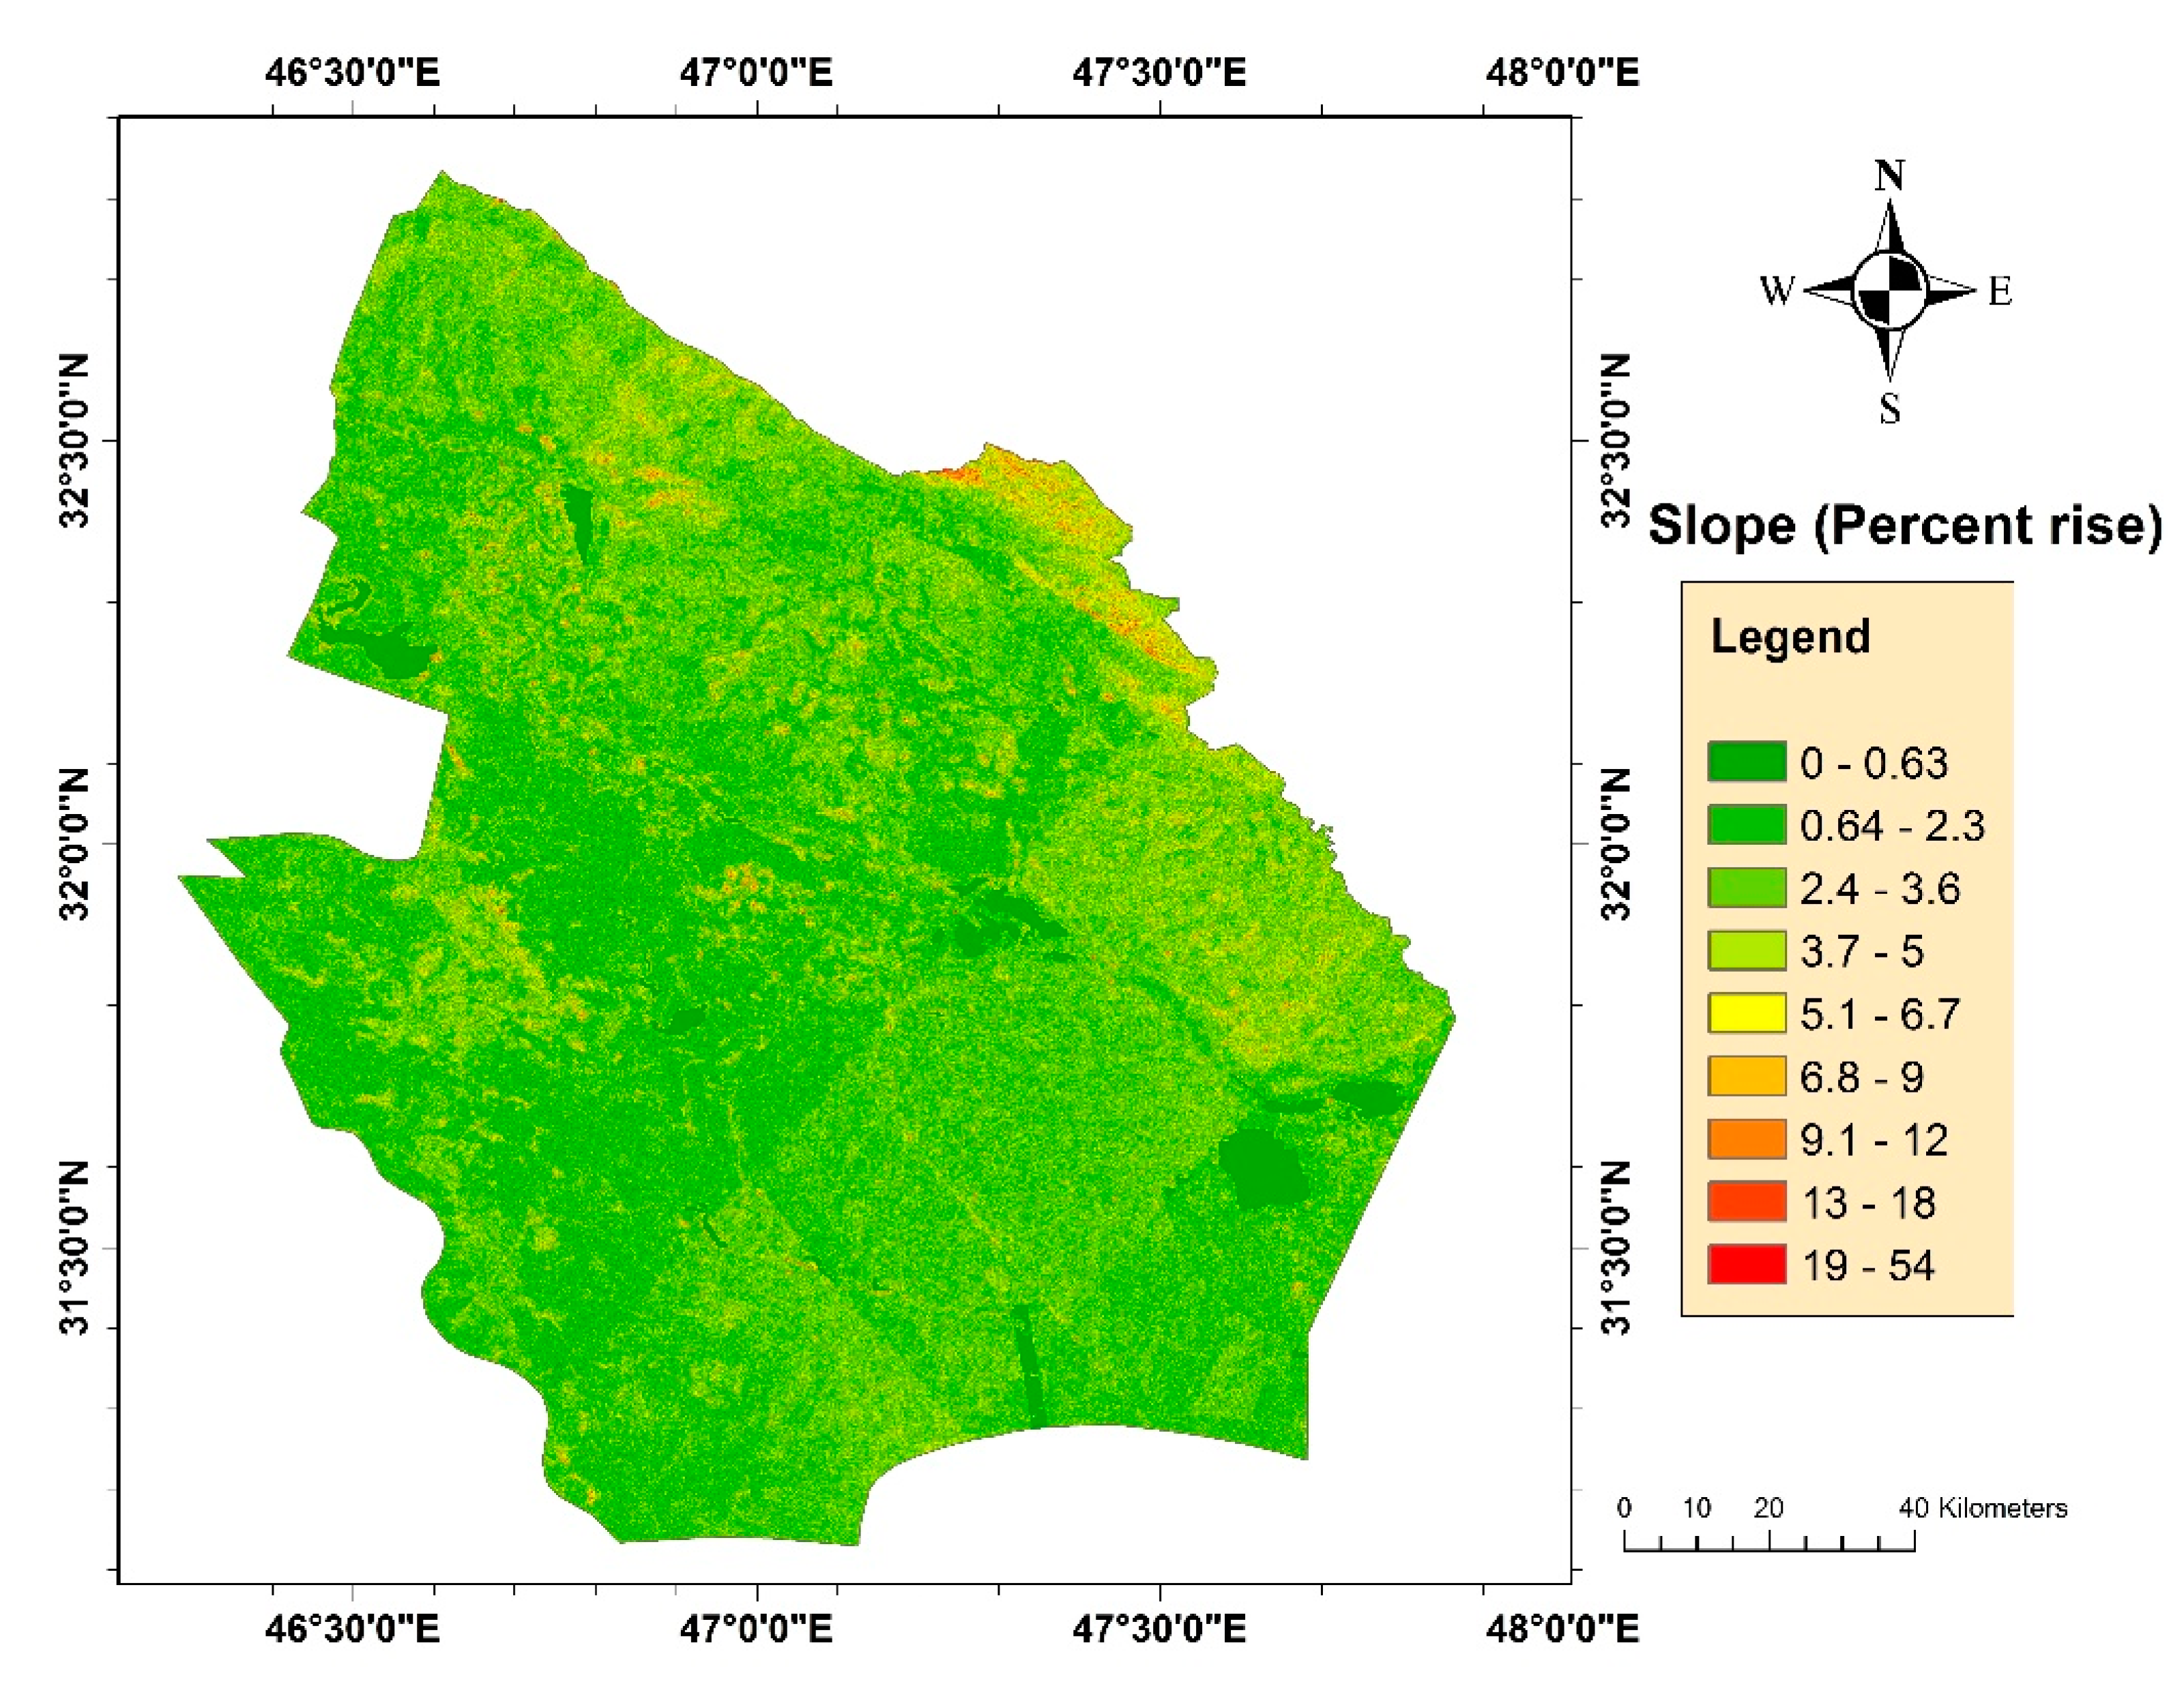
| 1 | Slope | DEM | ˂5% | Min = 5% Max = 0% |
| 2 | Stream order | DEM | >3rd Order | Min = 3rd Max = 7th |
| 3 | Precipitation | TRMM | Maximize | Min = 14 Max = 39 |
| 4 | Evaporation | GLDAS | Minimize | Min = 388 Max = 279 |
| 5 | NDVI | Landsat 8 | > 0 | Min = 0 Max = 0.6 |
| 6 | Soil | FAO | Minimize | Min = 2 Max = 1 |
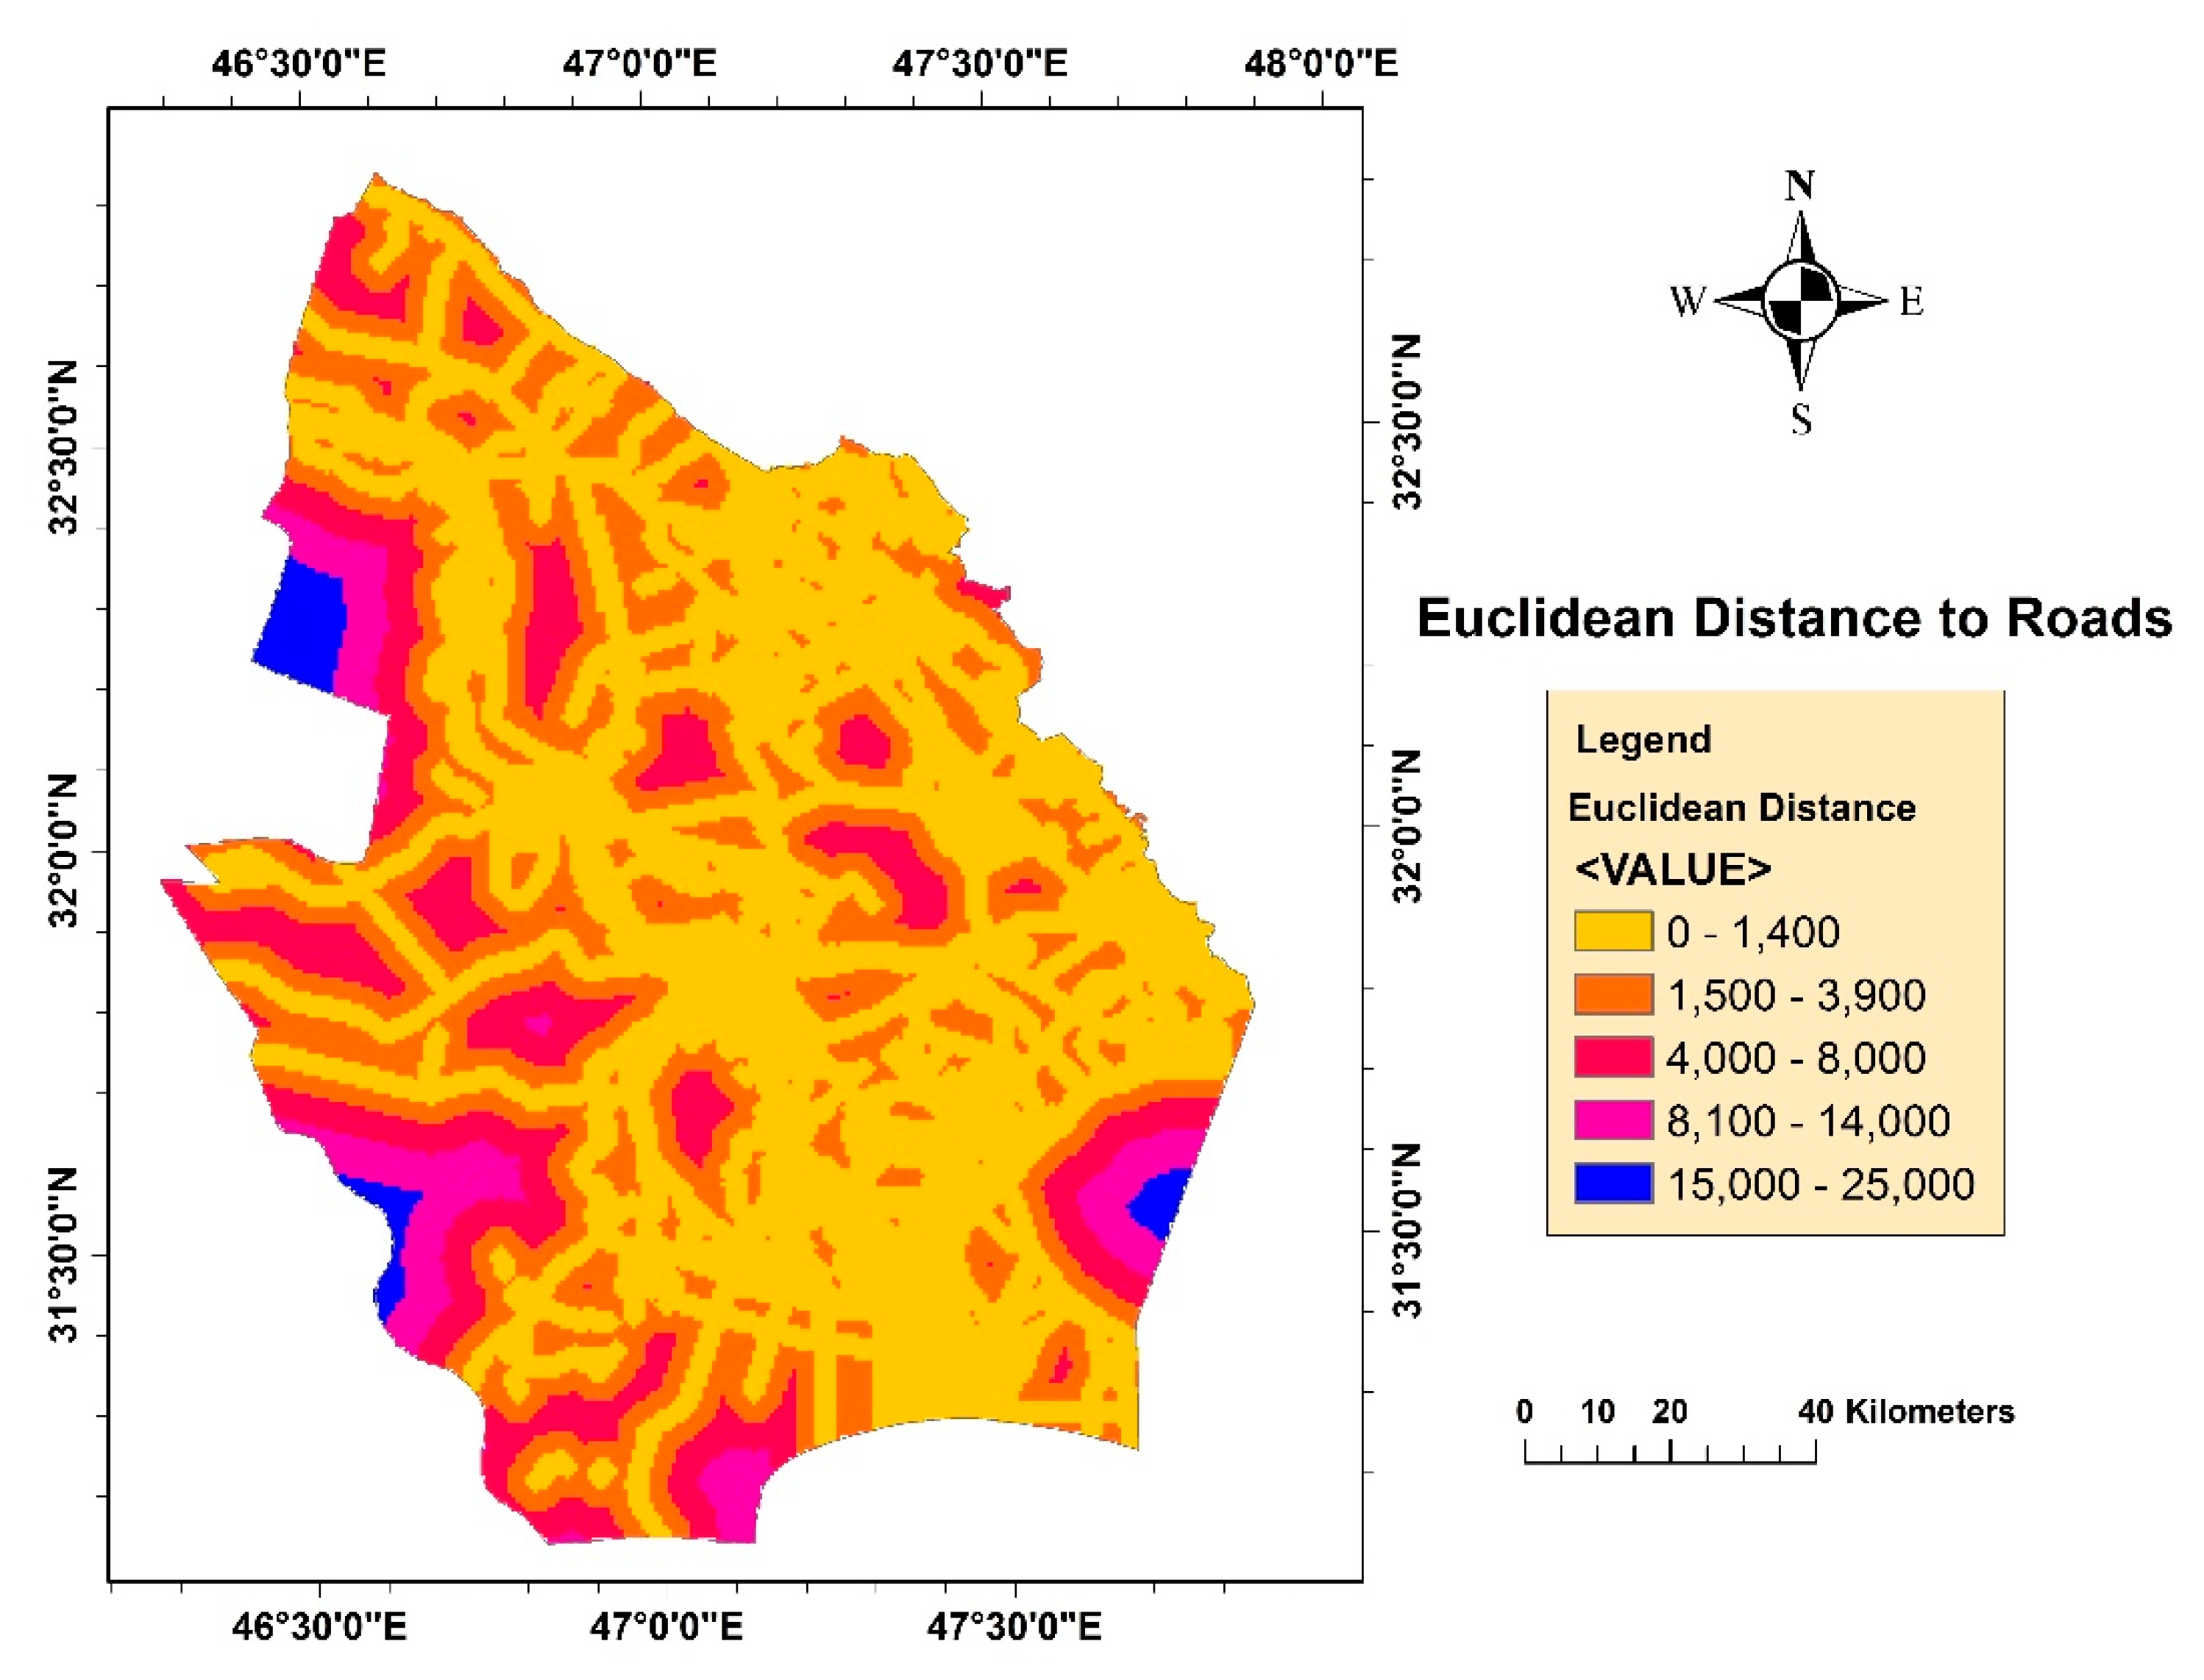
| 7 | Roads | shapefile | >100 m | Min = 100 Max = 25,000 |
| Point | Latitude | Longitude |
|---|---|---|
| 1 | 653,779 | 3,618,370 |
| 2 | 648,232 | 3,622,110 |
| 3 | 647,583 | 3,627,010 |
| 4 | 647,029 | 3,595,310 |
| 5 | 651,959 | 3,589,110 |
| 6 | 652,033 | 3,585,900 |
| 7 | 656,365 | 3,584,250 |
| 8 | 657,933 | 3,579,920 |
| 9 | 664,084 | 3,561,660 |
| 10 | 669,681 | 3,554,780 |
| 11 | 667,204 | 3,548,170 |
© 2020 by the authors. Licensee MDPI, Basel, Switzerland. This article is an open access article distributed under the terms and conditions of the Creative Commons Attribution (CC BY) license (http://creativecommons.org/licenses/by/4.0/).
Share and Cite
Alwan, I.A.; Aziz, N.A.; Hamoodi, M.N. Potential Water Harvesting Sites Identification Using Spatial Multi-Criteria Evaluation in Maysan Province, Iraq. ISPRS Int. J. Geo-Inf. 2020, 9, 235. https://doi.org/10.3390/ijgi9040235
Alwan IA, Aziz NA, Hamoodi MN. Potential Water Harvesting Sites Identification Using Spatial Multi-Criteria Evaluation in Maysan Province, Iraq. ISPRS International Journal of Geo-Information. 2020; 9(4):235. https://doi.org/10.3390/ijgi9040235
Chicago/Turabian StyleAlwan, Imzahim A., Nadia A. Aziz, and Mustafa N. Hamoodi. 2020. "Potential Water Harvesting Sites Identification Using Spatial Multi-Criteria Evaluation in Maysan Province, Iraq" ISPRS International Journal of Geo-Information 9, no. 4: 235. https://doi.org/10.3390/ijgi9040235
APA StyleAlwan, I. A., Aziz, N. A., & Hamoodi, M. N. (2020). Potential Water Harvesting Sites Identification Using Spatial Multi-Criteria Evaluation in Maysan Province, Iraq. ISPRS International Journal of Geo-Information, 9(4), 235. https://doi.org/10.3390/ijgi9040235