Site Selection of Digital Signage in Beijing: A Combination of Machine Learning and an Empirical Approach


Abstract
1. Introduction
2. Study Area and Data Source
2.1. Study Area
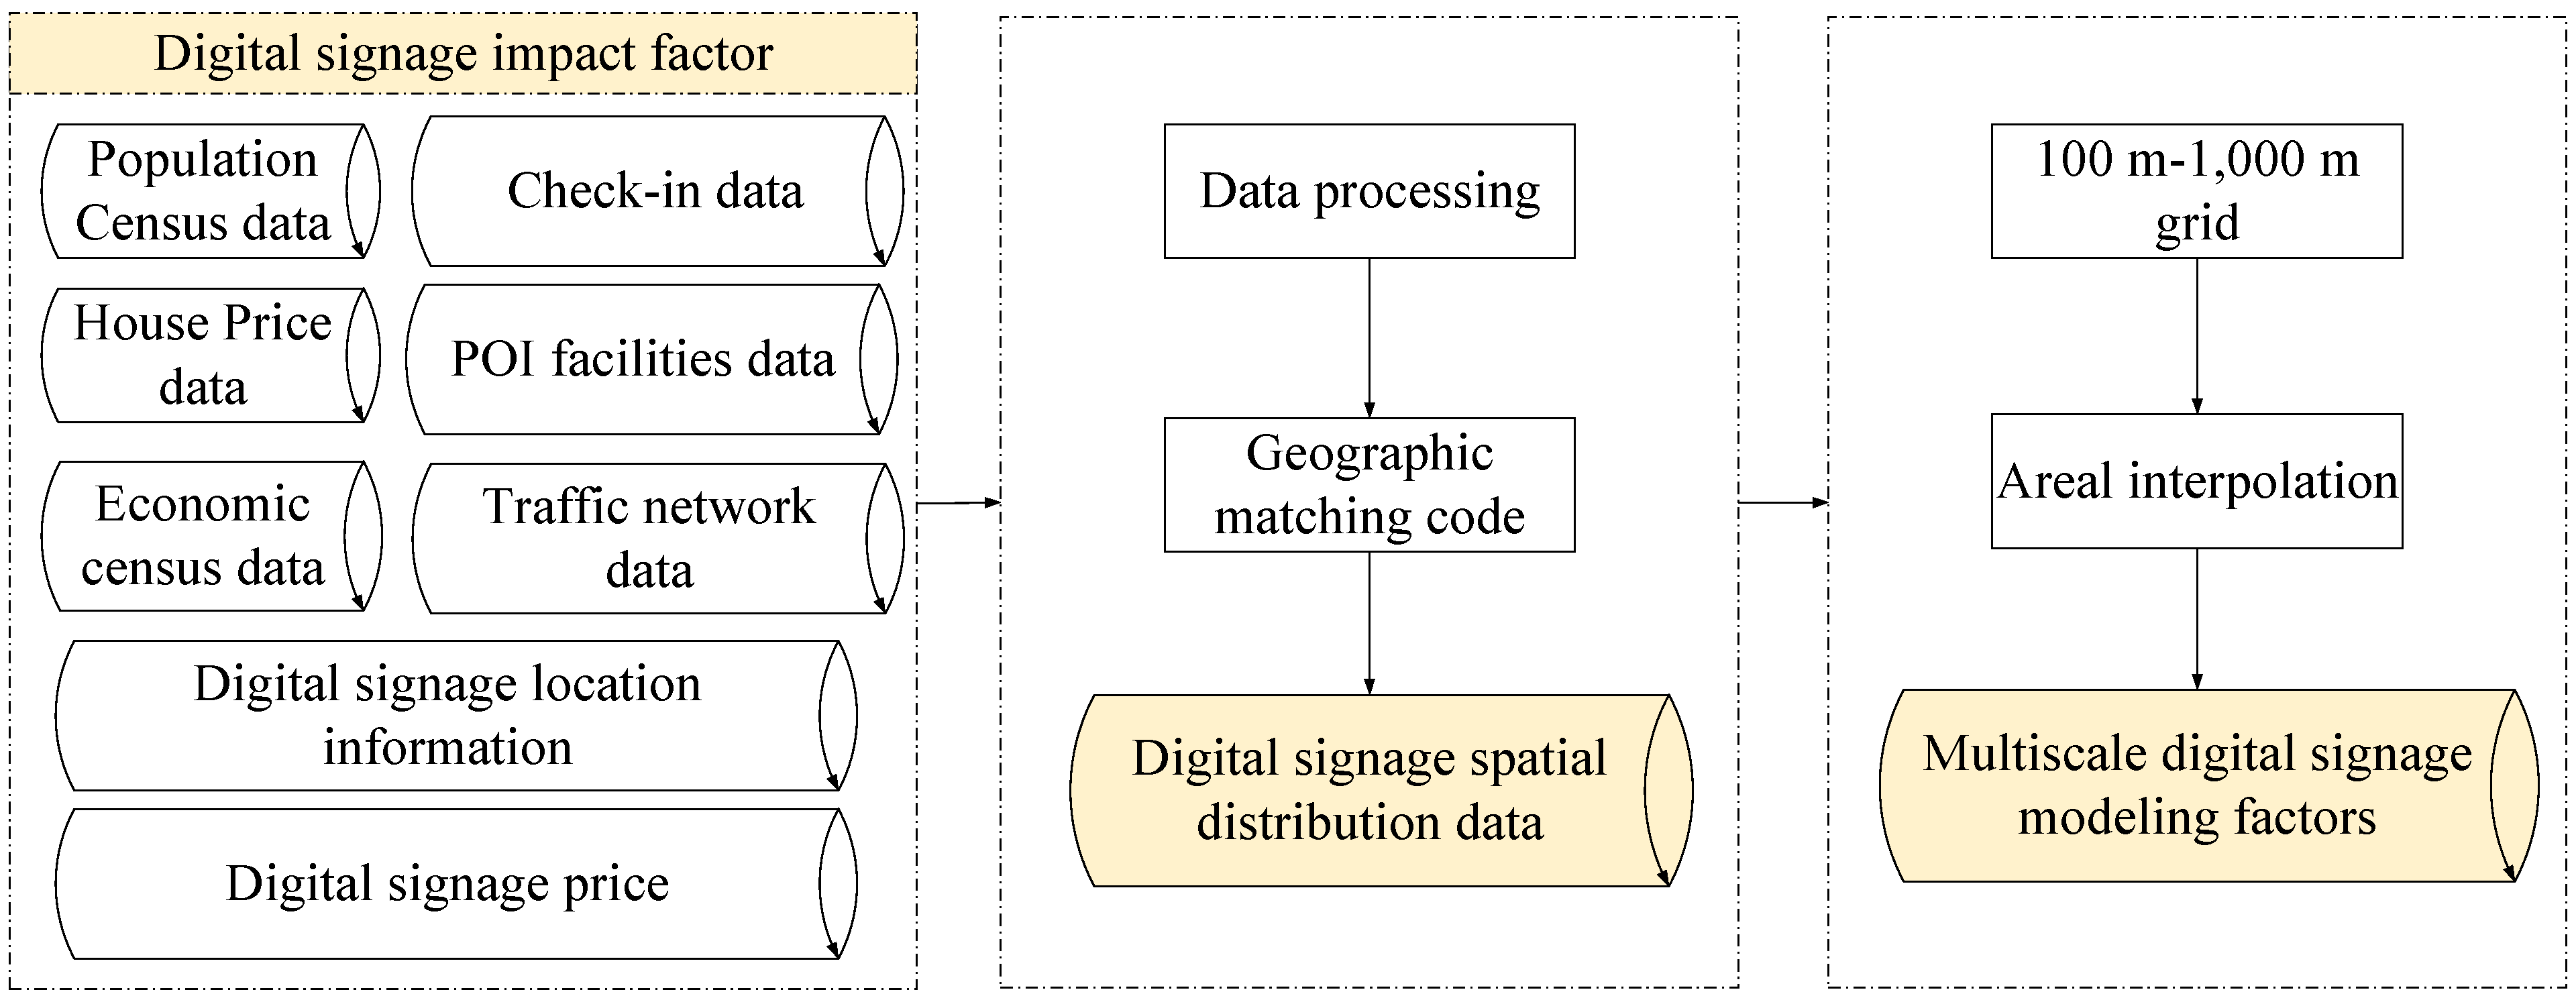
2.2. Data Source
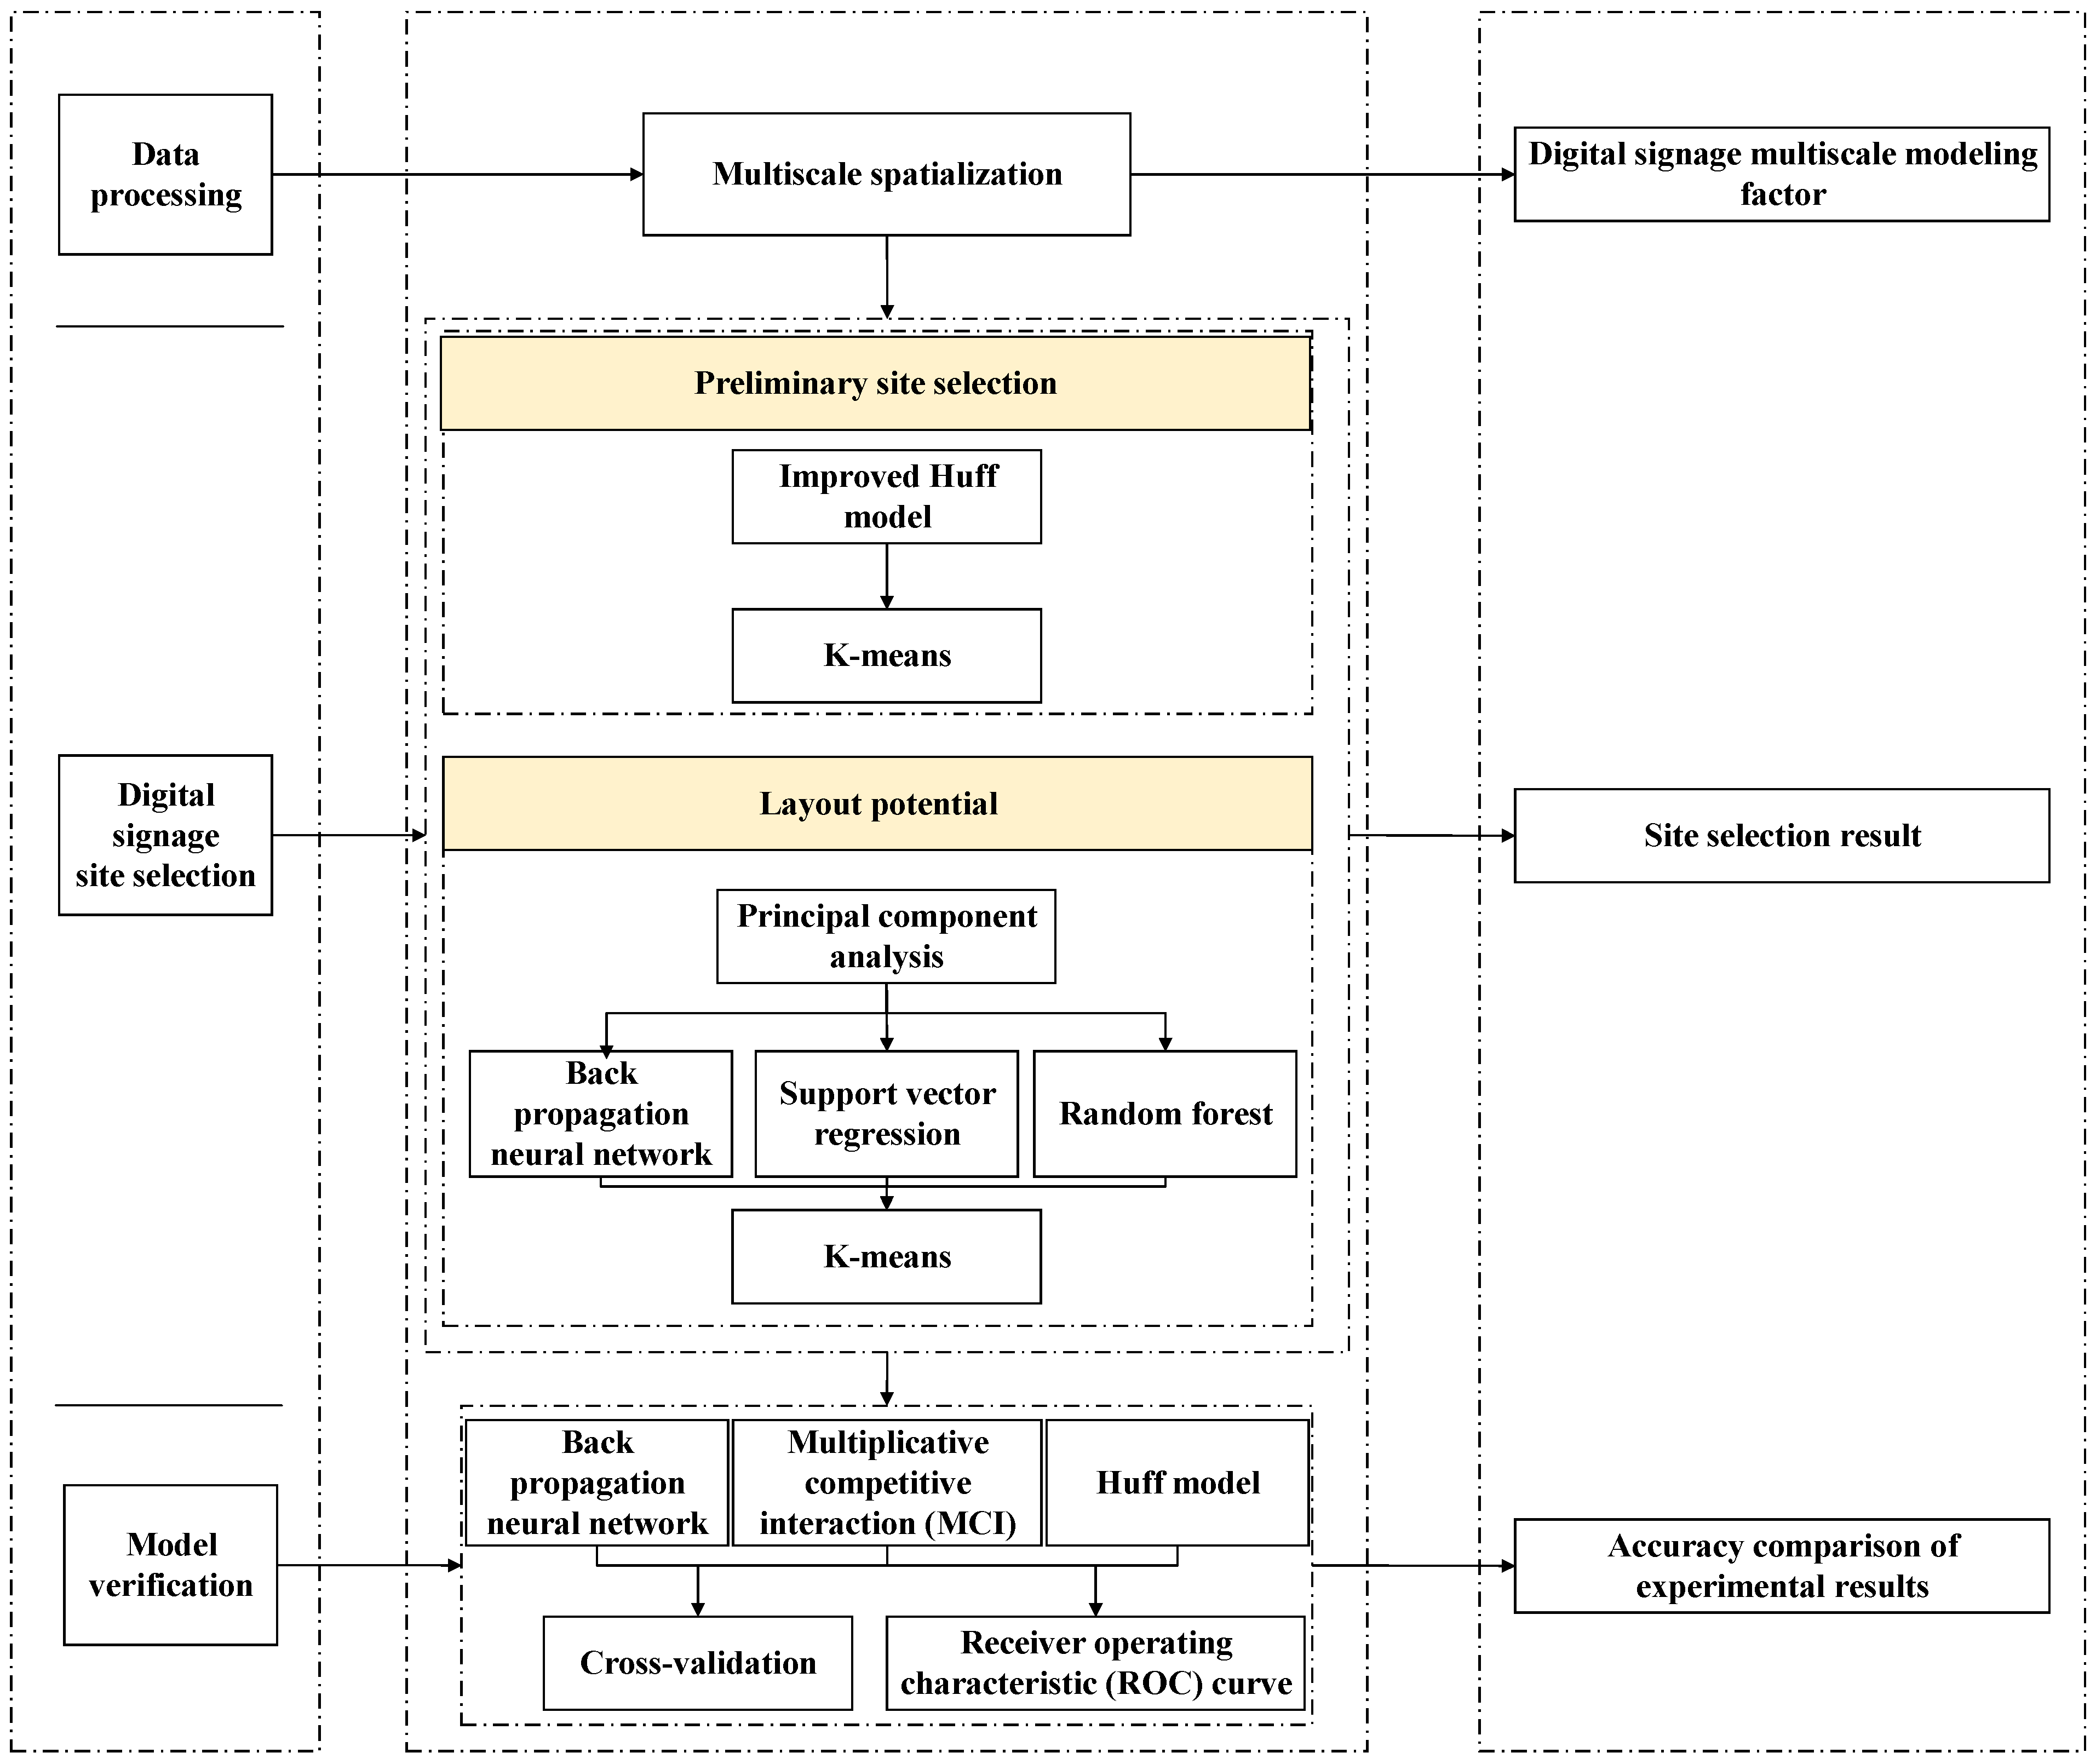
3. Methods
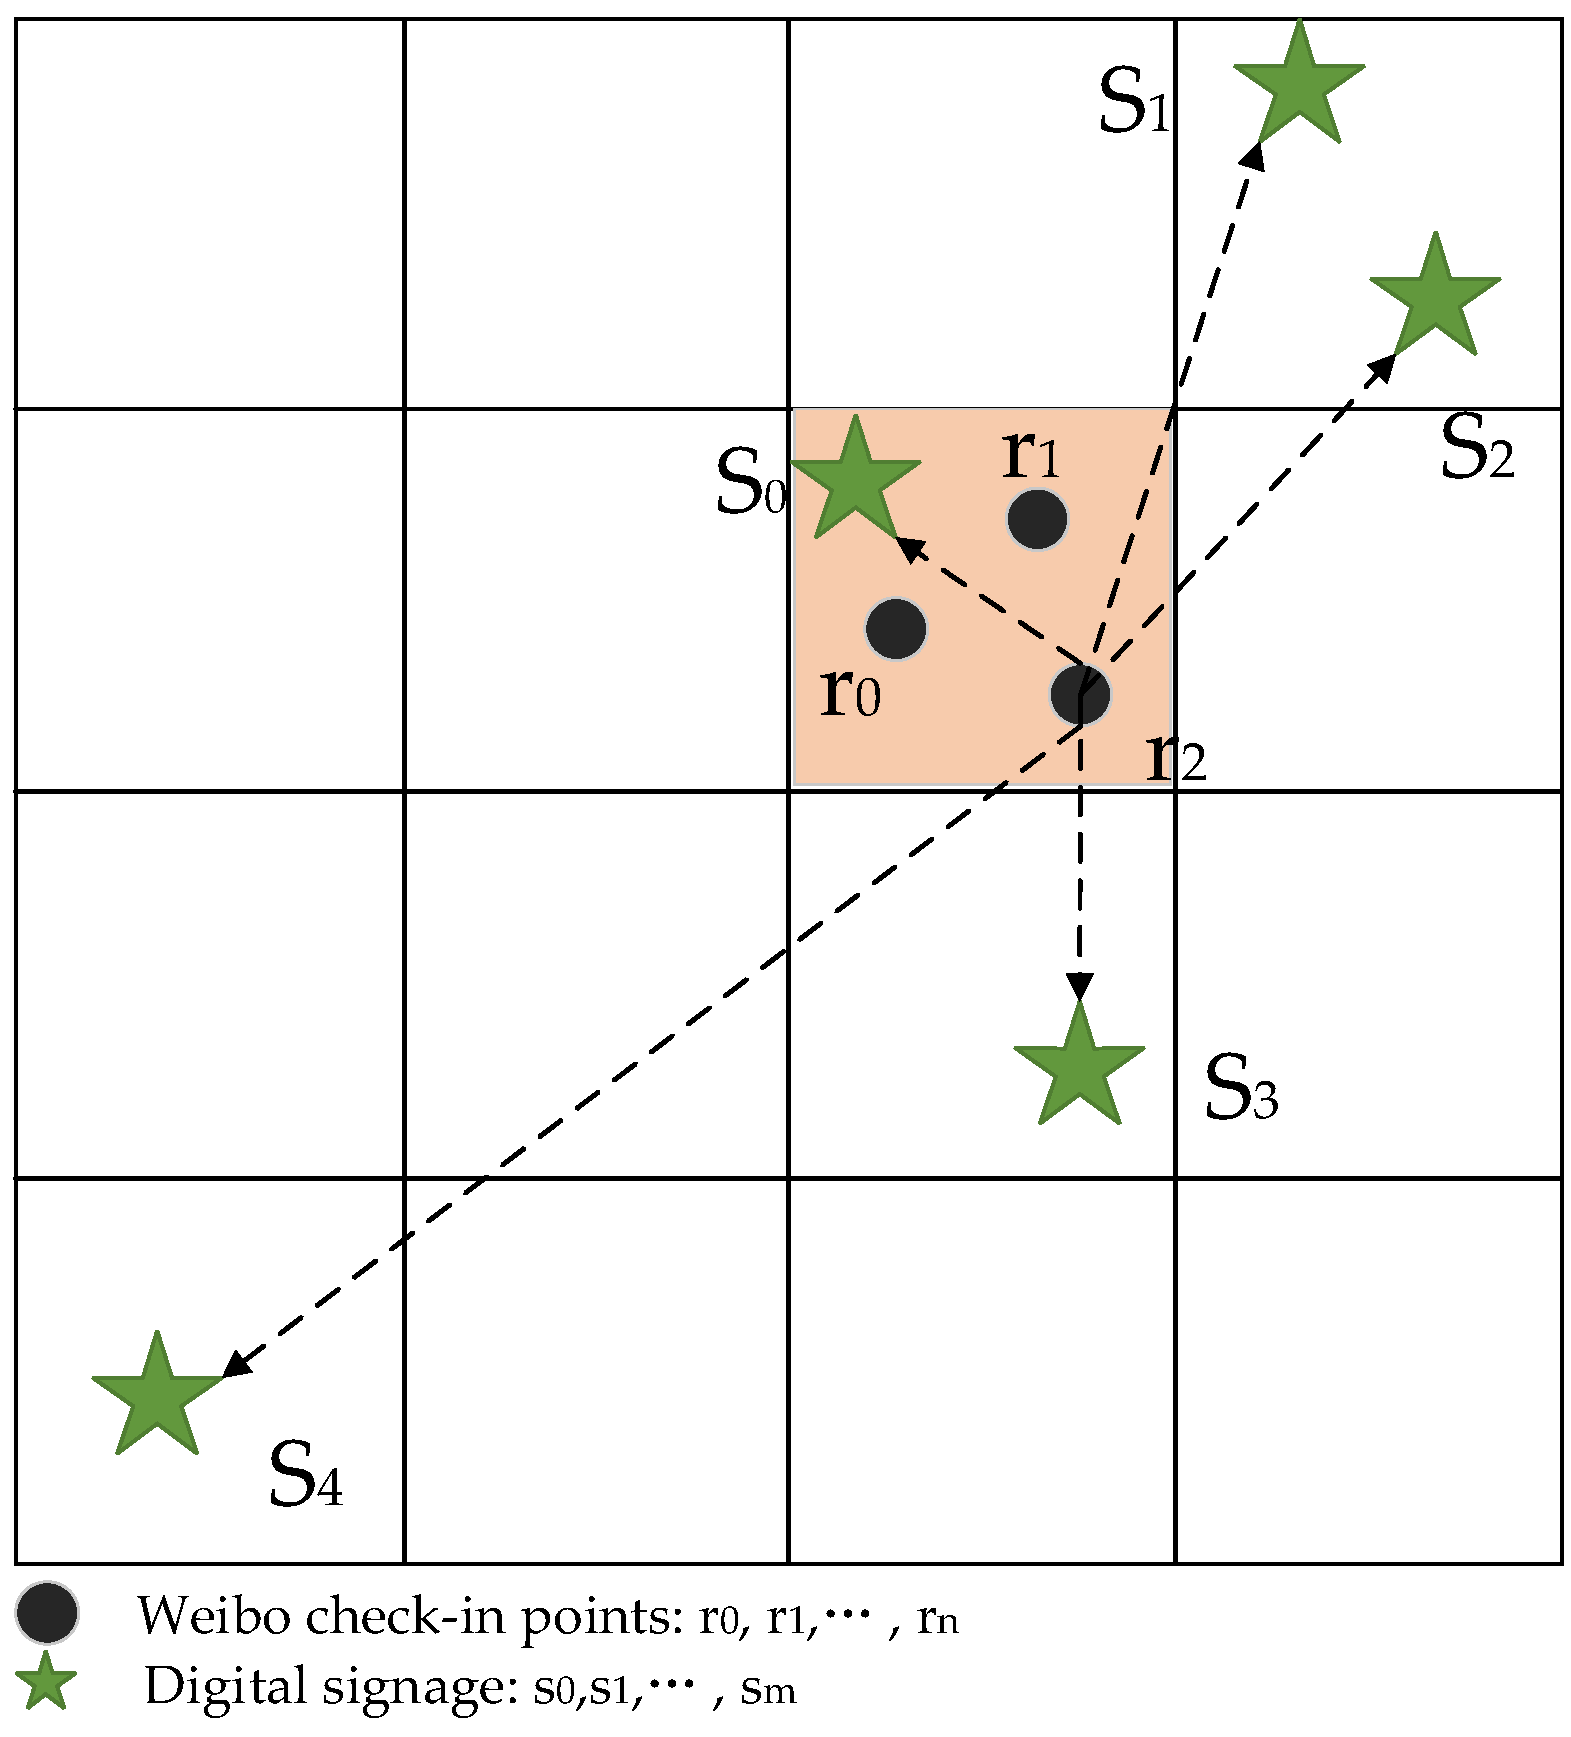
3.1. Data Processing
3.2. Location Model
3.2.1. Preliminary Site Selection
Huff Model
Modified Huff Model
K-Means Clustering
Calinski–Harabasz Index (CH Index)
3.2.2. Calculation of Digital Signage Layout Potential
BP Neural Network
Support Vector Machine Regression (SVR)
Random Forest (RF)
Root Mean Square Error (RMSE)
Principal Component Analysis (PCA)
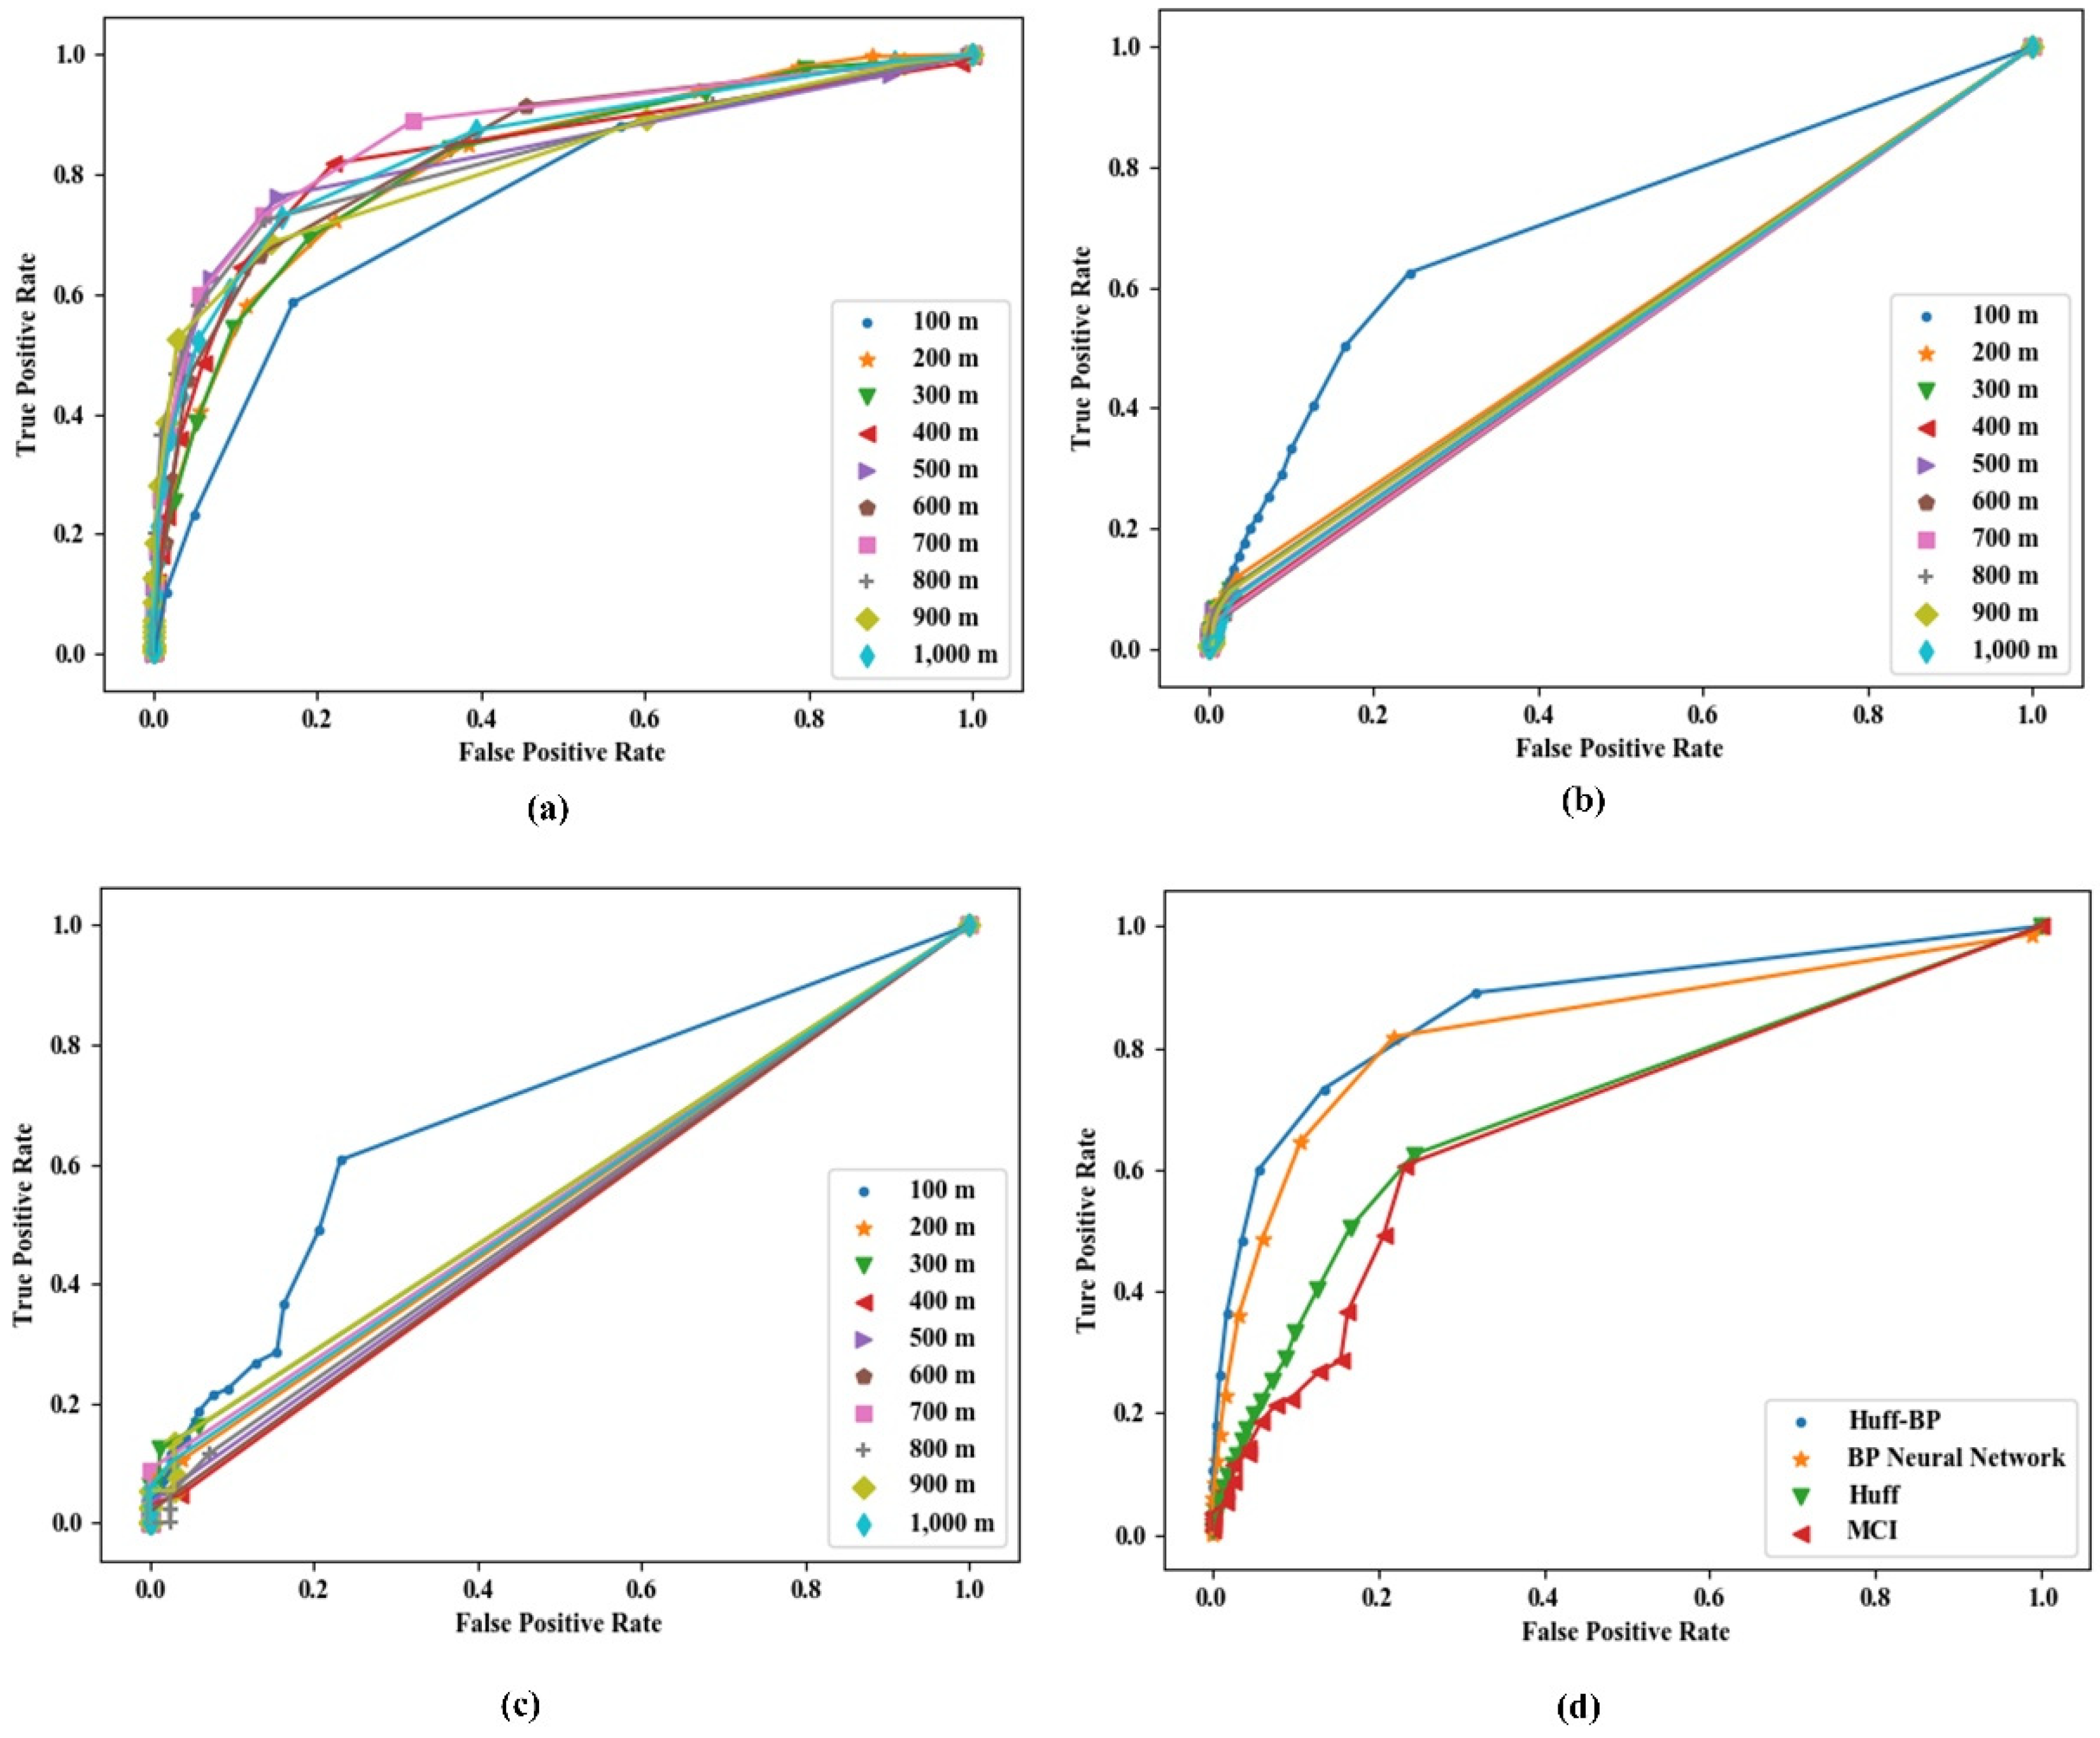
3.3. Model Verification
Cross Validation
4. Results and Discussion
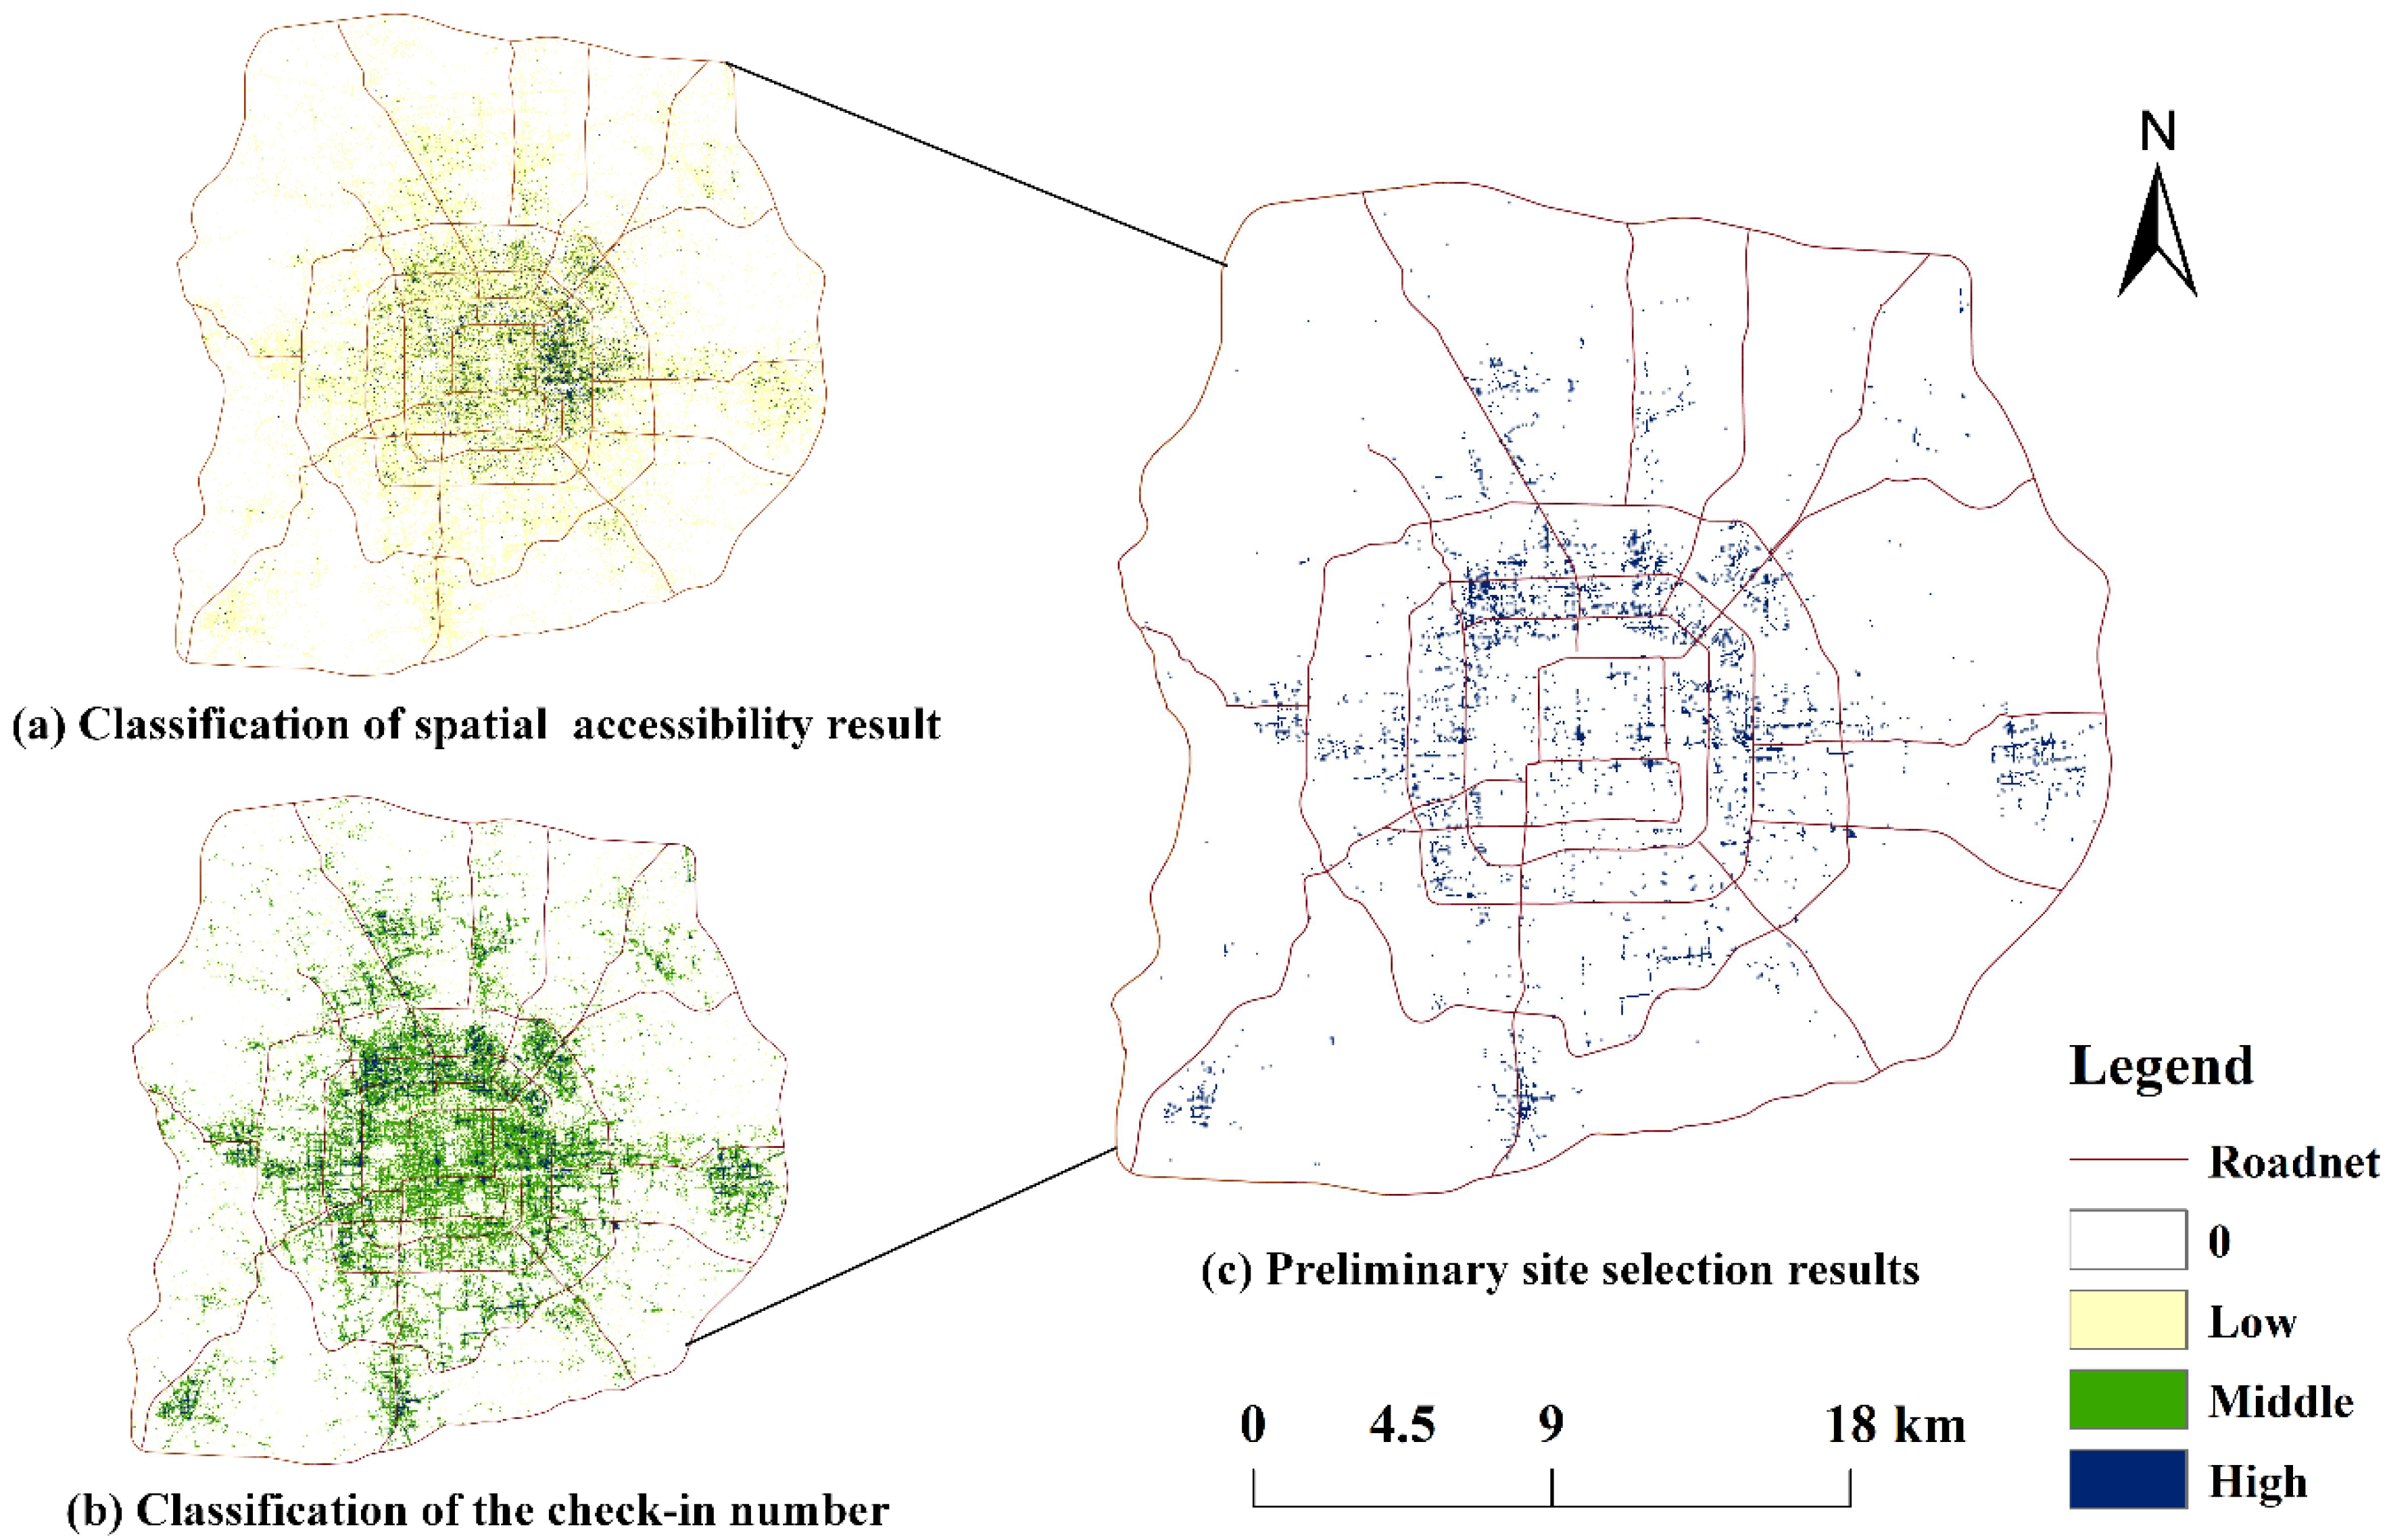
4.1. Preliminary Site-Selection Results
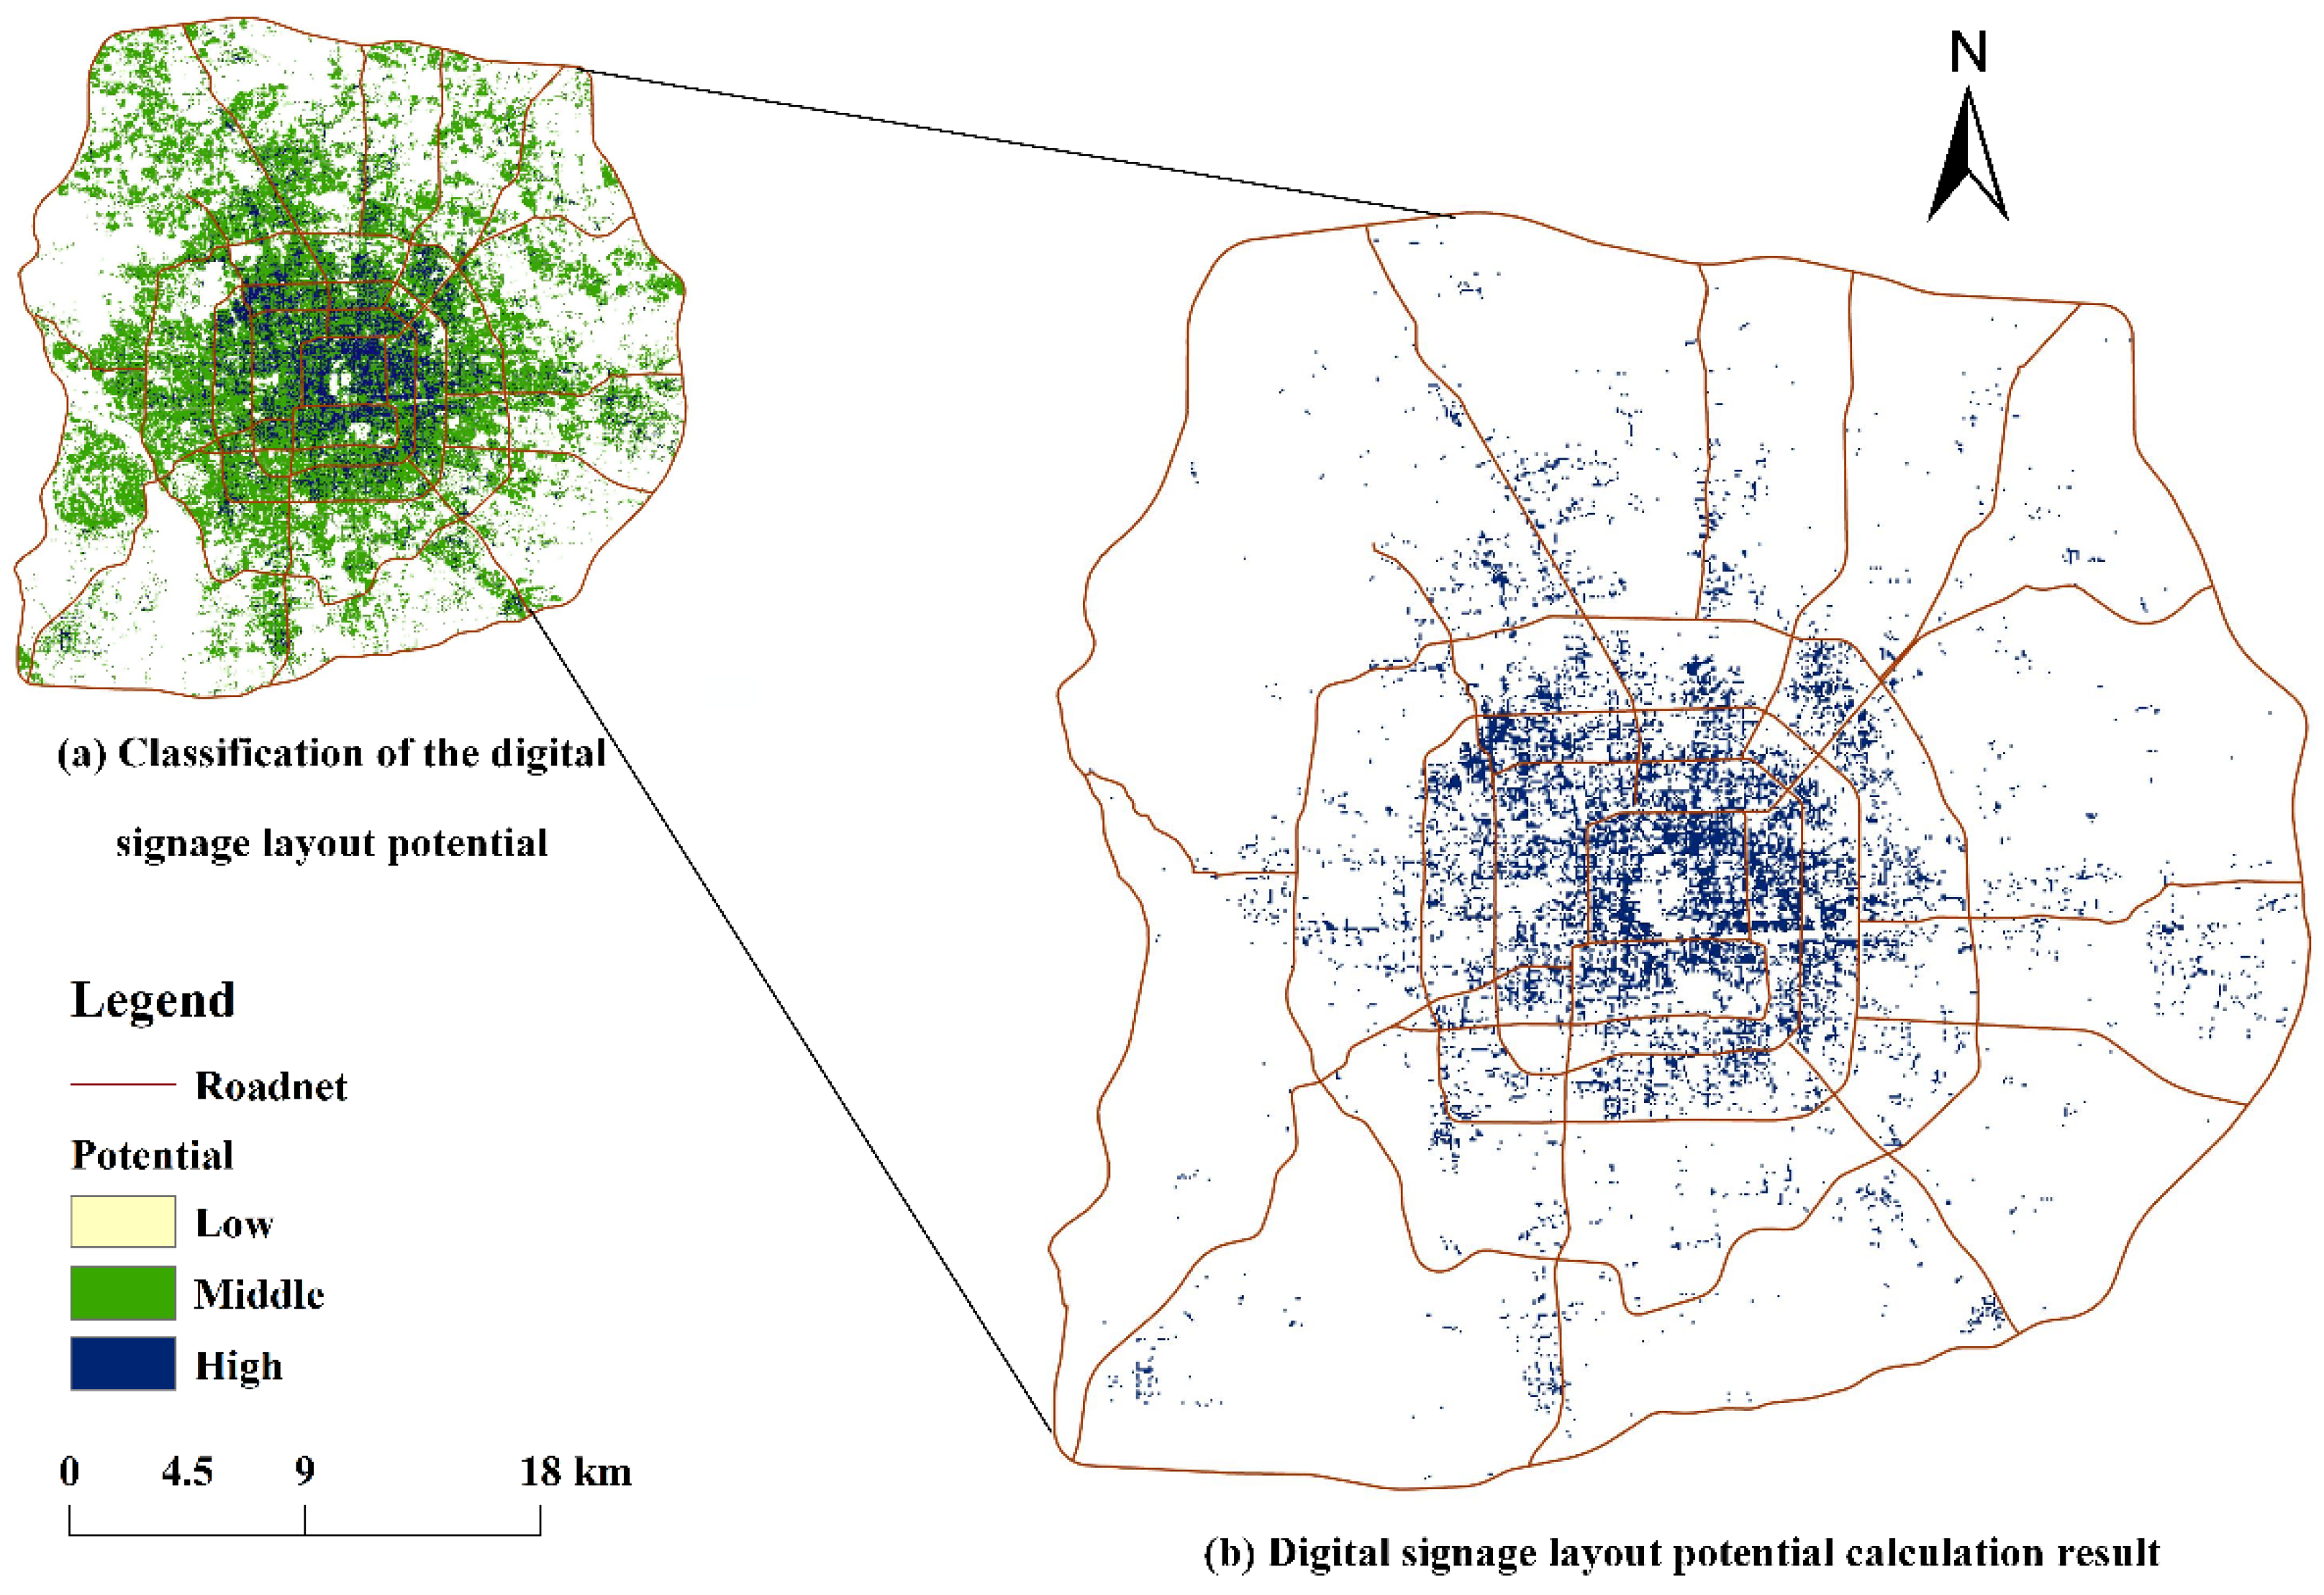
4.2. Layout Potential Results
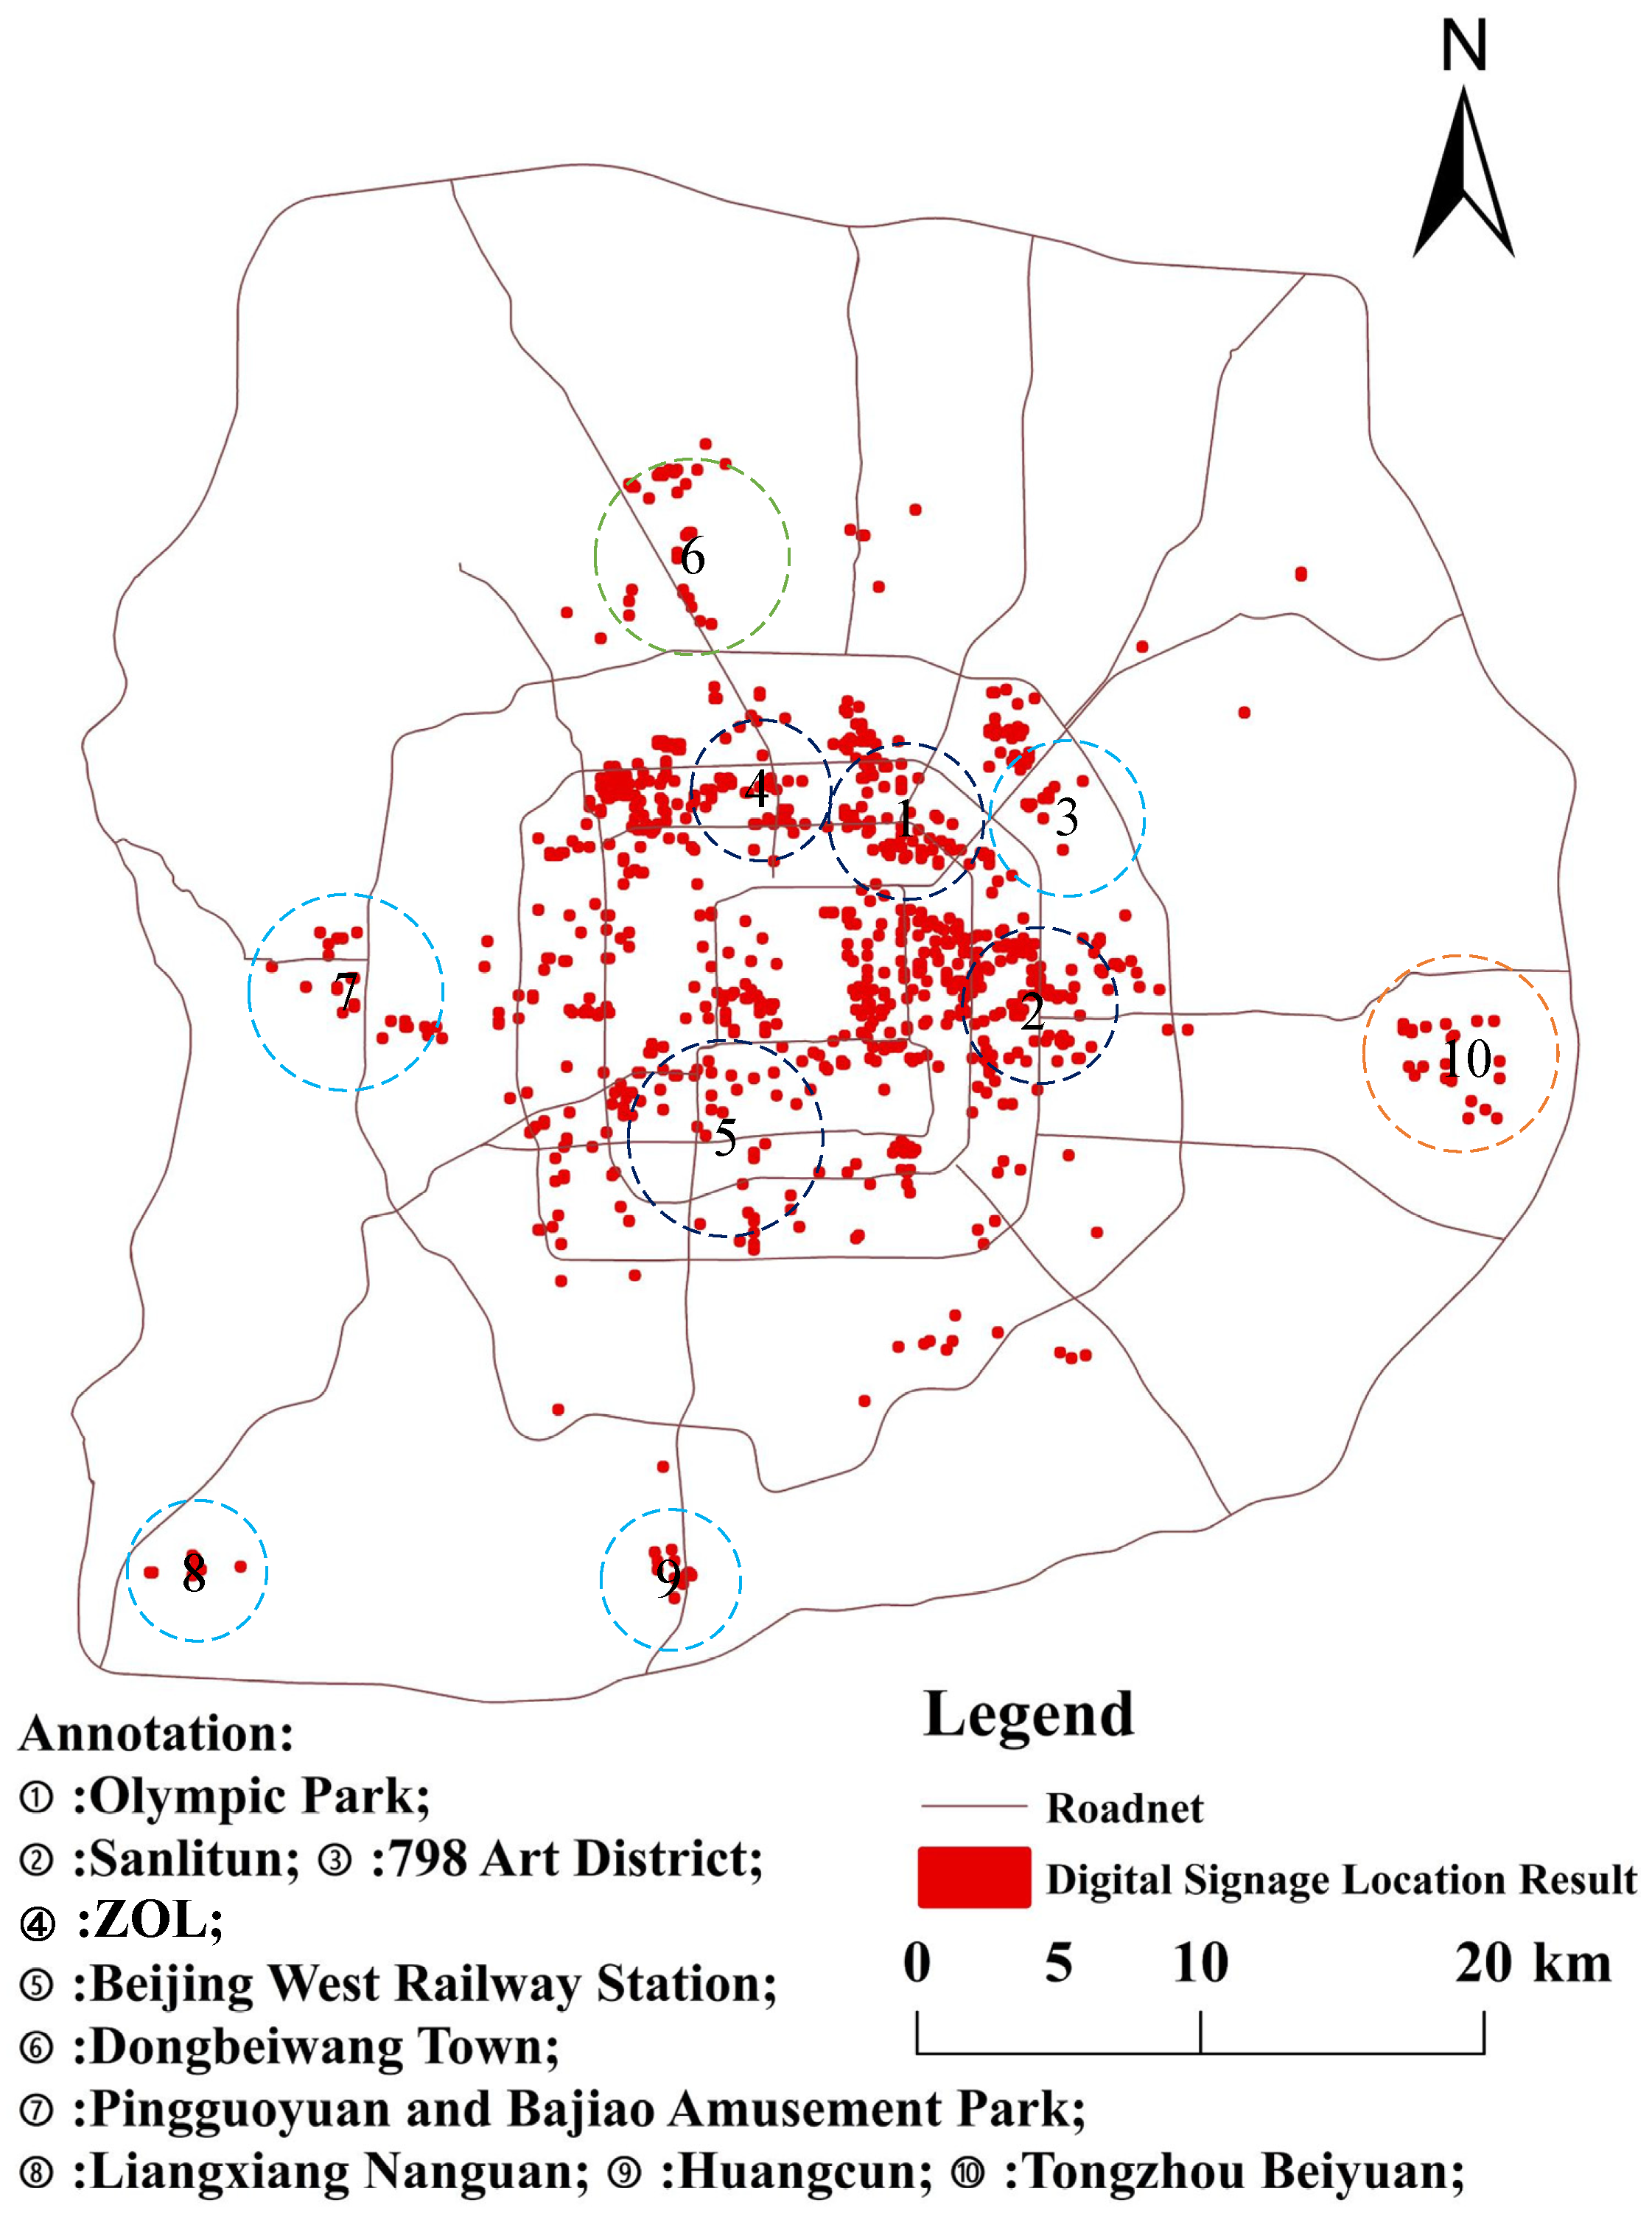
4.3. Results and Analysis of Digital Signage Location
5. Conclusions
Author Contributions
Funding
Acknowledgments
Conflicts of Interest
References
- Hossain, M.A.; Islam, A.; Le, N.T.; Lee, Y.T.; Lee, H.W.; Jang, Y.M. Performance analysis of smart digital signage system based on software-defined IoT and invisible image sensor communication. Int. J. Distrib. Sens. Netw. 2016, 12, 1–14. [Google Scholar] [CrossRef]
- Ravnik, R.; Solina, F. Audience Measurement of Digital Signage: Quantitative Study in Real-World Environment Using Computer Vision. Interact. Comput. 2013, 25, 218–228. [Google Scholar] [CrossRef]
- Want, R.; Schilit, B.N. Interactive Digital Signage. Comput. 2012, 45, 21–24. [Google Scholar] [CrossRef]
- Davies, N.; Langheinrich, M.; Jose, R.; Schmidt, A. Open Display Networks: A Communications Medium for the 21st Century. Comput. 2012, 45, 58–64. [Google Scholar] [CrossRef]
- Lin, L.; Zhigang, Z. Analysis of Digital Signage Advertising Operation. Youth J. 2017, 21, 96–97. (In Chinese) [Google Scholar]
- Battiato, G.E.; Cavallaro, A.; Distante, C.; Battiato, S. Special issue on “Video analytics for audience measurement in retail and digital signage”. Pattern Recognit. Lett. 2016, 81, 1–2. [Google Scholar] [CrossRef]
- Ullah, F.; Sarwar, G.; Lee, H.; Ryu, W.; Lee, S. Control framework and services scenarios of provisioning N-Screen services in interactive digital signage. Teh. Vjesn. 2014, 21, 1321–1328. [Google Scholar]
- Garaus, M.; Wagner, U. Let me entertain you – Increasing overall store satisfaction through digital signage in retail waiting areas. J. Retail. Consum. Serv. 2019, 47, 331–338. [Google Scholar] [CrossRef]
- Garaus, M.; Wagner, U.; Manzinger, S. Happy grocery shopper: The creation of positive emotions through affective digital signage content. Technol. Forecast. Soc. Chang. 2017, 124, 295–305. [Google Scholar] [CrossRef]
- Alfian, G.; Ijaz, M.F.; Syafrudin, M.; Syaekhoni, M.A.; Fitriyani, N.L.; Rhee, J. Customer behavior analysis using real-time data processing. Asia Pac. J. Mark. Logist. 2019, 31, 265–290. [Google Scholar] [CrossRef]
- Kim, J.S. A Study of Contact Frequency and Consumer Preference for Digital Signage Advertisement. In Proceedings of the e-Business and Telecommunication Networks, Rome, Italy, 24–27 July 2012; Springer Science and Business Media LLC: Berlin, Germany, 2012; Volume 338, pp. 181–187. [Google Scholar]
- Yoon, S.; Kim, H. Research into the Personalized Digital Signage Display Contents Information through a Short Distance Indoor Positioning. Int. J. Smart Home. 2015, 9, 171–178. [Google Scholar] [CrossRef]
- Ijaz, M.F.; Tao, W.; Rhee, J.; Kang, Y.-S.; Alfian, G. Efficient Digital Signage-Based Online Store Layout: An Experimental Study. Sustainability 2016, 8, 511. [Google Scholar] [CrossRef]
- Umor, E.F. The role of digital signage advertising in enhancing patronage among advertisers and potential consumers; the uyo city outlets in perspective. Commun. Rev. 2017, 1, 174. [Google Scholar]
- Khue, T.D.; Binh, N.T.; Chang, W.; Kim, C.; Chung, S.-T. Design and implementation of MEAN stack-based scalable real-time Digital Signage System. In Proceedings of the 2017 8th International Conference of Information and Communication Technology for Embedded Systems (IC-ICTES), Chon Buri, Thailand, 7–9 May 2017; Institute of Electrical and Electronics Engineers (IEEE): Piscataway, NJ, USA, 2017; pp. 1–6. [Google Scholar]
- Sheppard, D.; Felker, N.; Schmalzel, J. Development of Voice Commands in Digital Signage for Improved Indoor Navigation Using Google Assistant SDK. IEEE Sens. 2019, 1–5. [Google Scholar]
- Chen, Y. Optimization Design and Implementation of Multimedia Information Publishing System; Fudan University: Shanghai, China, 2013. (In Chinese) [Google Scholar]
- Inoue, H.; Suzuki, K.; Sakata, K.; Maeda, K. Development of a Digital Signage System for Automatic Collection and Distribution of Its Content from the Existing Digital Contents and Its Field Trials. IEEE/IPSJ Int. Symp. Appl. Int. 2011, 463–468. [Google Scholar]
- Ma, T.; Guo, L.; Tang, M.; Tian, Y.; Al-Rodhaan, M.; Al-Dhelaan, A. A Collaborative Filtering Recommendation Algorithm Based on Hierarchical Structure and Time Awareness. Ieice Trans. Inf. Syst. 2016, E99, 1512–1520. [Google Scholar] [CrossRef]
- Xie, X.; Zhang, X.; Fu, J.; Jiang, D.; Yu, C.; Jin, M. Location Recommendation of Digital Signage Based on Multi-Source Information Fusion. Sustainability 2018, 10, 2357. [Google Scholar] [CrossRef]
- O’Roarty, B.; Patterson, D.; McGreal, S.; Adair, A. A case-based reasoning approach to the selection of comparable evidence for retail rent determination. Expert Syst. Appl. 1997, 12, 417–428. [Google Scholar] [CrossRef]
- Suárez-Vega, R.; Gutiérrez-Acuña, J.L.; Rodríguez-Díaz, M. Locating a supermarket using a locally calibrated Huff model. Int. J. Geogr. Inf. Sci. 2014, 29, 217–233. [Google Scholar] [CrossRef]
- De Figueiredo, C.J.J.; Mota, C.M.D.M.; De, J. A Classification Model to Evaluate the Security Level in a City Based on GIS-MCDA. Math. Probl. Eng. 2016, 2016, 1–10. [Google Scholar] [CrossRef]
- A Badri, M. Combining the analytic hierarchy process and goal programming for global facility location-allocation problem. Int. J. Prod. Econ. 1999, 62, 237–248. [Google Scholar] [CrossRef]
- Velasquez, M.; Hester, P.T. An analysis of multi-criteria decision making methods. Int. J. Oper. Res. 2013, 10, 56–66. [Google Scholar]
- Allahi, S.; Mobin, M.; Vafadarnikjoo, A.; Salmon, C. An Integrated AHP-GIS-MCLP Method to Locate Bank Branches. In Proceedings of the Industrial and Systems Engineering Research Conference (ISERC), Nashville, TN, USA, 30 May–2 June 2015. [Google Scholar]
- Szeremeta-Spak, M.D.; Colmenero, J.C. A two-stage decision support model for a retail distribution center location. Rev. Fac. De Ing. Univ. De Antioq. 2015, 74, 177–187. [Google Scholar]
- Chang, C.-W.; Wu, C.-R.; Chen, H.-C. Using expert technology to select unstable slicing machine to control wafer slicing quality via fuzzy AHP. Expert Syst. Appl. 2008, 34, 2210–2220. [Google Scholar] [CrossRef]
- Baviera-Puig, A.; Buitrago-Vera, J.; Escriba-Perez, C. Geomarketing models in supermarket location strategies. J. Bus. Econ. Manag. 2016, 17, 1205–1221. [Google Scholar] [CrossRef]
- Xia, L.; Xiaoping, L.; Shaoying, L. Intelligent GIS and spatial optimization; Science Press: Beijing, China, 2010. [Google Scholar]
- Cortes, C.; Gonzalvo, X.; Kuznetsov, V.; Mohri, M.; Yang, S. AdaNet: Adaptive Structural Learning of Artificial Neural Networks. In Proceedings of the 34th International Conference on Machine Learning (ICML 2017), Sydney, Australia, 6–11 August 2017. [Google Scholar]
- Pradhan, B. A comparative study on the predictive ability of the decision tree, support vector machine and neuro-fuzzy models in landslide susceptibility mapping using GIS. Comput. Geosci. 2013, 51, 350–365. [Google Scholar] [CrossRef]
- Al-Sharif, A.A.; Pradhan, B. A novel approach for predicting the spatial patterns of urban expansion by combining the chi-squared automatic integration detection decision tree, Markov chain and cellular automata models in GIS. Geocarto Int. 2015, 30, 1–24. [Google Scholar] [CrossRef]
- Zhou, G.; Wang, L. Co-location decision tree for enhancing decision-making of pavement maintenance and rehabilitation. Transp. Res. Part C: Emerg. Technol. 2012, 21, 287–305. [Google Scholar] [CrossRef]
- Yanga, Y.; Tang, J.; Luo, H.; Law, R. Hotel location evaluation: A combination of machine learning tools and web GIS. Int. J. Hosp. Manag. 2015, 47, 14–24. [Google Scholar] [CrossRef]
- Lu, Y.; Zhu, S.; Zhang, L. A Machine Learning Approach to Trip Purpose Imputation in GPS-Based Travel Surveys. Available online: http://onlinepubs.trb.org/onlinepubs/conferences/2012/4thITM/Papers-R/0117-000075.pdf (accessed on 28 February 2019).
- Liu, D.; Weng, D.; Li, Y.; Bao, J.; Zheng, Y.; Qu, H.; Wu, Y. SmartAdP: Visual Analytics of Large-scale Taxi Trajectories for Selecting Billboard Locations. IEEE Trans. Vis. Comput. Graph. 2017, 23, 1–10. [Google Scholar] [CrossRef] [PubMed]
- Luyao, W.; Hong, F.; Yankun, W. Site Selection of Retail Shops Based on Spatial Accessibility and Hybrid BP Neural Network. Isprs Int. J. Geo-Inf. 2018, 7, 202. [Google Scholar]
- Gahegan, M. Fourth paradigm GIScience? Prospects for automated discovery and explanation from data. Int. J. Geogr. Inf. Sci. 2019, 34, 1–21. [Google Scholar] [CrossRef]
- Zhang, X.; Ma, G.; Jiang, L.; Zhang, X.; Liu, Y.; Wang, Y.; Zhao, C. Analysis of Spatial Characteristics of Digital Signage in Beijing with Multi-Source Data. ISPRS Int. J. Geo-Inf. 2019, 8, 207. [Google Scholar] [CrossRef]
- Okabe, A. Spatial Analysis Along Networks. In Encyclopedia of GIS; Springer Science and Business Media LLC: Berlin, Germany, 2017; pp. 1938–1948. [Google Scholar]
- Sevtsuk, A. Path and Place: A Study of Urban Geometry and Retail Activity in Cambridge and Somerville, MA. Ph.D. Thesis, Massachusetts Institute of Technology, Cambridge, MA, USA, 11 August 2010. [Google Scholar]
- Kwan, M.-P. The Uncertain Geographic Context Problem. Ann. Assoc. Am. Geogr. 2012, 102, 958–968. [Google Scholar] [CrossRef]
- Haynes, R.; Daras, K.; Reading, R.; Jones, A. Modifiable neighbourhood units, zone design and residents’ perceptions. Heal. Place. 2007, 13, 812–825. [Google Scholar] [CrossRef]
- Houston, D. Implications of the modifiable areal unit problem for assessing built environment correlates of moderate and vigorous physical activity. Appl. Geogr. 2014, 50, 40–47. [Google Scholar] [CrossRef]
- Nakaya, T. An Information Statistical Approach to the Modifiable Areal Unit Problem in Incidence Rate Maps. Environ. Plan. A: Econ. Space 2000, 32, 91–109. [Google Scholar] [CrossRef]
- Dark, S.J.; Bram, D. The modifiable areal unit problem (MAUP) in physical geography. Prog. Phys. Geogr. Earth Environ. 2007, 31, 471–479. [Google Scholar] [CrossRef]
- Viegas, J.M.; Martinez, L.; Silva, E. Effects of the Modifiable Areal Unit Problem on the Delineation of Traffic Analysis Zones. Environ. Plan. B Plan. Des. 2009, 36, 625–643. [Google Scholar] [CrossRef]
- Clark, A.F.; Scott, D. Understanding the Impact of the Modifiable Areal Unit Problem on the Relationship between Active Travel and the Built Environment. Urban Stud. 2013, 51, 284–299. [Google Scholar] [CrossRef]
- Barr, P.S.; Stimpert, J.L.; Huff, A.S. Cognitive change, strategic action, and organizational renewal. Strat. Manag. J. 1992, 13, 15–36. [Google Scholar] [CrossRef]
- Hartigan, J.A.; Wong, M.A. Algorithm AS 136: A K-Means Clustering Algorithm. J. R. Stat. Soc. Ser. C (Appl. Stat.) 1979, 28, 100. [Google Scholar] [CrossRef]
- Huang, J.Z.; Ng, M.K.; Rong, H.; Li, Z. Automated variable weighting in k-means type clustering. IEEE Trans. Pattern Anal. Mach. Intell. 2005, 27, 657–668. [Google Scholar] [CrossRef] [PubMed]
- De Amorim, R.C.; Hennig, C. Recovering the number of clusters in data sets with noise features using feature rescaling factors. Inf. Sci. 2015, 324, 126–145. [Google Scholar] [CrossRef]
- Sadeghi, B. A BP-neural network predictor model for plastic injection molding process. J. Mater. Process. Technol. 2000, 103, 411–416. [Google Scholar] [CrossRef]
- Balabin, R.; Lomakina, E.I. Support vector machine regression (SVR/LS-SVM)—An alternative to neural networks (ANN) for analytical chemistry? Comparison of nonlinear methods on near infrared (NIR) spectroscopy data. Analyst 2011, 136, 1703. [Google Scholar] [CrossRef]
- Svetnik, V.; Liaw, A.; Tong, C.; Culberson, J.C.; Sheridan, R.P.; Feuston, B.P. Random Forest: A Classification and Regression Tool for Compound Classification and QSAR Modeling. J. Chem. Inf. Comput. Sci. 2003, 43, 1947–1958. [Google Scholar] [CrossRef]
- D’Aspremont, A.; El Ghaoui, L.; Jordan, M.I.; Lanckriet, G.R.G. A Direct Formulation for Sparse PCA Using Semidefinite Programming. Siam Rev. 2007, 49, 434–448. [Google Scholar] [CrossRef]
- Pepe, M.S.; Janes, H.; Gu, J.W. Letter by Pepe et al regarding article, Use and misuse of the receiver operating characteristic curve in risk prediction. Circulation 2007, 116, e132. [Google Scholar] [CrossRef]


| Data Type | Indicators | Source |
|---|---|---|
| Population | Residents | The third census and the third economic census in Beijing |
| Traffic Count | Transportation network centrality index | Statistic calibre |
| Competitors | Basic data of digital signage | Project group accumulation |
| Social Media | Social network check-in data | Sina Weibo (https://weibo.com/) |
| Housing Price | Housing price | LianJia (https://bj.lianjia.com) |
| Point of interest (POI) Facilities | 14 kinds of POI facilities data (restaurant/shopping malls/communal facilities/culture education departments/transportation services facilities/life service facilities/etc.) | Google (https://developers.google.cn/places/web-service/intro) |
| Scale (m) | Number of Grids |
|---|---|
| 100 × 100 | 227,330 |
| 200 × 200 | 56,837 |
| 300×300 | 25,262 |
| 400 × 400 | 14,200 |
| 500 × 500 | 9095 |
| 600 × 600 | 6367 |
| 700 × 700 | 4640 |
| 800 × 800 | 3561 |
| 900 × 900 | 2812 |
| 1000 × 1000 | 2275 |
| Scale | Random Forest | BP Neural Network | RBF | Linear | Poly | Mean |
|---|---|---|---|---|---|---|
| 100 m | 0.277 | 0.265 | 0.268 | 0.271 | 0.268 | 0.270 |
| 200 m | 0.306 | 0.290 | 0.321 | 0.324 | 0.322 | 0.312 |
| 300 m | 0.321 | 0.300 | 0.320 | 0.326 | 0.322 | 0.318 |
| 400 m | 0.313 | 0.300 | 0.303 | 0.314 | 0.306 | 0.307 |
| 500 m | 0.325 | 0.294 | 0.317 | 0.327 | 0.319 | 0.316 |
| 600 m | 0.317 | 0.277 | 0.323 | 0.338 | 0.326 | 0.316 |
| 700 m | 0.311 | 0.298 | 0.316 | 0.325 | 0.321 | 0.314 |
| 800 m | 0.312 | 0.287 | 0.286 | 0.287 | 0.291 | 0.293 |
| 900 m | 0.343 | 0.274 | 0.323 | 0.333 | 0.327 | 0.320 |
| 1000 m | 0.332 | 0.277 | 0.329 | 0.340 | 0.341 | 0.324 |
| Method | RMSE |
|---|---|
| BP Neural Network | 0.264 |
| Random Forest (RF) | 0.271 |
| SVR (kernel: RBF) | 0.271 |
| SVR (kernel: Linear) | 0.271 |
| SVR (kernel: Poly) | 0.270 |
© 2020 by the authors. Licensee MDPI, Basel, Switzerland. This article is an open access article distributed under the terms and conditions of the Creative Commons Attribution (CC BY) license (http://creativecommons.org/licenses/by/4.0/).
Share and Cite
Wang, Y.; Li, S.; Zhang, X.; Jiang, D.; Hao, M.; Zhou, R. Site Selection of Digital Signage in Beijing: A Combination of Machine Learning and an Empirical Approach. ISPRS Int. J. Geo-Inf. 2020, 9, 217. https://doi.org/10.3390/ijgi9040217
Wang Y, Li S, Zhang X, Jiang D, Hao M, Zhou R. Site Selection of Digital Signage in Beijing: A Combination of Machine Learning and an Empirical Approach. ISPRS International Journal of Geo-Information. 2020; 9(4):217. https://doi.org/10.3390/ijgi9040217
Chicago/Turabian StyleWang, Yuxue, Su Li, Xun Zhang, Dong Jiang, Mengmeng Hao, and Rui Zhou. 2020. "Site Selection of Digital Signage in Beijing: A Combination of Machine Learning and an Empirical Approach" ISPRS International Journal of Geo-Information 9, no. 4: 217. https://doi.org/10.3390/ijgi9040217
APA StyleWang, Y., Li, S., Zhang, X., Jiang, D., Hao, M., & Zhou, R. (2020). Site Selection of Digital Signage in Beijing: A Combination of Machine Learning and an Empirical Approach. ISPRS International Journal of Geo-Information, 9(4), 217. https://doi.org/10.3390/ijgi9040217