1. Introduction
As the development of coastal areas continues through land reclamation, the risk of flooding is increasing and the risks related to huge losses of both life and property caused by inundation are increasing as well [
1,
2]. Natural disasters, such as hurricanes and tsunamis, can cause serious damage in coastal cities. In the case of such a disaster, it is critical to evacuate people as quickly as possible to minimize fatalities. When an evacuation order is issued by the government, people should move to the closest shelter as quickly as possible. However, the current evacuation system does not prescribe how evacuees should choose a route [
3]. Therefore, people generally lack information on which shelter is the closest and easiest for them to access. Especially for circumstances in which inundation is occurring, accurate forecasts and prevention measures using various physical and statistical models are challenging due to the complexity of the hydrological process [
4].
Moreover, the actual evacuation distance and time could change due to the dynamic situations created by a natural disaster event. Therefore, it is obviously necessary to deploy an actual evacuation time to extract the optimal route to the most accessible shelter to facilitate an evacuation during a flood. Moreover, the visual provision of evacuation information related to shelter locations and corresponding routes is essential for the effective evacuation of people in real time. As shown in
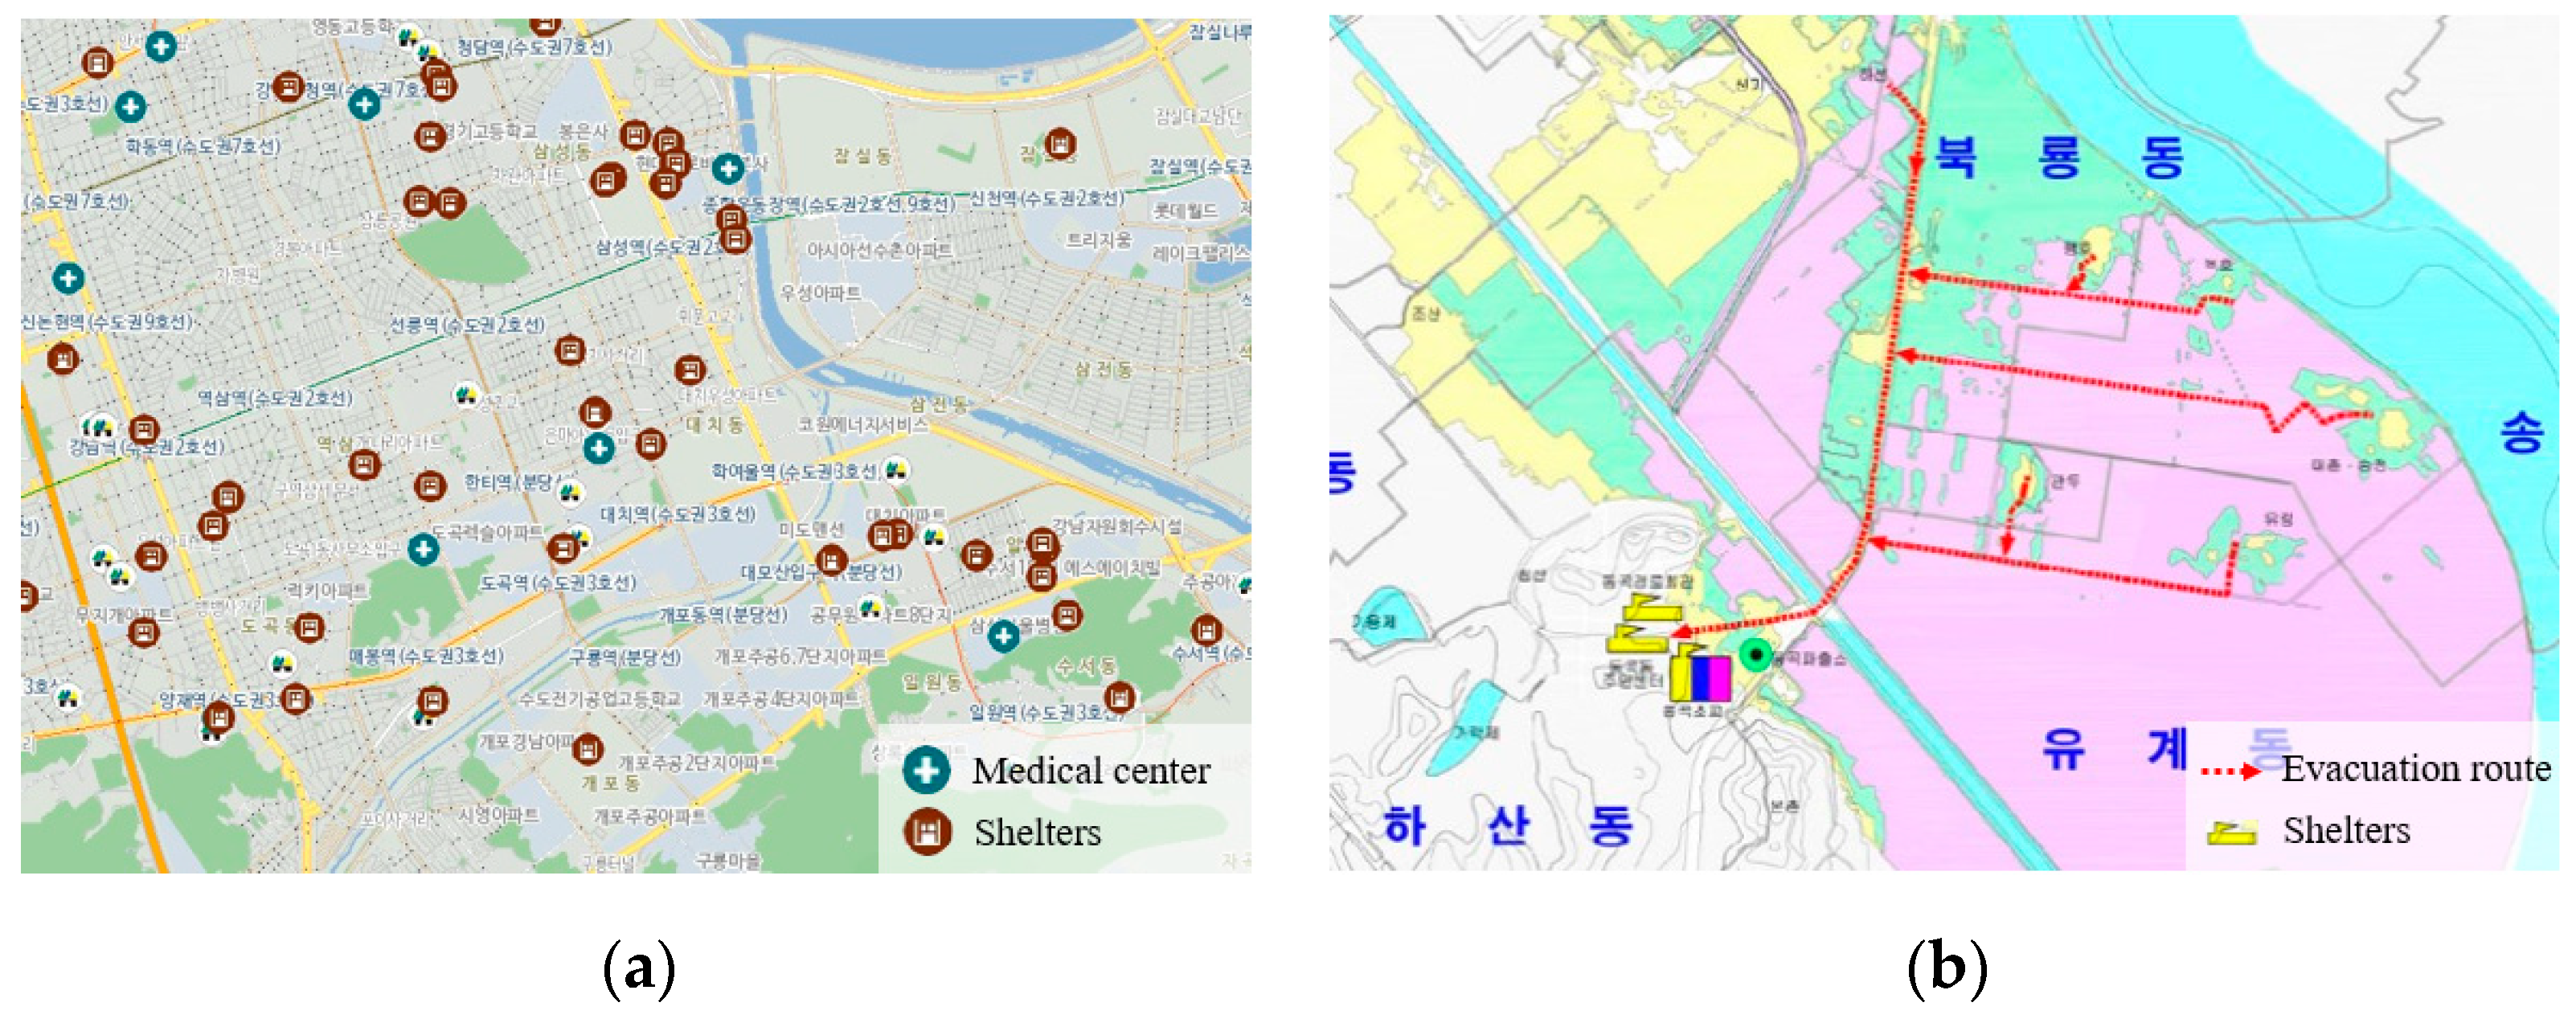
Figure 1, disaster information maps in Korea show only the locations of shelters in a particular area or provide simple directions to the shelters outside of the flooded area. It is difficult to identify the exact shelter location to which people in a particular place should move [
5]. Specifically, if only location information of shelters is provided as shown in
Figure 1a, there is a dearth of reliable information to select which evacuation path is the safest and fastest.
Figure 1b shows the direction of evacuation route with arrows, but it is not explicit to know the time it takes to evacuate or the shelters that can be reached at the shortest time. In other words, if several adjacent shelters exist, it is impossible to determine which shelter is most accessible in the shortest amount of time based on the information represented in the disaster map in
Figure 1. This lack of information may result in the loss of valuable time needed for evacuation and increase damages [
6].
In this context, this paper suggests an alternative method for constructing a flood evacuation map by incorporating the actual travel time for a given distance during a flood situation, and a more effective visualization method for a time–distance cartogram. We provide an effective flood evacuation map for Siheung city in South Korea as an empirical example; in this location, spatially concentrated heavy rain often occurs on a seasonal basis. For the flood evacuation map, we first extracted the optimal inundation shelters and routes specifically based on the evacuation time derived from the pedestrian network in residential areas. The evacuation time cartogram, which was created by replacing the geographical distance between the residential areas and the flood evacuation shelters with the evacuation time attribute, was generated to visualize evacuation routes and optimal shelters effectively. The suggested flood evacuation cartogram would provide very intuitive and effective visual information about optimal shelters and evacuation routes for those who do not know the optimal shelter and even for those who have received limited evacuation information. Moreover, it provides significant insights for policy makers wishing to construct their own flood evacuation plans.
This paper is organized as follows. In
Section 2, previous studies related to flood evacuation and the concept of a time cartogram are discussed. Then, an alternative method for creating a flood evacuation map is proposed in
Section 3. In
Section 4, the empirical application of this approach to flood evacuation mapping is shown using Siheung city in Korea as an example. Finally, the conclusions and future work are discussed in
Section 5.
2. Related Works
Various studies have been carried out on evacuation situations in flooded areas for decades, including an analysis of the service area and the accessibility of shelters, as well as the derivation of optimal evacuation routes. For example, Masuya et al. [
7] analyzed the areas vulnerable to flooding and computed their accessibility to shelters. Moreover, Zhang et al. [
8] investigated a methodology of feasible evacuation planning for dike-break flood with flooded roads extraction and flood simulation. Coles et al. [
9] integrated flood inundation modelling with service area analysis of emergency services and analyzed the accessibility of districts during flood through a network analysis. Kulkarni [
10] used elevation data to assess the safety of routes, considering the depth of the inundation. The system used for route selection in flooding situations was designed to extract the optimal evacuation route through the path and randomized segment penalty algorithms. However, it is difficult to recognize which route is more suitable based on the evacuation time because all routes are equally represented on the topographic map without considering the temporal weights for evacuation.
Moreover, no studies have been conducted thus far that effectively provide results from the flood evacuation analysis for those individuals who are actually endeavoring to escape. Although it is noteworthy that Uno and Kashiyama [
11] proposed an evacuation simulation system for disasters by visualizing an evacuation situation using 3D animation, there is still a lack of intuitive information about the optimal shelters to which people can escape. To visualize results from a flood evacuation analysis, Leskens et al. [
12] developed an interactive simulation and visualization tool for flood analysis. The arrival time of a simulated flood and the accessibility of the roads were visualized, while the evacuation route information was not included in the results. Similarly, although Zhang et al. [
8] provided information on heavily congested roads and vulnerable villages and Masuya et al. [
7] analyzed vulnerable residential houses, the evacuation time was not intuitively expressed visually in both studies.
Among the wide range of visualization techniques, in the context of flood evacuation, one useful method is a cartogram that highlights information related to the actual evacuation time instead of precise spatial information for shelters. Cartograms have become popular in various fields of application to supplement existing maps [
13,
14]. They take an advantage of visualizing geographical information with statistical information simultaneously [
15]. Although a cartogram might distort the actual geometry of the map, it is more helpful in understanding the intended attribute of the phenomena. Especially for time information, mapping time information spatially would lead to have better understanding in travel perceptions and patterns [
16]. Regarding the flood evacuation map, a distance cartogram is appropriate because it visualizes the relative time and distance and is therefore useful for identifying the actual movement of the routes and the nearest shelters within a pedestrian network during a flood. Many studies have been introduced that create distance cartograms representing various spatial relationships by replacing the geographical distance with other attributes. The methods previously introduced have mostly been limited by their unrecognizable levels of distortion or the uncertainty of the information [
17]. In addition, various visualization techniques emphasize the phenomena represented by the data, but they are not suitable for expressing temporal information [
18,
19]. A time cartogram is a map that replaces the geographic distance between locations with a time-related property; therefore, the geography is transformed in response to that property [
20].
Many studies have been carried out regarding the creation of time cartograms using information from various attributes. Shimizu and Inoue [
17] proposed a process for creating intuitive and easy-to-use distance cartograms, in which the bearing was applied to the initial value to modify the Levenberg-Marquardt method. However, this method only describes how a network can be transformed over travel time. Buchin et al. [
21] proposed a model suitable for visualizing travel times using road networks. The travel time was expressed through the length of the segments using sinusoid curves, but it was difficult to intuitively recognize the travel time because the position was fixed and there was no deformation for straight distances. Kaiser et al. [
22] proposed a modified time–distance deformation algorithm for multi-scale road networks. The technique can be used for a visualization that can improve spatial perception, but the complexity of the operation when applied to a large range of networks is limited. Kraak et al. [
23] introduced a kind of line cartogram by combining time and distance cartograms to identify the primitive characteristics of movement behavior, allowing users to explore these characteristics directly through a Web-based visualization of the movements. However, the network for the movement was not preserved.
Ullah and Kraak [
20] proposed a technique to generate the centered time cartogram using scheduled movement data. By applying this method, the station, railway, and boundary of the Dutch railway network are deformed to create a cartogram. The locations of the stations are displaced in proportion to the travel time from the departure point to each station, and the travel time is represented using concentric circles. For railway networks and the map’s boundary, the homeomorphism and topology were maintained by a visually continuous and smooth. Since the deformation criterion of railway links and station nodes in the same railway network is different, the resultant cartogram may be severely distorted. Moreover, the computation is complicated because the deformation must be performed separately. Conversely, Lee et al. [
24] analyzed and visualized time–distance-based accessibility using traffic data. The movement graph was constructed to search for the shortest path and calculated accessibility based on the travel time of the path. However, there was a limit to the effective provision of the linear path information, since the results were visualized using an areal shape.
3. Methods: Flood Evacuation Mapping and Cartogram Visualization
When a flood disaster happens, an immediate evacuation is necessary, but it is difficult to use vehicles and other forms of public transportation for evacuation. Therefore, it is necessary to find the path of the shortest distance that is available on the pedestrian level as an optimal escape route [
5]. In this study, we assumed a situation in which pedestrian evacuation is possible such as slow rising floods. This study calculated the evacuation time and extracts the escape route based on pedestrian networks, which are characterized by more detailed walkways, to create a more suitable evacuation map for an actual situation (
Figure 2).
Kim and Lee [
5] extracted the service area of the shelter after estimating the pedestrian evacuation time in accordance with the influence of the inundation depth and the slope. Similarly, as our first step in generating the flood evacuation map, the pedestrian network and Digital Elevation Model (DEM) data were used to calculate the actual escape time reflecting the slope of the pathway, as shown in
Figure 2. When calculating the evacuation time, a decrease in walking speed due to flooding is considered for those in the expected inundation area which is represented in inundation map. Moreover, for the area with deeper depth than critical inundation depth, an extremely high time cost was assigned as the evacuation time to avoid passing through those areas. After designating the flood shelters and origins, and establishing the expected flooded area as the restricted area, the Origin and Destination (OD) matrix between each individual residence and shelter can be created using the closest facility analysis. The Central Disaster and Safety Countermeasures Headquarters and the National Emergency Management Agency of Korea have recommended a 30-minute emergency evacuation. Therefore, to extract the most feasible evacuation route, the routes with a total travel time of 30 min or less were selected as the optimal routes with optimal shelters. Thereafter, the optimal shelter was displaced based on the evacuation time, and the evacuation route was deformed according to the relocated shelter to create the flood evacuation map.
3.1. Calculation of the Evacuation Time
Since walking time increases with an upward slope, the modified Langmuir’s law [
25] was applied to each link to calculate the travel time according to the slope.
Table 1 shows the equations for walking time according to a given slope by the modified Naismith–Langmuir law. According to the law in
Table 1, elevation difference should be calculated and stored in the pedestrian network to reflect the increase and decrease of evacuation time by the slope. Increased evacuation time can be calculated by overlaying the pedestrian network and DEM, assigning elevation values to each node, and calculating the difference in elevation between both end nodes of each link. [
5]
Moreover, the evacuation time increases as evacuees pass through the flooded area. In this study, the equation in [
26] is modified to calculate walking speed
during immersion which decreases linearly by the flood depth as follow:
where
is the walking speed by the flood depth;
is the depth of water; 0.011 is the decreasing rate by the inundation depth in the equation in [
26]; 2 is the average walking speed in a normal state. In previous studies [
27,
28,
29], the average speed of fast walking for adults is in the range of 1.32–2.53 m/s. To estimate travel time that increases with slope and immersion depth, the standard for fast walking is set as 2 m/s in this study. In addition, it is possible to walk only by relying on a fixed object in a waterway when its immersion depth reaches 0.55 m [
30]. Therefore, the critical water depth for evacuation is set to 0.55 m, so evacuation routes can be calculated using a detour route for areas in which flooding is expected to occur above the critical depth.
3.2. Extraction of the Optimal Shelters and Routes
In this study, residential clusters in the area where inundation has occurred in the past or is expected in the future are used to define the evacuation points for the analysis of the closest facility. Residential clusters are formed based on densely distributed housing areas. Since densely distributed housing areas are regions with a large population, they can be considered as areas in which evacuation is generally urgent. To create residential clusters, dwelling types, such as single-family houses, multi-family houses, or apartment buildings are extracted from the building layers of the Korean Road Name Address Map database provided by the Ministry of the Interior and Safety of Korea. Houses with a high possibility of flooding are selected by overlapping the buildings, the inundation trace map [
31], and the inundation map, and are assigned to the nearest shelter based on the shortest evacuation time. An inundation map represents expected flooded areas, expected damage range, and the depth of inundation, considering the traces of flooding in the past, including factors such as earthquake-induced tsunami, extreme rainfall, and the collapse and overflow of dams; meanwhile, inundation trace maps are created to show previous inundation areas, and the attributes of flooding depth and time are depicted on continuous cadastral and digital topographic maps. Because the adjacent buildings are assigned to the same shelter and therefore have a very similar escape route, residential clusters are created for adjacent building groups and the centroid of each cluster is set as the origin for evacuation.
In this study, only flood shelters which are particularly subject to altitude conditions were extracted and entered as a facility layer to perform the closest facility analysis. In the case of an actual evacuation, it is necessary to analyze the evacuation route by establishing the inundation area as the restricted area, since access to the flooded area may be prohibited. Therefore, the expected flooded areas are entered as restricted for the closest facility analysis to derive a detour route for those flooded areas above the critical water depth. The expected flooded areas are derived from the previously established inundation map (Areas comprising the inundation map are classified into inland-flooded and outwater-flooded areas and detailed expected flooded areas by frequency of occurrence and rainfall are constructed in a polygon) [
32]. Using evacuation origins and the restricted area for facilities and pedestrians, the closest facility analysis can be performed by defining the travel time of each link as the cost, and the OD matrix is then established. Consequently, optimal shelters and routes are selected with an evacuation time of less than 30 min based on the OD matrix.
3.3. Construction of the Flood Evacuation Time–Distance Cartogram
To provide intuitive and effective information on the optimal shelter and its path as people are being evacuated, it is essential to transform the evacuation map based on travel time to the shelter. For each evacuation origin, the route to the optimal shelter is deformed using the time of the evacuation, and the shelter is relocated to create time–distance cartograms for use during a flood evacuation. The process for constructing the time–distance cartogram is shown in Algorithm 1. If many optimal shelters are available for a single origin, all corresponding routes can be combined into one layer and processed at one time.
| Algorithm1 Algorithm for flood evacuation cartogram |
- (1)
Split the route links into segments at the point at which the direction changes and create nodes at the segmented locations - (2)
Assign nodes of route links and shelters to a set of points - (3)
Calculate the evacuation time distance and the time–distance coefficient based on the following equation: where,
- a.
location of the origin = - b.
location of point - c.
straight distance from origin to each point - d.
travel time from origin to point - e.
evacuation time distance = - f.
time–distance coefficient =
- (4)
Adjust the locations of based on the following equation: where adjusted location of point - (5)
Construct the displaced shelter layer by extracting the last point of adjusted - (6)
Deform the evacuation routes by reconnecting the adjusted nodes of route links
|
First, the route links for each evacuation origin are split into segments based on the point at which the direction of the link is switched, and nodes are created at the segmented locations and combined with the optimal shelter layer. Through the combination of the corresponding layers, the shelter can constitute the last node of each route. According to the station relocation principle from [
20], every point can be displaced by converting the geographical distances into evacuation time distances while maintaining the directional information of the shelters and the nodes from the origin. The geographical distance utilizes the straight-line distance from the origin to the corresponding point. The evacuation time distance
can be calculated to reflect the ratio of the time that is required to reach each segment node along the pedestrian network to the total evacuation time required to travel from one origin to an optimal shelter. While maintaining the direction of each point from the origin, the straight-line distance from the origin to each point is replaced by
to adjust the position of the point. The layer with relocated shelters can be created by extracting the last node from a point layer, whose location has been adjusted. It is also possible to reconfigure nodes that have been relocated to deform the evacuation routes. Even in cases in which there are multiple evacuation routes to different shelters, if the directions of the shelters are similar, some sections are moved through the same links, and information on such redundant paths must be preserved after the link is deformed. If the link is modified by the proposed method, it is possible to preserve the redundant path since it is modified by applying the same time distance coefficient
. Although the post-transformed link shape is distorted for the existing path, it is easy to recognize the evacuation route because the direction information from the origin is preserved for all changing direction points of the link, that is, all the nodes comprising the route link.
After the time–distance-based cartogram has been created through the relocation of shelters and link deformation, five-minute intervals of concentric circles can be added to provide direct information on the evacuation time to optimal shelters.
4. Empirical Applications
4.1. Results of Empirical Applications
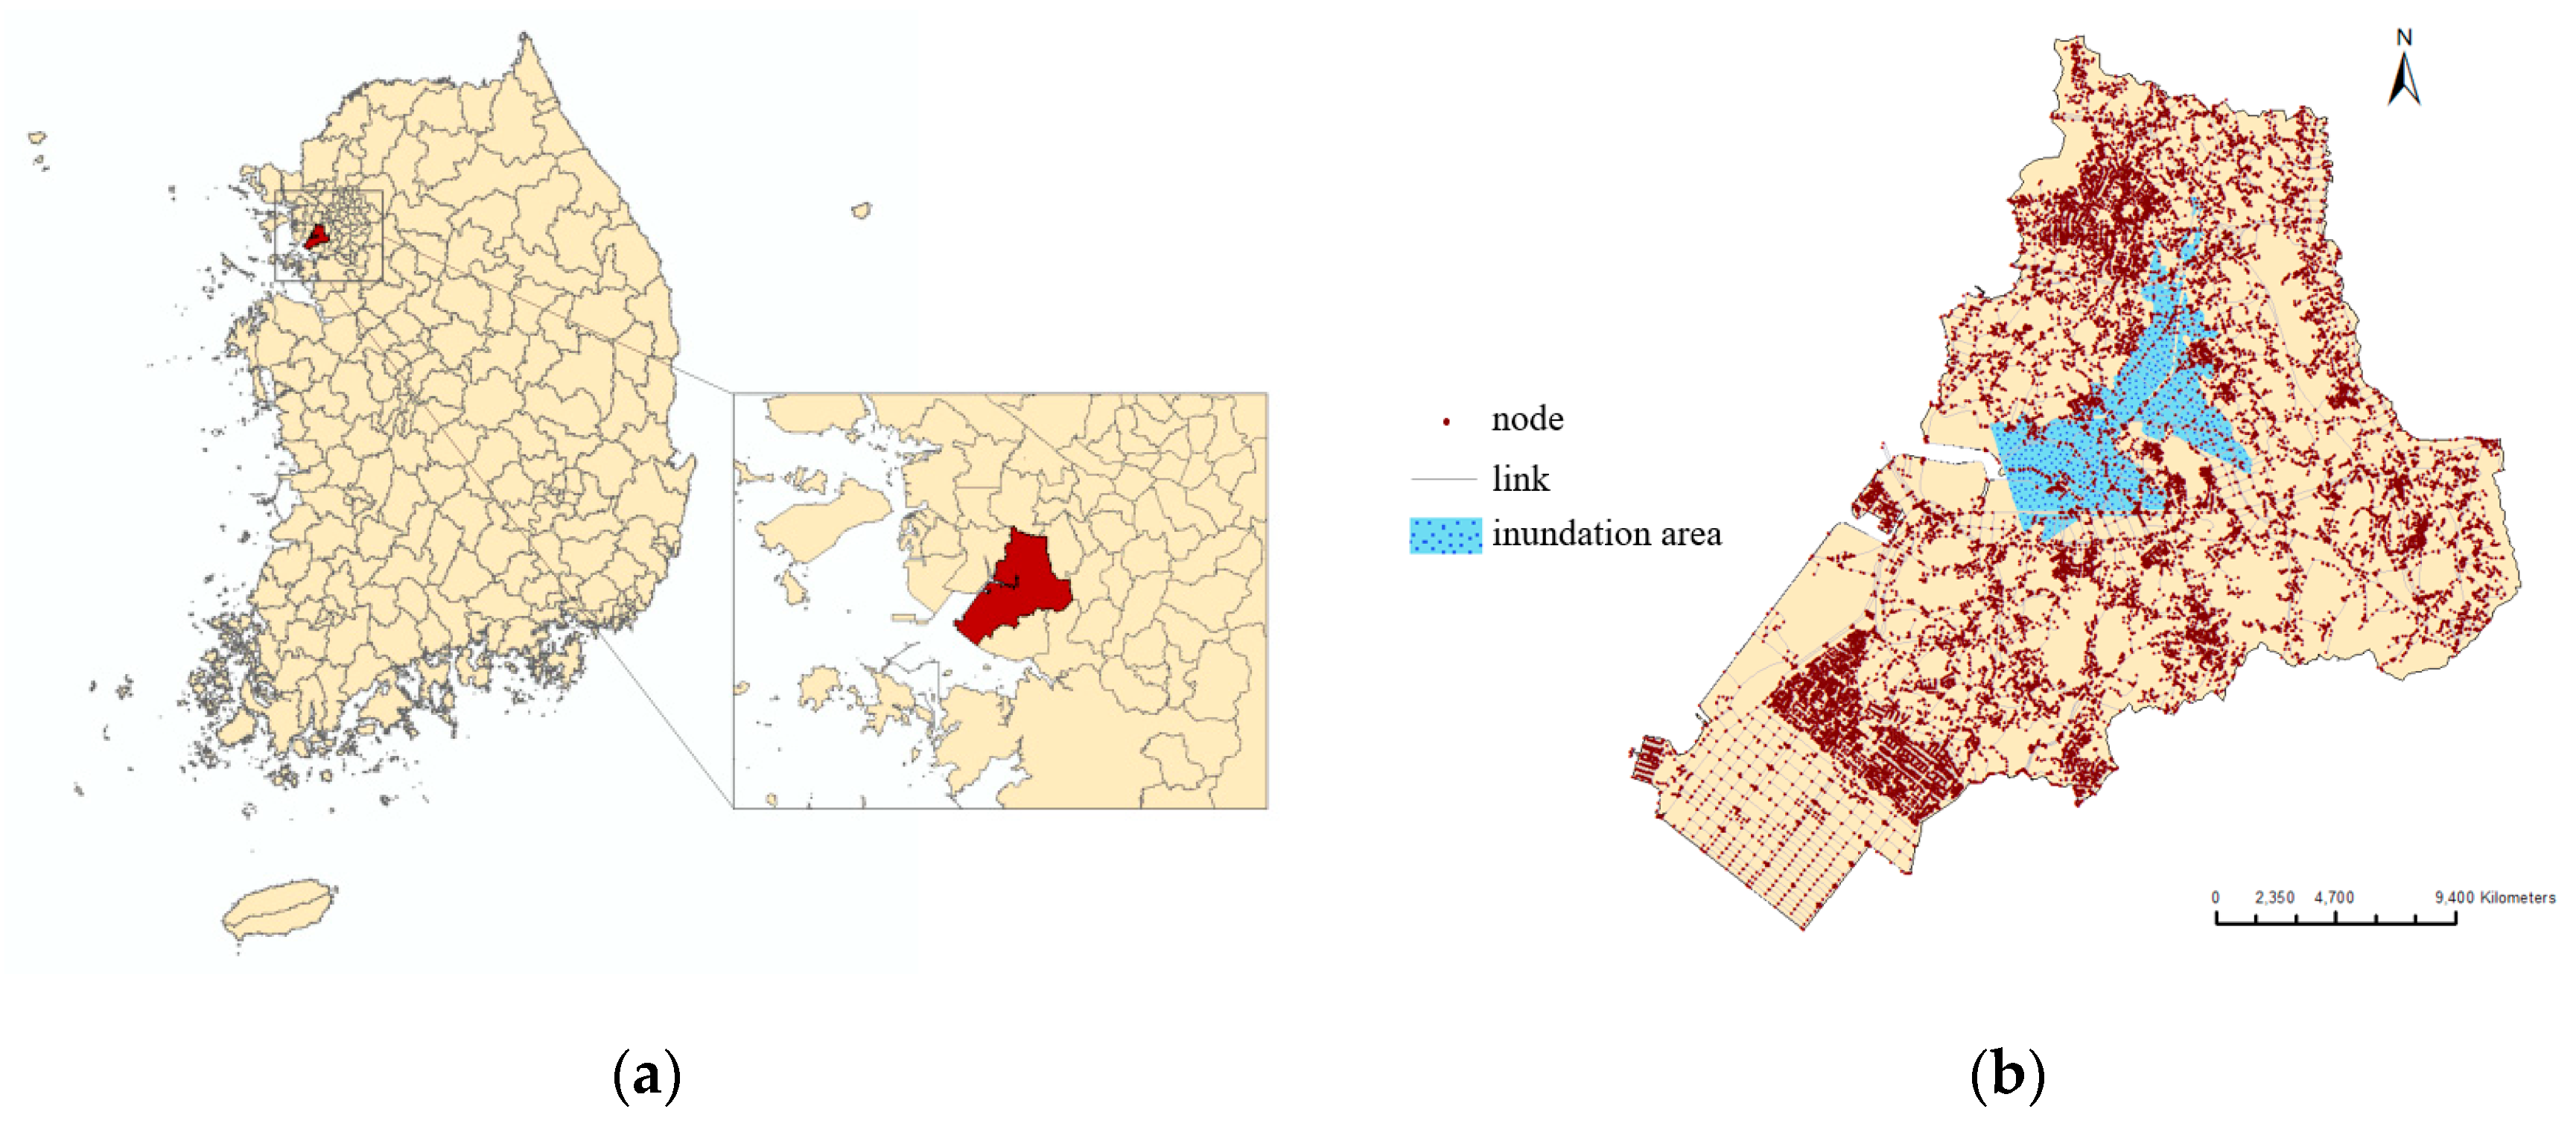
In this section, we present an empirical application for the proposed approach to flood evacuation mapping using the case of Siheung, a coastal city in South Korea. Siheung is suitable as a study area from which flood evacuation maps are created, as it is considered to be at high risk of flooding due to its small number of mountainous areas and large number of coastal reclamation sites [
32]. According to the guidelines for disaster maps provided by the Ministry of the Public Administration and Security [
33], a disaster map should be generated for severe instances of inundation. In addition, Siheung is affected by river flooding. Therefore, the expected inundation area is established using an inundation map, where 500 mm is the maximum rainfall and 10 years is the maximum frequency.
Figure 3a shows Siheung in South Korea and
Figure 3b represents the pedestrian network with the expected outwater inundation area based on a 500 mm/10 year-frequency for Siheung.
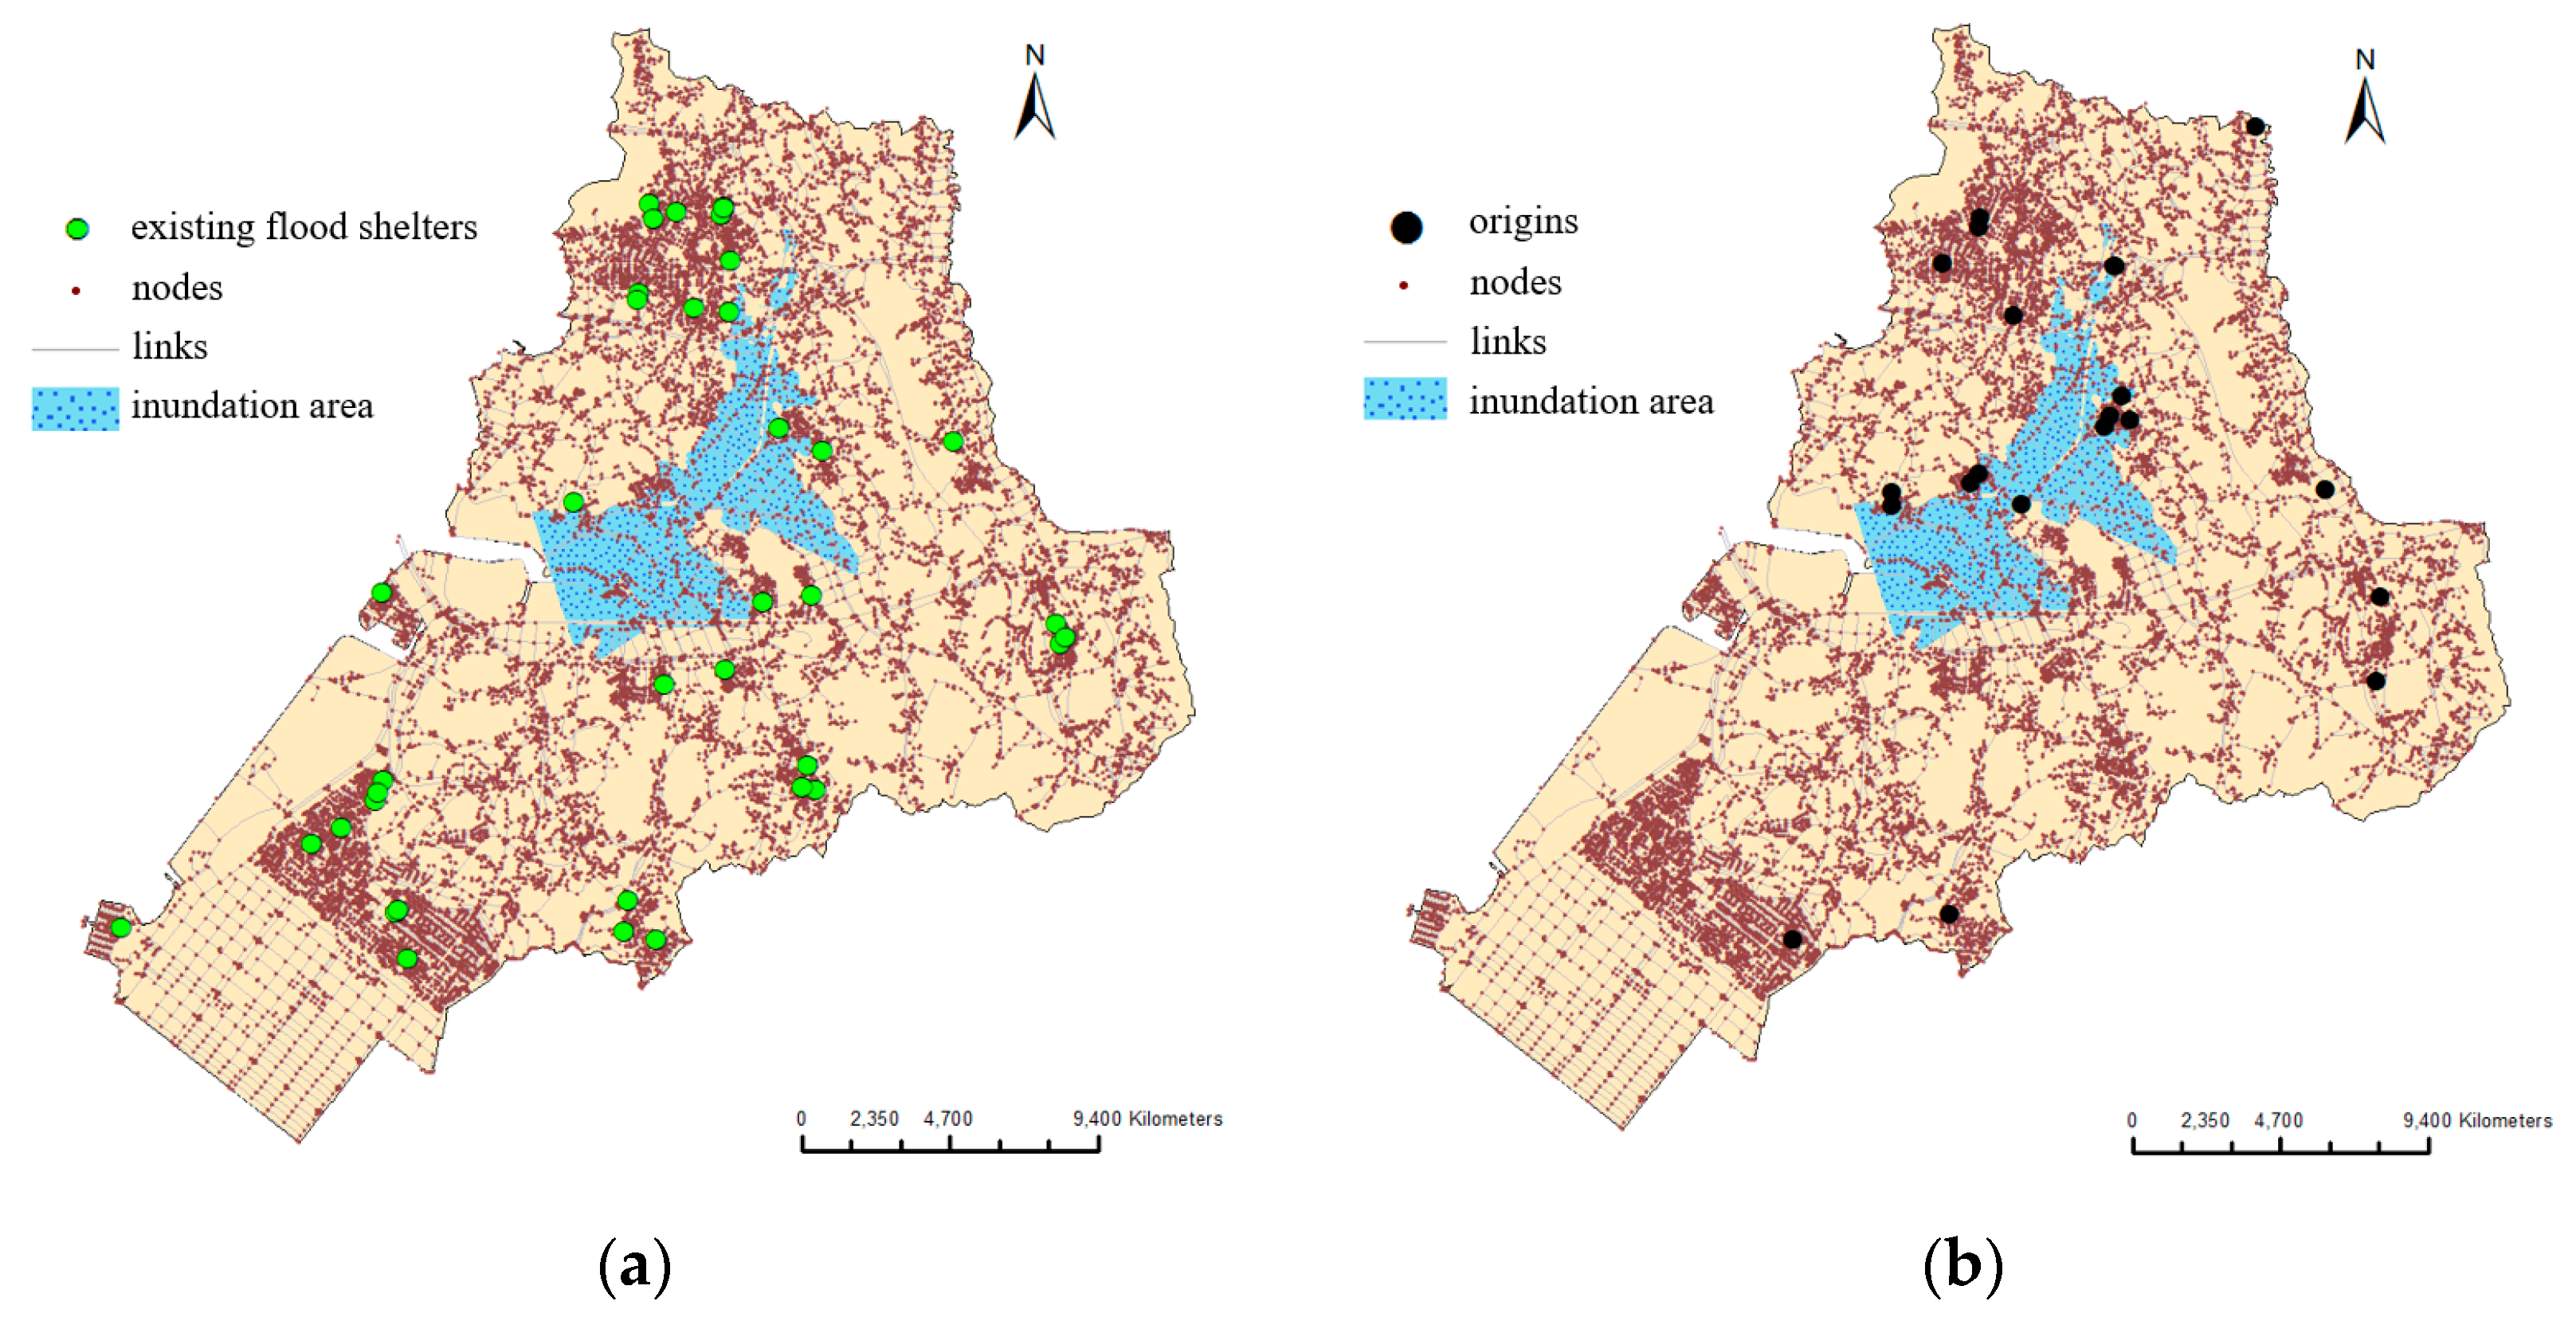
A total of 38 flood evacuation shelters were designated in Siheung (
Figure 4a). Existing flood shelters in
Figure 4a are distributed throughout Siheung, including the expected inundation areas. Flood shelters are designated with sufficient altitude due to the nature of the flood, and more shelters are concentrated near dense residential clusters and the expected inundation area which has a high probability of damage. The shelter layer was used as the facility data for the closest facility analysis. To establish the evacuation origin points based on the residential clusters, a group of buildings classified as ‘housing’ were first extracted from the building layer of the Korean New Address Map database. The centroid of the clustered buildings was then extracted and the optimal shelter and corresponding evacuation route from the residential cluster centroid are derived by conducting the closest facility analysis. Since the analysis shows that adjacent buildings are allocated to the same shelter and their evacuation routes are also equivalent, it is reasonable to combine buildings into one group to create a cluster. The centroid of each residential cluster was used as the evacuation origin point, as shown in (
Figure 4b), which shows 20 points of evacuation origins for Siheung. Even areas that are less likely to be flooded because they are far from the expected inundation area may be additionally selected as origins since they are dense residential clusters which require prearranged evacuation plans.
Using the pedestrian network and DEM with a 90m × 90m resolution [
34], the altitude value was assigned to each node on the network, such that the varying elevation is stored in the pedestrian routes. Then, the evacuation time per link was calculated based on the slope by applying the formula in
Table 1. Using the inundation map, the evacuation time for the links that were included in the expected inundation areas could be calculated to consider a reduction in walking speed in the flooded area. Moreover, a portion of the expected flooded area was defined as a restricted area, which was classified as such once it exceeded the critical water depth. Based on the pedestrian network, which includes evacuation time and restriction attributes, a closest facility analysis between the shelter and the evacuation origin is performed. ‘Origin 16’ is located near the inundation area, and the route to the nearby shelters is often through the inundation area.
Figure 5 shows the change in the optimal evacuation route both with and without the inundation area restriction for ‘origin 16’. To intuitively show that the optimal shelter and evacuation route is altered by the inundation area, the route to 20 nearby shelters was derived for two cases without limiting the maximum evacuation time for ‘origin 16’: (1) No reflection of the inundation area (
Figure 5a), and (2) Reflection of the decrease in walking speed according to the water depth of the inundation area (
Figure 5b). As shown in
Figure 5b, when the flooded area is introduced, it can be confirmed that a new route bypassing that area is then derived as a new optimal evacuation route.
Next, the flood evacuation cartogram was generated to achieve a better understanding of the actual shortest evacuation paths in terms of walking mode and to quickly identify the nearest shelter in a flood emergency. An evacuation time of half an hour was defined as the threshold for extracting the optimal shelters and their routes. Then, shelter displacement and route deformation were efficiently performed using the suggested distance cartogram algorithm shown in Algorithm 1.
Figure 6 shows the result of relocating the shelter and transforming the escape route by substituting the geographical distance with that of time while maintaining the original direction for ‘origin 16’.
Figure 6 shows the time required to reach each shelter from ‘origin 16’ by adding isochrones to the result, which was derived from the optimal shelter and its route based on the geographical distance. ‘Siheung Maehwa Elementary School’ which is closer in terms of geographical distance seems to be the optimal shelter. However, in an actual situation, considering the restricted area and varying time distances for evacuation, the escape route to ‘Siheung Maehwa Elementary School’ would actually take longer because the route passes through the expected flooded area. Therefore, it can be concluded that ‘Siheung Maehwa Middle School’ is more suitable as an optimal shelter, as shown in the evacuation time cartogram (
Figure 6b).
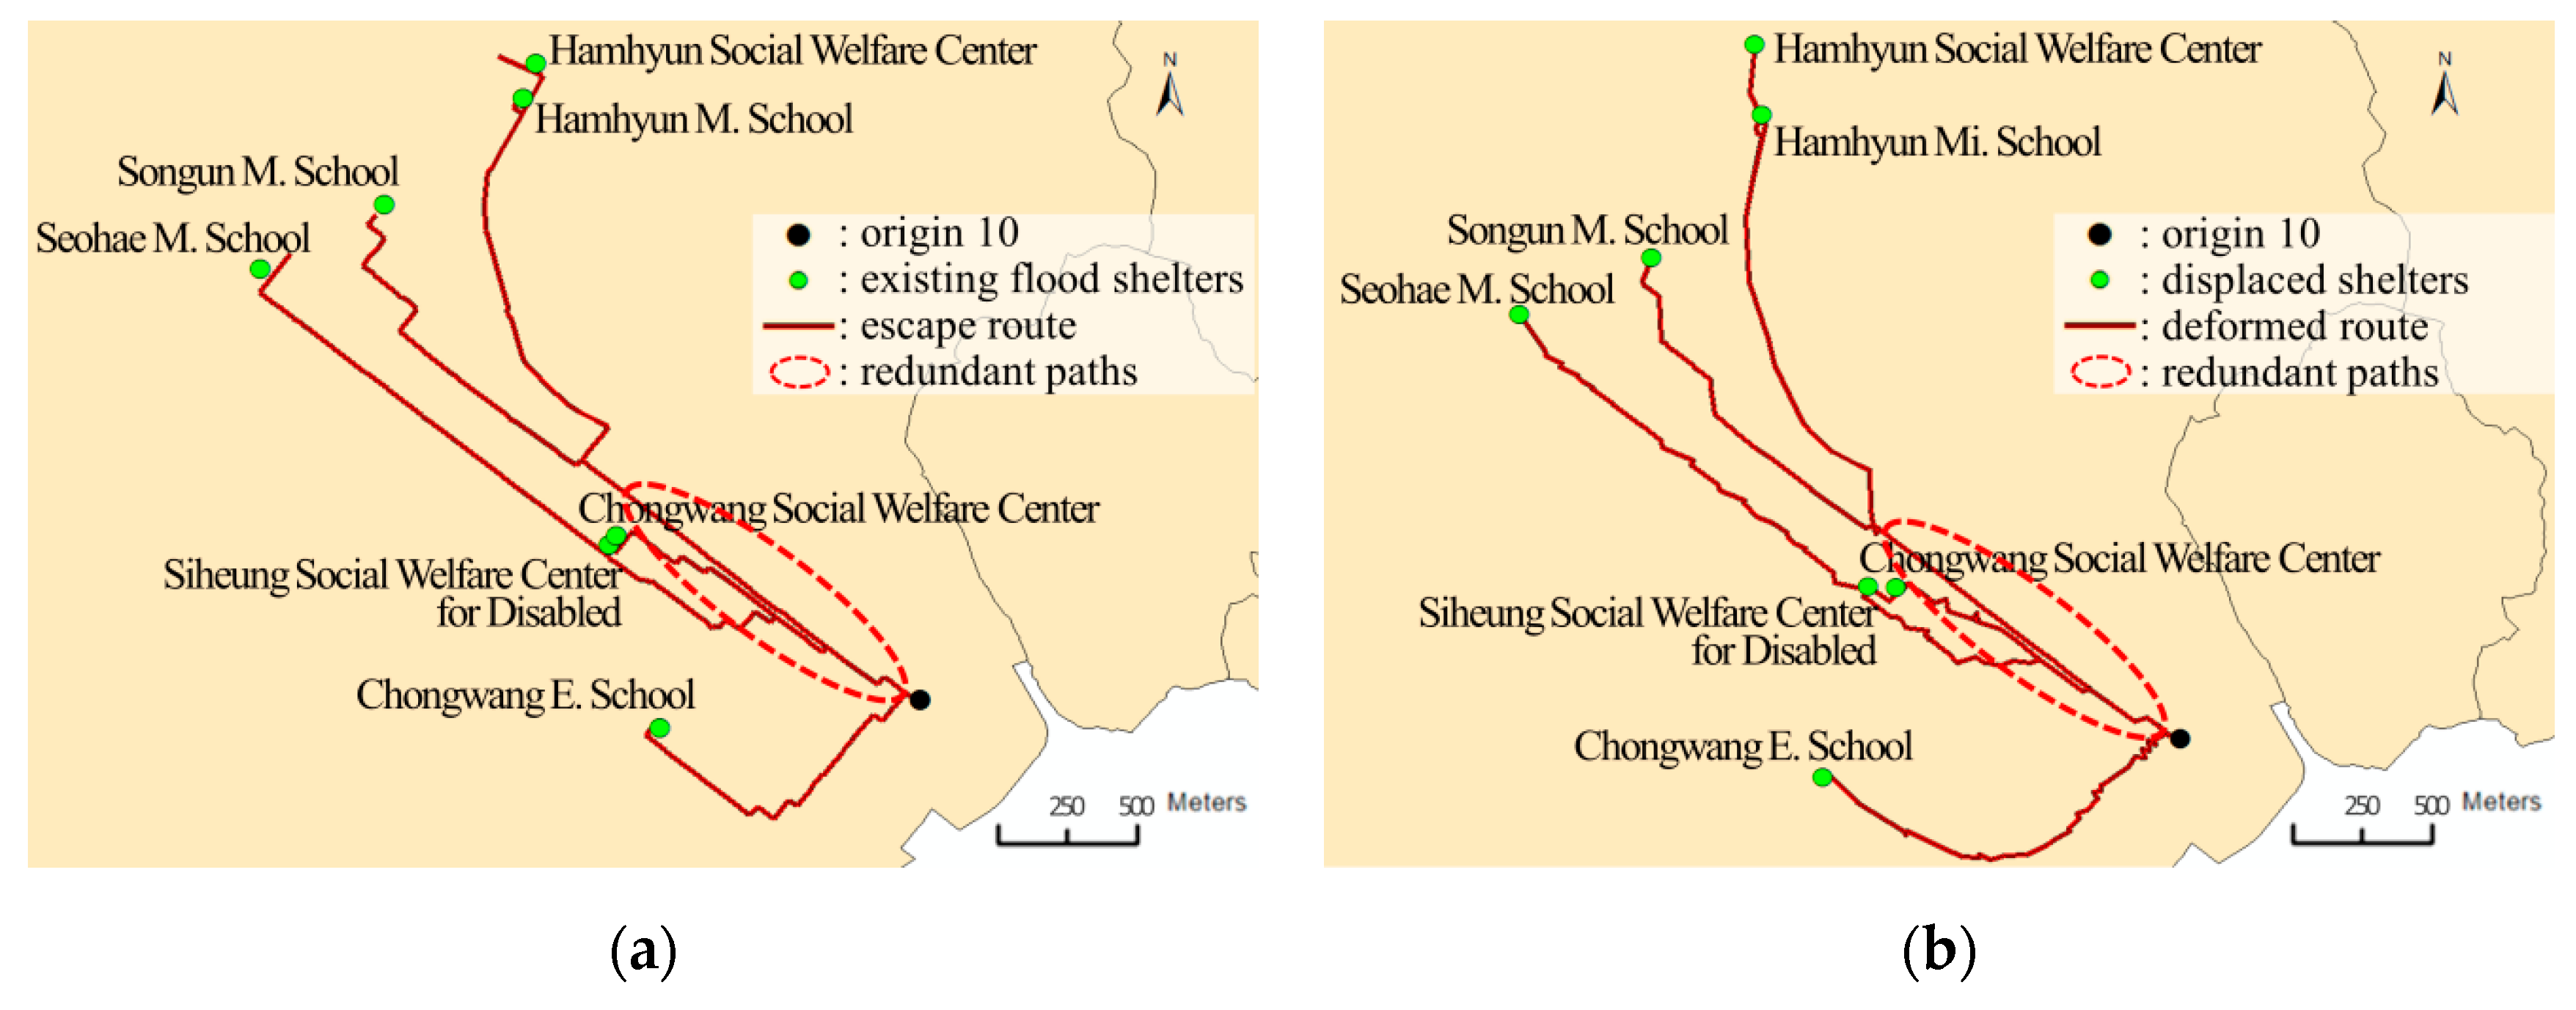
Figure 7 shows the original escape routes leading from ‘origin 10’ to the existing shelters and deformed routes based on actual evacuation time. For the deformed escape routes, the locations of the existing shelters were relocated if more time is required to reach them, in reality. This is because the lengths of the route links have been modified based on the actual escape time. Moreover, since the same time–distance coefficients were applied for all nodes of the route, it is possible to preserve the redundant routes passing through the same links toward ‘Siheung Social Welfare Center for Disabled’ and ‘Chongwang Social Welfare Center’. Therefore, the cartogram algorithm minimizes the distortion created by the transformation of the paths and preserves the topological characteristics.
4.2. Discussion of Flood Evacuation Cartograms
Table 2 illustrates the flood evacuation maps created for five different origins using the suggested algorithm for the flood evacuation cartogram. Nine of the total twenty origins were still assigned to the same shelter locations and optimal routes because only one shelter could be reached within 30 min. In addition, six origins were excluded from the cartogram because the geographical and evacuation time distances are not significantly different. For five origins (6, 9, 10, 13, 16), which reveal a significant difference between geographical and evacuation time distances, the optimal shelters were relocated and the route links were deformed to create an evacuation time cartogram to provide an intuitive and effective representation of escape route information.
For ‘origin 6’, it is noted that the geographical distance-based optimal shelters and the evacuation time distance-based optimal shelters are slightly different because the origin and the optimal shelter are not affected by the expected flooded areas. However, the reversal of the shelters still occurs. Interestingly, for ‘origin 9’, if the evacuation plan is devised by referencing a geographical distance-based evacuation map, it is highly likely that the evacuees will be guided to the nearest ‘Nongok Middle School’, thus over the capacity of that shelter. As shown in the cartogram of ‘origin 9’, it is easy to realize that the distances to shelters are different, but the evacuation times to those shelters are similar. Specifically, it can be visually observed that three viable evacuation shelters are all located within 30 min’ travel time and thus, guidance for the distributed evacuation routes to any of the shelters can be provided. ‘Origin 10’ is also likely to attract evacuees to ‘Chongwang Elementary School’, which is geographically closer than other shelters, but in reality, ‘Siheung Social Welfare Center for Disabled’ or ‘Chongwang Social Welfare Center’ are more appropriate options in terms of evacuation time. Based on the evacuation time for ‘origin 13’, the optimal shelter is ‘Mokgam Elementary School’ which is located in ‘Nongok-dong’, rather than the ‘Mokgam Social Welfare Center’ which is geographically closer and located in ‘Chonam-dong’ the same administrative district. Although the relocated optimal shelter, ‘Siheung Maehwa Middle School’, is located within a different administrative district than the residential areas in which ‘origin 16’ is situated, it is selected as the optimal shelter with shorter evacuation time. This implies the cartogram can deliver the information about an optimal shelter and its actual route more intuitively than a classic topographic map, even if shelters are not within a same administrative district than the residential areas in which origins are located.
Not all of geographic features, including the road network and administrative boundaries, were transformed as deformed solutions based on the actual evacuation time. Therefore, there might be a visual difference between the deformed routes and displaced shelters and the reality with which people are familiar. This is very common regarding the intended distortion of reality, which occurs in a distance cartogram. Alternatively, it is generally recommended to use additional information to counteract the lack of visual familiarity so people can move along the deformed route on the evacuation map without delay. For instance, adding some important POI (Point of Interest) information on the escape routes could be helpful to mediate the effect of shelter and link deformation.
In this study, the evacuation time per link according to slope was calculated using DEM as reference data for altitude value. It is assumed that the resolution of DEM which is similar to the mean length of segments is not too low for assigning altitude value to end nodes of segments. However, by using a high-resolution DEM, new nodes can be created at the point of change in altitude value, and the link is split with those nodes. With these newly processed nodes and links as input data, it is expected that changes in travel speed and evacuation time according to the slope can be measured in detail. In addition, although this study assumes a pedestrian evacuation situation for ordinary adults, various alternatives may exist in addition to vehicles and pedestrians. For the further study, through applying behavior information according to travel mode such as speed, or using different type of network, the study can be extended to cartogram construction considering evacuation situation by other travel modes in detail.
5. Conclusions
This paper addressed an alternative method for generating flood evacuation maps to effectively visualize the optimal shelters and routes for residents in emergencies caused by flooding. To extract the optimal shelters and escape routes, information regarding the elevation and the pedestrian network were combined to derive the actual evacuation time. Moreover, expected inundation areas are also considered restricted when identifying an escape route. Therefore, the actual escape time, which considers the variance in walking speed based on flood depth, was successfully modeled to create the flood evacuation map. Further, the optimal routes to accessible shelters within the standard maximum time were presented for use in an actual evacuation based on evacuation origins. Moreover, the algorithm used to create the flood evacuation cartogram was developed for a more effective visualization of the optimal evacuation shelters and routes. Optimal shelters in the suggested cartogram are much more clearly and easily recognized than the closest option based on geographical distance because they can preserve the directional information related to the origins. Since the same time–distance coefficients have been applied to all nodes along the route, the topological characteristics between the origin and the shelter are well maintained.
For an example of its empirical application, five flood evacuation maps were constructed for Siheung city of Seoul. As a result, there is a position reversal in which the shelter perceived as significantly closer and located the shortest distance from the origin but with a relatively longer evacuation time is further away than other shelters in the flood evacuation cartogram. In other words, the flood evacuation cartogram is able to convey more effective and intuitive information regarding the optimal shelter, which is actually closer based on actual evacuation time, although the geographic distance from the origin is longer. In addition, because the routes are deformed using the same time–distance coefficients as the displaced shelters for all nodes on the route links, the distortion of the escape route could be minimized and information regarding redundant routes could be preserved.
Although the proposed cartogram can effectively identify the evacuation shelters and routes that are optimally determined, there is the visual gap of evacuation routes and the reality. However, this can be complemented by representing auxiliary information such as POI on the flood evacuation cartogram. In additoin, further consideration of more dynamic factors, such as immersion speed, may improve the accuracy of evacuation time calculations. We believe that the suggested flood evacuation cartogram is significant, in that it provides practical flood evacuation information very effectively and intuitively for people in a real flooding situation. Our empirical results also provide helpful insights for disaster authorities or policy makers to facilitate the creation of more efficient evacuation plans. Nevertheless, additional investigation will be necessary if we wish to evaluate the actual effect of the information delivery for such a cartogram approach on users.


