Assessment of Enhanced Dempster-Shafer Theory for Uncertainty Modeling in a GIS-Based Seismic Vulnerability Assessment Model, Case Study—Tabriz City


Abstract

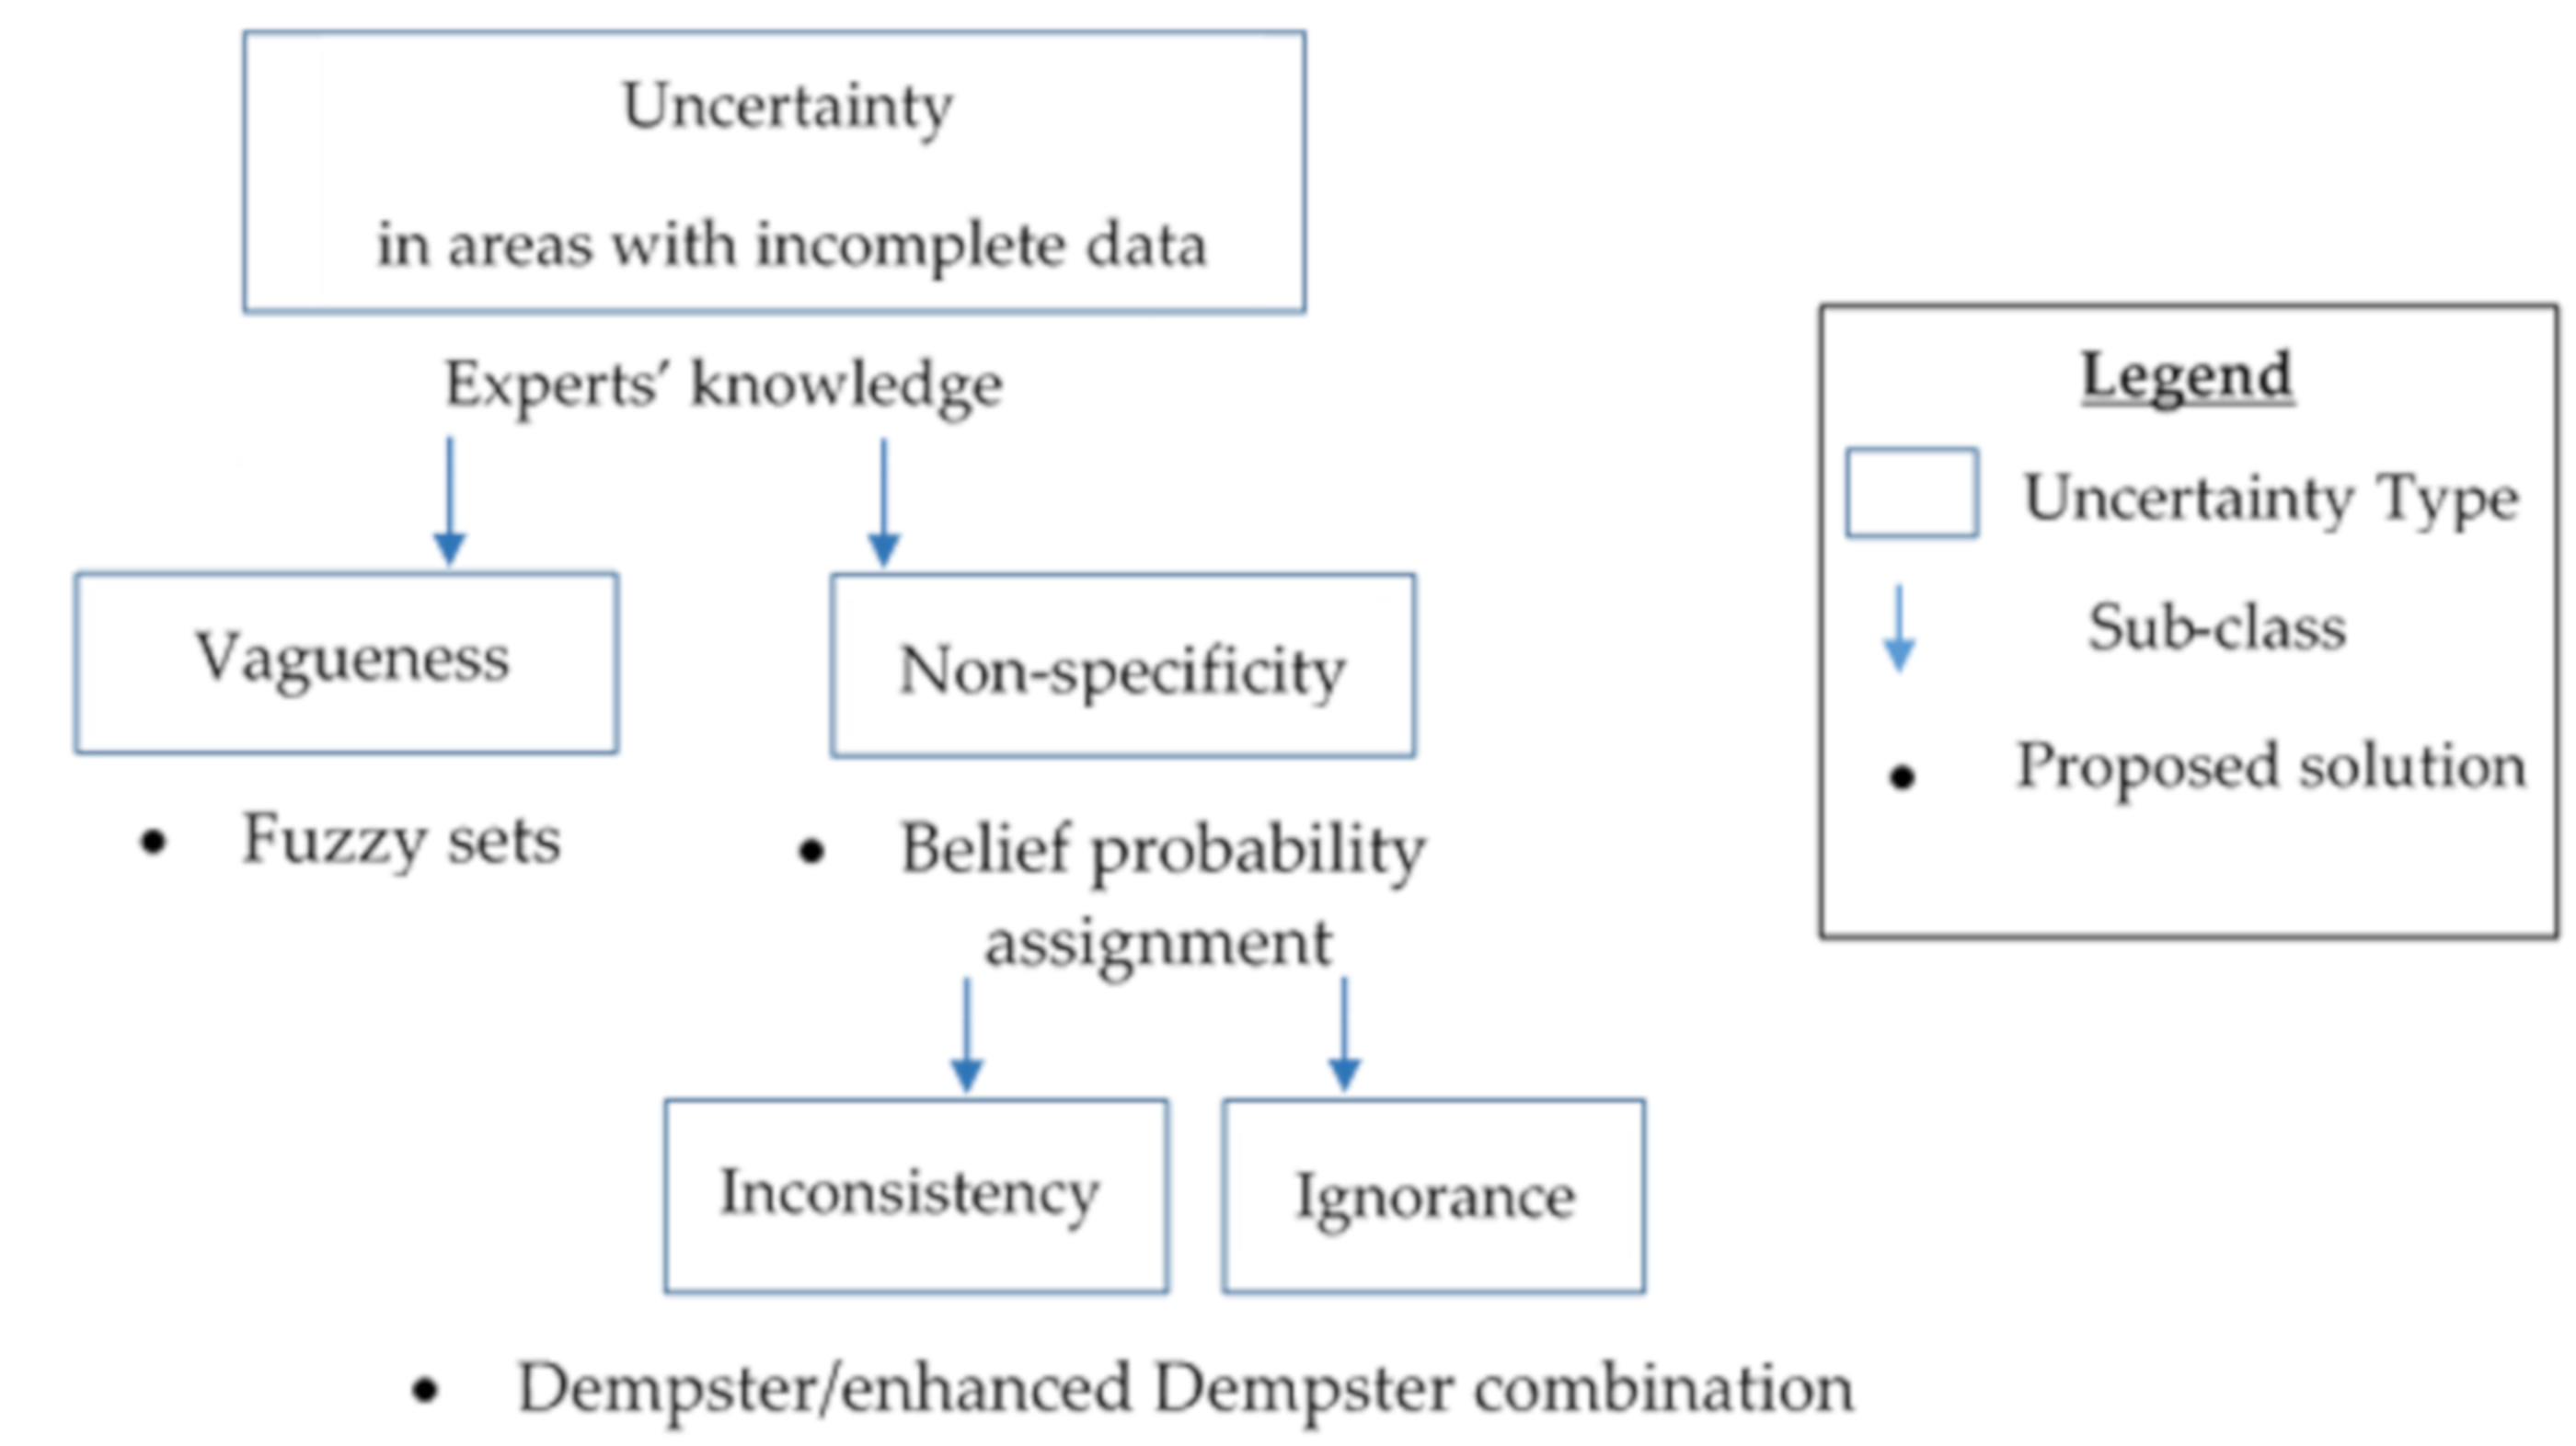
1. Introduction
2. Materials and Methods
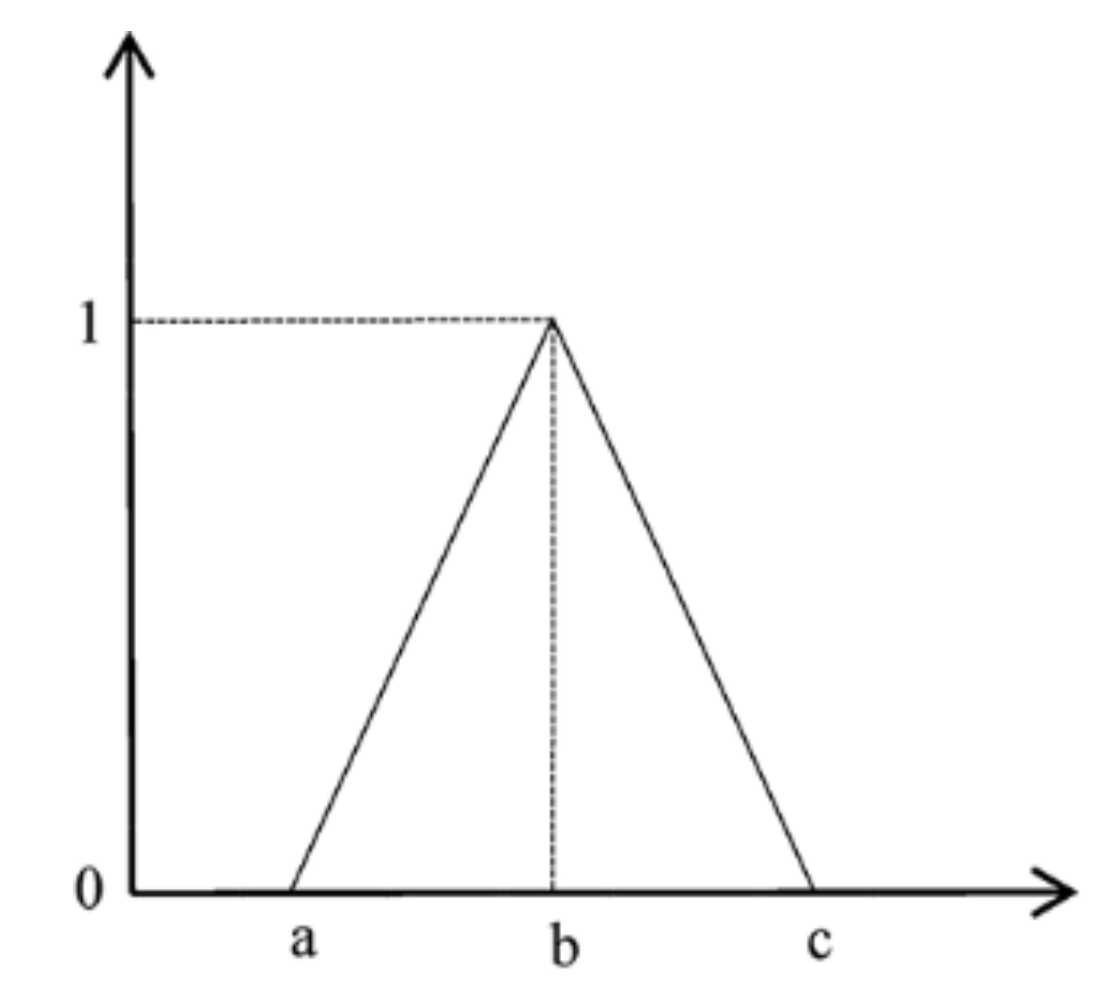
2.1. Fuzzy Sets Theory
2.2. Dempster- Shafer Theory
2.3. Discounting Rule
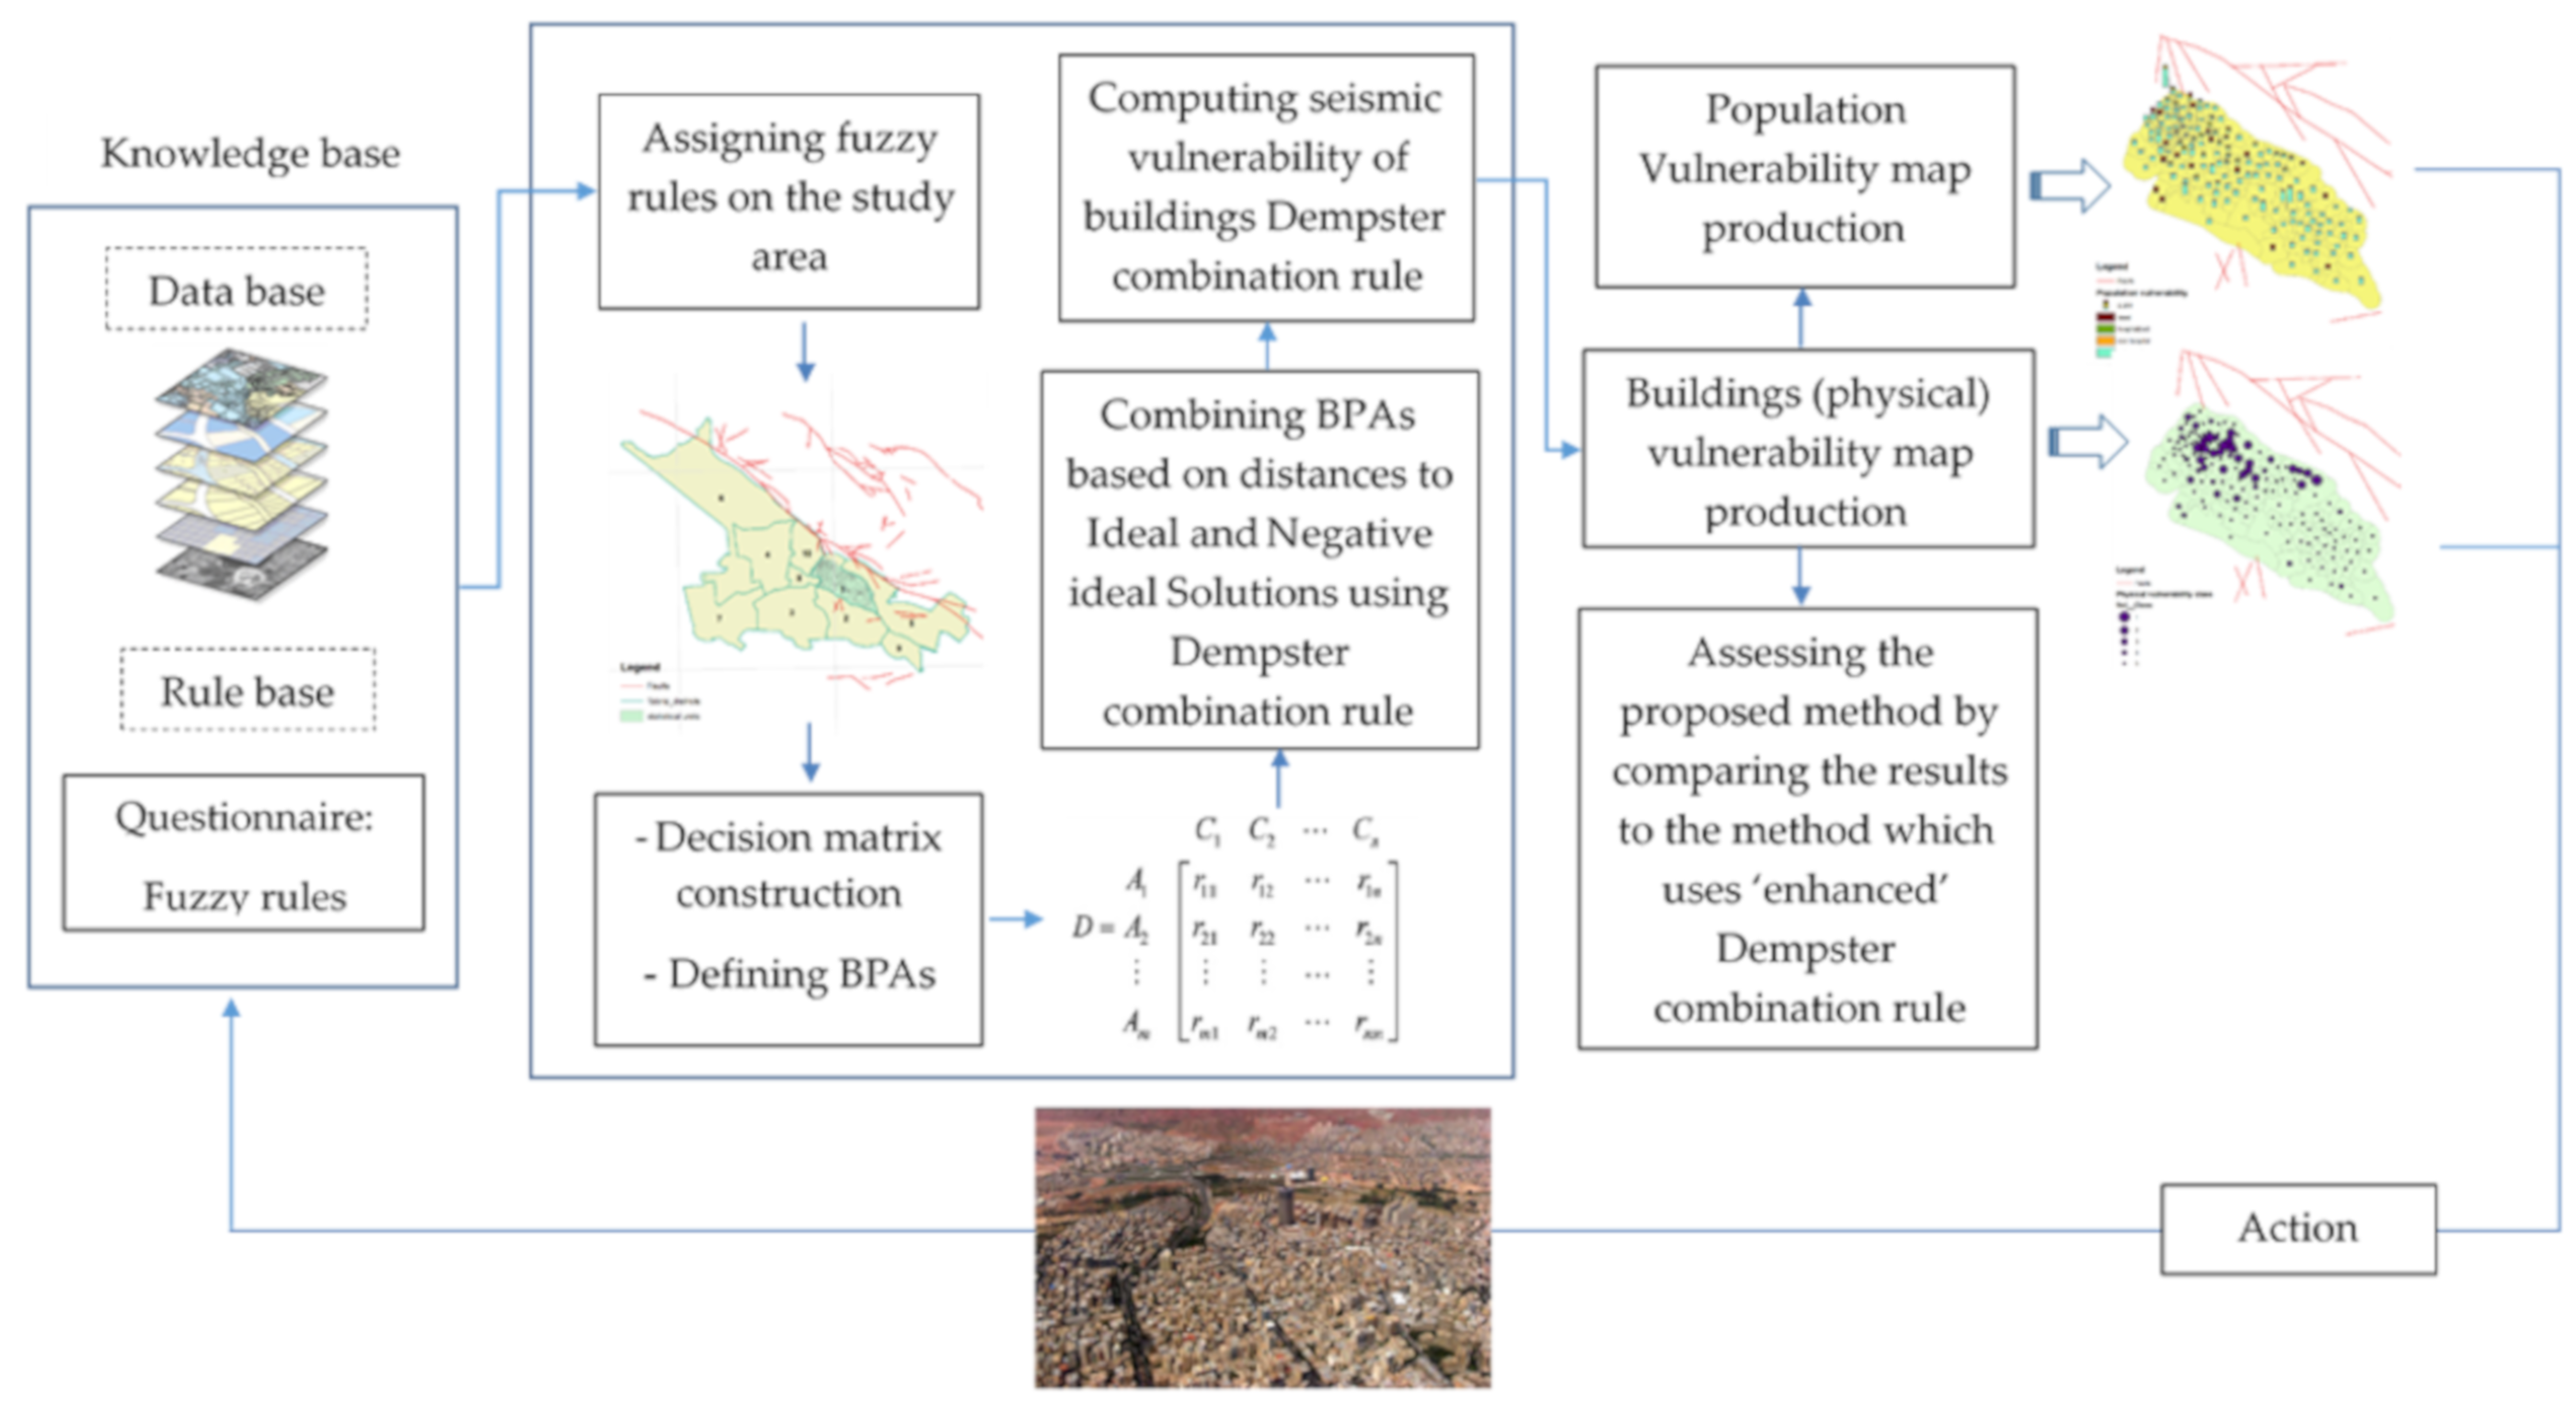
2.4. The Proposed Method
2.5. Study Area
3. Results and Discussion
3.1. Efficiency of Dempster Combination Rule in Seismic Vulnerability Assessment of Buildings
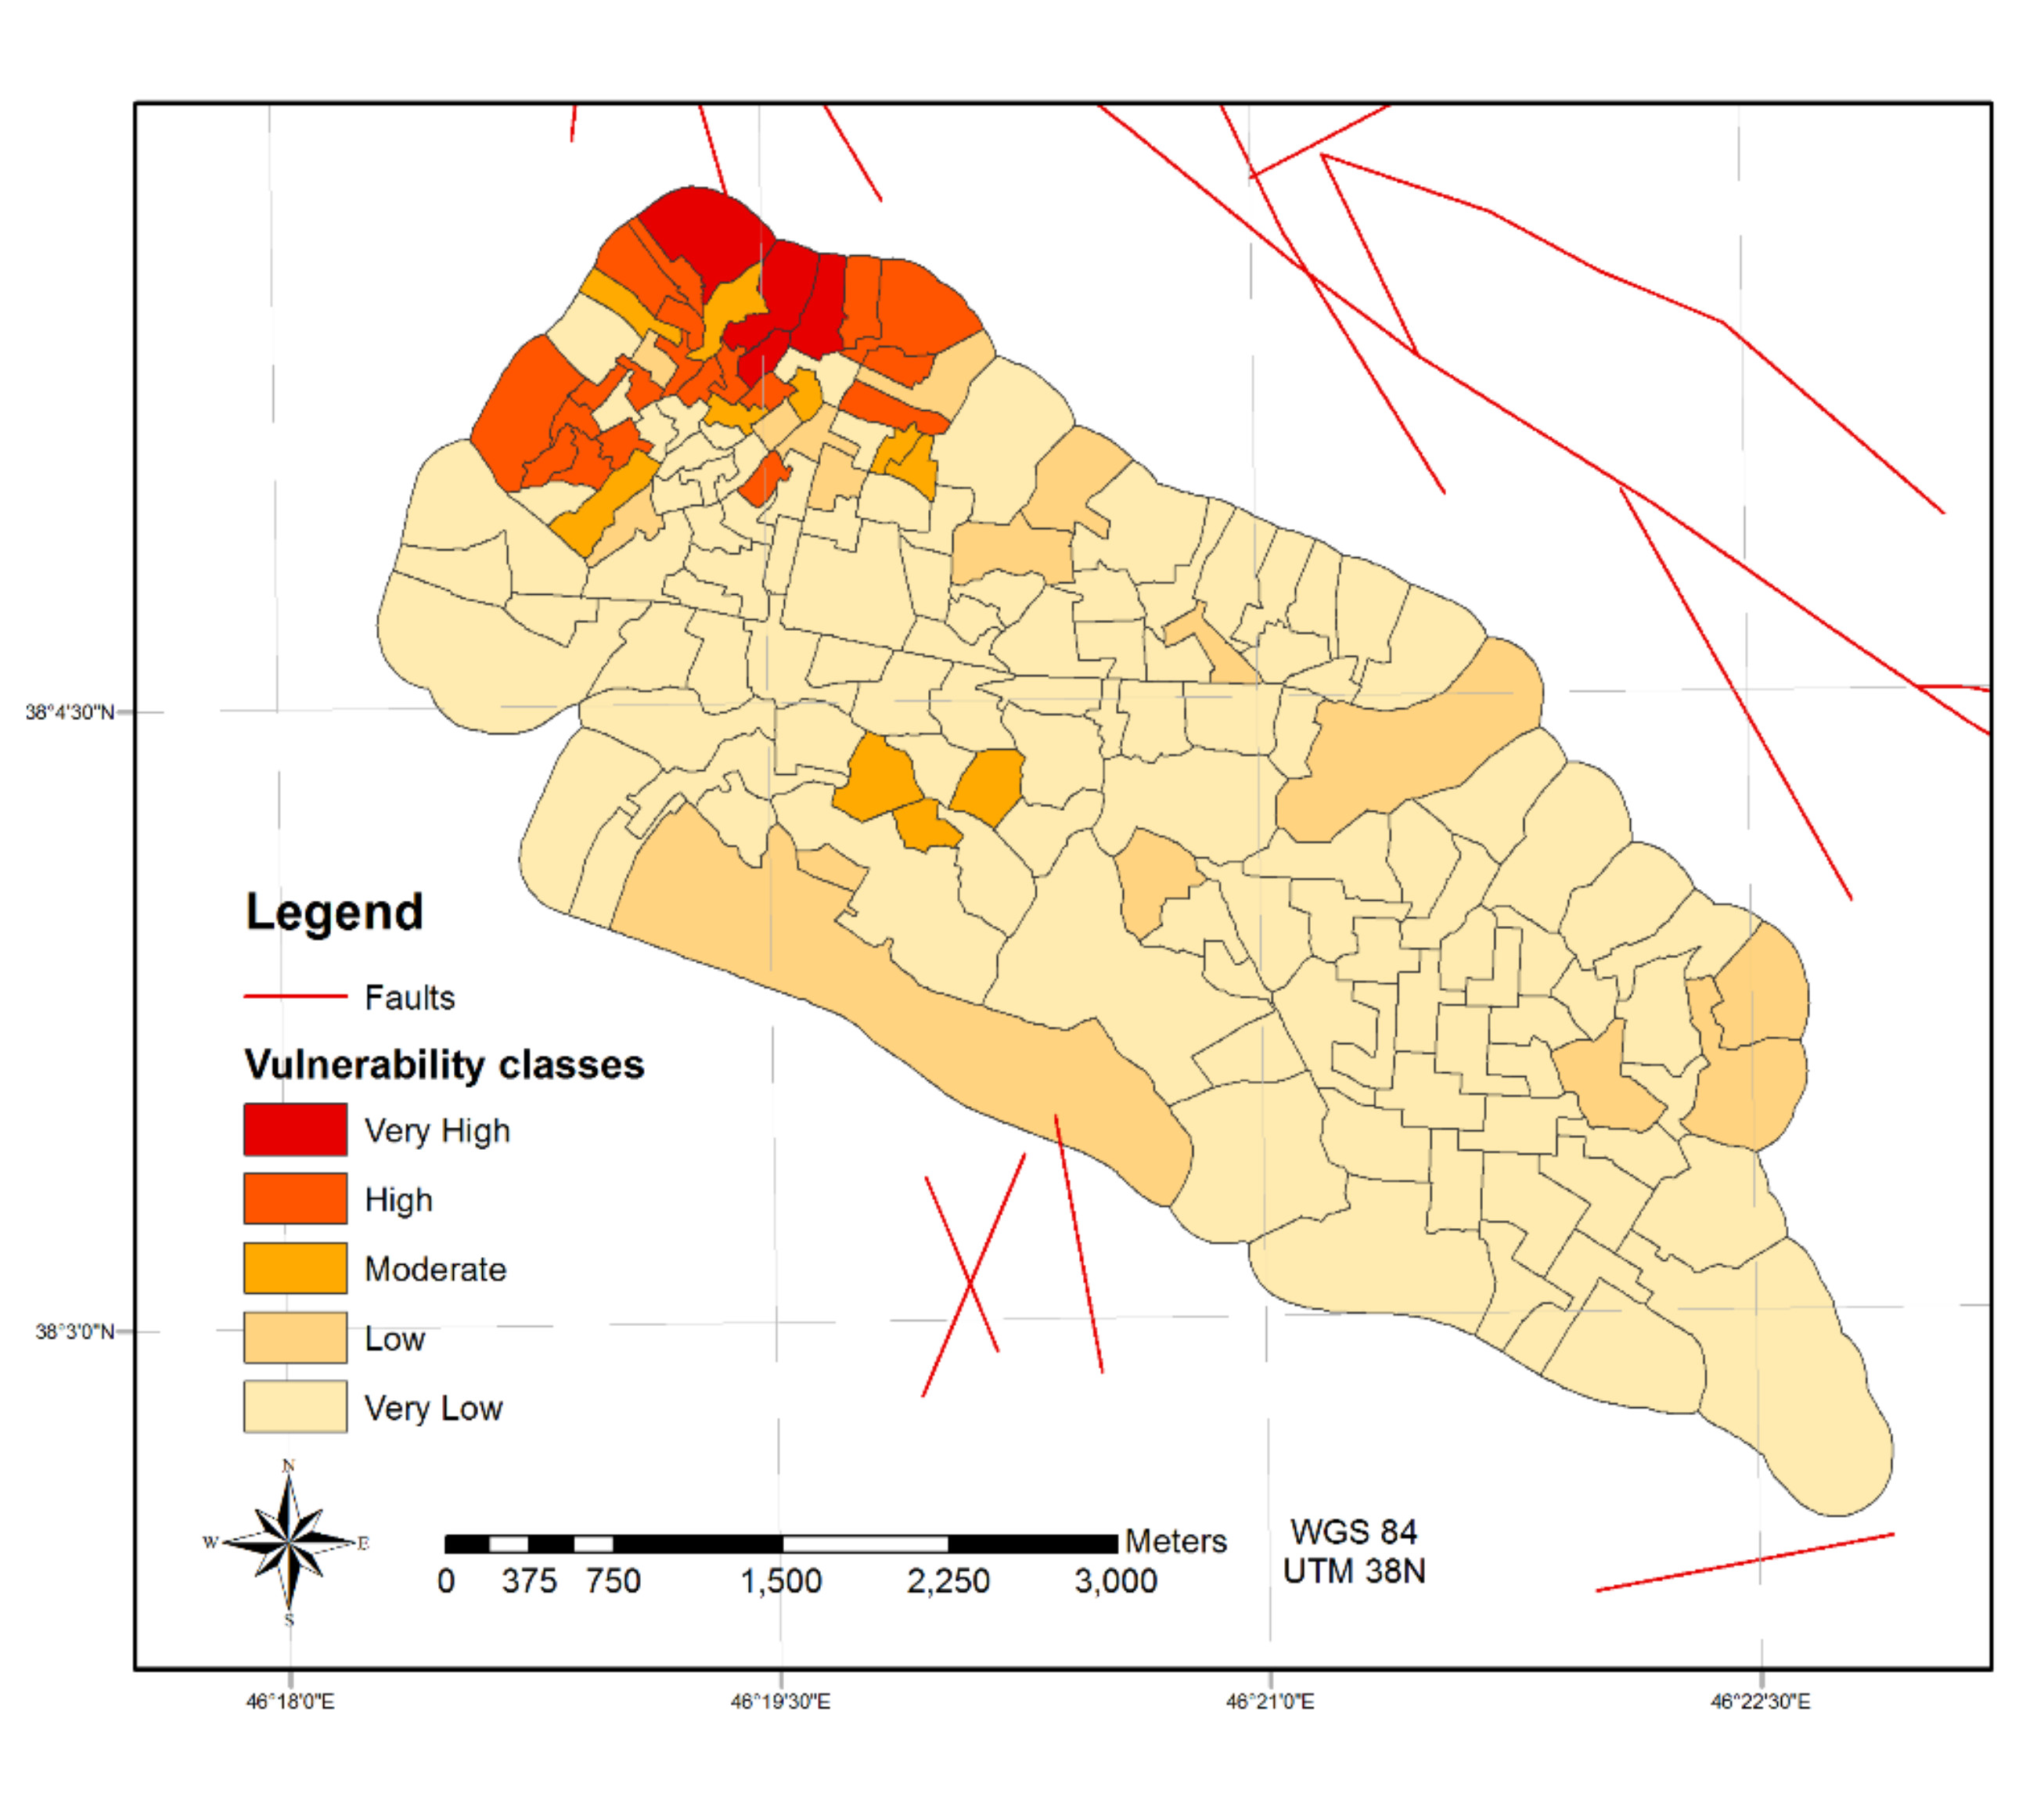
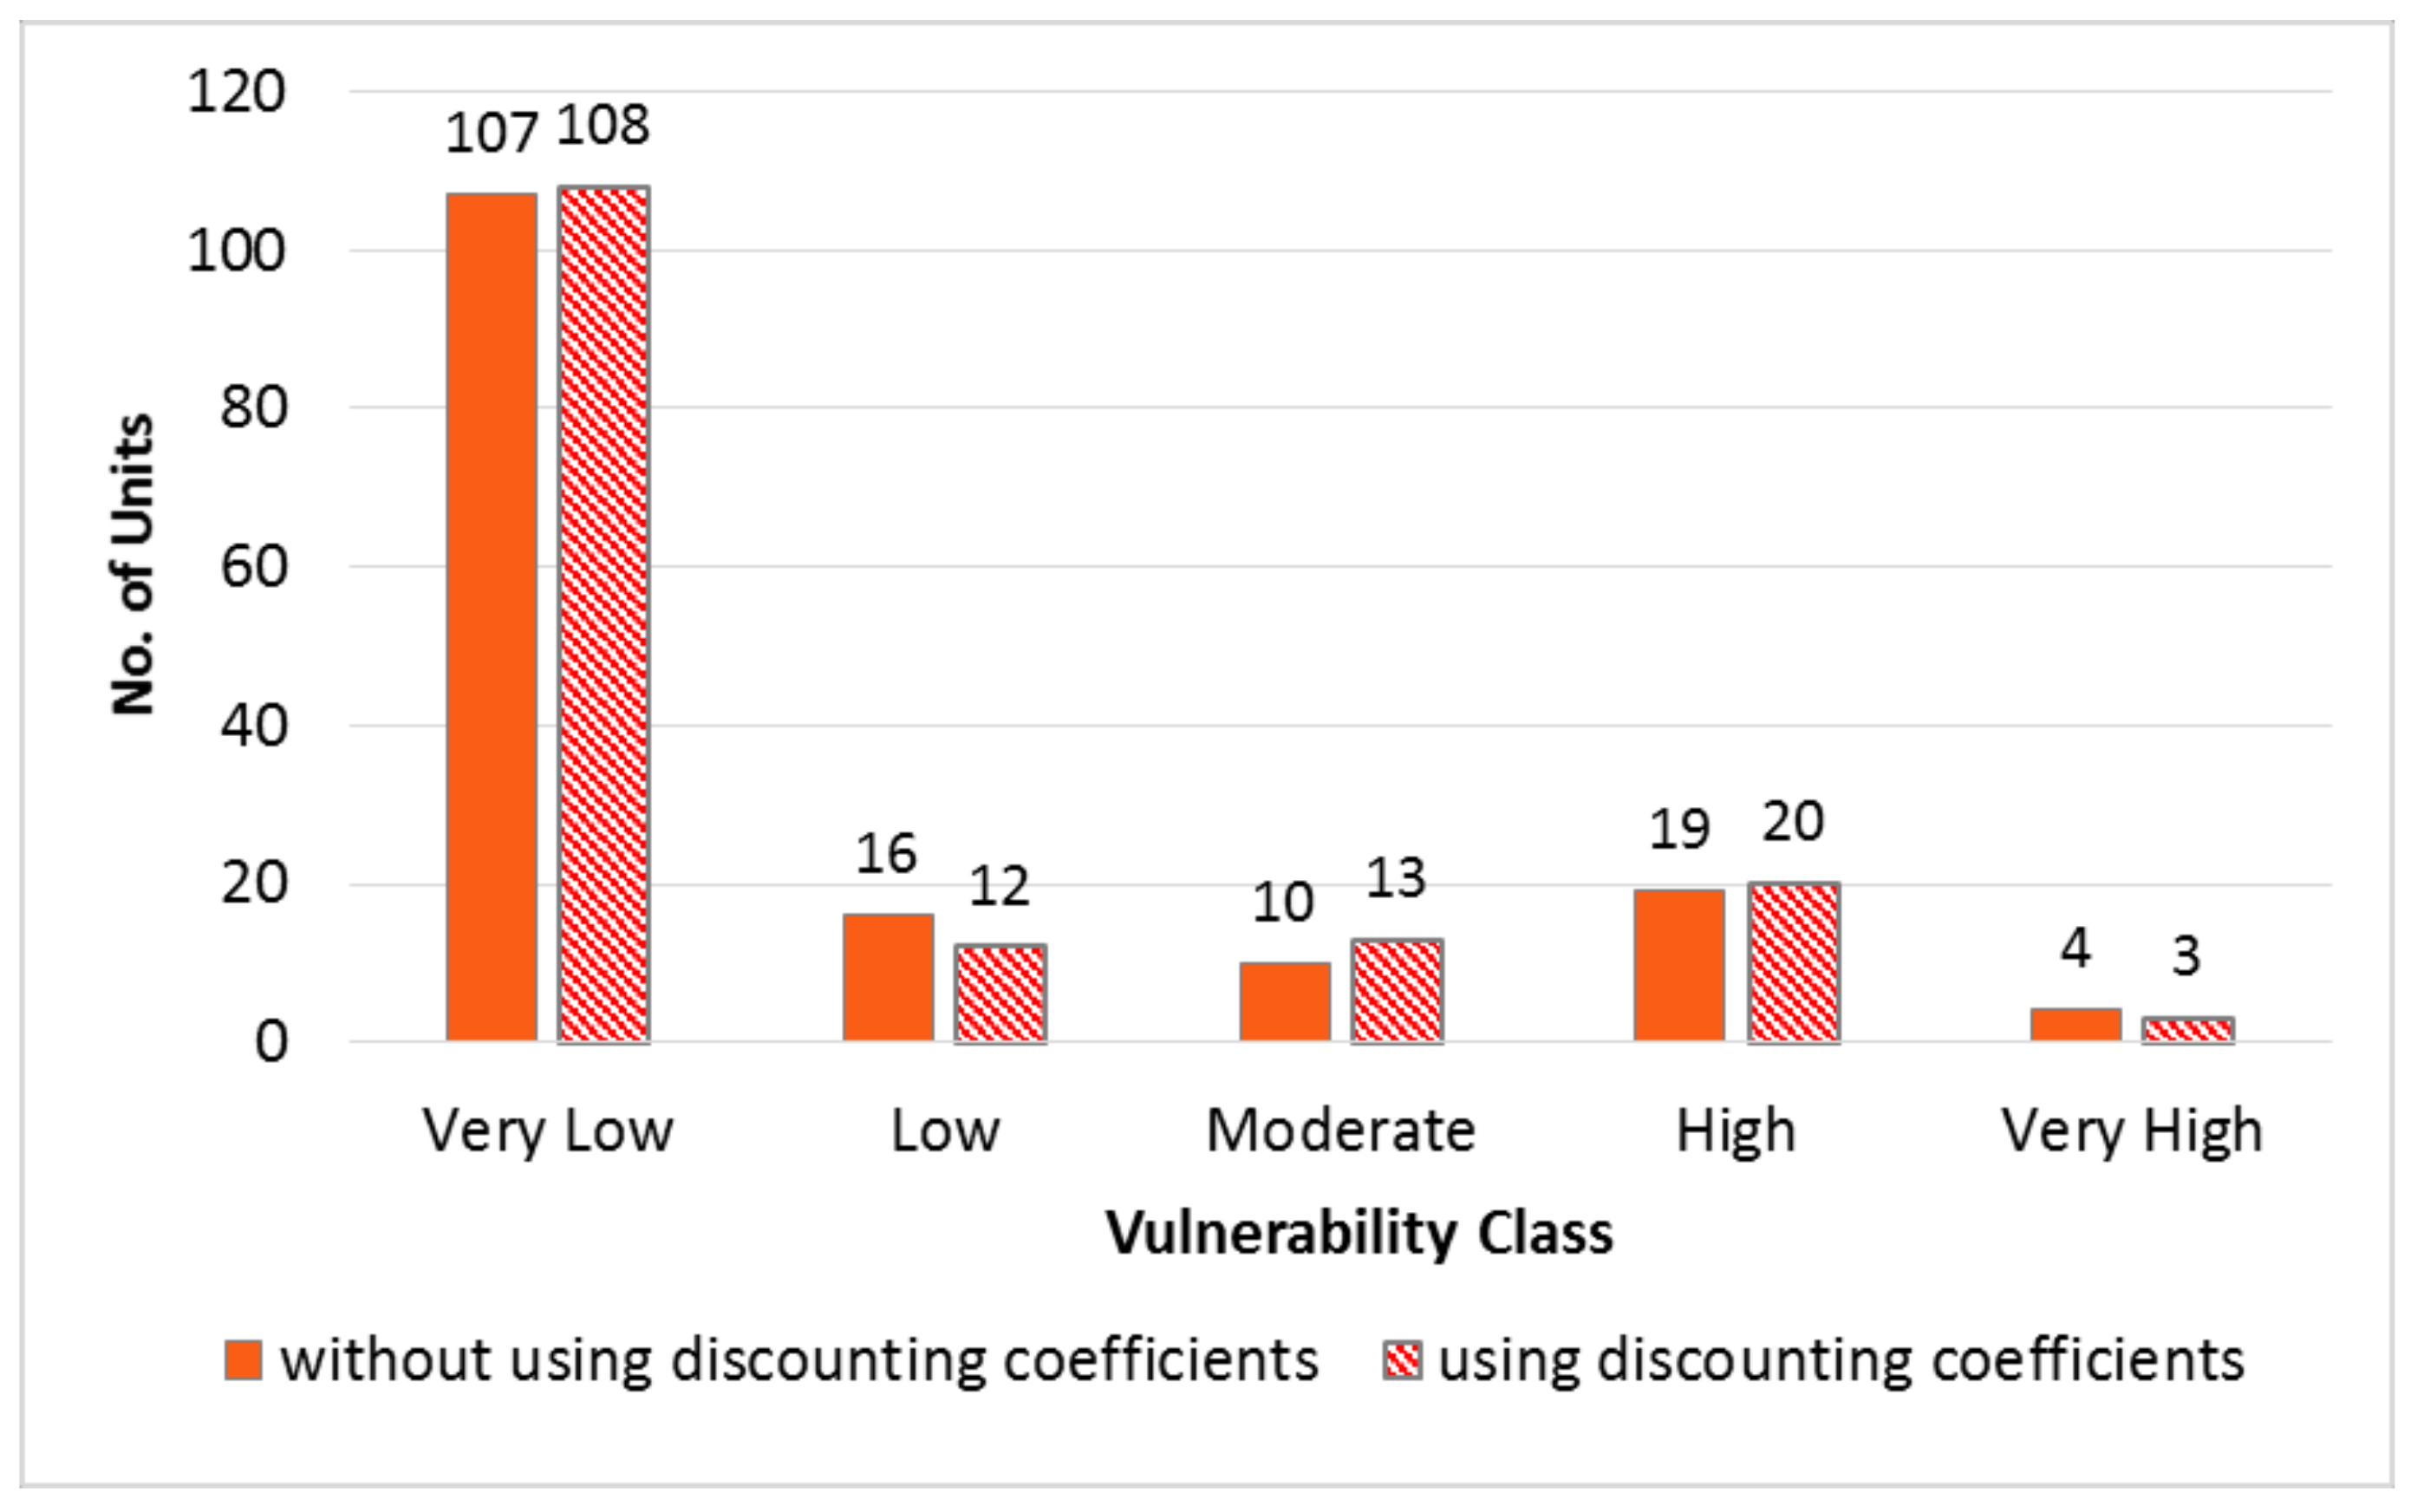
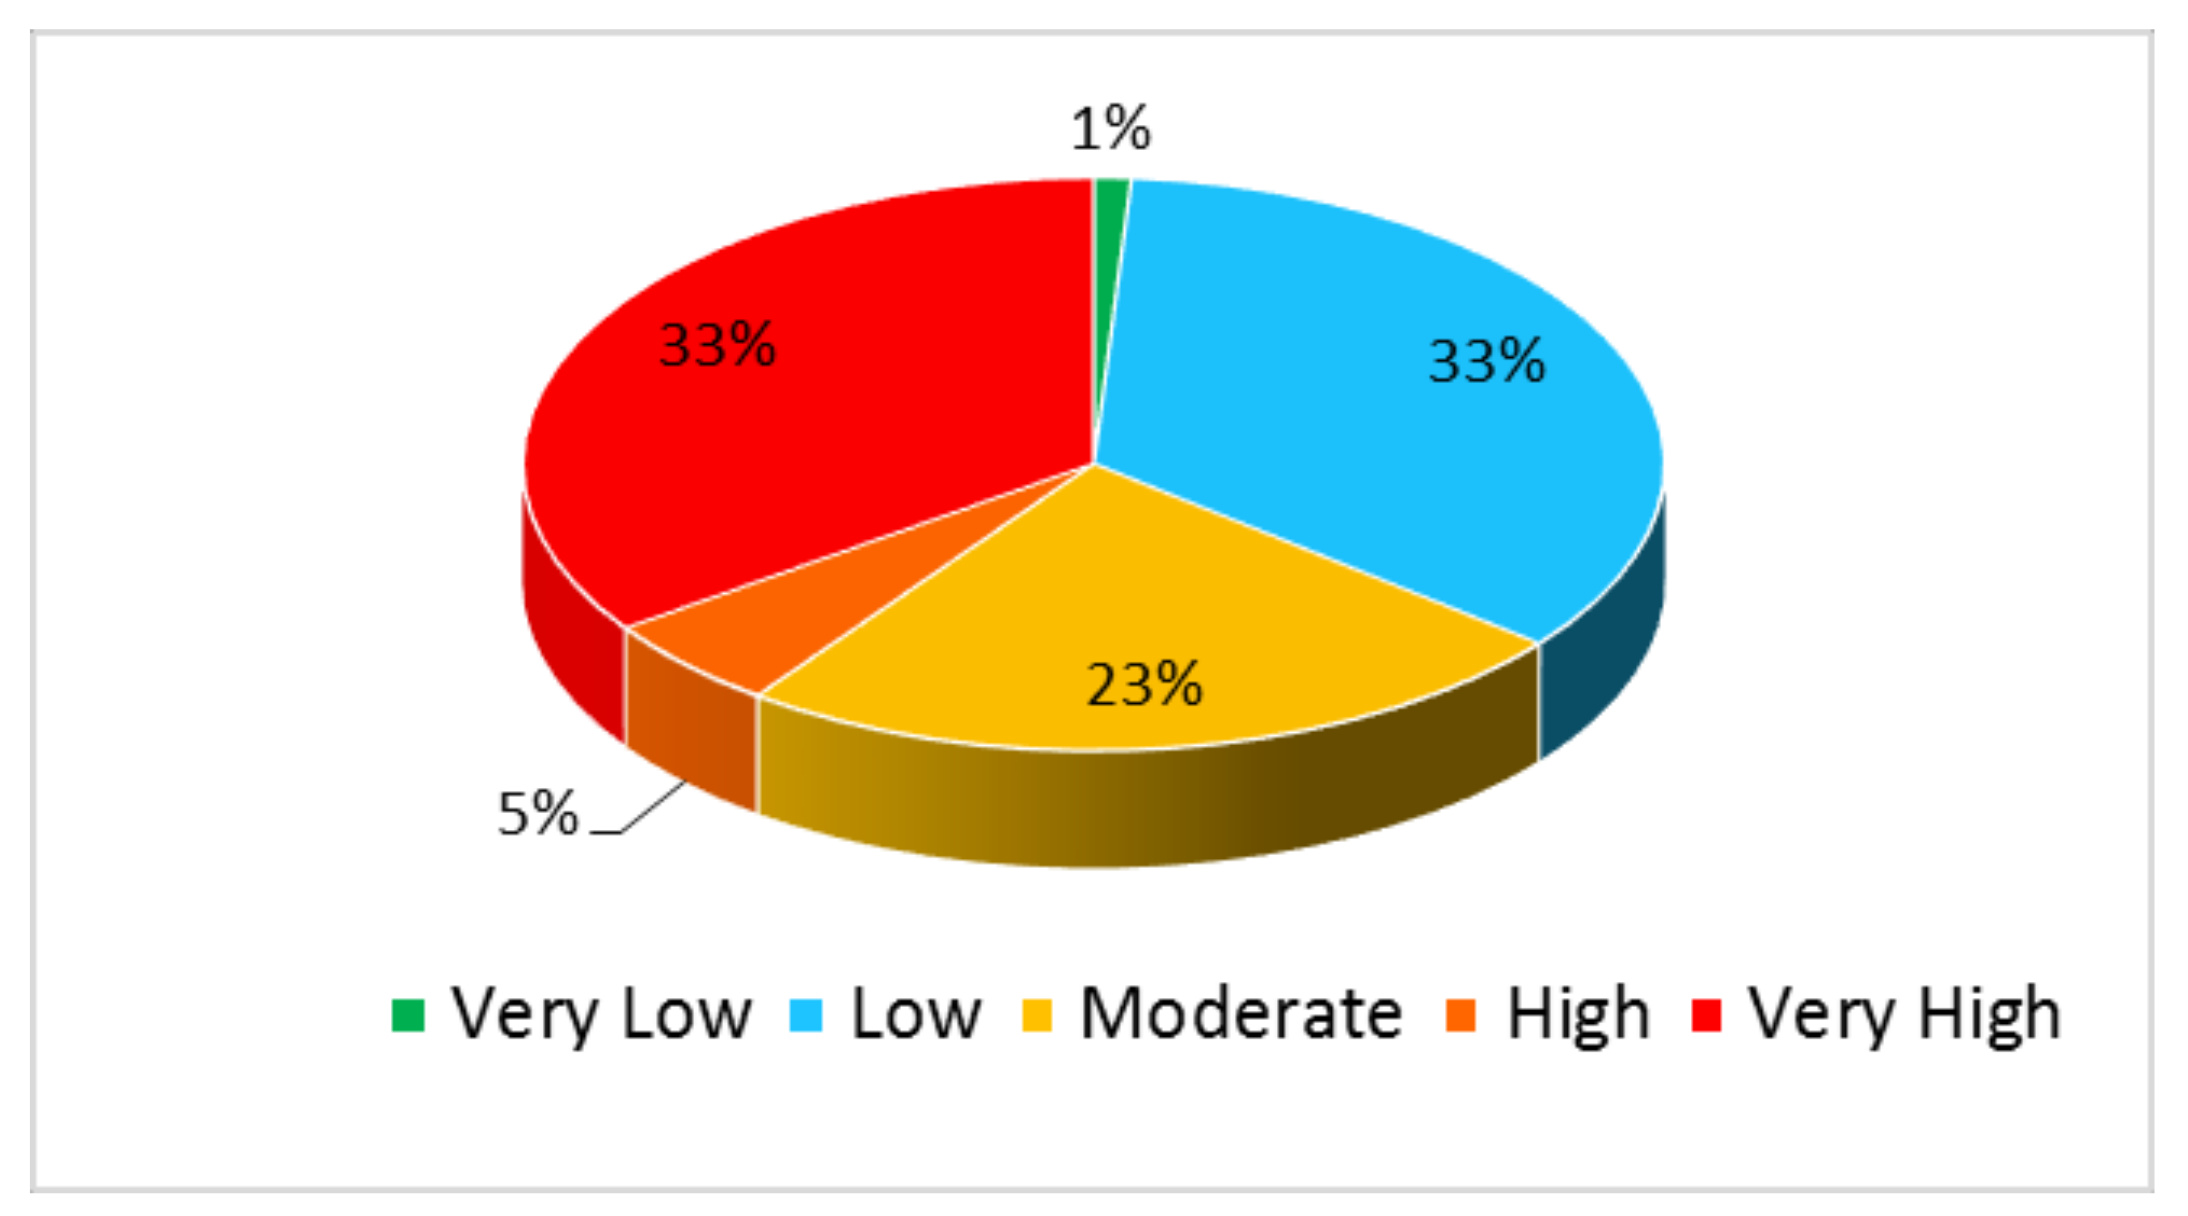
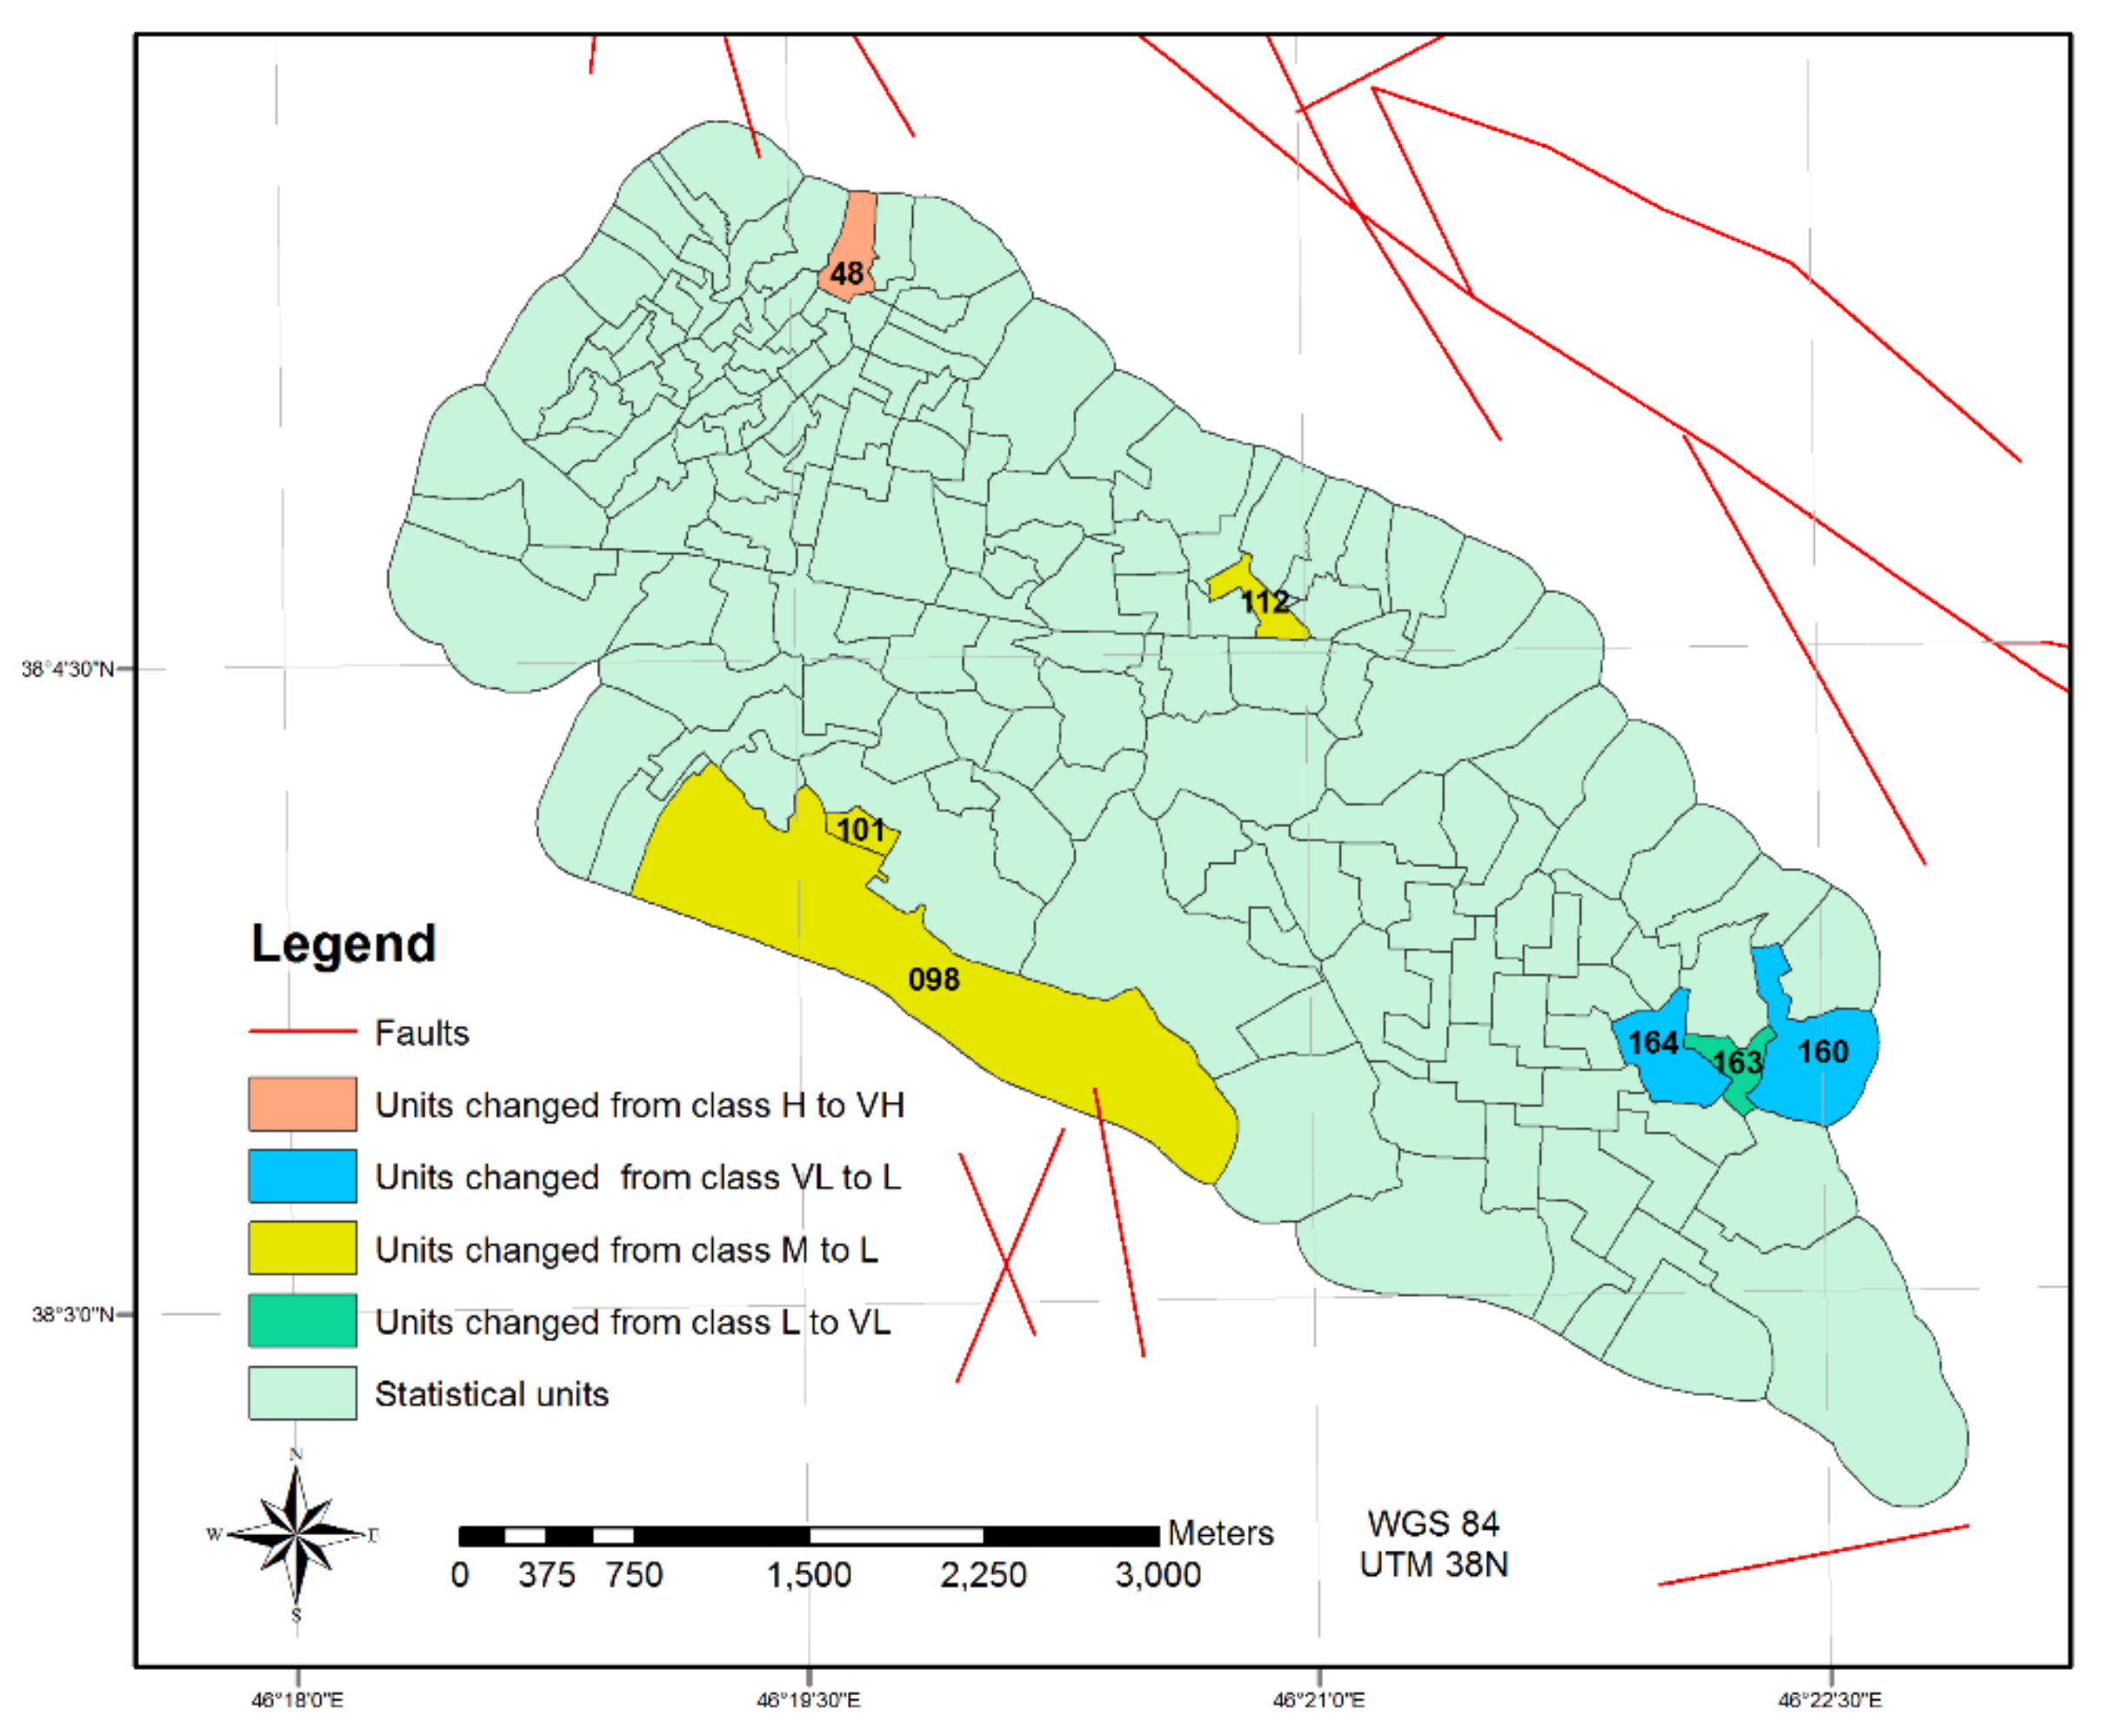
3.2. Producing Physical Seismic Vulnerability Maps
3.3. An Overview of the Calculations for the Proposed Physical Seismic Vulnerability Assessment
- Creating a matrix of the criteria weights (using upper and lower bounds given by the experts) considering the 7 influencing criteria.
- Normalizing the matrix of Step A and obtaining a 7-by-7 matrix. Each row corresponds to one of the experts and each column corresponds to one of the criteria.
- Calculating mean of the criteria weights given by the experts (a 1-dimentional matrix with 7 rows/columns is constructed where each element represents one criterion mean weight).
- Constructing a parametric Data Matrix for the statistical units based on their attributes’ classes (see Table 2) (The matrix dimension is 156 × 7).
- Assigning fuzzy rules of vulnerability (given by the experts) to matrix of Step D and defuzzification of the elements of the matrix (The matrix dimension is 156 × 7).
- Determining ideal solutions and negative ideal solutions for each column considering maximum and minimum values in the column. Calculating ignorance (ISNS) for each column.
- Constructing Euclidean distances matrices from IS, NS and ISNS (defined as (IS+NS)/2). Three matrices are constructed accordingly (Each matrix dimension is 156 × 7).
- Constructing three mass functions matrices using Equation (7) (Each matrix dimension is 156 × 7).
- Calculating total vulnerability of each statistical unit. Considering each row of matrices in Step H, Dempster combination rule (using ⊕ operator between the first two elements of that row and then using the same operator between the combination result and 3rd element and so on) is applied. For example, for combination of m (NS)s considering the seven influencing criteria, M(NS) = m1(NS) ⊕m2(NS) ⊕ … ⊕ m7(NS) where M(NS) demonstrates the total belief supporting the hypothesis that the unit has priority in mitigation activities. The calculations using ⊕ operator are shown in Equation (9) (see also Equation (4)).Corresponding to the units’ obtained BPAs of NS, IS and ISNS considering the first two criteria using Equation (9) the combined BPAs of belief, disbelief and uncertainty are calculated according to Equation (10). The subscripts in Equation (10) show the criteria No. s.M1,2,3 (NS)= m1,2 (NS) ⊕ m3 (NS)
M1,2,3 (IS)= m1,2 (IS) ⊕ m3 (IS)
M1,2,3 (ISNS)= m1,2 (ISNS) ⊕ m3 (ISNS) - Three 156×1 matrices will be constructed as M1,…,7 (NS) (or belief), M1,…,7 (IS) (or disbelief) and M1,…,7 (ISNS) (or ignorance). It should be noted that the sum of corresponding elements in M (IS), M(NS) and M(ISNS) must equal to ‘1’ (see Equation (3)).
- Calculating Bet (NS)s using Equation (8) from M (NS)s and M (ISNS)s for the statistical units and then classifying the outputs to vulnerability classes (using Table 3).
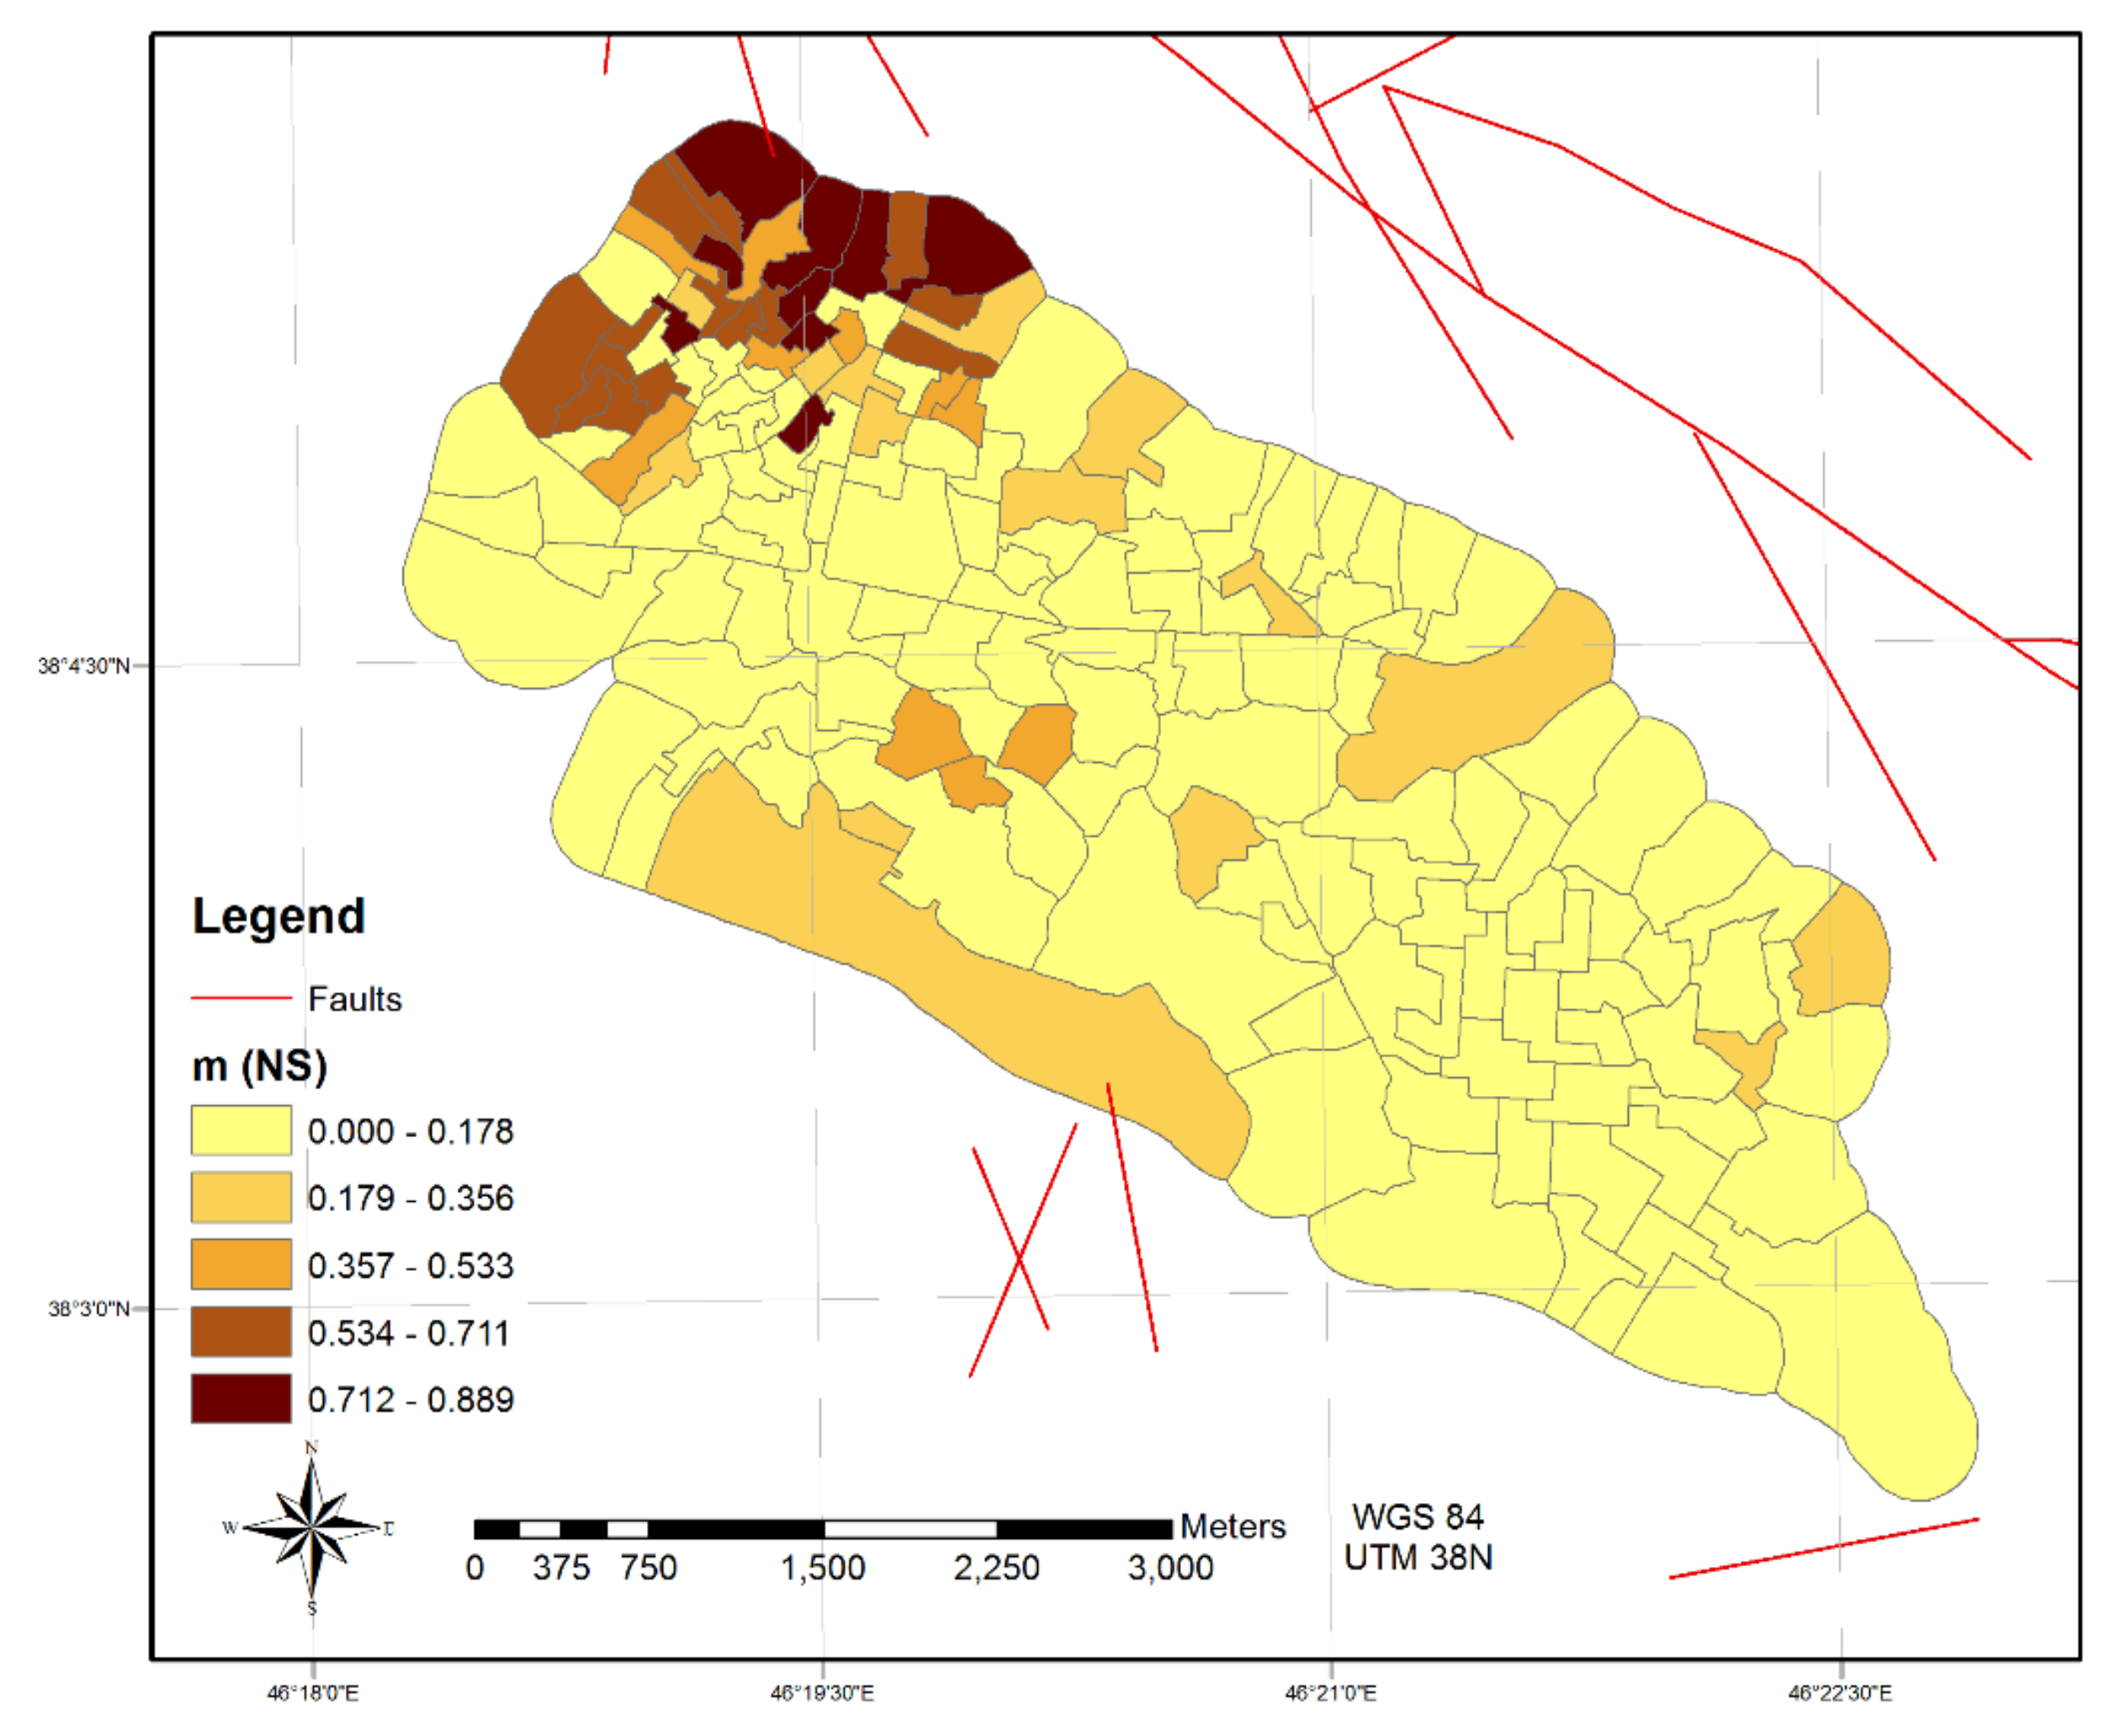
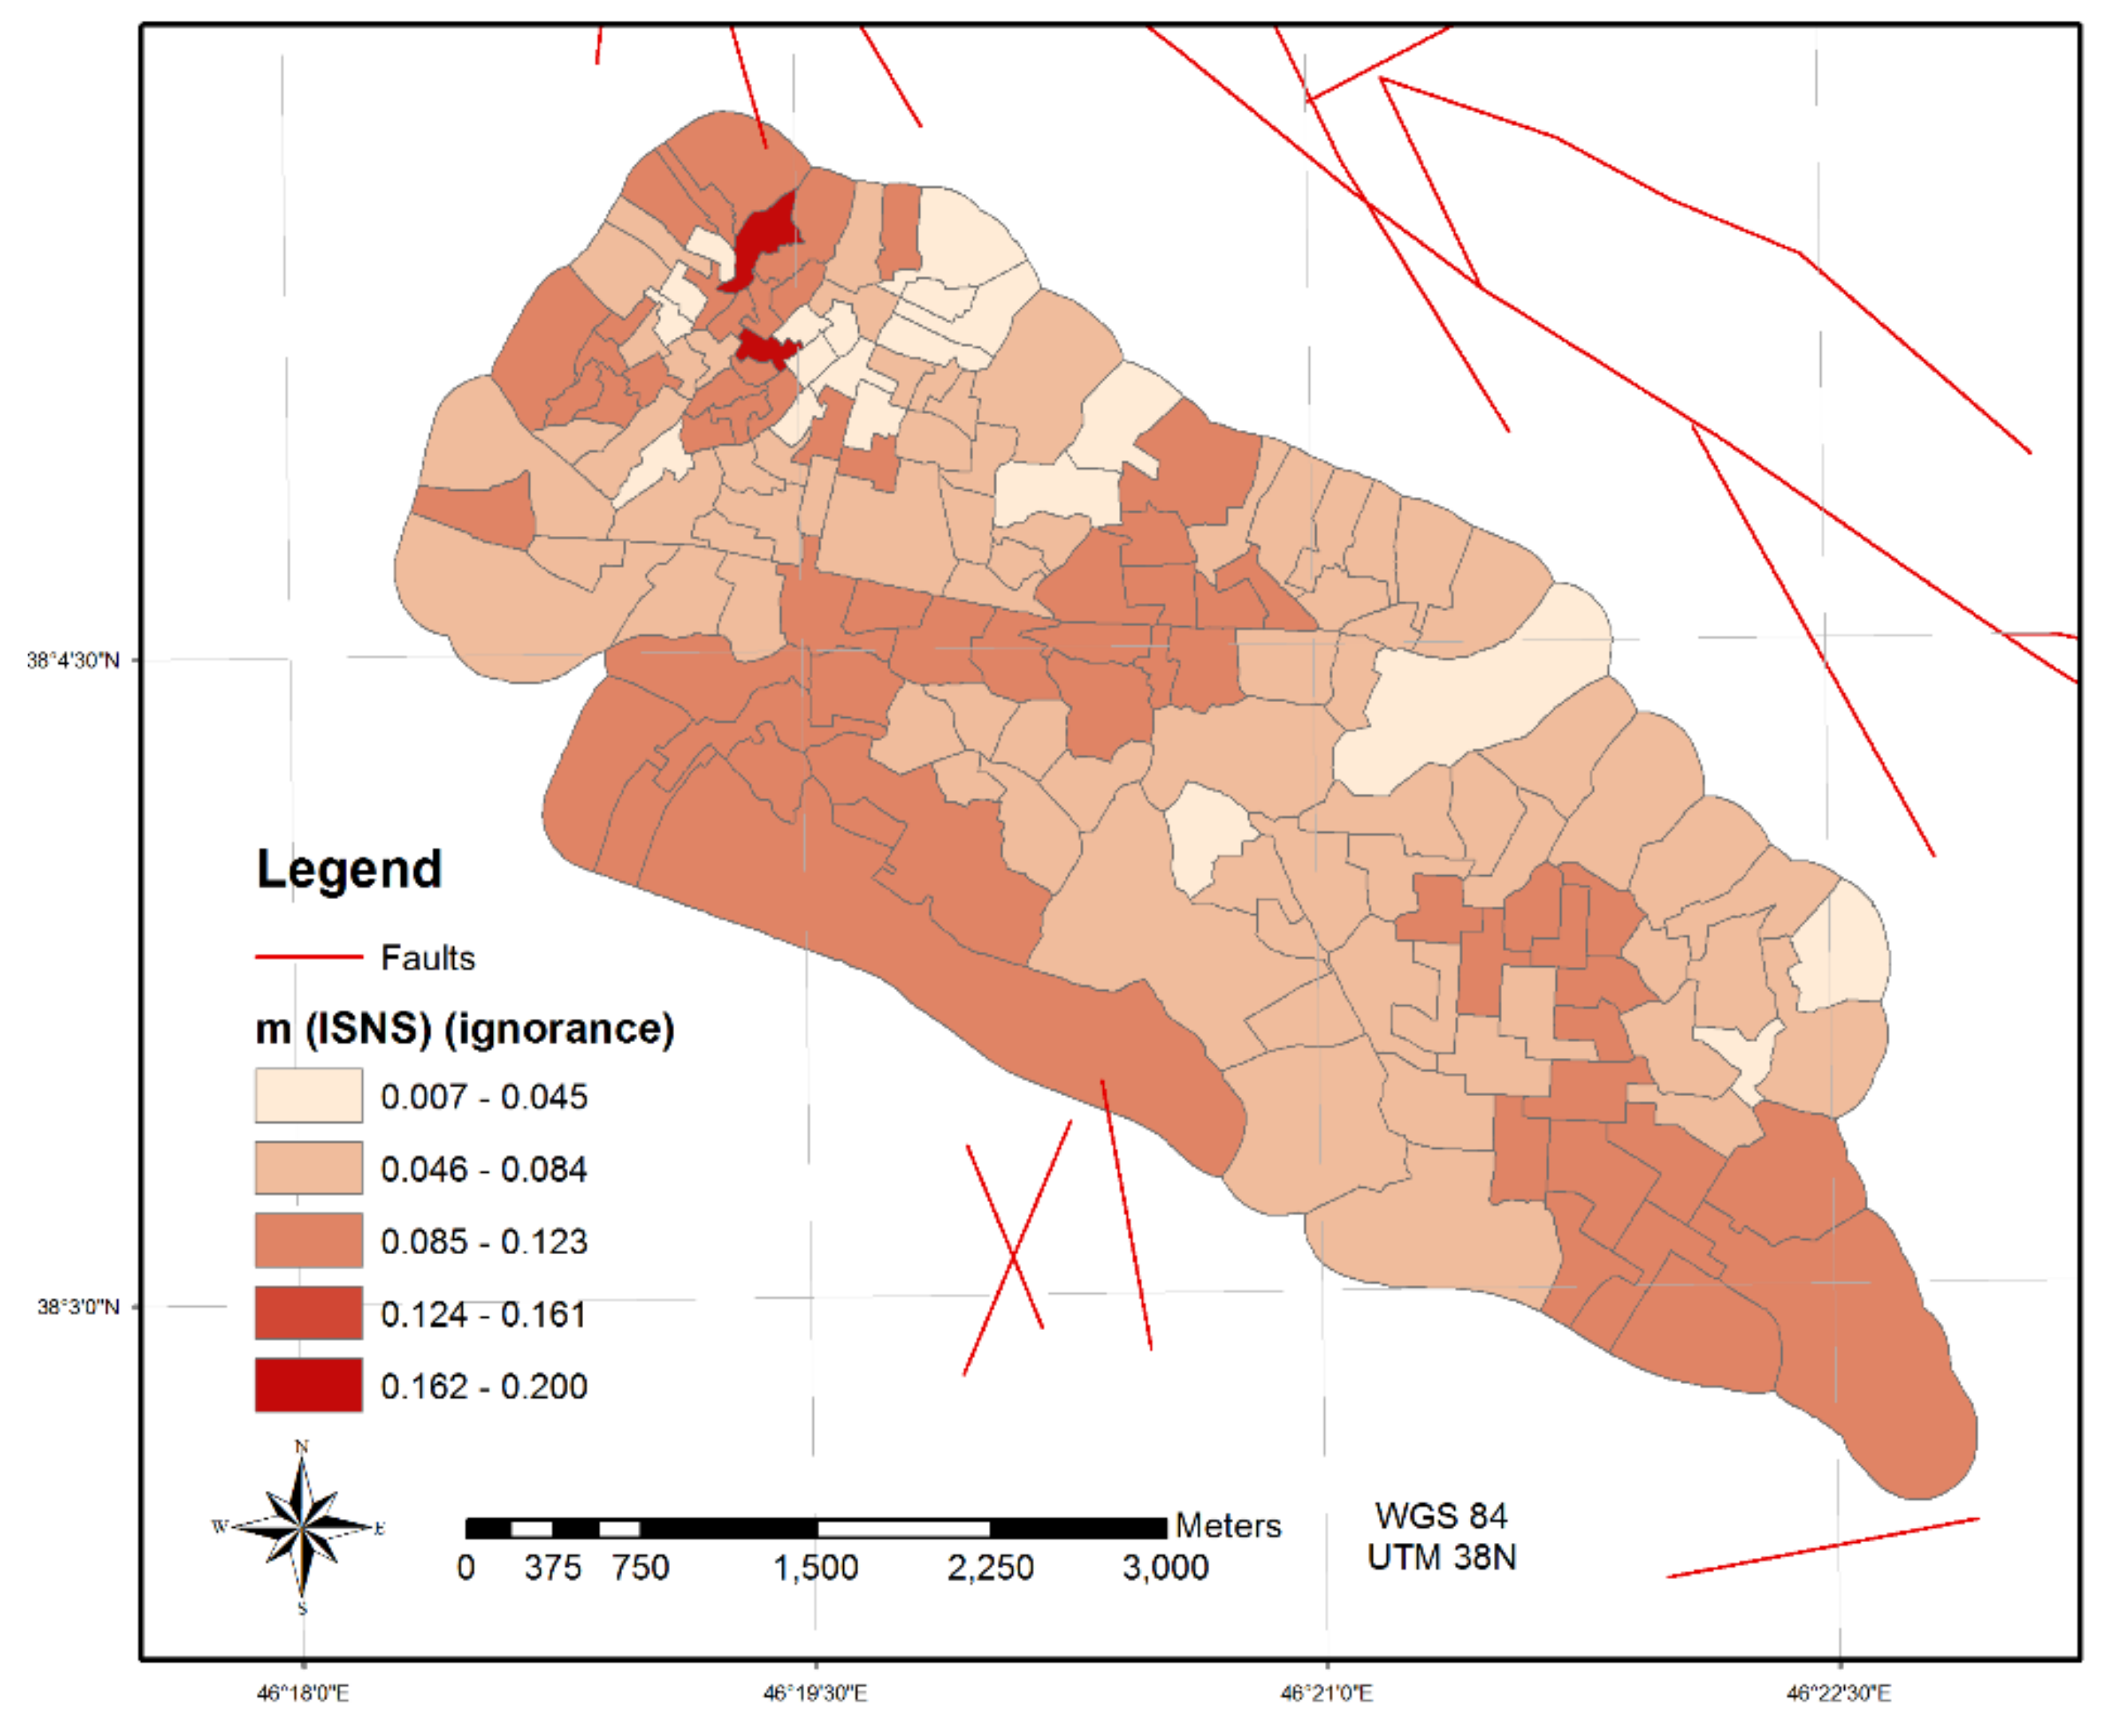
- Representing the outputs of Step I as separate maps of belief, disbelief and ignorance.
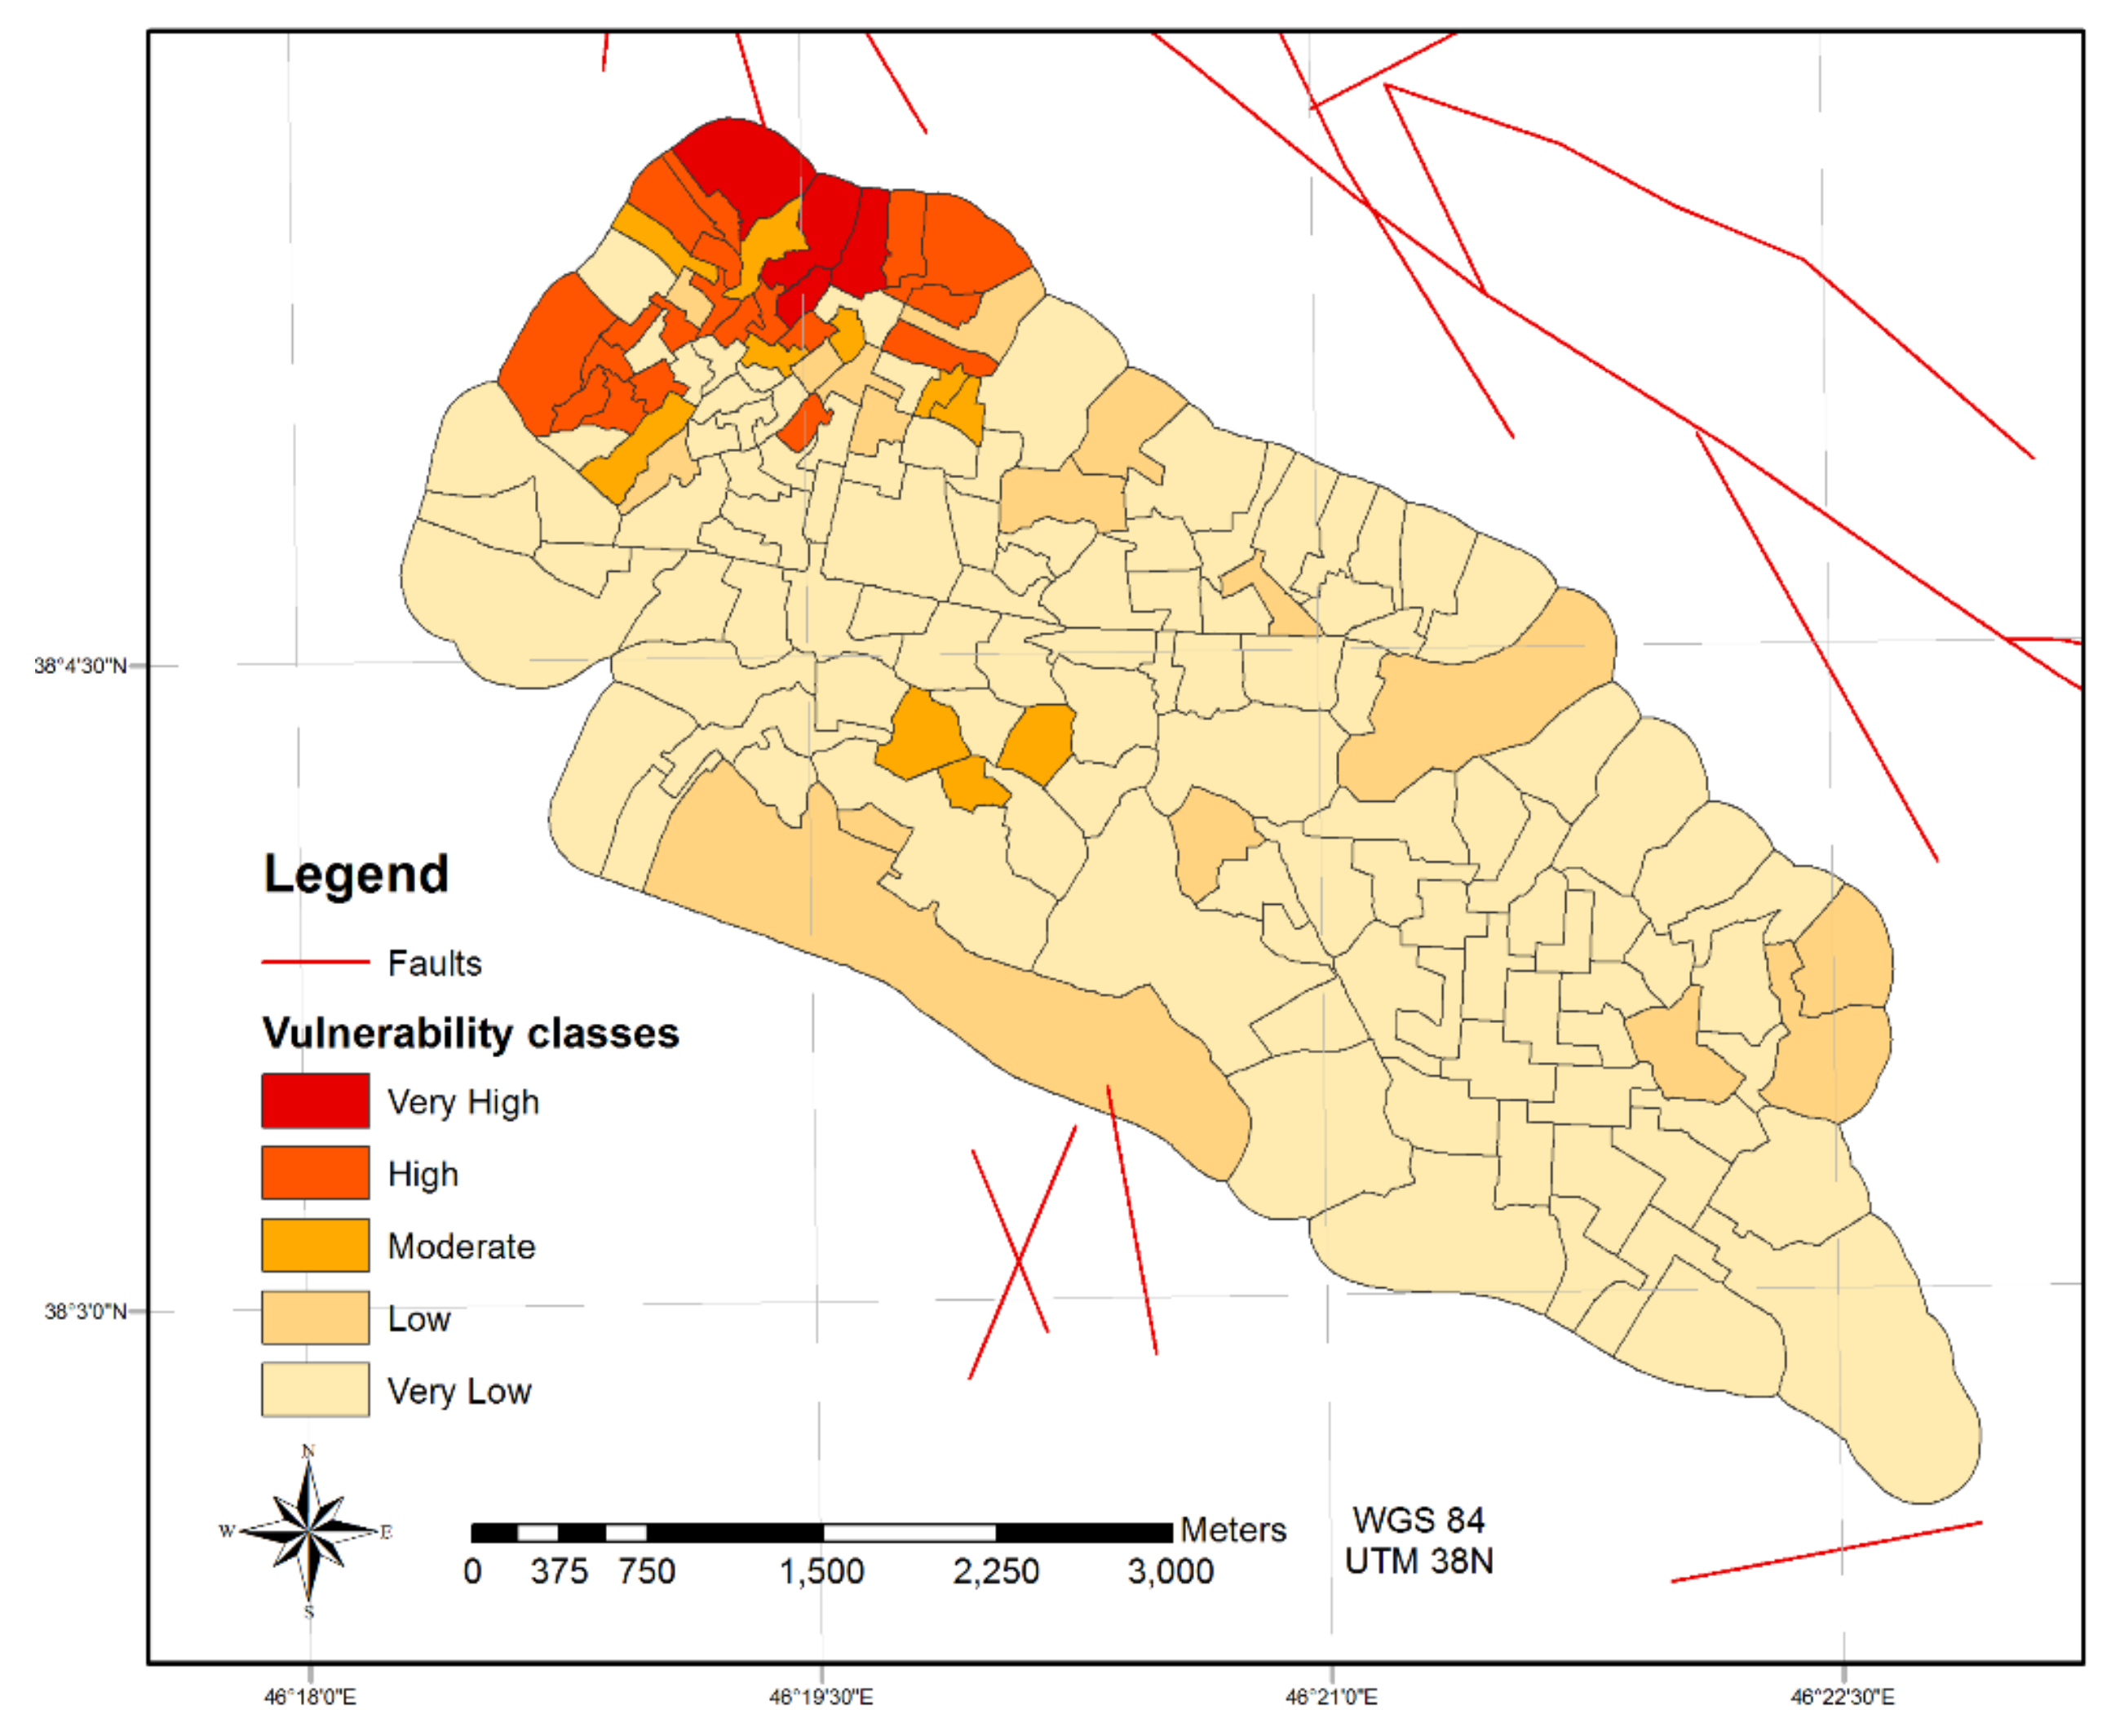
- Representing the outputs of Step J as physical seismic vulnerability map.
3.4. Producing Social Seismic Vulnerability Maps
4. Conclusions
Author Contributions
Funding
Acknowledgments
Conflicts of Interest
References
- Iervolino, I.; Manfredi, G.; Polese, M.; Verderame, G.M.; Fabbrocino, G. Seismic risk of R.C. building classes. Eng. Struct. 2007, 29, 813–820. [Google Scholar] [CrossRef]
- Sadrykia, M.; Delavar, M.R.; Zare, M. A GIS-based decision making model using fuzzy sets and theory of evidence for seismic vulnerability assessment under uncertainty (case study: Tabriz). J. Intell. Fuzzy Syst. 2017, 33, 1–13. [Google Scholar] [CrossRef]
- Alizadeh, M.; Alizadeh, E.; Asadollahpour Kotenaee, S.; Shahabi, H.; Beiranvand Pour, A.; Panahi, M.; Bin Ahmad, B.; Saro, L. Social Vulnerability Assessment Using Artificial Neural Network (ANN) Model for Earthquake Hazard in Tabriz City, Iran. Sustainability 2018, 10, 3376. [Google Scholar] [CrossRef]
- Rodriquez, C.; Monteiro, R.; Ceresa, P. Assessing Seismic Social Vulnerability in Urban Centers—The Case-Study of Nablus, Palestine. Int. J. Archit. Herit. 2018, 12, 1216–1230. [Google Scholar] [CrossRef]
- Boukri, M.; Farsi, M.N.; Mebarki, A.; Belazougui, M.; Ait-Belkacem, M.; Yousfi, N.; Guessoum, N.; Benamar, D.A.; Naili, M.; Mezouar, N.; et al. Seismic vulnerability assessment at urban scale: Case of Algerian buildings. Int. J. Disaster Risk Reduct. 2018, 31, 555–575. [Google Scholar] [CrossRef]
- Chieffo, N.; Marius, M.; Formisano, A.; Onescu, I. Seismic vulnerability assessment and loss estimation of an urban district of Timisoara. Iop Conf. Ser. Mater. Sci. Eng. 2019, 471, 102070. [Google Scholar]
- Hassanzadeh, R. Earthquake population loss estimation using spatial modelling and survey data: The Bam earthquake, 2003, Iran. Soil Dyn. Earthq. Eng. 2019, 116, 421–435. [Google Scholar] [CrossRef]
- Karimzadeh, S.; Miyajima, M.; Hassanzadeh, R.; Amiraslanzadeh, R.; Kamel, B. A GIS-based seismic hazard, building vulnerability and human loss assessment for the earthquake scenario in Tabriz. Soil Dyn. Earthq. Eng. 2014, 66, 263–280. [Google Scholar] [CrossRef]
- Zhang, S.; Yang, K.; Cao, Y. GIS-Based Rapid Disaster Loss Assessment for Earthquakes. IEEE Access 2019, 7, 6129–6139. [Google Scholar] [CrossRef]
- Alam, M.S.N.; Tesfamariam, S.; Alam, M.S.N. GIS-Based Seismic Damage Estimation: Case Study for the City of Kelowna, BC. Nat. Hazards Rev. 2013, 14, 66–78. [Google Scholar] [CrossRef]
- Hashemi, M.; Alesheikh, A.A. A GIS-based earthquake damage assessment and settlement methodology. Soil Dyn. Earthq. Eng. 2011, 31, 1607–1617. [Google Scholar] [CrossRef]
- Hassanzadeh, R.; Nedović-Budić, Z.; Alavi Razavi, A.; Norouzzadeh, M.; Hodhodkian, H. Interactive approach for GIS-based earthquake scenario development and resource estimation (Karmania hazard model). Comput. Geosci. 2013, 51, 324–338. [Google Scholar] [CrossRef]
- Lantada, N.; Irizarry, J.; Barbat, A.H.; Goula, X.; Roca, A.; Susagna, T.; Pujades, L.G. Seismic hazard and risk scenarios for Barcelona, Spain, using the Risk-UE vulnerability index method. Bull. Earthq. Eng. 2010, 8, 201–229. [Google Scholar] [CrossRef]
- Preciado, A.; Ramirez-Gaytan, A.; Santos, J.C.; Rodriguez, O. Seismic vulnerability assessment and reduction at a territorial scale on masonry and adobe housing by rapid vulnerability indicators: The case of Tlajomulco, Mexico. Int. J. Disaster Risk Reduct. 2020, 44, 101425. [Google Scholar] [CrossRef]
- Riga, E.; Karatzetzou, A.; Mara, A.; Pitilakis, K. Uncertainties in Seismic Risk Assessment at Urban Scale. The Case of Thessaloniki, Greece. Procedia Environ. Sci. 2017, 38, 340–347. [Google Scholar] [CrossRef]
- Vargas-Alzate, Y.F.; Lantada, N.; González-Drigo, R.; Pujades, L.G. Seismic Risk Assessment Using Stochastic Nonlinear Models. Sustainability 2020, 12, 1308. [Google Scholar] [CrossRef]
- Vicente, R.; Parodi, S.; Lagomarsino, S.; Varum, H.; Silva, J.A.R.M. Seismic vulnerability and risk assessment: Case study of the historic city centre of Coimbra, Portugal. Bull. Earthq. Eng. 2011, 9, 1067–1096. [Google Scholar] [CrossRef]
- Alizadeh, M.; Hashim, M.; Alizadeh, E.; Shahabi, H.; Karami, M.; Beiranvand Pour, A.; Pradhan, B.; Zabihi, H. Multi-criteria decision making (MCDM) model for seismic vulnerability assessment (SVA) of urban residential buildings. Isprs Int. J. Geo-Inf. 2018, 7, 444. [Google Scholar] [CrossRef]
- Armaş, I. Multi-criteria vulnerability analysis to earthquake hazard of Bucharest, Romania. Nat. Hazards 2012, 63, 1129–1156. [Google Scholar] [CrossRef]
- Jena, R.; Pradhan, B.; Beydoun, G. Earthquake vulnerability assessment in Northern Sumatra province by using a multi-criteria decision-making model. Int. J. Disaster Risk Reduct. 2020, 46, 101518. [Google Scholar] [CrossRef]
- Rezaie, F.; Panahi, M. GIS modeling of seismic vulnerability of residential fabrics considering geotechnical, structural, social and physical distance indicators in Tehran using multi-criteria decision-making techniques. Nat. Hazards Earth Syst. Sci. 2015, 15, 461–474. [Google Scholar] [CrossRef]
- Sadrykia, M.; Delavar, M.R.; Zare, M. A GIS-Based Fuzzy Decision Making Model for Seismic Vulnerability Assessment in Areas with Incomplete Data. ISPRS Int. J. Geo-Inf. 2017, 6, 119. [Google Scholar] [CrossRef]
- Asadi, Y.; Samany, N.N.; Ezimand, K. Seismic vulnerability assessment of urban buildings and traffic networks using fuzzy ordered weighted average. J. Mt. Sci. 2019, 16, 677–688. [Google Scholar] [CrossRef]
- Khamespanah, F.; Delavar, M.R.; Moradi, M.; Sheikhian, H. A GIS-based multi-criteria evaluation framework for uncertainty reduction in earthquake disaster management using granular computing. Geod. Cartogr. 2016, 42, 58–68. [Google Scholar] [CrossRef]
- Moradi, M.; Delavar, M.R.; Moshiri, B. A GIS-based multi-criteria analysis model for earthquake vulnerability assessment using Choquet integral and game theory. Nat. Hazards 2017, 87, 1377–1398. [Google Scholar] [CrossRef]
- Sheikhian, H.; Delavar, M.R.; Stein, A. A GIS-based multi-criteria seismic vulnerability assessment using the integration of granular computing rule extraction and artificial neural networks. Trans. GIS 2017, 21, 1237–1259. [Google Scholar] [CrossRef]
- De Rocquigny, E. Modelling Under Risk and Uncertainty: An Introduction to Statistical, Phenomenological and Computational Methods; Wiley: Hoboken, NJ, USA, 2012. [Google Scholar]
- Helton, J.C. Uncertainty and sensitivity analysis in the presence of stochastic and subjective uncertainty. J. Stat. Comput. Simul. 1997, 57, 3–76. [Google Scholar] [CrossRef]
- Sentz, K.; Ferson, S. Combination of Evidence in Dempster-Shafer Theory; System Science and Industrial Engineering Department, Binghamton University, State University of New York: New York, NY, USA, 2002. [Google Scholar]
- SSHAC (Senior Seismic Hazard Analysis Committee). Recommendations for Probabilistic Seismic Hazard Analysis: Guidance on Uncertainty and Use of Experts; Nuclear Regulatory Commission: Washington, DC, USA, 1997. [Google Scholar]
- Klir, G.J.; Yuan, B. Fuzzy Sets and Fuzzy Logic: Theory and Applications; Prentice Hall PTR: Upper Saddle River, NJ, USA, 1995. [Google Scholar]
- Shi, W. Principles of Modeling Uncertainties in Spatial Data and Spatial Analyses; CRC Press, Taylor & Francis Group: Boca Raton, FL, USA, 2010. [Google Scholar]
- Stoms, D. Reasoning with uncertainty in intelligent geographic information systems. GIS 1987, 87, 693–699. [Google Scholar]
- Sadrykia, M. Development of a GIS-based Seismic Vulnerability Assessment Model Using the Integration of Improved Dempster-Shafer and Fuzzy Sets Theories, Case Study: Some Districts of Tabriz. Ph.D. Thesis, University of Tehran, Tehran, Iran, September 2017. [Google Scholar]
- Zadeh, L.A. Fuzzy sets. Inf. Control 1965, 8, 338–353. [Google Scholar] [CrossRef]
- Zimmermann, H.J. Fuzzy Set Theory—And Its Applications; Springer: Berlin/Heidelberg, Germany, 1991. [Google Scholar]
- Dempster, A.P. Upper and Lower Probabilities Induced by a Multivalued Mapping. Ann. Math. Stat. 1967, 38, 325–339. [Google Scholar] [CrossRef]
- Shafer, G. A Mathematical Theory of Evidence; Princeton University Press: Princeton, NJ, USA, 1976. [Google Scholar]
- Beynon, M.; Cosker, D.; Marshall, D. An expert system for multi-criteria decision making using Dempster Shafer theory. Expert Syst. Appl. 2001, 20, 357–367. [Google Scholar] [CrossRef]
- Yager, R.R. Decision making under dempster-shafer uncertainties. Int. J. Gen. Syst. 1992, 20, 233–245. [Google Scholar] [CrossRef]
- Zadeh, L.A. The concept of a linguistic variable and its application to approximate reasoning—I. Inf. Sci. 1975, 8, 199–249. [Google Scholar] [CrossRef]
- Yager, R.R. On the dempster-shafer framework and new combination rules. Inf. Sci. 1987, 41, 93–137. [Google Scholar] [CrossRef]
- Zadeh, L.A. Simple View of the Dempster-Shafer Theory of Evidence and Its Implication for the Rule of Combination. Ai Mag. 1986, 7, 85–90. [Google Scholar]
- Dubois, D.; Prade, H. A set-theoretic view of belief functions Logical operations and approximations by fuzzy sets. Int. J. Gen. Syst. 1986, 12, 193–226. [Google Scholar] [CrossRef]
- Dubois, D.; Prade, H. Reliability Data Collection and Analysis; Flamm, J., Luisi, T., Eds.; Springer: Dordrecht, The Netherlands, 1992. [Google Scholar]
- Inagaki, T. Interdependence between safety-control policy and multiple-sensor schemes via Dempster-Shafer theory. IEEE Trans. Reliab. 1991, 40, 182–188. [Google Scholar] [CrossRef]
- Lefevre, E.; Colot, O.; Vannoorenberghe, P. Belief function combination and conflict management. Inf. Fusion 2002, 3, 149–162. [Google Scholar] [CrossRef]
- Deng, Y.; Chan, F.T.S. A new fuzzy dempster MCDM method and its application in supplier selection. Expert Syst. Appl. 2011, 38, 9854–9861. [Google Scholar] [CrossRef]
- Coburn, A.; Spence, R.; Comerio, M. Earthquake Protection, 2nd ed.; Wiley: Chichester, West Sussex, UK, 2003. [Google Scholar]
- Shafer, G. Perspectives on the theory and practice of belief functions. Int. J. Approx. Reason. 1990, 4, 323–362. [Google Scholar] [CrossRef]
- Smets, P. Data fusion in the transferable belief model. In Proceedings of the Third International Conference on Information Fusion, Paris, France, 10–13 July 2000; Volume 21, p. 21. [Google Scholar]


| Prepared Data | Source Data | Source Scale | Organization |
|---|---|---|---|
| Tabriz Districts layer | Tabriz county map | 1:2000 | Statistics and IT organization/ Municipality of Tabriz |
| Slope layer | Topographical map | 1:2000 | Iran National Cartographic Center (NCC) |
| Lithology layer | Geological map | 1:2000 | Geological Survey of Iran (GSI) |
| Faults layer | Active faults of Iran map | 1:2,500,000 | International Institute of Earthquake Eng. and Seismology (IIEES) |
| Statistical units layer | District One statistical units map | 1:2000 | Iran Statistical Center (ISC) |
| Age of the buildings | Year of the construction (Excel worksheet) | - | Iran Statistical Center (ISC) |
| Structural types | Frame types of the buildings (Excel worksheet) | - | Iran Statistical Center (ISC) |
| Ground water layer | (UTM) X,Y,Z of wells of East Azerbaijan (Excel worksheet) | - | Water Resources Management Company/Ministry of Energy |
| Number of floors | Land use map (attribute table) | 1:2000 | Ministry of Roads and Urban |
| Population statistics | District One statistical data (Excel worksheet) | - | East Azarbaijan Province Management and Planning Organization |
| Criteria/ Sub-criteria Influencing macro-seismic intensity (hazard parameters) | Relative importance/ Aggregated weights | Criteria/ Sub-criteria Pertinent to structural properties (physical vulnerability parameters) | Relative importance/ Aggregated weights |
|---|---|---|---|
| Slope (%) | [0.623] | Height of the Building | [0.678] |
| 0-3 | (0.03,0.16,0.36) | ||
| 3-7 | (0.08,0.27,0.47) | Density of 1-2 story buildings (%) | |
| 7-15 | (0.24,0.44,0.64) | 10 > | (0.08,0.22,0.42) |
| 15-20 | (0.47,0.67,0.86) | 10-40 | (0.24,0.42,0.62) |
| 20 < | (0.64,0.84,0.97) | 40-70 | (0.26,0.46,0.66) |
| 70-100 | (0.32,0.5,0.68) | ||
| Ground water level (m) | [0.521] | Density of 3-4 story buildings (%) | |
| 0-3 | (0.53,0.73,0.9) | 10 > | (0.14,0.3,0.5) |
| 3-7 | (0.4,0.6,0.78) | 10-40 | (0.3,0.5,0.7) |
| 7-10 | (0.23,0.43,0.63) | 40-70 | (0.52,0.62,0.82) |
| 10-15 | (0.3,0.5,0.68) | 70-100 | (0.58,0.78,0.92) |
| 15-20 | (0.1,0.26,0.46) | Density of (> 5) story buildings (%) | |
| 20-25 | (0.02,0.13,0.33) | 10 > | (0.38,0.58,0.76) |
| 25< | (0,0.1,0.3) | 10-40 | (0.46,0.66,0.84) |
| 40-70 | (0.5,0.7,0.88) | ||
| Dist. to faults (km) | [1.000] | 70-100 | (0.58,0.7,0.86) |
| 1> | (0.7,0.9,1) | ||
| 1-2 | (0.64,0.84,0.97) | Age of the Building | [0.918] |
| 2-3 | (0.61,0.81,0.96) | ||
| 3-4 | (0.56,0.76,0.91) | Age of the buildings (years) | |
| 4-5 | (0.5,0.7,0.87) | 10> | (0.15,0.33,.53) |
| 5-6 | (0.56,0.61,0.78) | 10-20 | (0.3,0.5,0.7) |
| 6< | (0.23,0.43,0.63) | 20-30 | (0.47,0.66,0.87) |
| 30-40 | (0.66,0.86,0.98) | ||
| Lithology | [0.827] | 40-50 | (0.7,0.9,1) |
| Qf Quaternary (Pleistocene) | (0.7,0.9,1) | 50< | (0.7,0.9,1) |
| Qfl Quaternary (Pleistocene) | (0.7,0.9,1) | ||
| M-Plt Neogene (Pilocene) | (0.5,0.7,0.9) | Structural type of the Building | [0.770] |
| Msm Neogene (Miocene) | (0.5,0.7,0.9) | ||
| Mm Neogene (Miocene) | (0.6,0.8,0.95) | Structural type of the buildings | |
| PLQc Quaternary (Pleistocene) | (0.5,0.7,0.85) | Steel frame | (0.18,0.38,0.58) |
| Qal Quaternary | (0.63,0.83,0.96) | RC frame | (0.14,0.34,0.54) |
| Qt Quaternary | (0.63,0.83,0.96) | Brick and steel/ Stone and steel | (0.5,0.7,0.9) |
| Mm Oligocene-Miocene | (0.3,0.5,0.7) | Brick and wood/ Stone and wood | (0.58,0.78,0.94) |
| (10) QPLc Quaternary | (0.2,0.4,0.6) | Timber | (0.22,0.42,0.62) |
| (11) Kum Cretaceous | (0.15,0.3,0.5) | Brick and wood | (0.62,0.82,0.96) |
| (12) Km Cretaceous | (0.15,0.3,0.5) | Brick and clay | (0.7,0.9,1) |
| Bet (NS) | Vul. Class |
|---|---|
| 0-0.2 | Very High (VH) |
| 0.2-0.4 | High (H) |
| 0.4-0.6 | Moderate (M) |
| 0.6-0.8 | Low (L) |
| 0.8-1 | Very Low (VL) |
© 2020 by the authors. Licensee MDPI, Basel, Switzerland. This article is an open access article distributed under the terms and conditions of the Creative Commons Attribution (CC BY) license (http://creativecommons.org/licenses/by/4.0/).
Share and Cite
Delavar, M.R.; Sadrykia, M. Assessment of Enhanced Dempster-Shafer Theory for Uncertainty Modeling in a GIS-Based Seismic Vulnerability Assessment Model, Case Study—Tabriz City. ISPRS Int. J. Geo-Inf. 2020, 9, 195. https://doi.org/10.3390/ijgi9040195
Delavar MR, Sadrykia M. Assessment of Enhanced Dempster-Shafer Theory for Uncertainty Modeling in a GIS-Based Seismic Vulnerability Assessment Model, Case Study—Tabriz City. ISPRS International Journal of Geo-Information. 2020; 9(4):195. https://doi.org/10.3390/ijgi9040195
Chicago/Turabian StyleDelavar, Mahmoud Reza, and Mansoureh Sadrykia. 2020. "Assessment of Enhanced Dempster-Shafer Theory for Uncertainty Modeling in a GIS-Based Seismic Vulnerability Assessment Model, Case Study—Tabriz City" ISPRS International Journal of Geo-Information 9, no. 4: 195. https://doi.org/10.3390/ijgi9040195
APA StyleDelavar, M. R., & Sadrykia, M. (2020). Assessment of Enhanced Dempster-Shafer Theory for Uncertainty Modeling in a GIS-Based Seismic Vulnerability Assessment Model, Case Study—Tabriz City. ISPRS International Journal of Geo-Information, 9(4), 195. https://doi.org/10.3390/ijgi9040195