1. Introduction
Cultural preservation is an important part of maintaining national identity to ensure integration and unity among a particular group of people. Promoting cultural values also enriches a community through such things as job creation, tourism, and the like. A lot of effort has been devoted to preserving history through formal education and training or exhibiting artifacts at sites. Cultural values have traditionally been disseminated with the help of a tourist guide who provides assistance and information on cultural, historical, and contemporary heritage, or through the use of scripts attached to artifacts. Recently, a wide range of modern technologies have been adapted to enhance visitors’ experiences such as audio, video, 2D/3D movies, and documentaries. However, artifacts positioned at the site, lost historical buildings that cannot be reconstructed, or battlefield events that cannot be recreated, make it difficult for the majority of interested viewers to experience them.
To mitigate these obstacles and to promote cultural values, Virtual Reality (VR) and Augmented Reality (AR) have been investigated as a way to enrich visitors’ experience [
1,
2,
3]. VR has been proven as an effective means for entertaining and encouraging learning processes. VR allows users to immerse themselves in a 3D environment to experience situations that are very difficult or impossible to encounter in real life, such as volcanoes, ancient buildings, or events on a battlefield. AR, on the other hand, takes a different approach by allowing users to remain in their physical world while virtual objects are superimposed on physical ones.
A rich history unfolding over hundreds or even millions of years is always prone to gaps in learning and understanding a country’s culture, especially when considering an individual state within that country. Sometimes, historic events, such as battles, are viewed merely as a collection of locations, dates, and the number of participants on each side with a final result of victory or defeat. As such, many popular battlefields are not well understood. Palmito Ranch Battlefield in Cameron County, Texas, for example, is one of the most significant historical sites of the American Civil War, but few people are aware of its existence and importance.
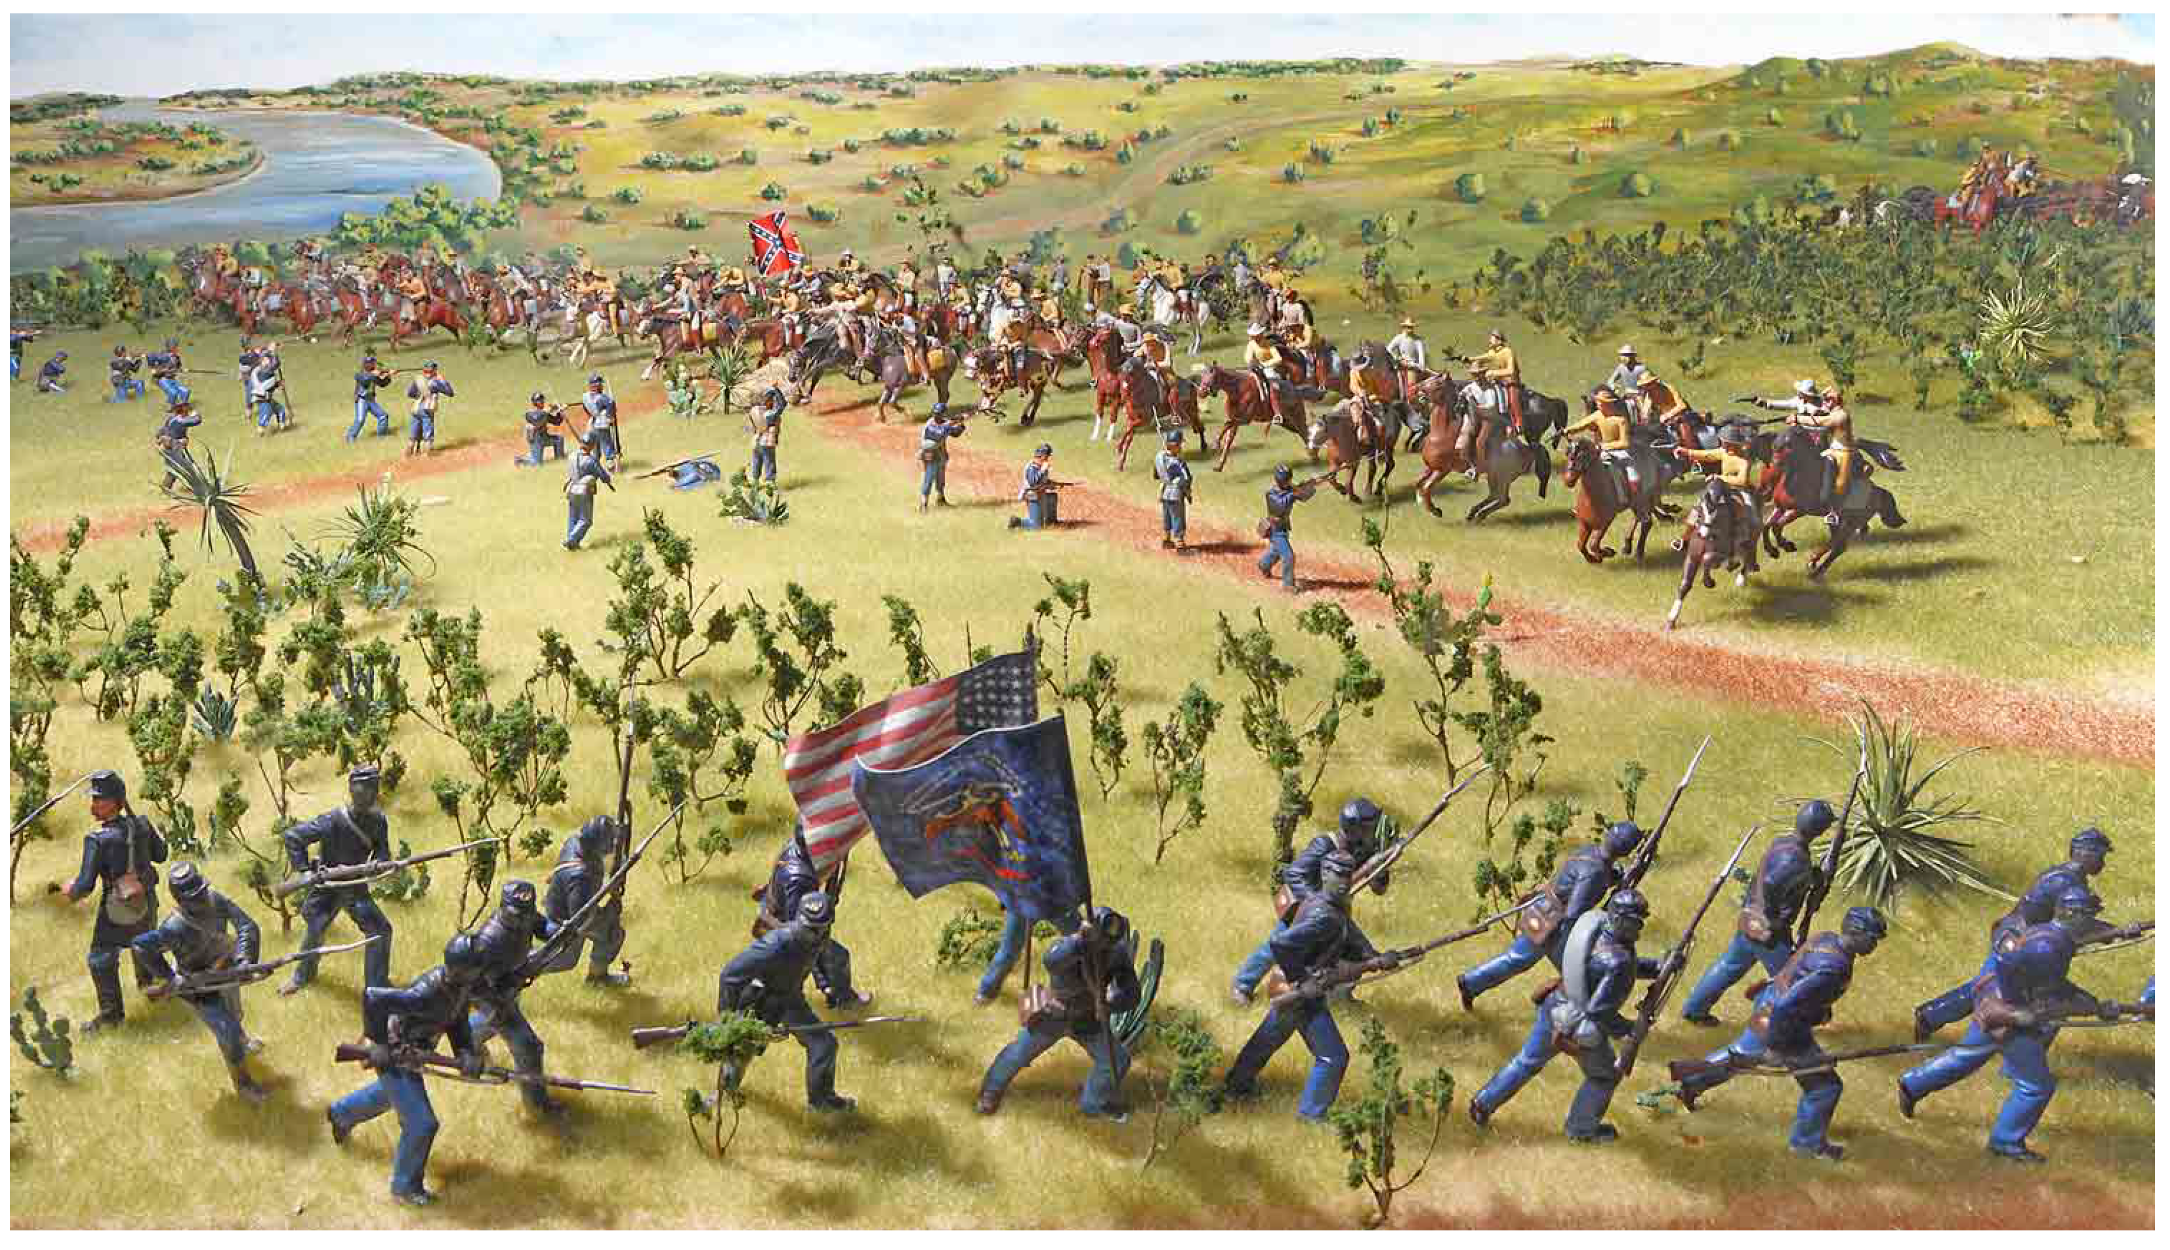
Figure 1 depicts the historic battle of Palmito Ranch that occurred on 12–13 May 1865, as a Union campaign of expedition from Brazos Santiago, Texas. It is the site of the last land battle fought in the Civil War and actually occurred after the war had officially ended upon the Confederate Army’s (South) surrender to the Union Army (North). Several programs administered by agencies including the National Park Service (e.g., Battlefield Planning Grants, Battlefield Land Acquisition Grants, Palmito Ranch Battlefield Preservation Plan) [
4] have been set up to promote the preservation, management, and interpretation of significant historic battlefields as cultural landscapes. The primary goals of land preservation at the Palmito Ranch Battlefield are meant to ensure that the area is protected from future development, that the site is able to maintain its historical integrity, and to ensure the perpetual protection of the entire battlefield. Developing a dynamic, historical battlefield AR experience is one key approach to meeting these goals that could also boost the promotion of local culture.
2. Research Aim
To the best of our knowledge, no other studies exist exploiting the use of AR web applications to convey a story of a battlefield which makes this research a unique contribution. This paper, based upon a previous study [
6], addresses this gap by proposing a web-based AR application that helps promote cultural identity by enabling students and tourists to experience a historically significant Civil War site in Texas. Consequently, this paper contributes to current research as it:
provides a unique approach to reconstruct a series of battlefield events in the Palmito Ranch Battlefield
illustrates its approaches through an open-source, web-based AR application called PalmitoAR
evaluates the proposed AR application using the Technology Acceptance Model
3. Related Work
The benefits of using AR technology for promoting cultural heritage have been investigated in many studies. Chung et al. [
7] conducted a study on visitor’s intention based on the role of AR for a heritage site. The study showed that technology readiness, visual factors of AR, and situational factors are the three main aspects that influence visitors to actively utilize AR. Technology readiness was the main predictor that contributed to the perception of usefulness. Visual appeal and facilitating conditions were predictors of the perceived ease of use. This study concluded that perceived usefulness and ease of use affected people’s intention to use AR and to visit the site.
Rafal et al. [
1] presented the Augmented Representation of Cultural Objects (ARCO) project, which allows designers to create, manipulate and control virtual 3D cultural objects in both VR and AR environments. The proposed system consists of three main components, including content production, content management, and visualization. The content acquisition components include object creation and manipulation. Digitized virtual objects in the system are stored in the repository from which the application layer will query and render to the 3D environment, or superimpose onto a marker. In its early stage, the eXtensible Virtual Reality Modeling Language (X-VRML) is used to represent 3D objects in the Internet browser. This system enables museum visitors to be engaged in learning artifacts by taking quizzes actively.
Papagiannakis et al. [
2,
3] reconstructed ancient Pompeii using mixed virtual reality to recreate and promote the civilization’s cultural values. The dramatic stories were revived through a complete simulation of animated virtual human actors (i.e., clothes, body, skin, face) superimposed in the real world. This work provides museum visitors with a range of experiences in both indoor and outdoor activities.
Using location information retrieved from a GPS supported device to trigger media content is a popular approach in many research designs, especially in early studies when small, modern handheld devices were scarce. For example, Hollerer et al. [
8] developed a technique called Situated Documentaries that enabled virtual content to be seen in the context of real-world locations on the campus of Columbia University. Participants walked around the campus with a head-mounted display capable of overlaying 3D graphics, imagery, and sound onto the real world. In line with this approach, ARCHEOGUIDE [
9,
10] is an interesting project that helps visitors explore and experience ancient artifacts based on their interests or needs. This application is embedded in a personalized electronic device and functions as a tour assistant. Enthusiasts select the site of interest, and then the system guides them through the site. The position–orientation tracking component is used as an indicator to display in AR the reconstruction of the ancient buildings.
REENACT [
11] is another approach that exploits the use of AR technology to improve the understanding of historical events with the aid of handheld devices. REENACT is an advanced technological platform consisting of social networking features, augmented reality capabilities, and repositories of multimedia content. The most interesting part of this project is its engagement of several users with an immersive environment to improve their understanding of historical battles from the perspective of re-enactors and historians. The results of this study indicate that participants were able to learn new aspects about the battlefield through the reenactment and with help from the domain expert.
Additional similar research in the field of cultural heritage exists with each contribution dedicated to a particular site. Following this stream, the present study makes an effort to contribute to knowledge about the Palmito Ranch Battlefield.
4. Methods
4.1. System Design
This section describes our techniques in detail, and readers are encouraged to consult the demonstration video of the AR app on YouTube [
12]. The printed map for the AR application was retrieved from Google Map satellite imagery and 3D models were freely acquired from TurboSquid [
13] and Adobe Fuse [
14]. PalmitoAR was developed using JavaScript libraries and in particular, the AR.js [
15] written by Jerome Etienne, an open-source library built on top of ARToolkit and integrated with A-Frame [
16] (a web framework for building virtual reality experiences) through a custom component. Unlike many modern AR applications that are installed directly on smart devices and rely on the deployed operating systems such as iOS or Android, our effort was aimed at bringing the AR experience to a more general audience (e.g., tourists, visitors, and students) by using a browser-supported device. The use of A-Frame has been shown to be an effective means of creating and sharing VR/AR experiences in [
17,
18,
19]. Hence, our approach does not restrict users to a single operating system. The primary goal of PalmitoAR is to create an AR application that presents students and visitors a high-level view of the historical event at the Palmito Ranch Battlefield. The PalmitoAR design approach takes into account the following aspects: (1) automatically simulate a series of battle events, (2) semi-automated battle events with the human in the loop for a particular event, and 3) intuitive use of embedded markers onto the map. To meet these goals, this paper proposes implementing several features in the PalmitoAR based on the application design approach suggested by Shneiderman [
20] where tasks (or features) are identified first and the application design is built to fulfill these tasks:
- -
Overview Display (F1). Displays an overview of the AR environment.
- -
Details on demand (F2). Presents details of a particular battle event.
- -
Automated Simulation (F3). Automatically simulates a series of battle events.
- -
Semi-Automated Simulation (F4). Simulates a particular battle event based on user selection.
- -
Overlay characters on a given position (F5). Detects different markers on the printed map and superimposes characters on them.
Based on the features outlined above, PalmitoAR is designed with two primary elements: 1) the main component and 2) the marker component.
4.1.1. The Main Component
The main component contains the AR environment in which 3D objects (e.g., infantry, gun fighter, cannon, flags, or fire) are superimposed onto the real physical map (Feature F1). Since the proposed AR is implemented in the web environment, computational expense should be taken into consideration. We used low poly 3D models with a minimum number of vertices and avoided using too many images as texture to improve performance. Instead, we used basic colors for filling faces (i.e., soldier’s hat, shoes), with the exception of the flags.
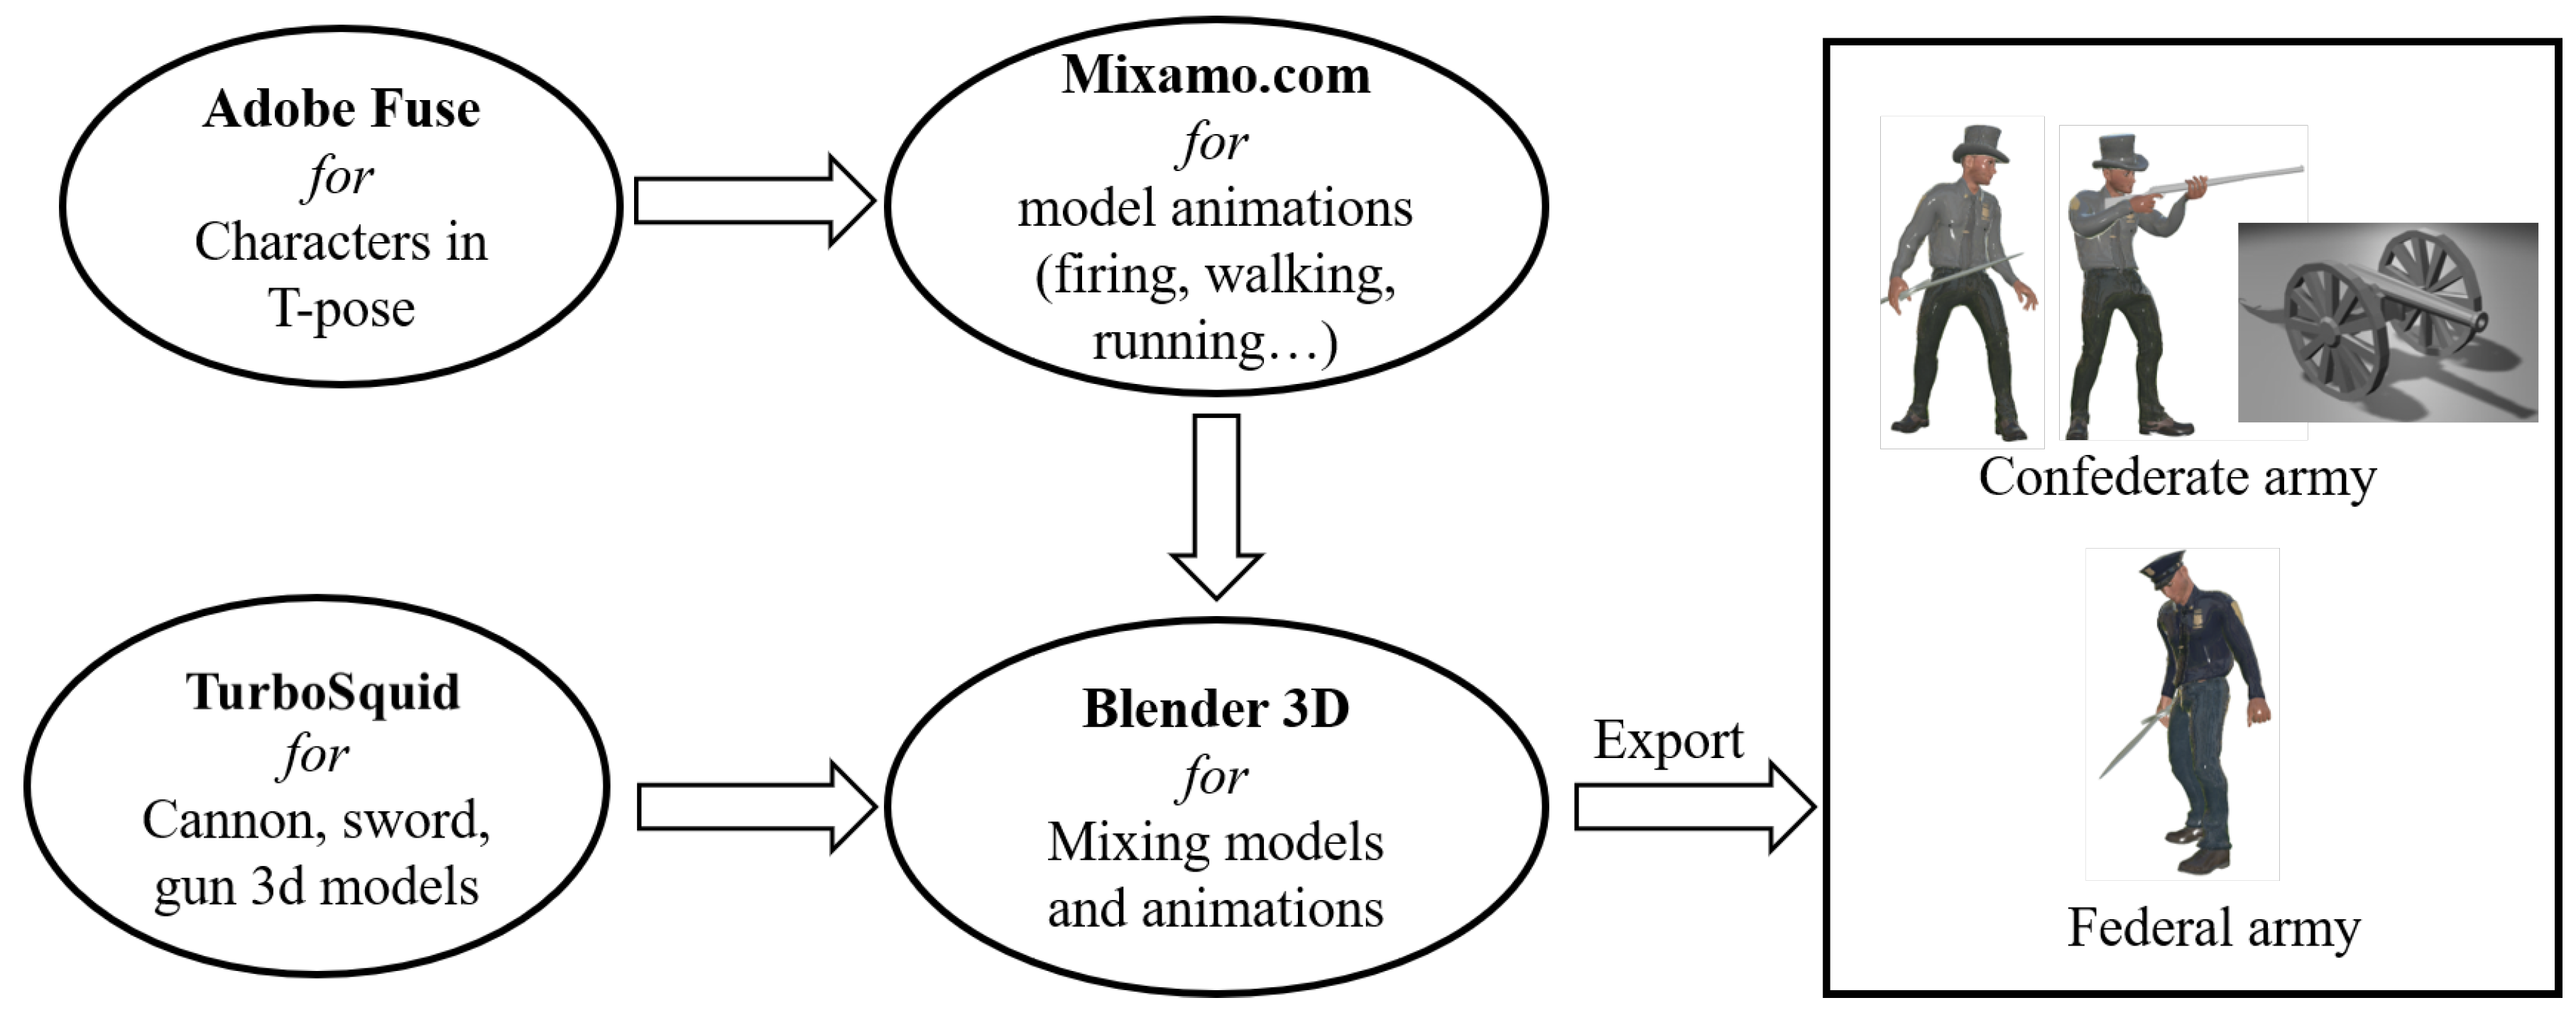
Figure 2 illustrates the process of converting free 3D models into 3D models for Web AR. Most free 3D objects on the internet are provided in the form of .obj, .fbx, .blend or .max which are not an ideal model for Web application due to size and information encoding. To alleviate this problem, The Khronos Group developed the run-time asset delivery format GL Transmission Format (glTF). This format minimizes both the size of 3D assets, and the run-time processing needed to unpack and use those assets. A binary version of glTF (GLB) contains textures instead of referencing them as external images. Our proposed AR application takes advantage of this file format in the production. The characters (Confederate and Federal troops) were constructed and generated with the free 3D software (Adobe Fuse [
14]), but all textures were removed and replaced by a basic color (i.e., gray color for confederate troops and dark blue color for federal troops). To apply animations to these characters, we used the free online character animation tool Mixamo [
21]. Unfortunately, the current version of this software (beta version) does not allow embedding multiple animations into a single 3D model. Thus, Blender [
22] 3D software was used to combine all animations (i.e., walking, running, firing, standing and idle). Accessories (i.e, gun, sword) appended to the characters were also made with this software. The final models were then exported in GLB format.
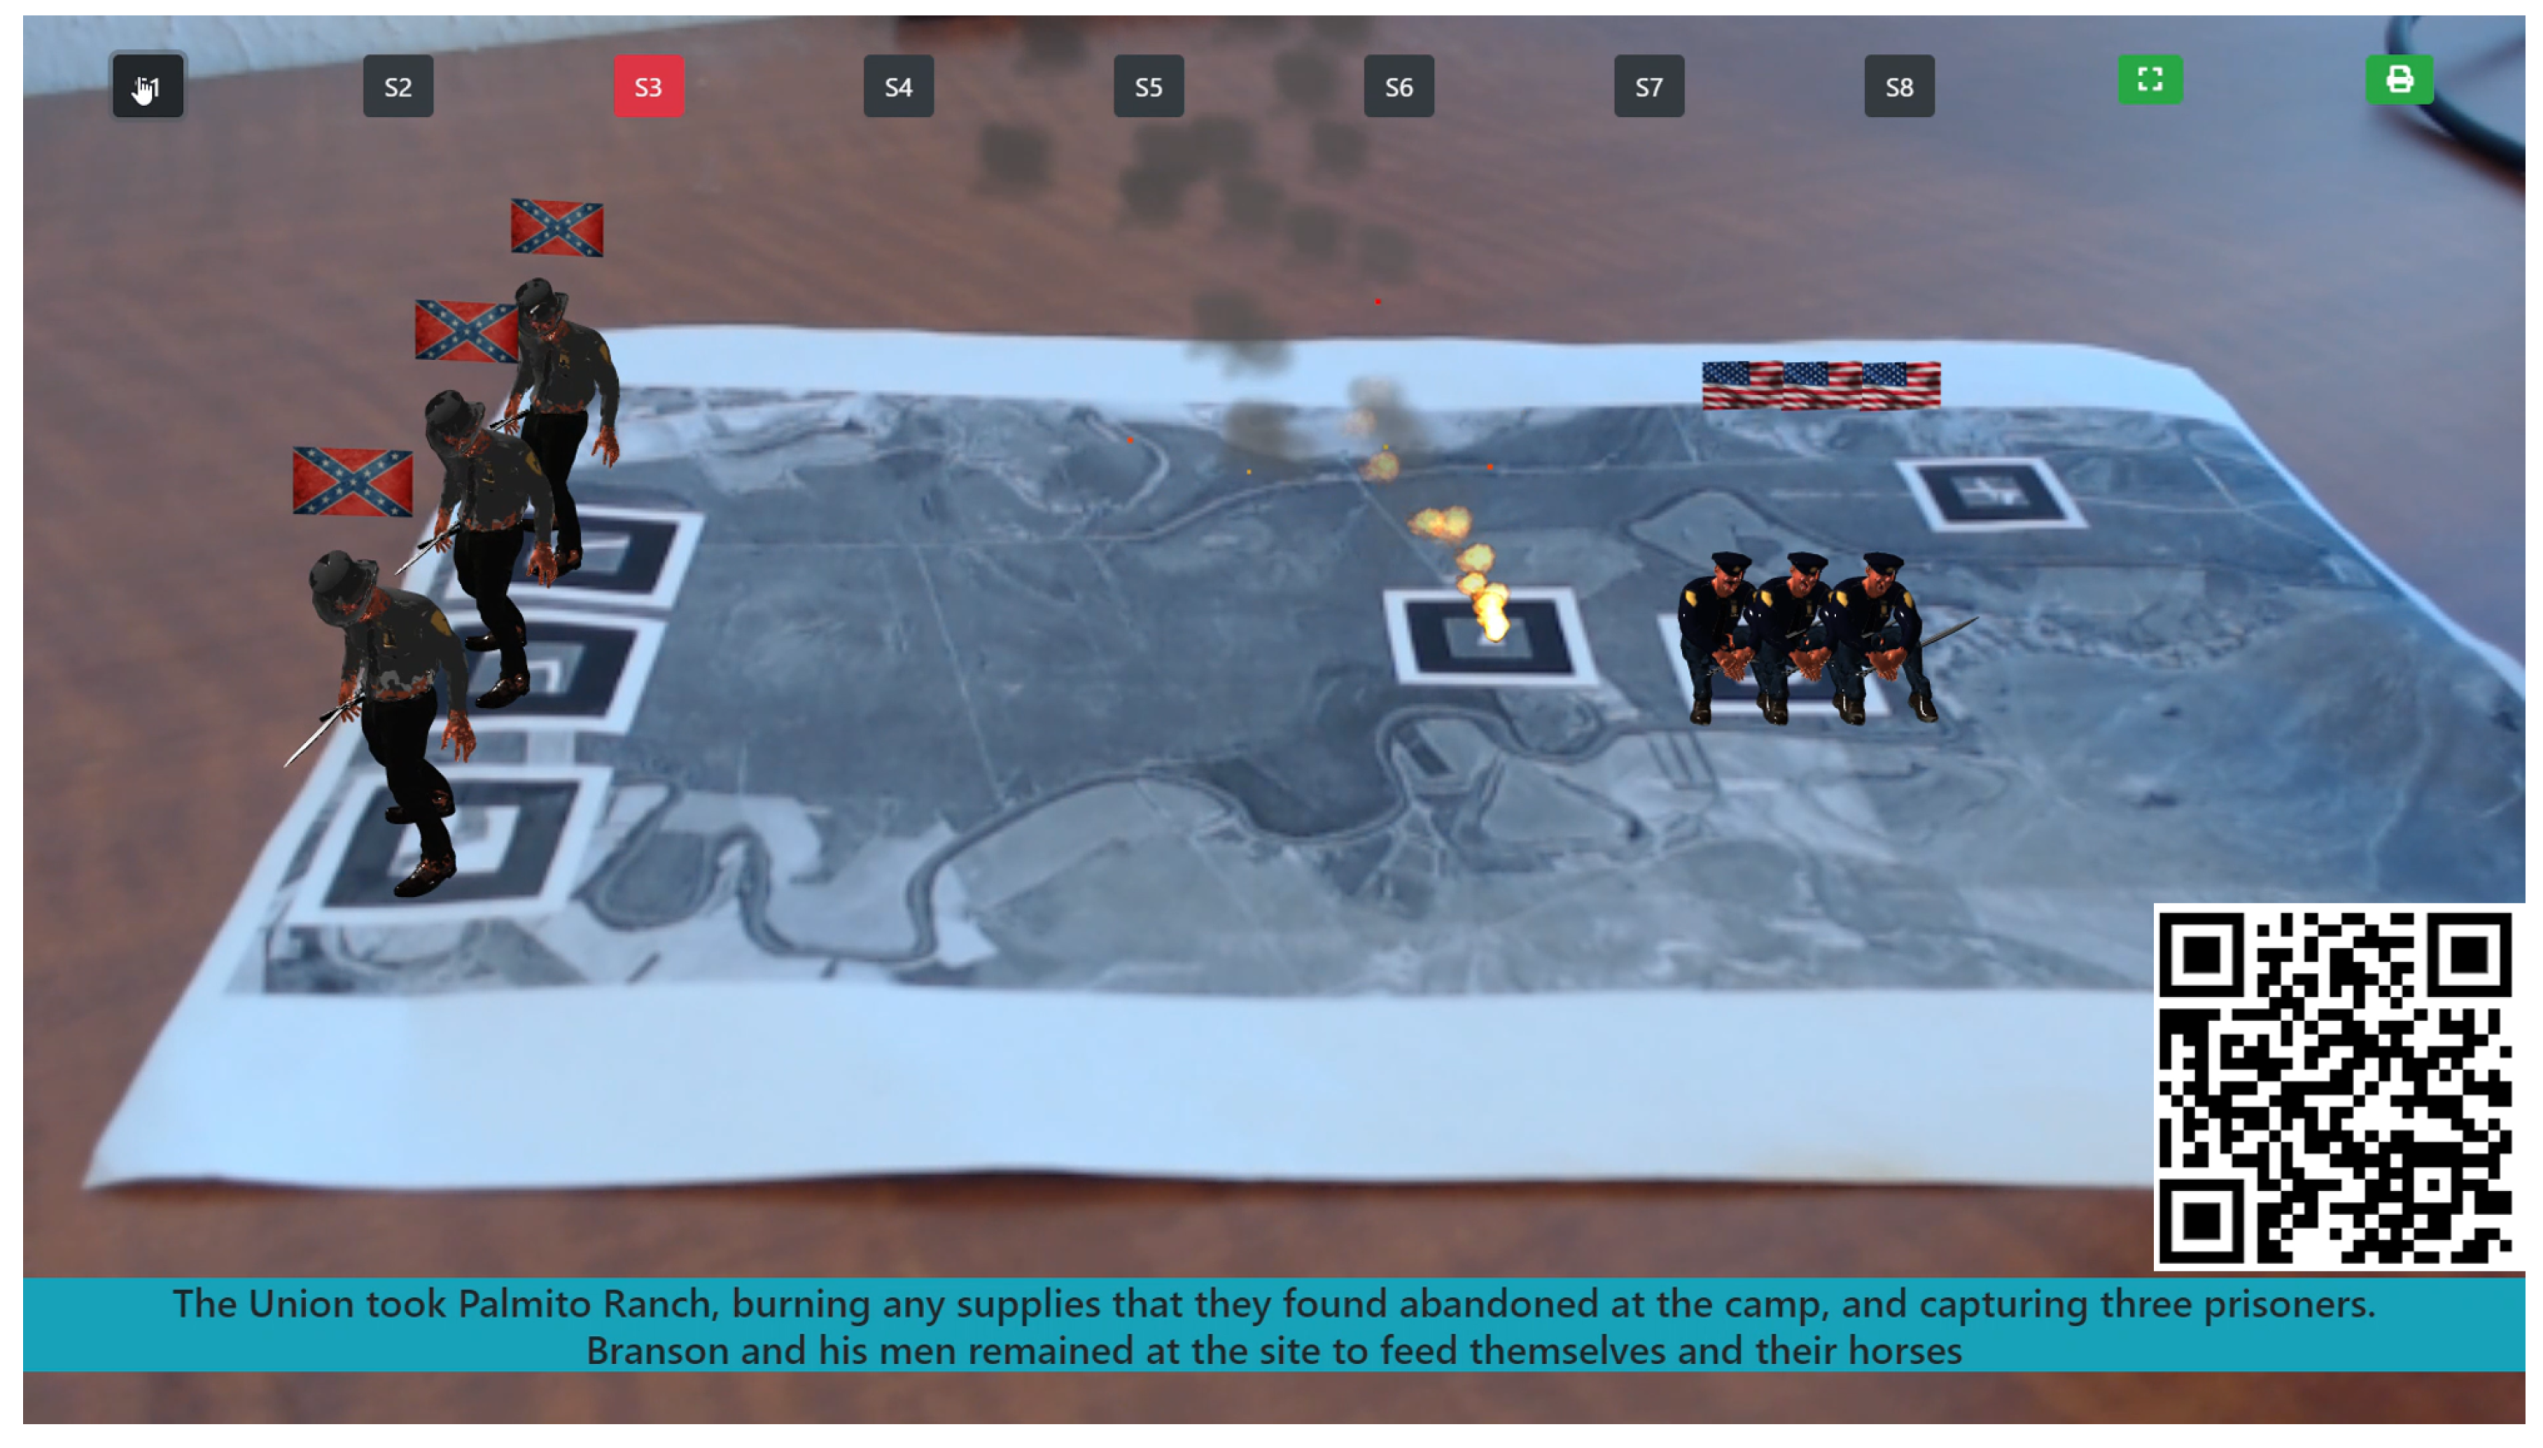
The main component also includes ten buttons positioned on top of the screen as depicted in
Figure 3. It should be noted that the “QR” code seen in the image is not part of the visual design. Its position serves as an indicator to more easily navigate to the AR application. A QR code in simple terms is a machine-readable code made of black and white squares used for storing URLs (in our case, the Web-based AR application) that are read by the camera on a smartphone. The QR code is convenient as it is not necessary to manually enter a long URL, especially one involving special characters. In addition, iOS viewers can take advantage of a built-in QR reading feature that does not require additional installation.
The “Full Screen” button allows users to render the AR application in full screen mode, an especially useful feature on a small device. The “Print Map” button enables viewers to download the map with embedded markers. The “Buttons Stage” (denoted as S) 1–8 represents each historical battlefield event (Feature F2, F4) where users can simulate them individually. For each stage, a short description of the event is provided as the scene caption (Feature F2) positioned at the bottom of the screen. By default, the next stage is automatically triggered, and the simulation begins once the previous stage is finished (Feature F3) with a transition time of three seconds. By clicking or tapping on a particular button, visitors can experience the corresponding stage (Feature F4). Animation for each 3D model is applied based on the stage conditions (e.g., running for retreat, idle for resting, firing for attacking). A particular stage (or stage button) is enabled when the marker corresponding to that stage is found. The highlighted button (red color) indicates that the current stage is being simulated. Each stage is described as follows:
Stage 1 (S1): the Federals (or Union) began moving from White Ranch toward Palmito to attack the Confederate.
Stage 2 (S2): the Confederate scattered to different locations.
Stage 3 (S3): The Union burned supplies and remained at the site to feed themselves and their horses.
Stage 4 (S4): the Confederate arrived with reinforcement and forced the Union back to White Ranch.
Stage 5 (S5): the Union returned with reinforcements and scattered the Confederate.
Stage 6 (S6): the Union rested at Tulosa on the river.
Stage 7 (S7): the large Confederate force hammered the Union line with artillery (cannon).
Stage 8 (S8): the Union retreated.
A description of each stage was transcribed into audio to enhance the user experience. We tried different methods to obtain the most natural narrator, such as Google Text to Speech (TTS), iOS TTS, Windows TTS, and IBM TTS. We determined that IBM TTS provided the best output at this time of conversion in terms of a human-like voice. These audios are triggered to play inline with each stage.
4.1.2. The Marker Component
To correctly present 3D objects in a real-world context the system needs to calculate the location and orientation of the camera (or pose). Several tracking methods have been studied in the fields of computer vision, robotics or photogrammetry, such as sensor tracking methods, visual tracking methods, and hybrid methods [
23]. Each method relies on a special sensor. Visual tracking methods are of special interest in AR applications since the camera is already a built-in feature. In this visual tracking method, there are two popular approaches to superimpose 3D models onto the real physical world, including marker-based and markerless. In the markerless approach, prior knowledge of the user’s surrounding environment is not needed to overlay 3D contents.
The marker-based approach, on the other hand, provides a system with an easily detectable, predefined sign in the environment (e.g., object, image). The system can detect this sign by applying image processing, pattern recognition, and computer vision techniques. Once the sign is detected, a 3D object would be correctly positioned. There are two main types of markers used in typical AR applications, including template markers and 2D bar-code markers. The former identifies the marker, while the latter deciphers the data encoded in the marker. In the current stage of development, the location of the marker is our main interest, so we devised a template marker as a sign to position the soldiers (Feature F5). The intuitive approach of using a template marker is to have a database that contains sample images of a marker. The system will compare these sample images against segmented images extracted from the camera to retrieve the best match.
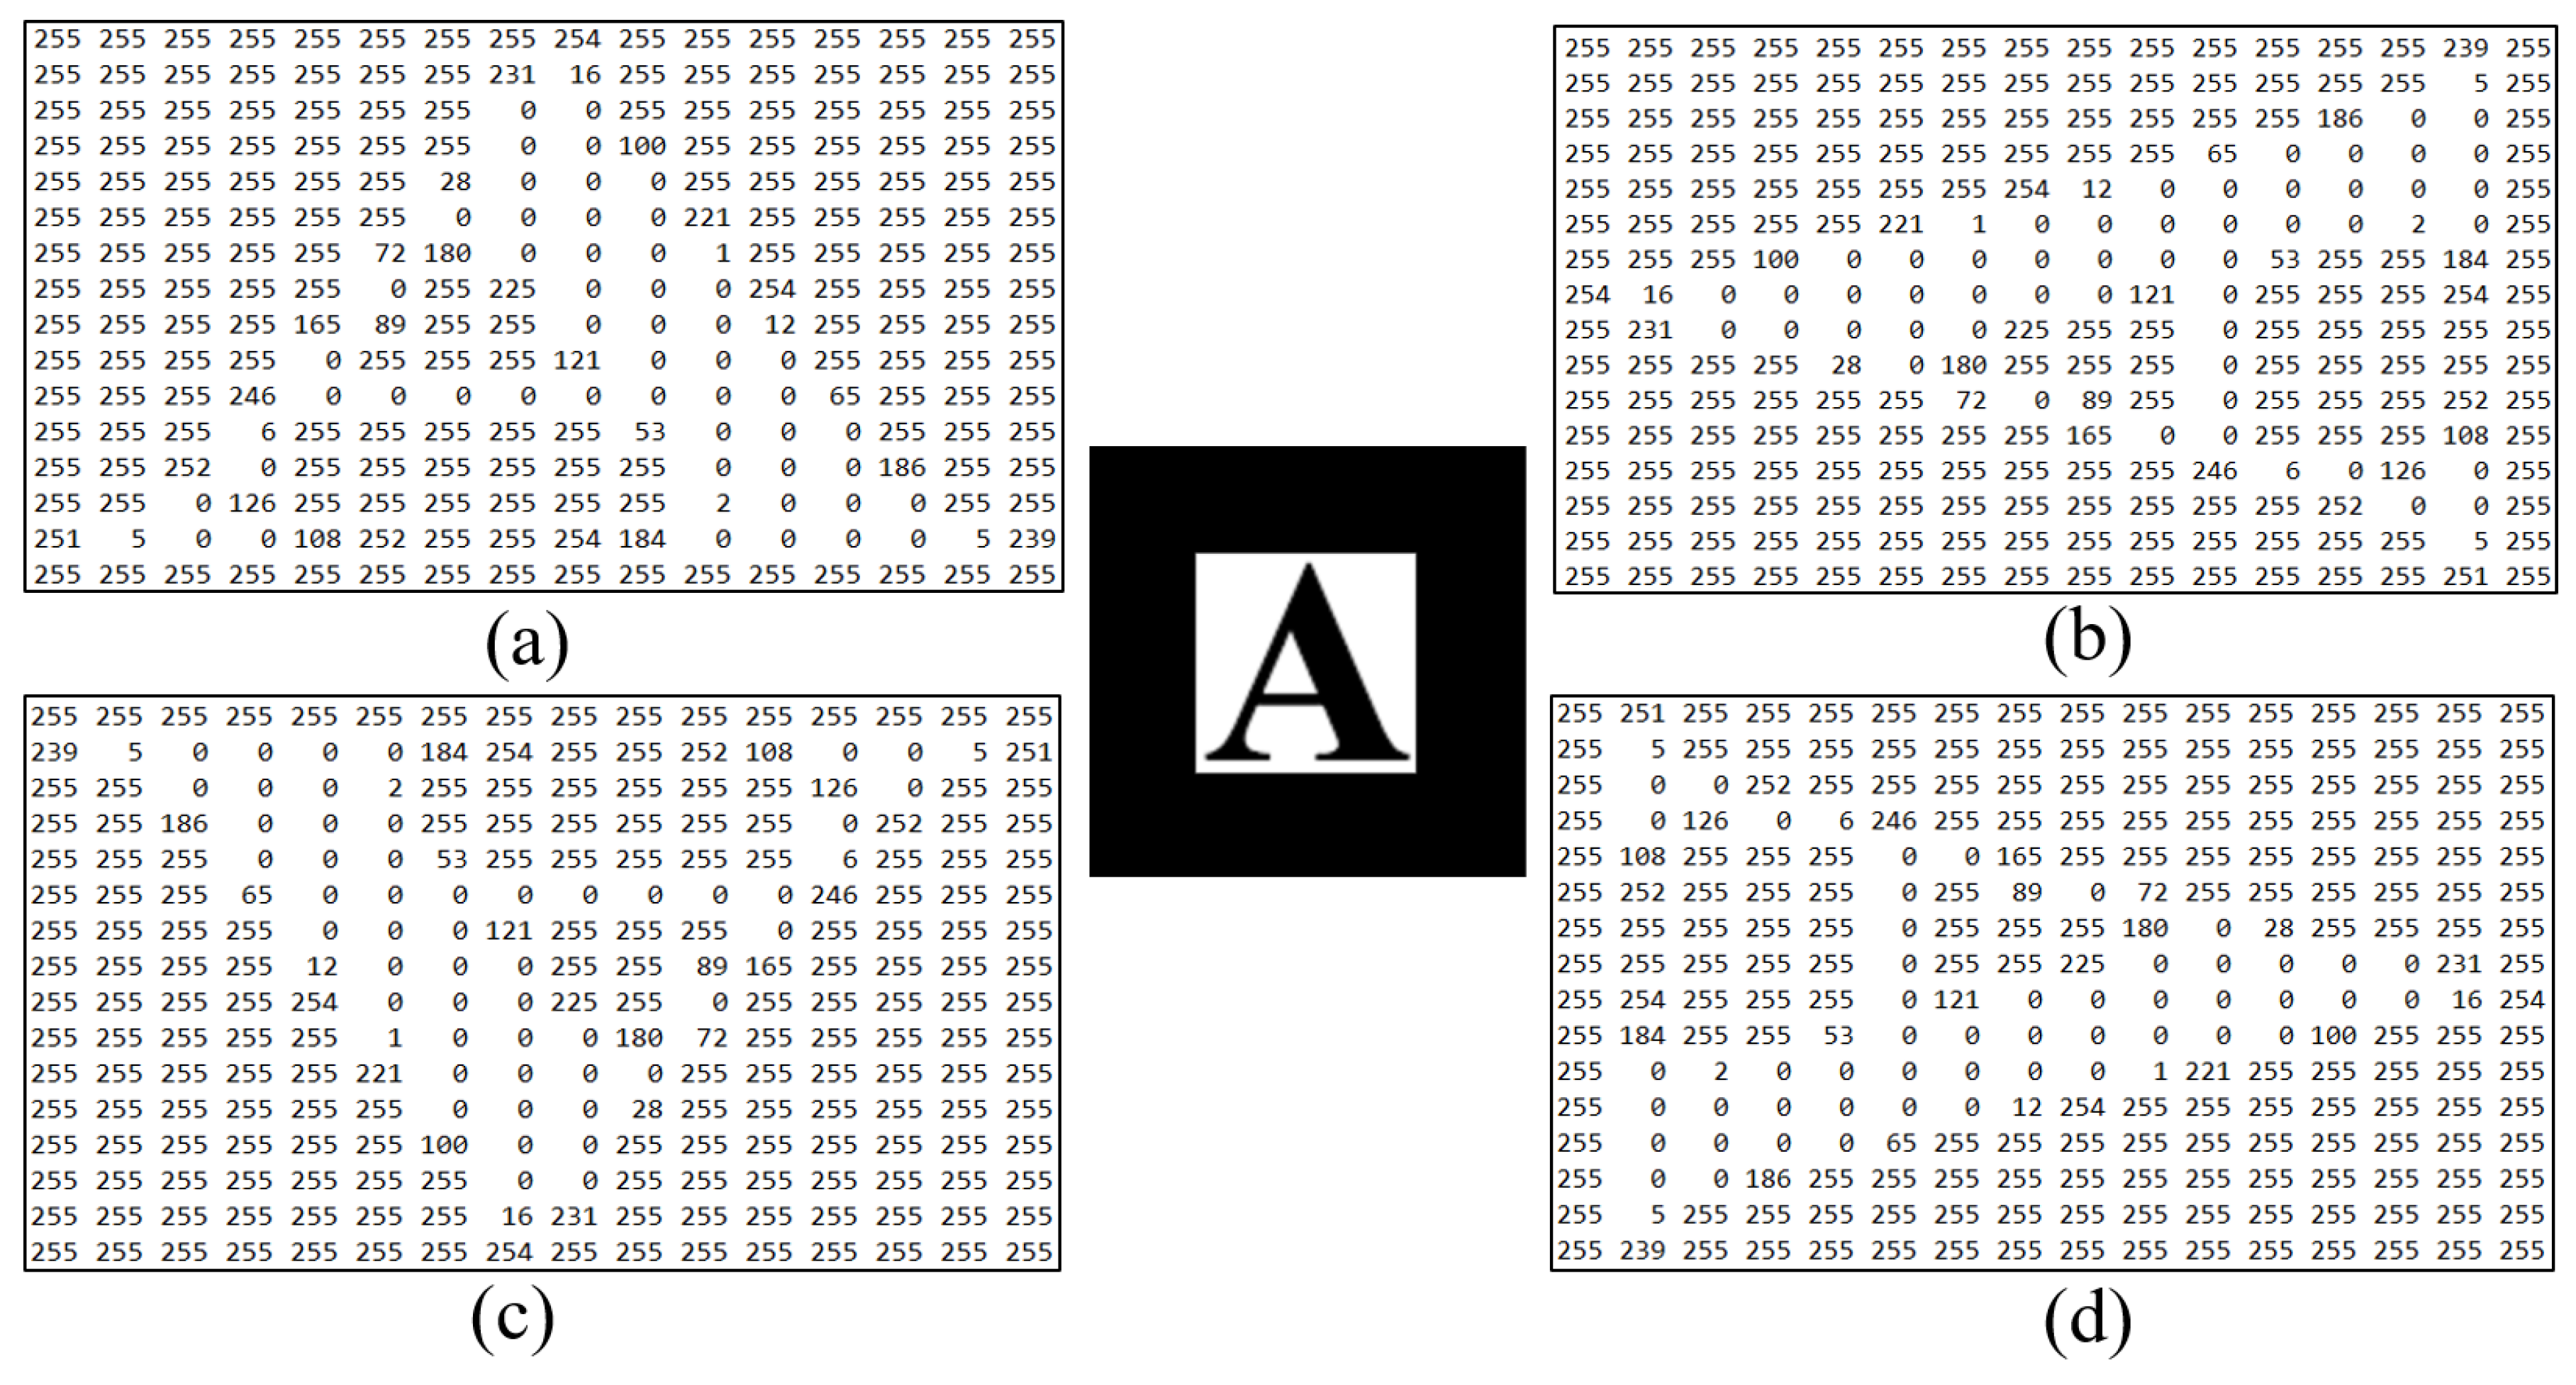
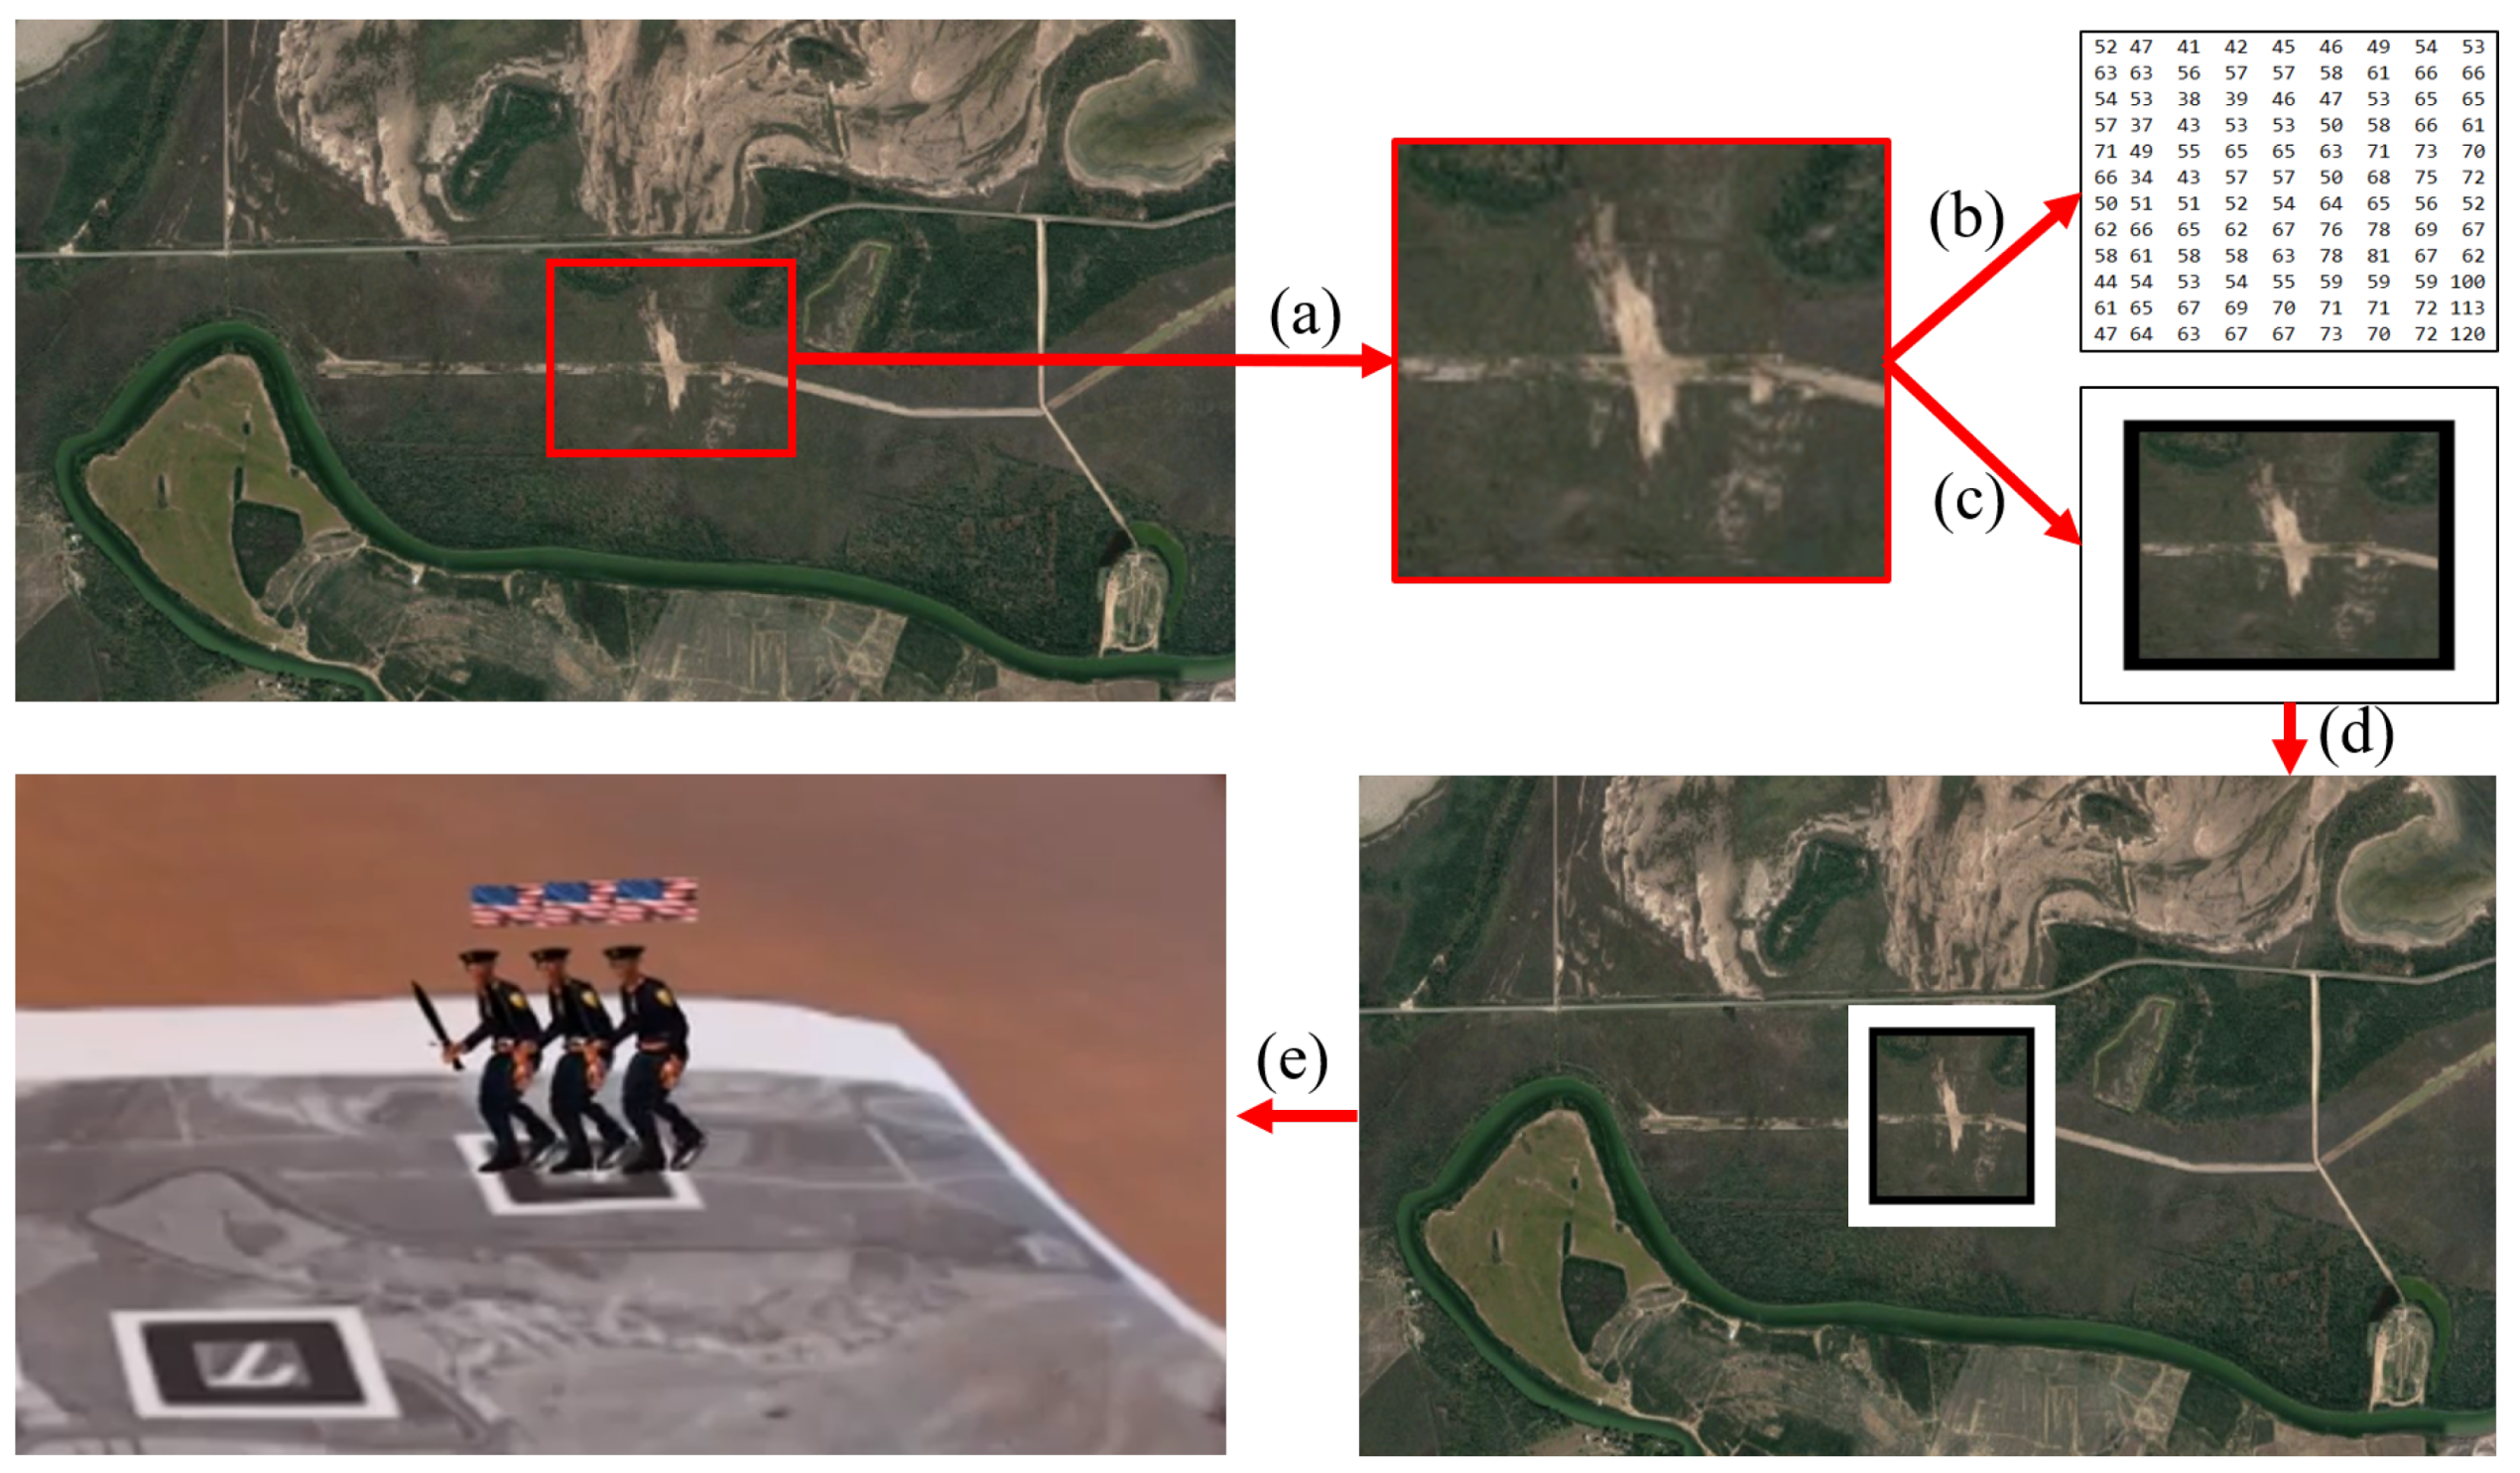
Figure 4 illustrates a sample template marker (i.e., letter A) with four matching templates (a, b, c and d) corresponding to four different orientations (normal, rotate left, rotate upside down, and rotate right respectively). Each pixel on the image is encoded by a number (in grayscale) using 0 for black and 255 for white color. The template providing the best match (highest similarity or smallest dissimilarity values) within a certain threshold is the correct marker. Building on the procedure for the template marker, our approach makes a slight variation by using an area on the map as a sign for detection instead of using regular letters. As shown in
Figure 5, we capture the base location of the troop
Figure 5a, this image is then sampled (or converted into templates
Figure 5b) by using the training image tool [
24]. The cropped image (which is augmented by a black square box
Figure 5c) will be overlaid on the existing map at the exact location
Figure 5d. Hence, a 3D object is superimposed on the desired position
Figure 5e.
Users pointed their camera toward the printed map to look for markers. Once the markers were detected, their positions were extracted and used as points for troop movement between any markers.
We found the most challenging tasks while developing the AR application and testing these embedded markers were the detection and recognition of multiple markers due to their positions and lighting conditions. Sometimes, two or three markers disappeared (due to lighting conditions) or flickered. To overcome this issue, we applied the Kalman Filter algorithm [
25] to estimate the position of the marker once it was first detected. The goal of the Kalman Filter algorithm was to estimate the state of a discrete-time controlled process
x governed by the following linear stochastic difference equation:
with a measurement
z
where
is the true state or true position of the object at time k
A is the state transition model applied to the previous state
B is the control-input model applied to the control vector
are the process and measurement noise respectively.
H is the measurement model mapping the true state space into observed space.
The role of the Kalman filter was to estimate at time k, given the initial estimate of , the series of measurement, and the information of the system described by A, B, H.
4.2. Evaluation
To evaluate the AR application, we used the technology acceptance model (TAM) originally proposed by Davis [
26] to assess an individual’s acceptance of information technology. It has proven to be a useful theoretical framework in explaining certain aspects of information technologies as well as understanding customer behavior toward using these technologies. The use of TAM has been empirically validated in a variety of contexts such as mobile technology [
27], virtual communities [
28], virtual worlds [
29], and health care [
30], as well as serving as a means to understand customer decision making processes [
31]. Initially, perceived usefulness and perceived ease of use were the two main measures used in TAM. The former refers to “the degree to which a person believes that using a particular system would enhance his or her job performance”, whereas the latter is defined as “the degree to which a person believes that using a particular system would be free from effort” [
32]. Over the years, the TAM has been continuously studied and expanded with much attention focused on assessing the robustness and validity of the questionnaire instruments (either origin or modified).
In line with the TAM, the Task–Technology Fit Model (TTFM) [
33] is another variation model that assumes task technology fit will influence the performance outcome. This model asserted that the technology must be 1) utilized and 2) a good fit with the tasks it supports in order to have positive impacts on individual performance. Dishaw and Strong [
34] extended the TAM with TTFM constructs, and since then, this blended model has been used in many studies [
35,
36,
37]. Their findings suggested that task-technology fit influences perceived ease of use.
When designing an application, visual design (or visual appeal) plays an important role in retaining customers as it increases trust and loyalty [
38]. Hartmann el al. [
39] suggested that ‘beauty matters and it influences decisions that should be independent of aesthetics’. This measure was then used in many domains, for example, Verhagen et al. [
40] confirmed that visual attractiveness positively influences the perceived usefulness.
4.3. Research Hypotheses
Based on the literature review, the following hypotheses are proposed:
H1: perceived visual design will have a positive effect on perceived task technology fit.
H2: perceived visual design will have a positive effect on perceived usefulness.
H3: perceived task technology fit will have a positive effect on perceived ease of use.
H4: perceived ease of use will have a positive effect on perceived usefulness.
H5: perceived usefulness will have a positive effect on intention to use.
H6: perceived ease of use will have a positive effect on intention to use.
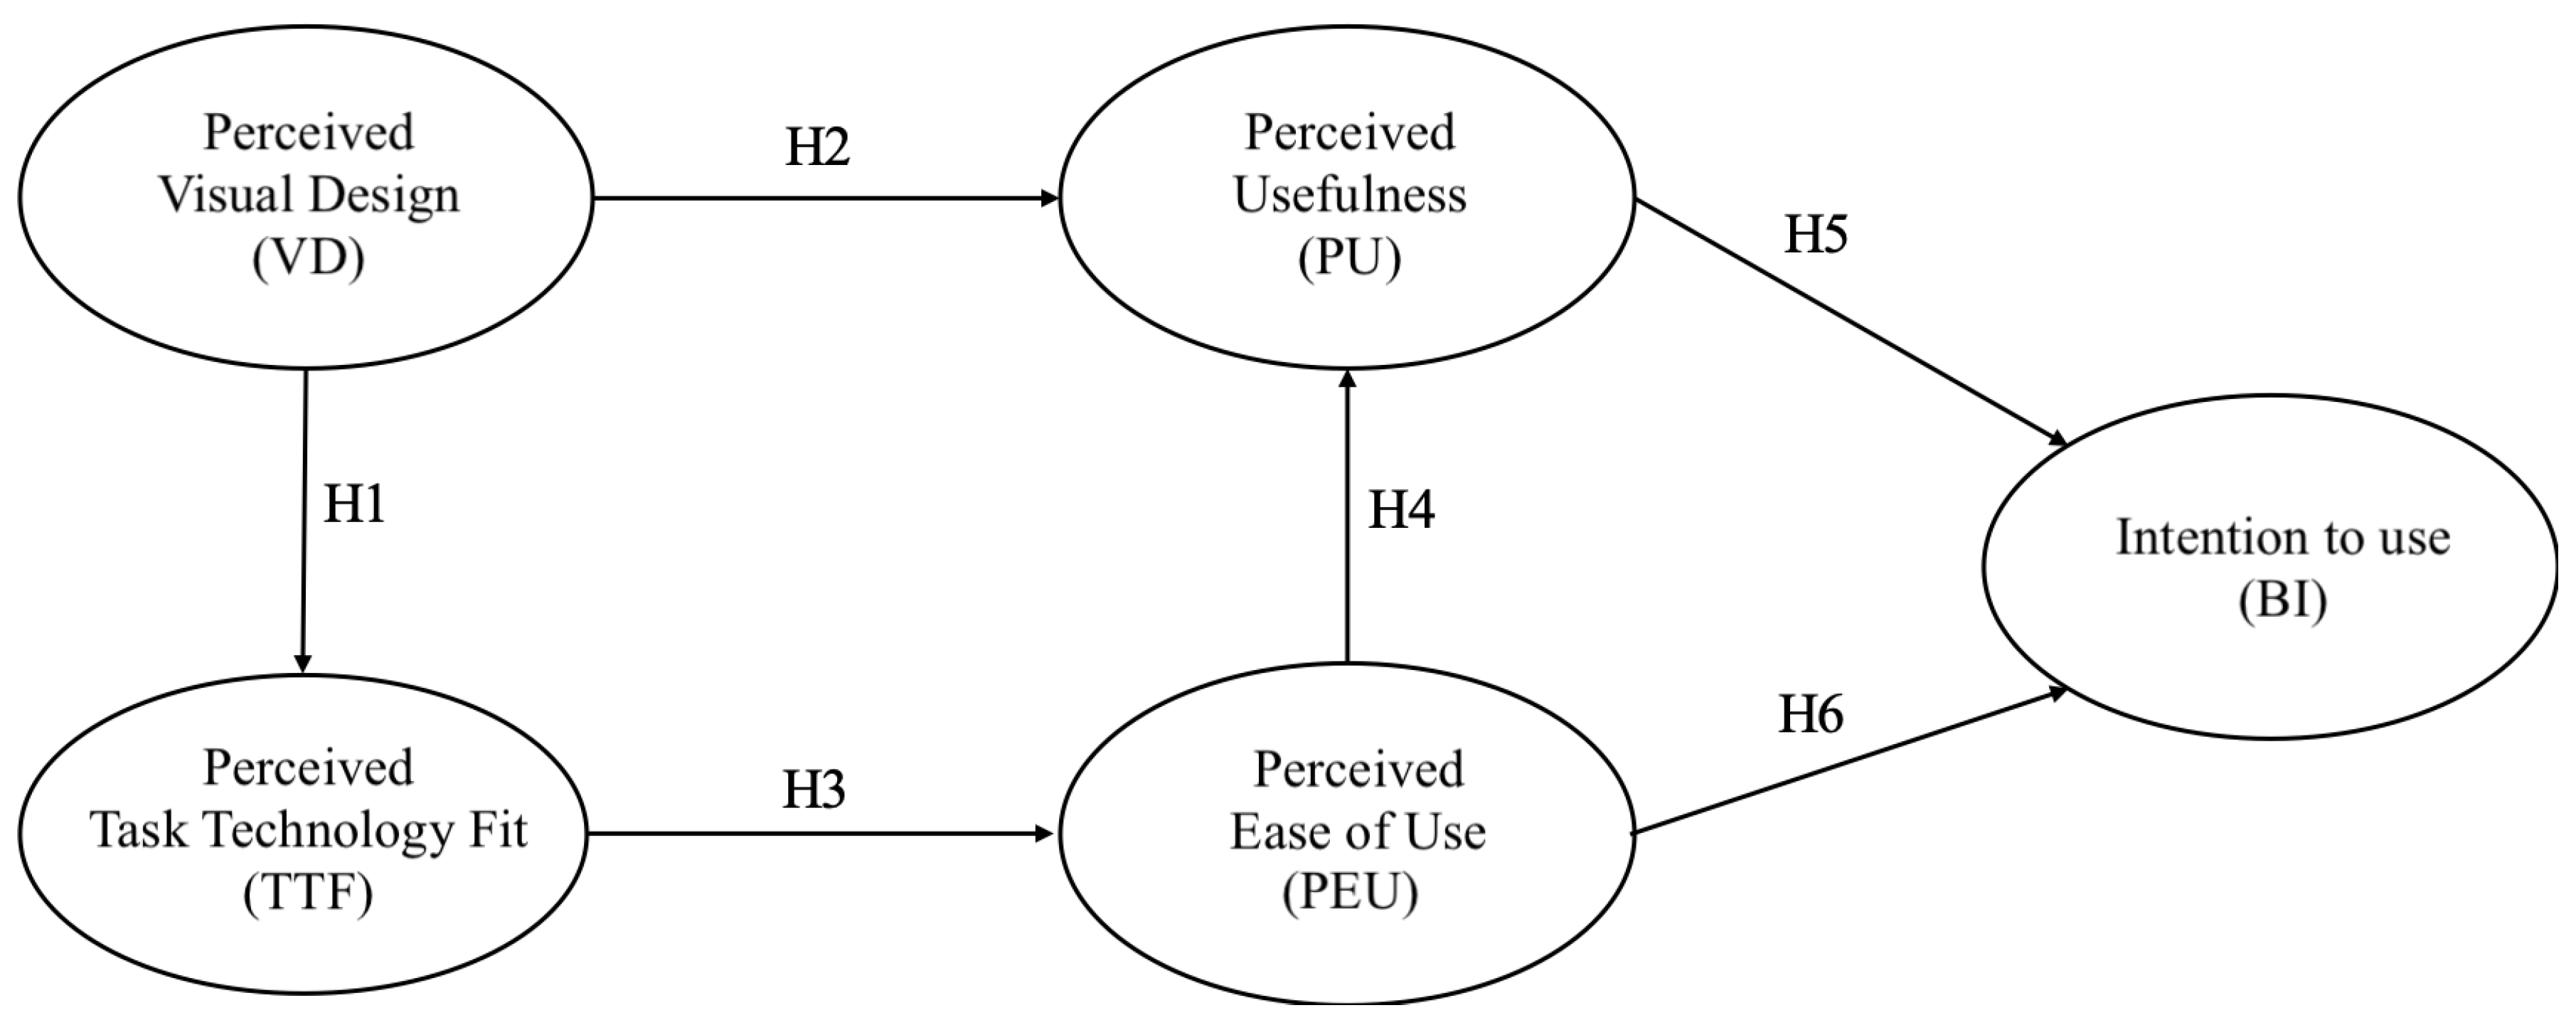
These hypotheses translated into the research model depicted in
Figure 6, represented as a causal relationship schema and used as a point of departure for this research. The boxes represent the constructs (also called latent variables) which were measured by a set of items, with arrows representing hypotheses from 1 to 6.
4.4. Data Collection and Analysis
To test the hypotheses, we conducted an online survey to collect data from undergraduate and graduate students, as well as faculty members. Participants were given a Google Form embedded with a YouTube video link and 23-question items consisting of 20 questions for user’s behavior, and three questions for demographic information. In the first part of the survey, participants were asked to respond to questions about their attitude and behavioral intention of using PalmitoAR with 5-point Likert scales (coded as 1—strongly disagree, 2—disagree, 3—neutral, 4—agree, 5—strongly agree). In the second part, subjects were asked to provide general demographic information about their gender, English as a first language, and ethnicity. Questionnaires were developed around items comprising perceived task technology fit (TTF) (adapted from [
37]), perceived visual design (VD) [
40], perceived usefulness (PU) [
32], perceived ease of use (PEU) [
32], and intention to use (BI) [
32].
Table 1 provides a list of items used to measure each variable.
The survey was sent out to over 50 subjects. The collection of these questionnaires yielded 26 usable data responses. Data collected from the 26 responses were converted into Excel format for analysis.
Table 2 shows the classification and percentage of the participants in each category.
A web-based software for generalized structure component analysis [
41] was used for hypothesis testing as well as complementary analyses (e.g., internal consistencies, correlations). The generalized structured component analysis (GSCA) [
42] is an approach to component-based structure equation modeling (SEM) and works well with a small sample size, without rigid distributional assumptions (e.g., normality assumption) [
43].
5. Results
Overall, the AR application has received positive feedback from participants in the study. Comments related to better improve the PalmitoAR include: 1) improving the user interface and graphic design to make the scenario more realistic, 2) adding more information about the battle such as the number of deaths, 3) adding an introduction to the AR application. We take participant’s feedback as a positive input to improve the PalmitoAR in the next step. Adding visual content to the scene is not a technical challenge compared to improving the user interface and graphic design as there is no standard UI for AR application at this time. This work can be improved through more user feedback on a particular visual design.
The descriptive statistics of the five constructs are shown in
Table 3. All means are above the midpoint of
. The standard deviations range from 0.66 to 1.20, indicating a narrow spread around the mean.
To measure how closely related a set of questionnaires are as a group, we used coefficient alpha [
44] as a measure of internal consistency. All of the measures employed in this study demonstrated reasonable internal consistency, ranging from 0.748 to 0.945 (see
Table 4), thereby exceeding the reliability estimates (
= 0.70) recommended by Nunnally [
45].
Table 5 presents the loading estimates for the indicators along with standard errors (SEs) of the parameter estimates calculated from 500 bootstrap samples. To determine the statistical significance of the parameter estimates, a 95% bootstrap percentile confidence interval (CI) was calculated—i.e., a parameter estimate is assumed to be statistically significant at 0.05 alpha level if the CI does not include the value of zero. Note that 95%CI_LB and 95%CI_UB denote the lower bound and the upper bound of a parameter estimate at 0.05 alpha level, respectively. All loading estimates were greater than 0.6 and were statistically significant, and therefore these items were good indicators of the constructs.
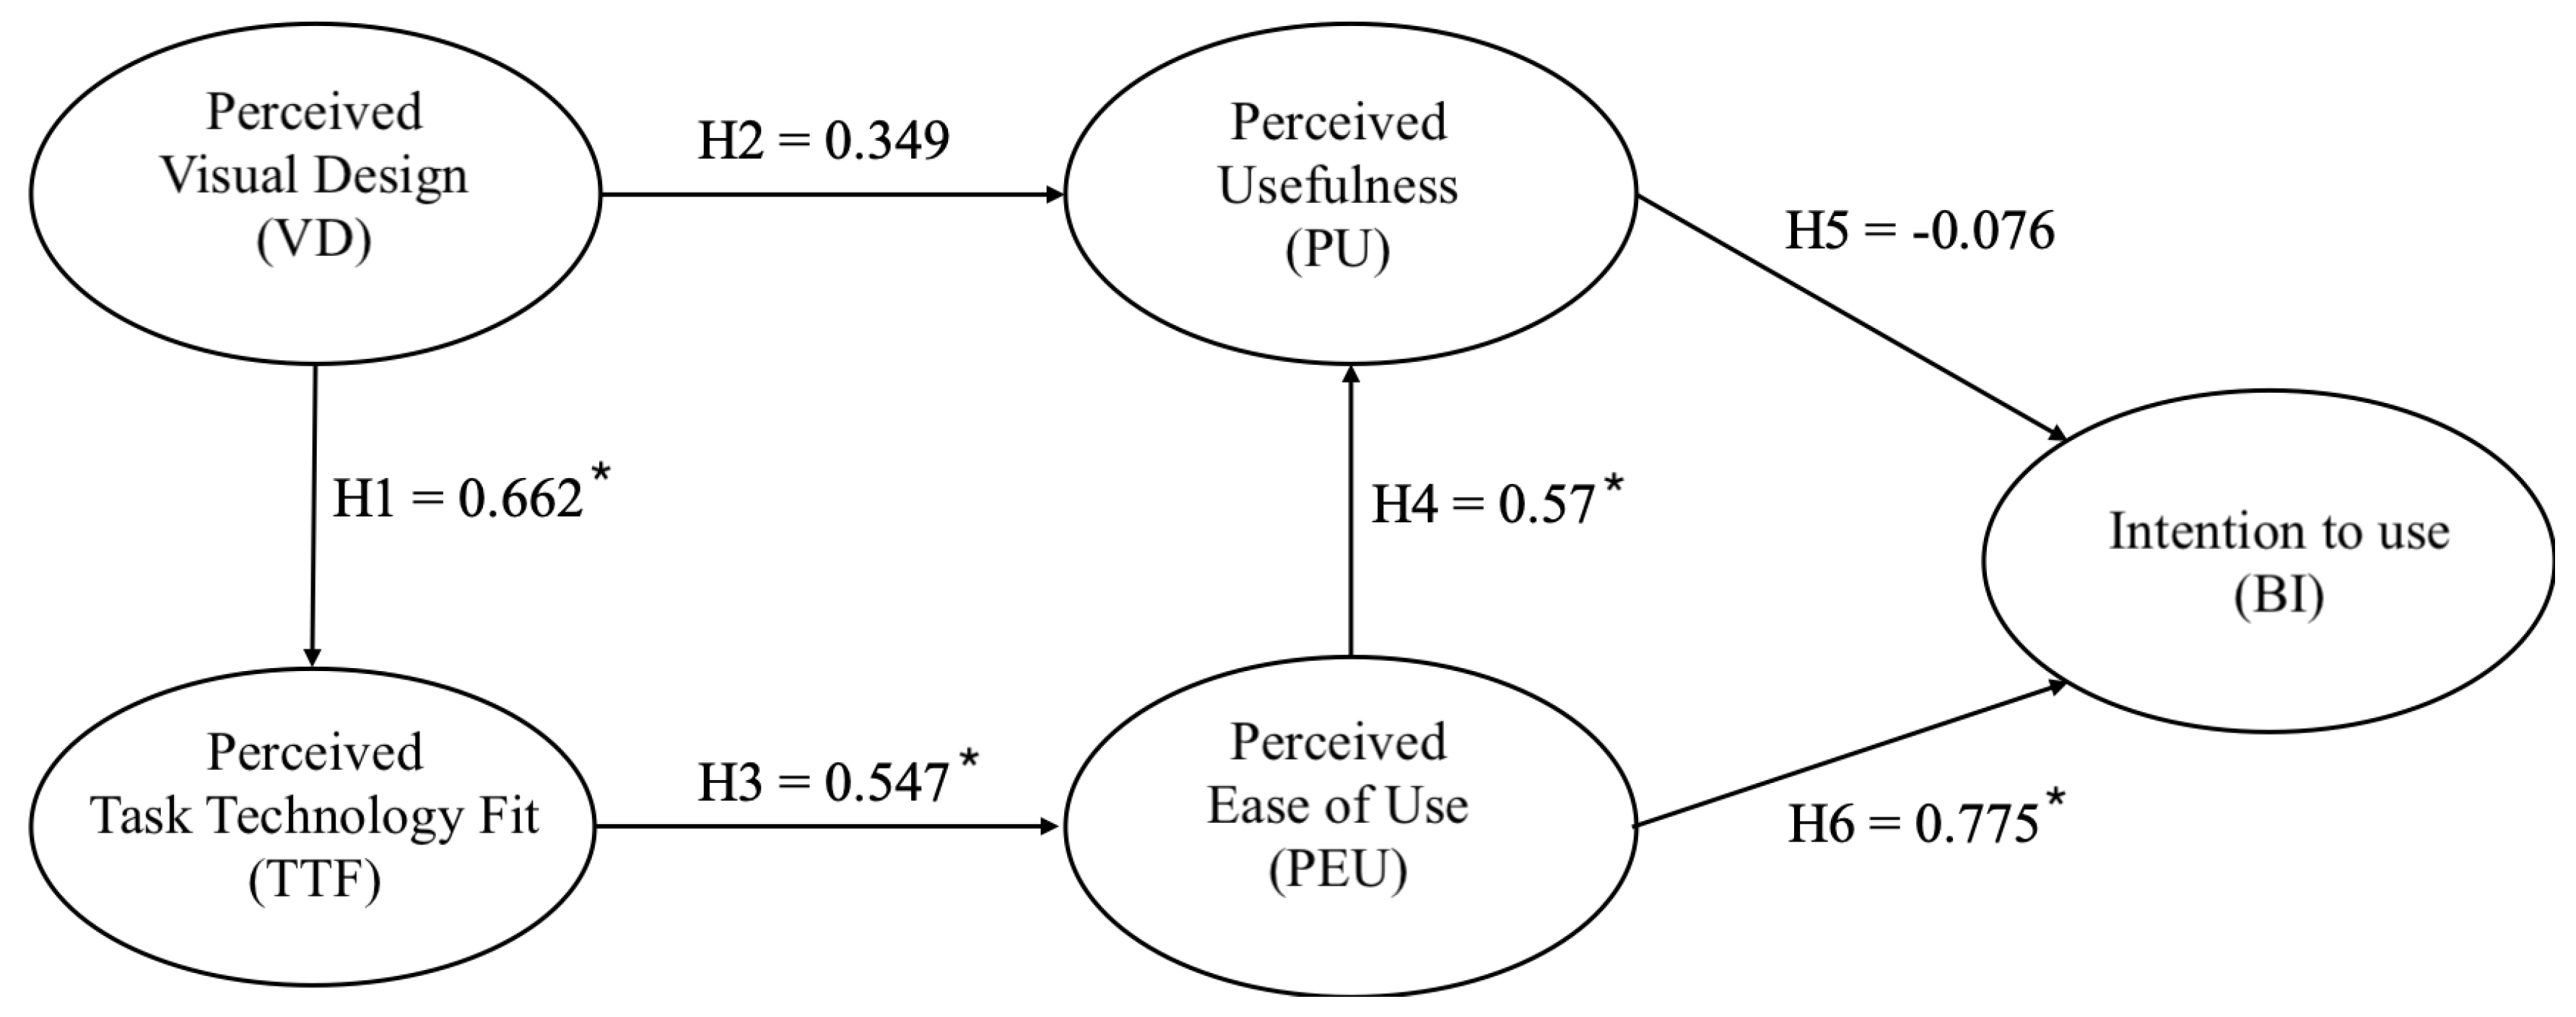
We fitted the hypothesized technology acceptance model to the dataset. We used 500 bootstrap samples for the estimation of standard errors and confidence intervals. The structural model with path coefficients is depicted in
Figure 7. The model entails five constructs that underlie the 20 indicators. The five constructs are Task Technology Fit (TTF), Visual Design (VD), Perceived Usefulness (PU), Perceived Ease of Use (PEU), and Intention to Use (BI).
Table 6 shows the means and variances of constructs, while
Table 7 shows the correlations of constructs.
As can be seen in
Table 8, GSCA provided that FIT = 0.695 (SE = 0.043, 95% CI = 0.591–0.770), AFIT = 0.665 (SE = 0.047, 95% CI = 0.551–0.750), GFI = 0.997 (SE = 0.002, 95% CI = 0.990–0.999), SRMR = 0.120 (SE = 0.027, 95% CI = 0.112–0.216). Both FIT and Adjusted FIT (AFIT) take into account the variance of the data explained by a given particular model specification. The values of FIT range from 0 to 1. The characteristics and interpretations of FIT and AFIT are comparable to
and adjusted
in linear regression. Here, FIT and AFIT indicate that the model accounted for about 69.5% and 66.5% of the total variance of all variables, respectively. Both FIT and AFIT turned out to be statistically significantly different from zero. Next, GFI and SRMR as additional measures of overall model fit reflect the closeness between the sample covariances and the covariances reproduced by the model parameter estimates. The GFI values close to 1 and the SRMR values close to 0 may be taken as indicative of a good fit. The value of GFI was very close to 1, whereas the value of SRMR was rather large and found to be statistically different from zero.
Table 9 provides the estimates of path coefficients along with their standard errors and 95% confidence intervals. In general, the interpretations of the path coefficient estimates are consistent with the relationships among the constructs hypothesized in the model (as depicted in
Figure 7). That is, Visual Design had statistically significant and positive influences on Task Technology Fit (H1 = 0.662, SE = 0.149, 95% CI = 0.274–0.867), Task Technology Fit had a statistically significant and positive influence on Perceived Ease of Use (H3 = 0.547, SE = 0.150, 95% CI = 0.310–0.861). In turn, Perceived Ease of Use had statistically significant and positive effects on Perceived Usefulness and Intention to use (H4 = 0.570, SE = 0.187, 95% CI = 0.183–0.957; H6 = 0.775, SE = 0.190, 95% CI = 0.453–1.304). However, our hypotheses of H2 (Visual Design → Perceived Usefulness) and H5 (Perceived Usefulness → Intention to use) were not supported.
6. Discussion
During the development of the proposed AR application, we faced some challenges that should be addressed in future research.
First, in the AR design it was difficult to overlay all information on a small screen such as a handheld mobile device because it will occlude the main AR scene. Although audio was supported, non-native English speakers may have difficulty understanding the historic content. However, history education is also targeted towards people of international origin as education for them is particularly important in the U.S. Future studies may add display captions in order to better deliver the content materials to non-native English speakers. In addition, further improvements can be made by either splitting long sentences into smaller text segments, or by translating English audio parts into different languages.
Second, the detection/recognition of markers are sensitive to lighting conditions and the angle between the camera and the printed map. Orienting the camera perpendicular to the map yields the best result, but the 3D models will then be seen from the top-down, thus reducing the natural observations.
Third, creating 3D contents for augmented reality is still a time-consuming task due to the variety of file formats. Tools exist for developers to speed up modeling with pre- built-in 3D models (as used in our application) with very detailed modifiable features. However, the more customized the tool, the higher the resolution of the 3D models. It would then end up with a large size model that is not typically suitable for a browser. Our approach tried to mitigate this issue by converting a model into a binary format as the browser can accommodate up to 3 to 4 different models. However, when it goes beyond this number, the frame rate in the browser starts to drop significantly. This problem worsens if it takes too long to download and initialize models, with the result that users are more likely to leave the application before experiencing it. One possible approach to alleviate this issue is through Cloud Rendering where AR is hosted on the cloud, users send camera feed to the remote server, and the server would then render and stream back to users with a better AR quality.
Fourth, as mentioned earlier our intention was to bring an AR experience to a variety of users, visitors, and students through a default browser. However, not every handheld browser has sensor APIs to support AR (e.g., camera, gyroscope, accelerometer, orientation, magnetometer). Another issue related to the browser is the accessibility to the camera object. Currently, the AR camera handles the augmentation independent from the traditional camera, meaning that it works at the operation system level and not on top of the camera itself, thus leading to computational and visible lag.
7. Conclusions
This paper presented a web-based AR application that enables both students and tourists to witness a series of battlefield events that occurred at the Battle of Palmito Ranch. The technology acceptance model was adapted to measure user behavior toward experiencing the proposed AR application in terms of task technology fit, visual design, perceived usefulness, perceived ease of use, and intention to use. The study results showed that visual design had statistically significant and positive influences on the task technology fit, that task technology fit had a statistically significant and positive influence on perceived ease of use, and perceived ease of use had statistically significant and positive effects on the intention to use and perceived usefulness. This study did not find significant relationships between the visual design and the perceived usefulness, nor between the perceived usefulness and the intention to use the PalmitoAR application. Reasoning for these non-significant relationships will be further investigated in a large-scale user experience study. It would be valuable to replicate the findings of the present work in other educational areas, such as natural science (e.g., geography) or business education (e.g., tourism and hospitality management).
Author Contributions
Conceptualization, Kwanghee Jung, Vinh T. Nguyen, Seung-Chul Yoo, Seungman Kim and Sohyun Park; data curation, Kwanghee Jung, Vinh T. Nguyen and Seung-Chul Yoo; formal analysis, Kwanghee Jung and Vinh T. Nguyen; funding acquisition, Kwanghee Jung, Sohyun Park and Melissa Currie; investigation, Kwanghee Jung, Vinh T. Nguyen, Seung-Chul Yoo, Sohyun Park and Melissa Currie; methodology, Kwanghee Jung, Vinh T. Nguyen, Seung-Chul Yoo and Seungman Kim; project administration, Kwanghee Jung; resources, Kwanghee Jung, Vinh T. Nguyen, Seung-Chul Yoo, Seungman Kim, Sohyun Park and Melissa Currie; software, Kwanghee Jung, Vinh T. Nguyen and Seungman Kim; supervision, Kwanghee Jung and Melissa Currie; validation, Kwanghee Jung, Vinh T. Nguyen and Seung-Chul Yoo; visualization, Kwanghee Jung and Vinh T. Nguyen; writing—original draft, Kwanghee Jung, Vinh T. Nguyen and Seung-Chul Yoo; writing—review and editing, Kwanghee Jung, Vinh T. Nguyen, Seung-Chul Yoo and Melissa Currie. All authors have read and agreed to the published version of the manuscript.
Funding
This work was supported by a grant from National Park Service GA-2287-15-022.
Conflicts of Interest
The authors declare no conflicts of interest.
References
- Wojciechowski, R.; Walczak, K.; White, M.; Cellary, W. Building virtual and augmented reality museum exhibitions. In Proceedings of the Ninth International Conference on 3D Web Technology, Monterey, CA, USA, 5–8 April 2004; pp. 135–144. [Google Scholar]
- Magnenat-Thalmann, N.; Papagiannakis, G. Virtual worlds and augmented reality in cultural heritage applications. In Recording, Modeling and Visualization of Cultural Heritage. In Proceedings of the International Workshop, Centro Stefano Franscini, Monte Verita, Ascona, Switzerland, 22–27 May 2005; pp. 419–430. [Google Scholar]
- Papagiannakis, G.; Schertenleib, S.; O’Kennedy, B.; Arevalo-Poizat, M.; Magnenat-Thalmann, N.; Stoddart, A.; Thalmann, D. Mixing virtual and real scenes in the site of ancient Pompeii. Comput. Anim. Virt. Worlds 2005, 16, 11–24. [Google Scholar] [CrossRef]
- Service, N.P. American Battlefield Protection Program. 2019. Available online: https://www.nps.gov/subjects/battlefields/american-battlefield-protection-program-grants.htm (accessed on 28 January 2020).
- Travel, T. Brownsville: Palmito Ranch Battlefield. 2019. Available online: https://texastimetravel.oncell.com/en/brownsville-palmito-ranch-battlefield-64366.html (accessed on 2 July 2019).
- Nguyen, V.T.; Jung, K.; Yoo, S.; Kim, S.; Park, S.; Currie, M. Civil War Battlefield Experience: Historical Event Simulation using Augmented Reality Technology. In Proceedings of the 2019 IEEE International Conference on Artificial Intelligence and Virtual Reality (AIVR), San Diego, CA, USA, 9–11 December 2019; pp. 294–2943. [Google Scholar] [CrossRef]
- Chung, N.; Han, H.; Joun, Y. Tourists’ intention to visit a destination: The role of augmented reality (AR) application for a heritage site. Comput. Human. Behav. 2015, 50, 588–599. [Google Scholar] [CrossRef]
- Hollerer, T.; Feiner, S.; Pavlik, J. Situated documentaries: Embedding multimedia presentations in the real world. In Digest of Papers. In Proceedings of the Third International Symposium on Wearable Computers, San Francisco, CA, USA, 18–19 October 1999; pp. 79–86. [Google Scholar] [CrossRef]
- Stricker, D.; Dähne, P.; Seibert, F.; Christou, I.; Almeida, L.; Carlucci, R.; Ioannidis, N. Design and development issues for archeoguide: An augmented reality based cultural heritage on-site guide. In Proceedings of the International Conference Augmented Virtual Environments and 3D Imaging, Mykonos, Greece, 30 May–1 June 2001; pp. 1–5. [Google Scholar]
- Vlahakis, V.; Karigiannis, J.; Tsotros, M.; Gounaris, M.; Almeida, L.; Stricker, D.; Gleue, T.; Christou, I.T.; Carlucci, R.; Ioannidis, N. Archeoguide: First results of an augmented reality, mobile computing system in cultural heritage sites. Virt. Real. Archeol. Cult. Herit. 2001, 9, 584993–585015. [Google Scholar]
- Blanco-Fernández, Y.; López-Nores, M.; Pazos-Arias, J.J.; Gil-Solla, A.; Ramos-Cabrer, M.; García-Duque, J. REENACT: A step forward in immersive learning about Human History by augmented reality, role playing and social networking. Expert Sys. Appl. 2014, 41, 4811–4828. [Google Scholar] [CrossRef]
- Submission, A. Palmito Battle Field Augmented Reality Demo. 2019. Available online: https://github.com/shared85/PalmitoAR (accessed on 23 January 2020).
- TurboSquid. 3D Models for Professionals. 2019. Available online: https://www.turbosquid.com (accessed on 2 July 2019).
- Adobe. Create 3D Models, Characters. 2019. Available online: http://www.adobe.com/products/fuse.html (accessed on 10 October 2019).
- Etienne, J. Creating Augmented Reality with AR.js and A-Frame. 2019. Available online: https://aframe.io/blog/arjs (accessed on 23 January 2020).
- Mozilla. A Web Framework for Building Virtual Reality Experiences. 2019. Available online: https://aframe.io (accessed on 23 January 2020).
- Nguyen, V.T.; Hite, R.; Dang, T. Web-Based Virtual Reality Development in Classroom: From Learner’s Perspectives. In Proceedings of the 2018 IEEE International Conference on Artificial Intelligence and Virtual Reality (AIVR), Taiwan, China, 10–12 December 2018; pp. 11–18. [Google Scholar] [CrossRef]
- Nguyen, V.T.; Hite, R.; Dang, T. Learners’ Technological Acceptance of VR Content Development: A Sequential 3-Part Use Case Study of Diverse Post-Secondary Students. Int. J. Semant. Comput. 2019, 13, 343–366. [Google Scholar] [CrossRef]
- Nguyen, V.T.; Zhang, Y.; Jung, K.; Xing, W.; Dang, T. VRASP: A Virtual Reality Environment for Learning Answer Set Programming. In Proceedings of the International Symposium on Practical Aspects of Declarative Languages, New Orleans, LA, USA, 20–21 January 2020; pp. 82–91. [Google Scholar]
- Shneiderman, B. The eyes have it: A task by data type taxonomy for information visualizations. In The Craft of Information Visualization; Elsevier: Amsterdam, The Netherlands, 2003; pp. 364–371. [Google Scholar]
- Mixamo. Animated 3D Characters. No 3D Knowledge Required. 2019. Available online: https://www.mixamo.com (accessed on 10 October 2019).
- Blender. Blender, Made by You. 2019. Available online: https://www.blender.org (accessed on 10 October 2019).
- Sanni, S. Theory and Applications of Marker-Based Augmented Reality; VTT Technical Reaserch Center of Finland: Espoo, Finland, 2012. [Google Scholar]
- Jeromeetienne. AR.js Marker Training. 2019. Available online: https://jeromeetienne.github.io/AR.js/three.js/examples/marker-training/examples/generator.html (accessed on 6 June 2019).
- Welch, G.; Bishop, G. An Introduction to the Kalman Filter; University of North Carolina: Chapel Hill, NC, USA, 1995. [Google Scholar]
- Davis, F.D. A Technology Acceptance Model for Empirically Testing New End-User Information Systems: Theory and Results. Ph.D. Thesis, Massachusetts Institute of Technology, Cambridge, MA, USA, 1985. [Google Scholar]
- Abou-Shouk, M.; Megicks, P.; Lim, W.M. Perceived benefits and e-commerce adoption by SME travel agents in developing countries: Evidence from Egypt. J. Hosp. Tour. Res. 2013, 37, 490–515. [Google Scholar] [CrossRef]
- Casaló, L.V.; Flavián, C.; Guinalíu, M. Determinants of the intention to participate in firm-hosted online travel communities and effects on consumer behavioral intentions. Tour. Manag. 2010, 31, 898–911. [Google Scholar] [CrossRef]
- Holsapple, C.W.; Wu, J. User acceptance of virtual worlds: The hedonic framework. In ACM SIGMIS Database: The DATABASE for Advances in Information Systems; ACM Digital Library: New York, NY, USA, 2007. [Google Scholar]
- Rahimi, B.; Nadri, H.; Afshar, H.L.; Timpka, T. A systematic review of the technology acceptance model in health informatics. Appl. Clin. Inform. 2018, 9, 604–634. [Google Scholar] [CrossRef] [PubMed]
- Kim, D.Y.; Park, J.; Morrison, A.M. A model of traveller acceptance of mobile technology. Int. J. Tour. Res. 2008, 10, 393–407. [Google Scholar] [CrossRef]
- Davis, F.D. Perceived usefulness, perceived ease of use, and user acceptance of information technology. MIS Quart. 1989, 319–340. [Google Scholar] [CrossRef]
- Goodhue, D.L.; Thompson, R.L. Task-technology fit and individual performance. MIS Quart. 1995, 19, 213–236. [Google Scholar] [CrossRef]
- Dishaw, M.T.; Strong, D.M. Extending the technology acceptance model with task–technology fit constructs. Inform. Manag. 1999, 36, 9–21. [Google Scholar] [CrossRef]
- Basoglu, N.; Cayir, S. Users and information technology interoperability: Analysis of task information fit model. In Proceedings of the PICMET’09-2009 Portland International Conference on Management of Engineering and Technology, Portland, OR, USA, 2–6 August 2009; pp. 3144–3153. [Google Scholar]
- Wu, B.; Chen, X. Continuance intention to use MOOCs: Integrating the technology acceptance model (TAM) and task technology fit (TTF) model. Comput. Hum. Behav. 2017, 67, 221–232. [Google Scholar] [CrossRef]
- Becker, D. Acceptance of mobile mental health treatment applications. Procedia Comput. Sci. 2016, 98, 220–227. [Google Scholar] [CrossRef]
- Li, Y.M.; Yeh, Y.S. Increasing trust in mobile commerce through design aesthetics. Comput. Hum. Behav. 2010, 26, 673–684. [Google Scholar] [CrossRef]
- Hartmann, J.; Sutcliffe, A.; Angeli, A.D. Towards a theory of user judgment of aesthetics and user interface quality. ACM Trans. Comput. Hum. Interac. 2008, 15, 15. [Google Scholar] [CrossRef]
- Verhagen, T.; Feldberg, F.; van den Hooff, B.; Meents, S.; Merikivi, J. Understanding users’ motivations to engage in virtual worlds: A multipurpose model and empirical testing. Comput. Hum. Behav. 2012, 28, 484–495. [Google Scholar] [CrossRef]
- Hwang, H.; Jung, K.; Kim, S. WEB GESCA. 2019. Available online: http://sem-gesca.com/webgesca (accessed on 10 October 2019).
- Hwang, H.; Takane, Y. Generalized Structured Component Analysis: A Component-Based Approach to Structural Equation Modeling; CRC Press: Boca Raton, FL, USA, 2014. [Google Scholar]
- Jung, K.; Panko, P.; Lee, J.; Hwang, H. A comparative study on the performance of GSCA and CSA in parameter recovery for structural equation models with ordinal observed variables. Front. Psychol. 2018, 9, 2461. [Google Scholar] [CrossRef] [PubMed]
- Cronbach, L. Coefficient Alpha and the internal consistency of test. Psychometrika 1951, 16, 297–334. [Google Scholar] [CrossRef]
- Nunnally, J.C. Psychometric Theory 3E; Tata McGraw-Hill Education: New York, NY, USA, 1994. [Google Scholar]
© 2020 by the authors. Licensee MDPI, Basel, Switzerland. This article is an open access article distributed under the terms and conditions of the Creative Commons Attribution (CC BY) license (http://creativecommons.org/licenses/by/4.0/).

 ,
, 


