Article

Stratified Data Reconstruction and Spatial Pattern Analyses of Soil Bulk Density in the Northern Grasslands of China

1
Key Laboratory of Land Surface Pattern and Simulation, Institute of Geographical Sciences and Natural Resources Research, Chinese Academy of Sciences, Beijing 100101, China
2
State Key Laboratory of Resources and Environment Information System, Institute of Geographical Sciences and Natural Resources Researches, Chinese Academy of Sciences, Beijing 100101, China
3
Jiangsu Center for Collaborative Innovation in Geographic Information Resource Development and Application, Nanjing 210023, China
*
Author to whom correspondence should be addressed.
ISPRS Int. J. Geo-Inf. 2020, 9(11), 682; https://doi.org/10.3390/ijgi9110682
Submission received: 28 September 2020 / Revised: 3 November 2020 / Accepted: 12 November 2020 / Published: 15 November 2020

Abstract

:
The spatial pattern of soil bulk density in the grasslands of northern China largely remains undefined, which raised uncertainty in understanding and modeling various soil processes in large spatial scale. Based on the measured data of soil bulk density available from soil survey reports from the grasslands of northern China, we constructed a soil Stratified Pedotransfer function (SPTF) from the surface soil bulk density. Accordingly, the stratified bulk density data of soil vertical profile was reconstructed, and the estimation of soil bulk density data in horizontal space was performed. The results demonstrated that the soil bulk density of the grasslands of northern China was typically high in the central and northwestern regions and low in the eastern and mountainous regions. Mean soil bulk density of the grasslands was 1.52 g·cm−3. According to geographical divisions, the highest soil bulk density was observed in the Tarim basin, with mean soil bulk density of 1.91 g·cm−3. Conversely, the lowest soil bulk density was observed in the Tianshan Mountain area, with mean soil bulk density of 1.01 g·cm−3. Based on data obtained on various types of grasslands, the soil bulk density of alpine meadow was the lowest, with a mean soil bulk density of 0.75 g·cm−3, whereas that of temperate desert was the highest, with mean soil bulk density of 1.80 g·cm−3. Mean prediction error, root mean square deviation, relative error, and multiple correlation coefficient of soil bulk density data pertaining to surface layer (0–10 cm) in the grasslands of northern China were 0.018, 0.223, 16.2%, and 0.5386, respectively. The approach of employing multiple data sources via soil transfer function improved the estimation accuracy of soil bulk density from stratified soils data at the large scale. Our study would promote the accurate assessment of grassland carbon storage and fine land characteristics mapping.

Graphical Abstract

1. Introduction

Soil, an essential component of terrestrial ecosystem, is fundamental for the vegetation survival. Its physical and chemical properties affect the growth of plants, as well as restrict their productivity [1,2]. Soil bulk density, defined as the soil mass (or weight) per unit volume of undisturbed soil column [3], is an important physical property of soil that has a critical impact on soil permeability, infiltration, water-holding capacity, solute transport, and soil erosion resistance [4,5]. Hence, it quantitatively characterizes the ecological functions of soil and is one of the major indicators for evaluating the environmental soil quality [6,7]. In addition, soil bulk density is an indispensable index for estimating the soil water-holding capacity and is one of the main parameters for accurately estimating soil carbon and nitrogen storage [8,9]. Therefore, the establishment of complete systematic database pertaining to soil bulk density is of practical significance for basic soil science research, ecological environment assessment, and soil quality monitoring.
The cutting ring method is the most commonly and directly used soil bulk density method [10]. However, the approach for soil bulk density measurement requires the collection of undisturbed soil samples [11]. This particular approach is time-consuming, labor intensive, and expensive in large-scale practical implementation [12,13,14], and sampling uncertainty may cause systematic errors, which limits the number of sample points and data quality in soil bulk density measurement. Particularly, bulk density data of large-scale projects and special region, such as watersheds and forests, is difficult to obtain. Therefore, current research is focused on the surface soil bulk density, with only few reports available on deep soil data [15]. In recent years, to overcome the lack of bulk density data, a Pedotransfer function model has been proposed using other soil properties for its estimation as an alternative, and this method has been proved by several scholars because of its good predictability [16,17,18,19]. As a simplified and convenient approach for soil bulk density measurement, soil bulk density prediction model and its related application are receiving increasing attention worldwide [18,20].
The Stratified Pedotransfer functions (SPTFs) are mainly derived from two conceptions. One of which is multiple regression analysis based on auxiliary data, such as organic matter carbon, soil particle, and depth [21,22,23,24], the other one is empirical model [25]. Other scholars wanted to improve the estimation accuracy of multiple regression models by incorporating additional parameters, such as soil morphological and physiographic properties [26]. But there are few studies about application of Pedotransfer function model on environmental and/or climatical factors, such as differences in land use, vegetation, and heterogeneity of soil types. Therefore, its accuracy and precision often rely on the study of specific regions [1,21,27]. In contrast, for the carbon accounting, a spatial coordinate-based approach is recommended, and carbon storage should be expressed by mass of soil organic carbon per unit land area to a depth of 30 cm [8,28]; however, the estimation of carbon storage in this way may be uncertain due to the evident occurrence of soil swelling or compaction because of a change in the soil bulk density [29]. It is primarily caused by the swelling or contraction of soil resulting from the perennial fluctuations of the soil water content and soil depth, thereby leading to the alterations in soil bulk density [30,31] Furthermore, soil compaction was also induced by intense human activities, which affected the soil bulk density and organic carbon storage [32]. In case of that, most research focused on natural grasslands because the prediction accuracy would be heavily affected if containing the extrapolation for cultivated grassland.
Soil properties especial soil bulk density are vital parameters to estimate soil total carbon [24]. However, detailed mechanism for soil carbon turnover is not only explained by surface layer but defined by deeper layers [26]. Furthermore, our ability to investigate ecosystem carbon relies on total soil carbon which partially found in surface soil layer [27]. Jobbagy and Jackson (2000) [33] predicted that 56% of total soil C can be found 1 m beneath the surface. According to current studies, the impact of soil depth on soil bulk density simulation or the estimation of stratified soil bulk density has seldom been considered in the Pedotransfer function model using soil properties [27,34]. The grasslands of northern China are in the central part of East Asia. Diverse land use accompanies complex climatic conditions from west to east across the East Asian continent, which makes the construction of soil Pedotransfer function model more challenging, with few reports on stratified soil bulk density in such a large scale. Accordingly, the objectives of the present study are as follows:
(i)
By employing the existing stratified data (a part of soil bulk density stratification data), a new SPTF was constructed for stratified missing data of soil bulk density in a large scale.
(ii)
The spatial pattern of soil bulk density stratification data was analyzed, in addition to vertical soil profile estimation based on the stratified soil bulk density data.
(iii)
The relationship between soil bulk density, grassland type, and organic carbon content was discussed.

2. Materials and Methods

2.1. Study Area

The northern grasslands of China (Figure 1) are different from the typical northern grassland regions. It contains the geographical scope (local or regional) of the northern grassland area, and extends to the entire Xinjiang Uygur Autonomous Region, including Inner Mongolia Autonomous Region and Ningxia Hui Autonomous Region, as well as parts of Heilongjiang, Jilin, Liaoning, Hebei, Shanxi, Shaanxi, and Gansu Provinces (districts)—a total of 324 counties (cities). The geographical scope ranges from 31°28′6″N to 54°35′53″N and from 67°56′46″E to 128°53′20″E, with a total area of approximately 3.45 million km−2. Being one of the most important pastoral areas in China (Figure 1), it has rather diverse landscape and physiognomies, extending from the “three mountains and two basins” in the Xinjiang Uygur Autonomous Region in the west with a gradual eastward transition to the Alxa Plateau, the Ordos Plateau, the Loess Plateau, the Mongolian Plateau, and the Songnen Plain. Moreover, there are Taklimakan Desert, Gurbantungut Desert, Badain Jilin Desert, Tengger Desert, Kumtag Desert, Ulanbuhe Desert, Kubuqi Desert, Maowusu Desert, Hunshandak Desert, Horqin Desert, and Hulunbuir Desert, among other major deserts and sandy lands, and Hulunbuir, Songnen, Horqin, Xilinhot, Ulanchabu, Altay, and Yili, among other key pastoral areas, within this region in China [35]. The northern temperate grassland region spans across arid, semiarid, and sub-humid regions. Under harsh climatic conditions, in addition to the fragile ecological environment, severe land desertification is observed. There are various types of land cover, including farmland, wetland, forest, grassland, desert, and sandy land. The major types of soil include desert soil, calcareous soil, arid soil, and leached soil. Considering that the grassland is one of the major vegetation types in the region, there are diverse types of grassland, including temperate meadow grassland, temperate steppe, temperate desert steppe, alpine grassland, alpine desert steppe, temperate desert grassland, temperate desert, alpine desert, warm-temperate grassland, warm-temperate shrub, lowland meadow, mountain meadow, alpine meadow, swamp, and improved grassland a total of 15 grassland types [36]. According to the statistical survey on grasslands in the 1980s, the grassland area in this region was 1.635 million km−2. Comparatively, the latest results of the “Investigation on the Degradation and Causes of Grassland Resources in Key Pastoral Areas of Temperate Grassland in China” project demonstrated that the reserved area of grassland was 1.415 million km−2 in 2010 [37]. In this study, the sample points and model prediction only refer to natural grassland, non-grassland and cultivated grasslands were masked by boundaries.

2.2. Soil Bulk Density Survey and Soil Sampling

Two soil datasets were collected in the present study (Table 1). One dataset was obtained from the “Investigation on the Degradation and Causes of Grassland Resources in Key Pastoral Areas of Temperate Grassland in China” project from 2013 to 2015. Part of the soil bulk density data in dataset was applied in SPTF model validation. Axillary data (environment data, remote sensing data and vegetation data) was applied in spatial interpolation. The surface soil bulk density survey and soil sampling of grassland of northern China were conducted together with the grassland vegetation sampling survey. The establishment of grassland vegetation sample sites was based on the distribution characteristics including grassland type, utilization mode and intensity, and road traffic conditions among others. The survey route with relatively wide coverage was set up in the survey area, and the landscape information of grassland vegetation along the along the survey route was always collected using GPS (Global Positioning System) positioning instrument (American MAGELLAN, eXplorist 610, position errors less than 15 m, position errors less than 15 m) and camera (Canon, EOS 2000D, Japan, Oita). Simultaneously, one grassland vegetation community survey site of 100 m × 100 m should be set up every 50 km along the survey route. However, the setting of grassland sample site was determined in accordance with the specific conditions of grassland type, utilization mode and intensity, and site conditions. For example, grassland sample site was set for several kilometers in mountainous regions, whereas it was set at intervals of 80 km in plain regions with relatively simple type of grassland. The present study included 6716 grassland landscape information collection sites and 587 grassland survey sites. The field survey of grassland was completed within a period of 3 years from 2013 to 2015, and the sample survey and sampling of grassland were performed from July to September every year. The longitude and latitude, elevation, utilization mode, and landscape photos of each sample site were recorded. Three 1 m × 1 m sites were set up along the diagonal line of each grassland sample site for evaluating the grassland community index, including data of main species and species in the sample site, the mean height of grassland, coverage, aboveground biomass of species, and underground biomass [38].
In the present study, the surface soil bulk density survey and soil sample sampling were conducted in the three sample sites used in the grassland community index survey. Surface soil bulk density was sampled using cutting ring method. Three samples were collected along the diagonal line in each sample plot. The sampling site was in the center of 0–10 cm soil layer. The cutting ring knives were numbered and brought back to the room. The samples were dried to constant weight in an oven at 105 °C. The measured weight converted into standard unit (g·cm−3). The specifications of the cutting ring knife were 100 cm3. Physical and chemical analyses for the soil samples were performed using soil drilling method. In the sample sites used for the grassland community index survey, soil drills with 33 cm inner diameter were used to stratify the soil layers of 0–10 cm, 10–20 cm, 20–30 cm, and 30–40 cm, respectively. Each sample was assessed with 3 drills, following which they were mixed with layers according to the sample number. The samples were packed in plastic bag and brought indoor. The soil samples were spread and dried, mixed evenly, and analyzed using quadruple method. After grinding, the samples were screened using 0.3-mm separate nylon mesh bags and were packed into small plastic bags, numbered, and sent to the Botanical Research Center of the Chinese Academy of Sciences for analysis of total carbon and organic carbon content. The carbon content was determined using dry burning method, and the instrument was vario macro cube (German, Manchester).
The other dataset was collected from 143 grassland sample sites involved in the Pilot Project of the Chinese Academy of Sciences for the establishment of a Pedotransfer function model of stratified soil bulk density (Table 1). It was used to construct stratified model. Sampling methods of soil bulk density and soil analysis samples were based on the guidelines for the Investigation of Carbon Fixation Status, Rate and Potential of Grassland Ecosystem in China. A 100 cm (length) × 50 cm (width) × 100 cm (depth) trench was excavated on the side of the sample by trench method. According to the soil profile, stratified samples were obtained from 0–5 cm, 5–10 cm, 10–20 cm, 20–30 cm, and 30–50 cm layers, and repeated sampling was performed for five samples. This method is extremely time-consuming and laborious to be implemented in the large-scale survey of the northern temperate grasslands. The soil samples were spread out and dried, evenly mixed, and analyzed indoors using quadruple method. After grinding, the samples were screened using a 100-mesh sieve and packed into small plastic bags, numbered, and sent to the Botanical Research Center of the Chinese Academy of Sciences for analysis of total carbon and organic carbon content.

2.3. Spatial Data Collection and Processing on Geographical Elements

We proposed a new soil stratified Pedotransfer function from the surface soil bulk density, which help construct the missing stratified data in a large scale, and used MWRM (multi-factor weighted regression model) model [39] to interpolate soil bulk density of temperate grassland of northern China. Above that, auxiliary data including remote sensing data, climatic data, topographic data, and resource distribution of grassland types, were required (Table 1).
(i)
Remote sensing data: normalized difference vegetation index (NDVI) data from mid-August 2013 to mid-August 2015 of northern temperate grassland were obtained from MOD13A2 of the United States Geological Survey, which was tiled and projected via MRT (MODIS Reprojection Tool, https://lpdaac.usgs.gov/tools/modis_reprojection_tool/) application with a spatial resolution of 1 km.
(ii)
Climatic data: according to the observation data of meteorological centers (stations) from 2013 to 2015 provided by the National Meteorological Administration, a professional software for meteorological interpolation, ANUSPLIN (http://fennerschool.anu.edu.au/research/products/anusplin-vrsn-44), was used to estimate spatial interpolation of annual mean temperature, annual rainfall, accumulated temperature (>10 °C), humidity (Ivanov humidity) [36] and other spatial variables, with a spatial resolution of 1 km.
(iii)
Altitude data: data was collected from Digital Elevation Model (DEM) in National Earth System Science Data Sharing Platform (www.geodata.cn), with a spatial resolution of 30 m.
(iv)
Spatial distribution of grassland resource map: based on the vector data for distribution mapping of grassland types obtained from the national grassland survey in 1980, which is calibration value for compiling and revising the spatial map of grassland of 2010 using TM (Thematic mapper) data, with a spatial resolution of 20 m.
(v)
Matching and extraction of geographic element data of grassland sample sites: based on the longitudinal and latitudinal coordinates of 587 grassland sample sites in the northern temperate grassland region, the geographic element spatial data mentioned above were loaded in ArcGIS, and the values for 6 elements, including altitude, NDVI, annual mean temperature, annual rainfall, accumulated temperature (>10 °C), humidity, and surface soil bulk density of those 587 sample sites, were extracted. A dataset (two-thirds of them totaled 397 samples data as modeling data, and the remaining 190 samples data were used as test data) consisting of these six ecological factors, surface soil bulk density, and soil organic carbon content was constructed for statistical, regression, and spatial grid analyses.

2.4. Statistical Analysis

2.4.1. Statistics and Regression Analysis

All collected data related to soil bulk density and organic carbon content in sample sites were analyzed using SPSS 20.0 software, including correlation analyses for soil organic carbon content with soil depth (KSOC), correlation analyses for soil bulk density with soil depth (KSBD), regression analyses for association between surface soil bulk density and geographical factors, as well as correlation analyses for coefficient of variation in vertical profile of soil bulk density (KSBD) and coefficient of variation in vertical profile of soil organic carbon content (KSOC).

2.4.2. Construction of Stratified Soil Bulk Density from Pedotransfer Function

According to the Figure 2, the soil bulk density dataset of 143 grassland sample sites from “Strategy Pilot Project of Chinese Academy of Sciences” was used for stratified model after KS normality test (p < 0.01) which was performed using SPSS 20.0 software, and 117 verified sample sites were eventually obtained for statistical analyses after excluding sites with obvious anomalies. Based on the stratified data of soil bulk density in 117 verified sample sites, the variability coefficients of vertical profile for soil bulk density and soil organic carbon content in each sample site, named KSBD and KSOC, respectively, could be obtained by using linear regression analysis (Equation (1)). Furthermore, 397 grassland sample sites from “Investigation on the Degradation and Causes of Grassland Resources in Key Pastoral Areas of Temperate Grassland in China” were used to constructed spatial model (Equation (2)). Based on the SPTF Equations (1) and (2), soil bulk density in different soil layers (0–10cm, 10–20cm, 20–30cm, 30–50cm) was estimated.
K S B D = a K S O C + b ,
S B D ( x ) = S B D ( 0 ) ( 1 + K S B D x )   ( x = 0 , 1 , 2 , 3 ) .
In the equation, a and b are model constant terms; SBD(x) is the soil bulk density of a soil layer. When x = 0, it is the soil bulk density of the surface layer (0–10 cm); when x = 1, it is the soil bulk density of 10–20 cm; when x = 2, it is the soil bulk density of 20–30 cm; when x = 3, it is the soil bulk density of 30–50 cm; and KSBD is the variability coefficient of vertical profile for soil bulk density.

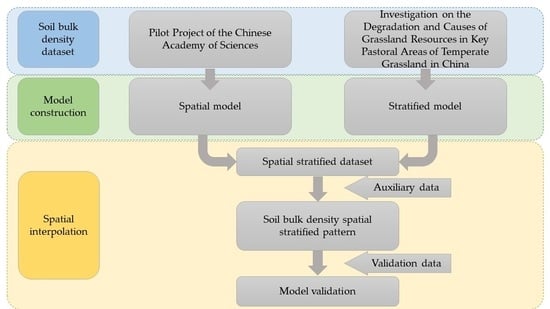
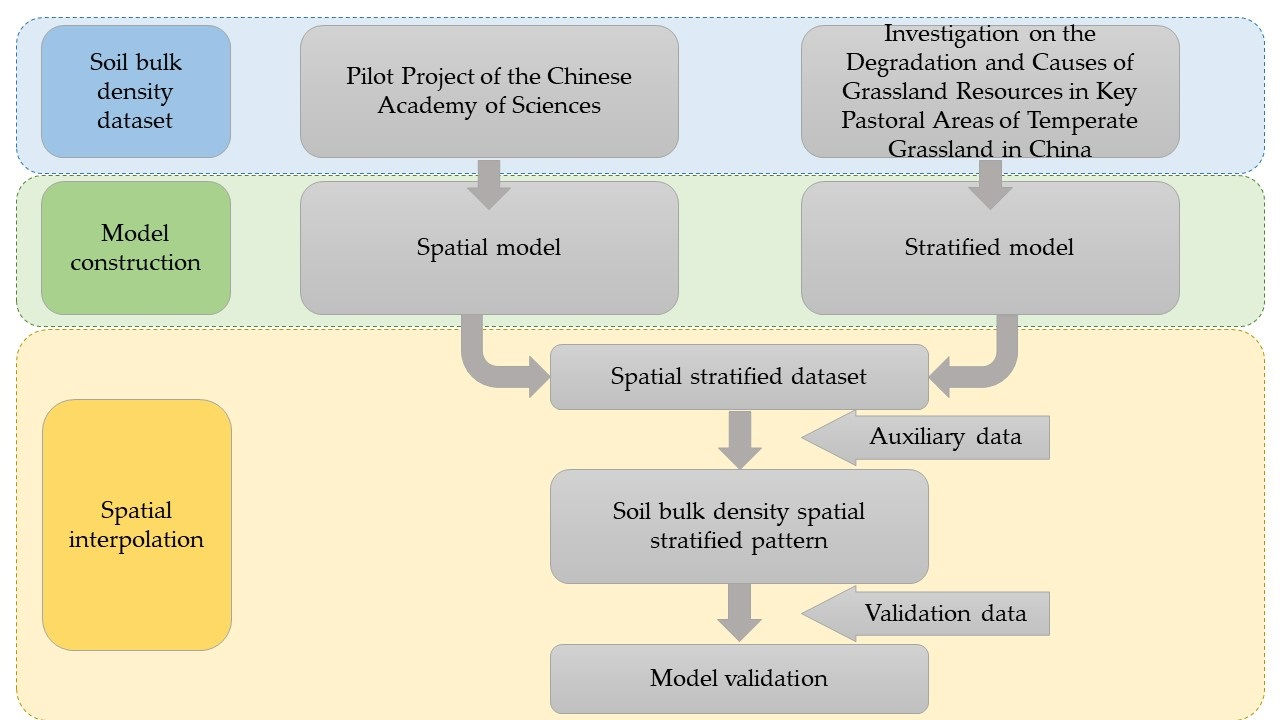
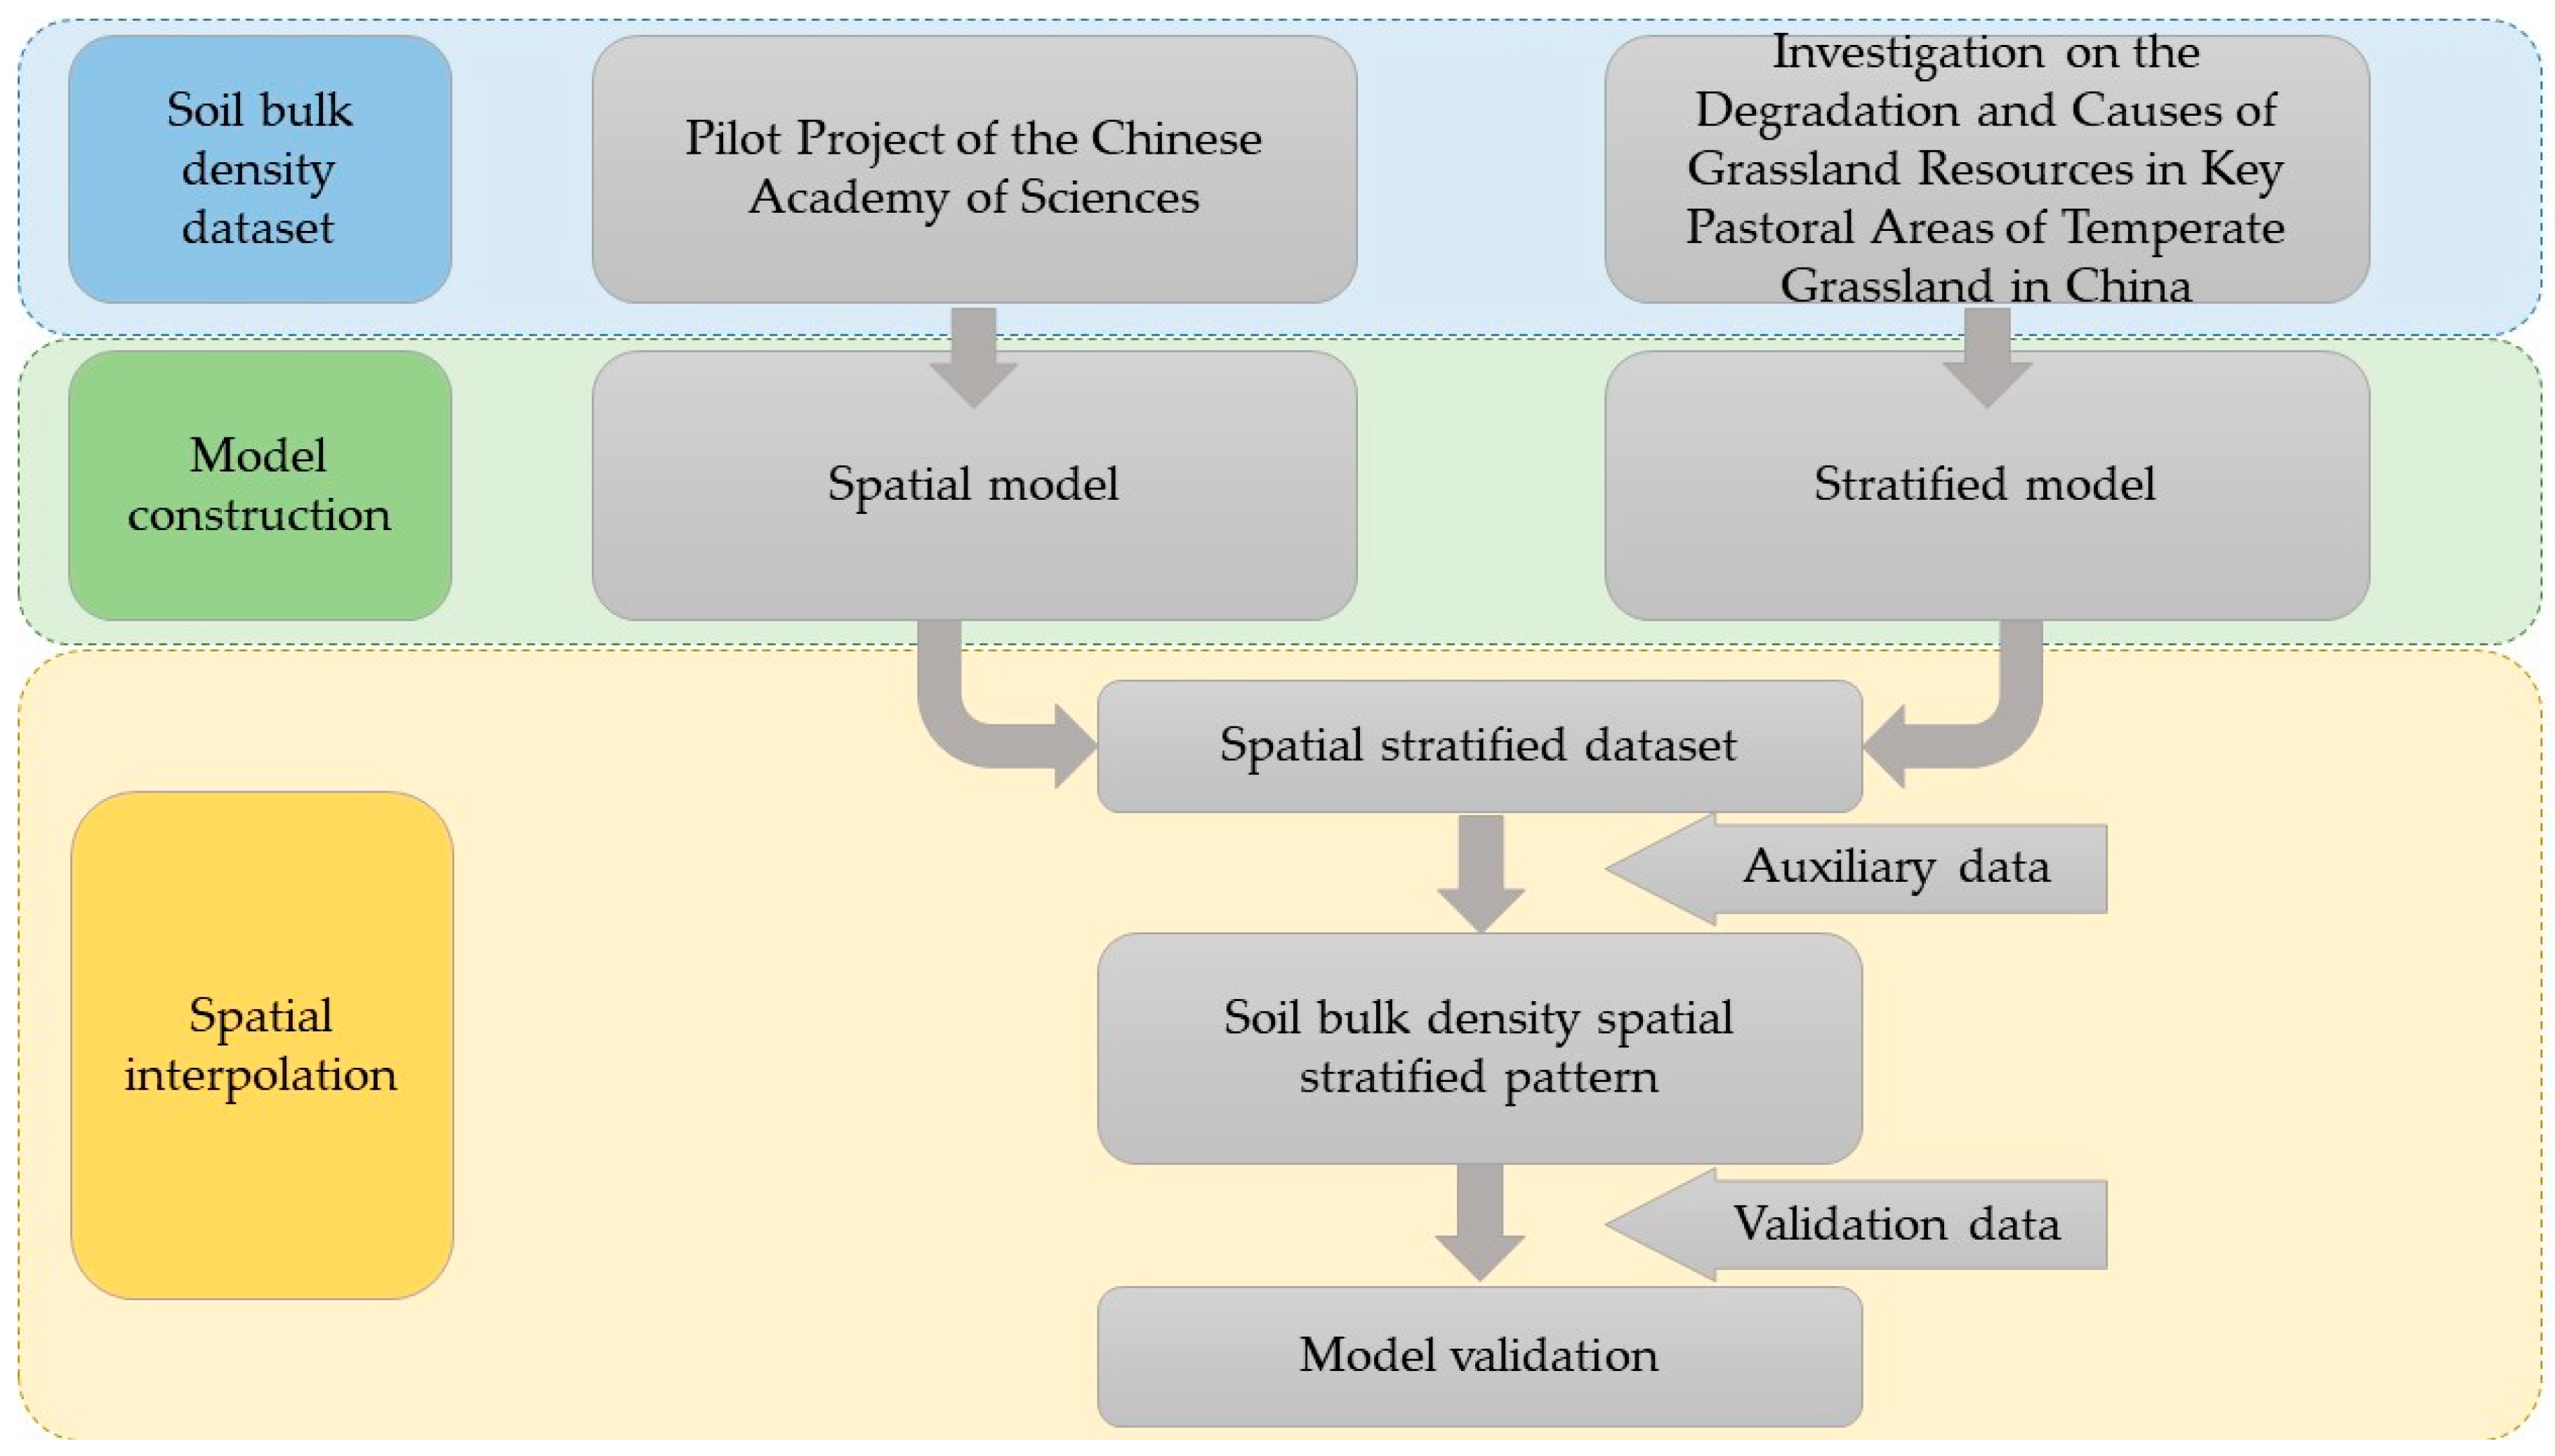
2.4.3. Spatialization of Soil Bulk Density

The MWRM model [39] was established using the surface soil bulk density data obtained from the grassland survey, including 6 geographical factors of elevation, annual mean temperature, annual mean rainfall, accumulated temperature (≥ 10 °C), humidity, and NDVI. Here, we used MWRM model to interpolate the spatial stratified pattern of soil bulk density (Figure 2). We got the spatial grid data (1 km × 1 km) of surface soil bulk density (0–50 cm) according to the SPTF Equations (1) and (2). After that, the stratified spatial pattern of soil bulk density (0–10cm, 10–20cm, 20–30cm, 30–50cm) was estimated by MWRM model with auxiliary data and spatial grid data.

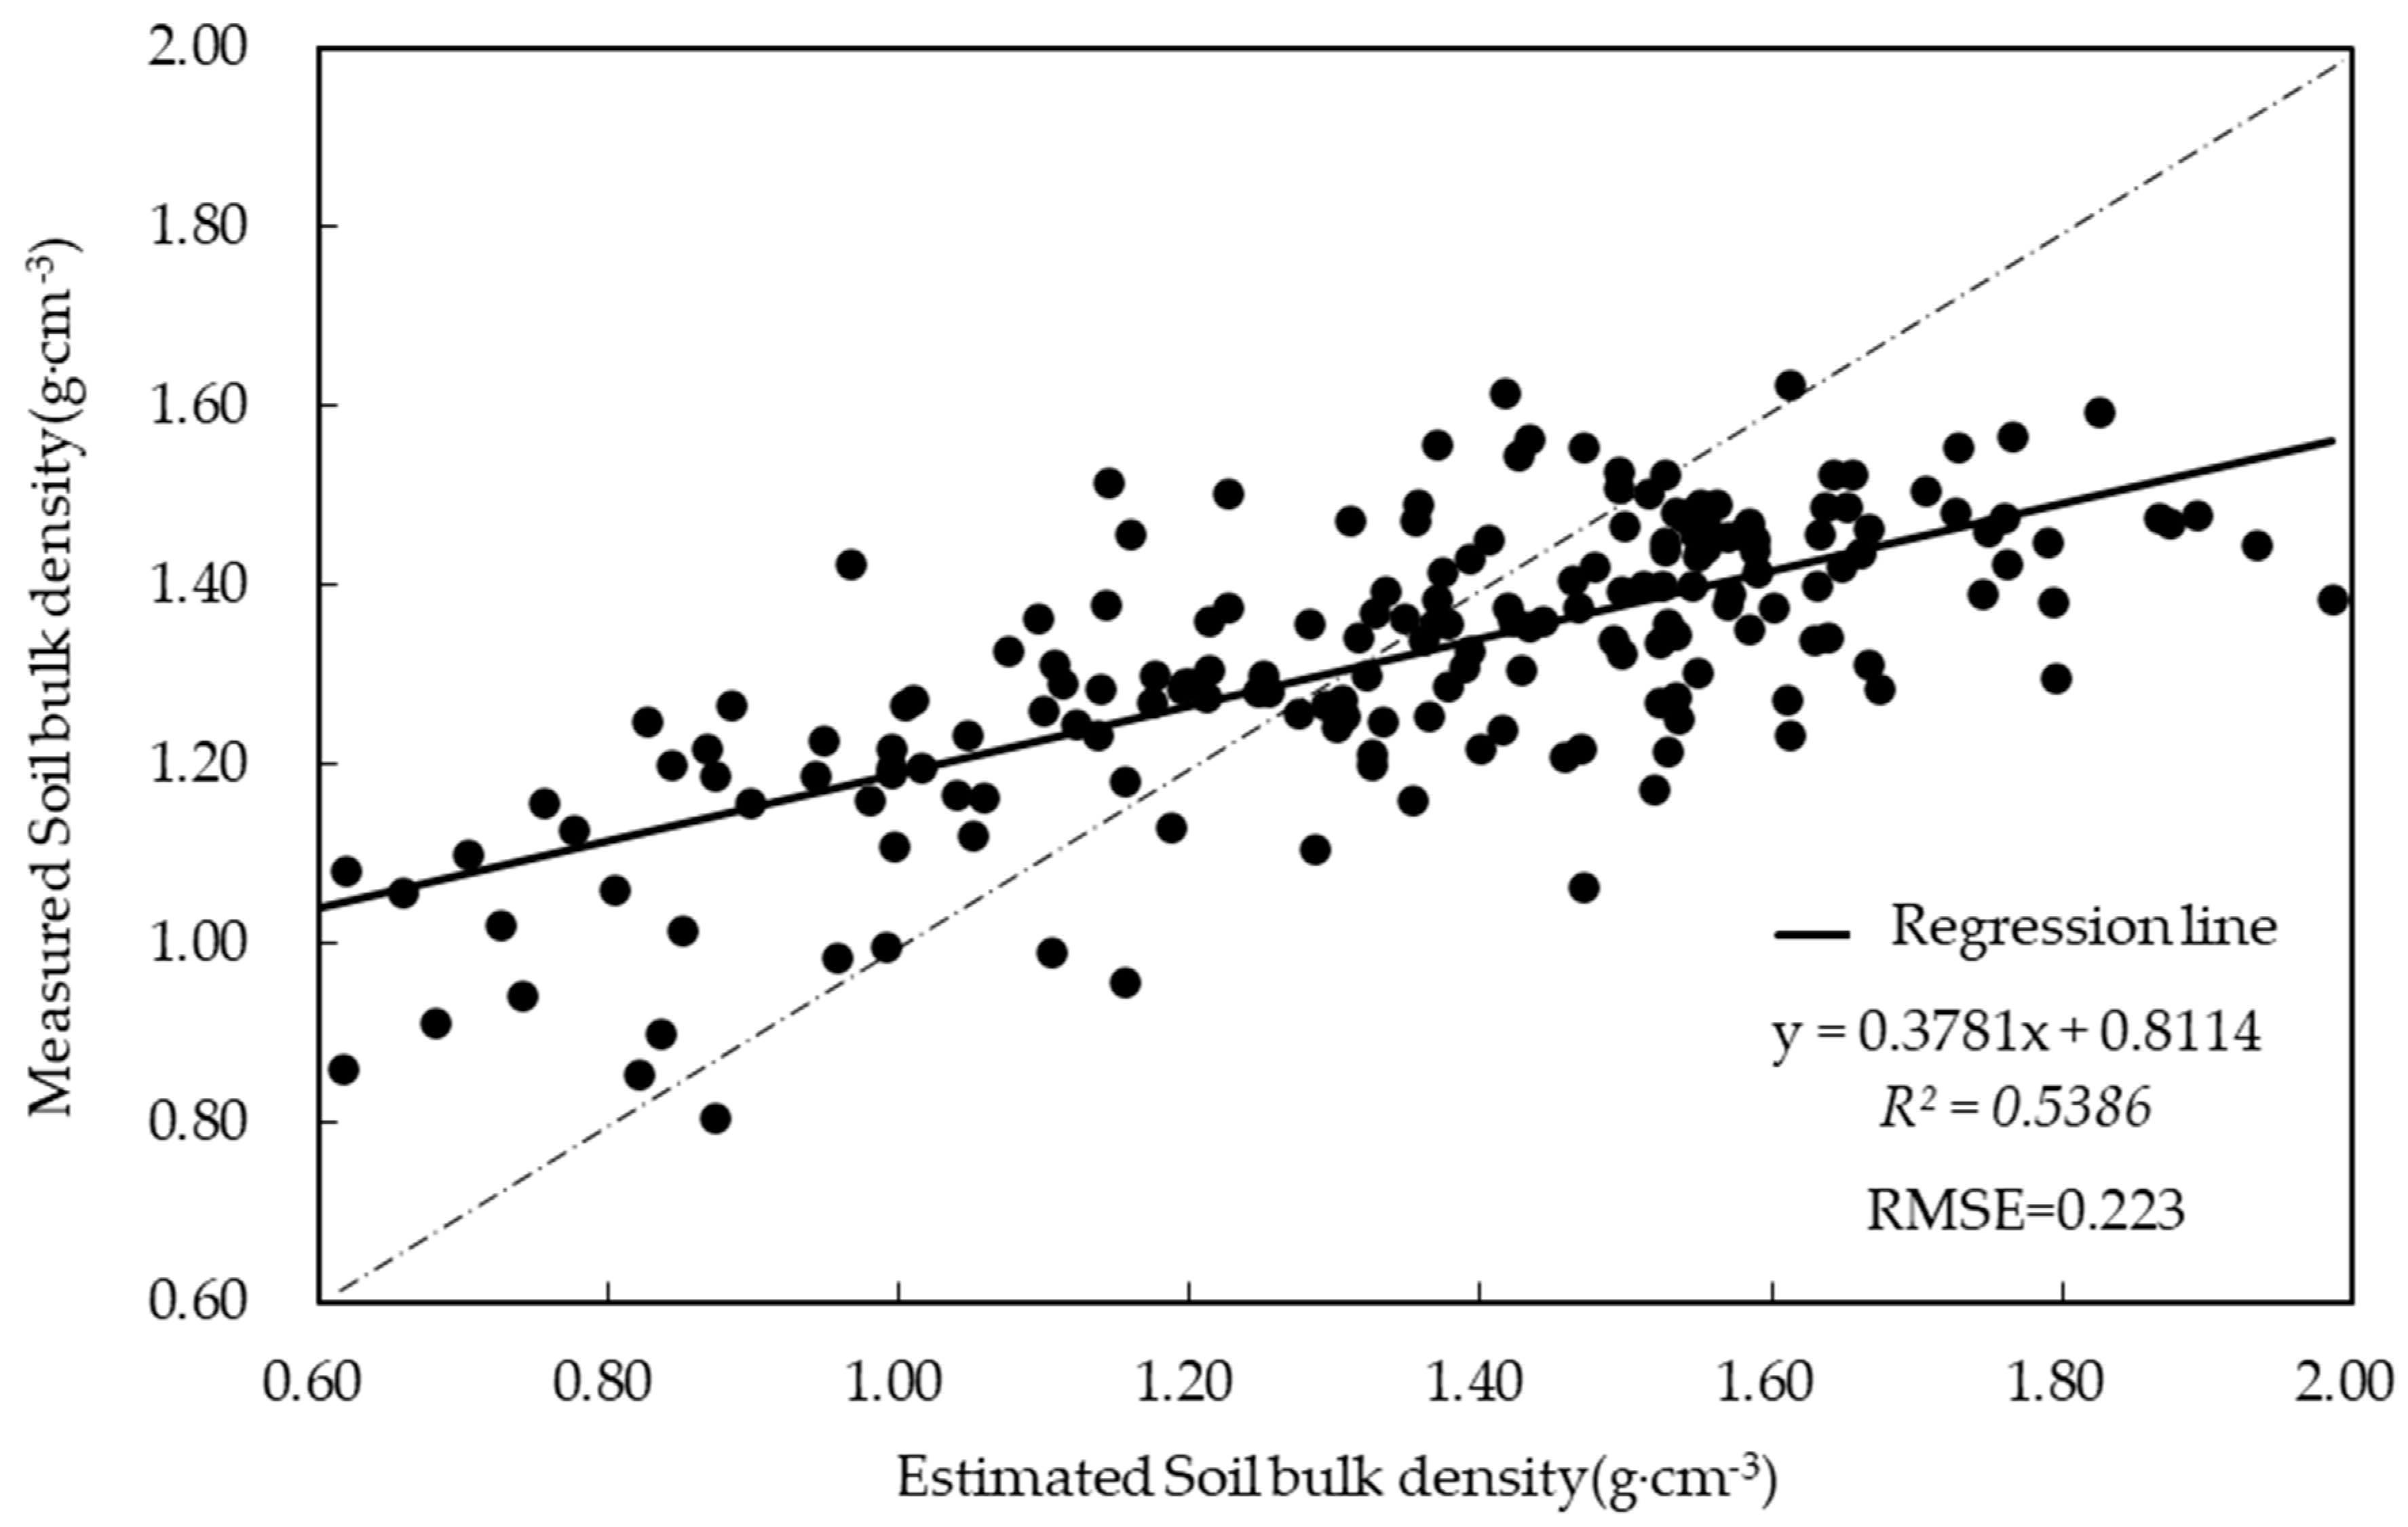
2.4.4. Model Validation and Accuracy Evaluation

In order to evaluate the estimation accuracy of sample points and model results, the average prediction error (MPE), root mean square error (RMSE), relative error (E), and multiple correlation coefficient (R2) were applied. In Equations (3)–(6), P i , M j , M j ¯ , and T ¯ represent the measured value, predicted value, average predicted value, and average value, respectively, and n is the number of samples. A total of 190 sample points was used to model validation, to compare with average value of different layers of soil bulk density (0–10 cm, 10–20 cm, 20–30 cm, 30–50 cm).
MPE = 1 n i = 1 n ( P i M j ) ,
RMSE = i = 1 n ( P i M j ) 2 n ,
E = R M S E M j 100 % ,
R 2 = ( M j T ¯ ) 2 ( P i T ¯ ) 2 .

3. Results

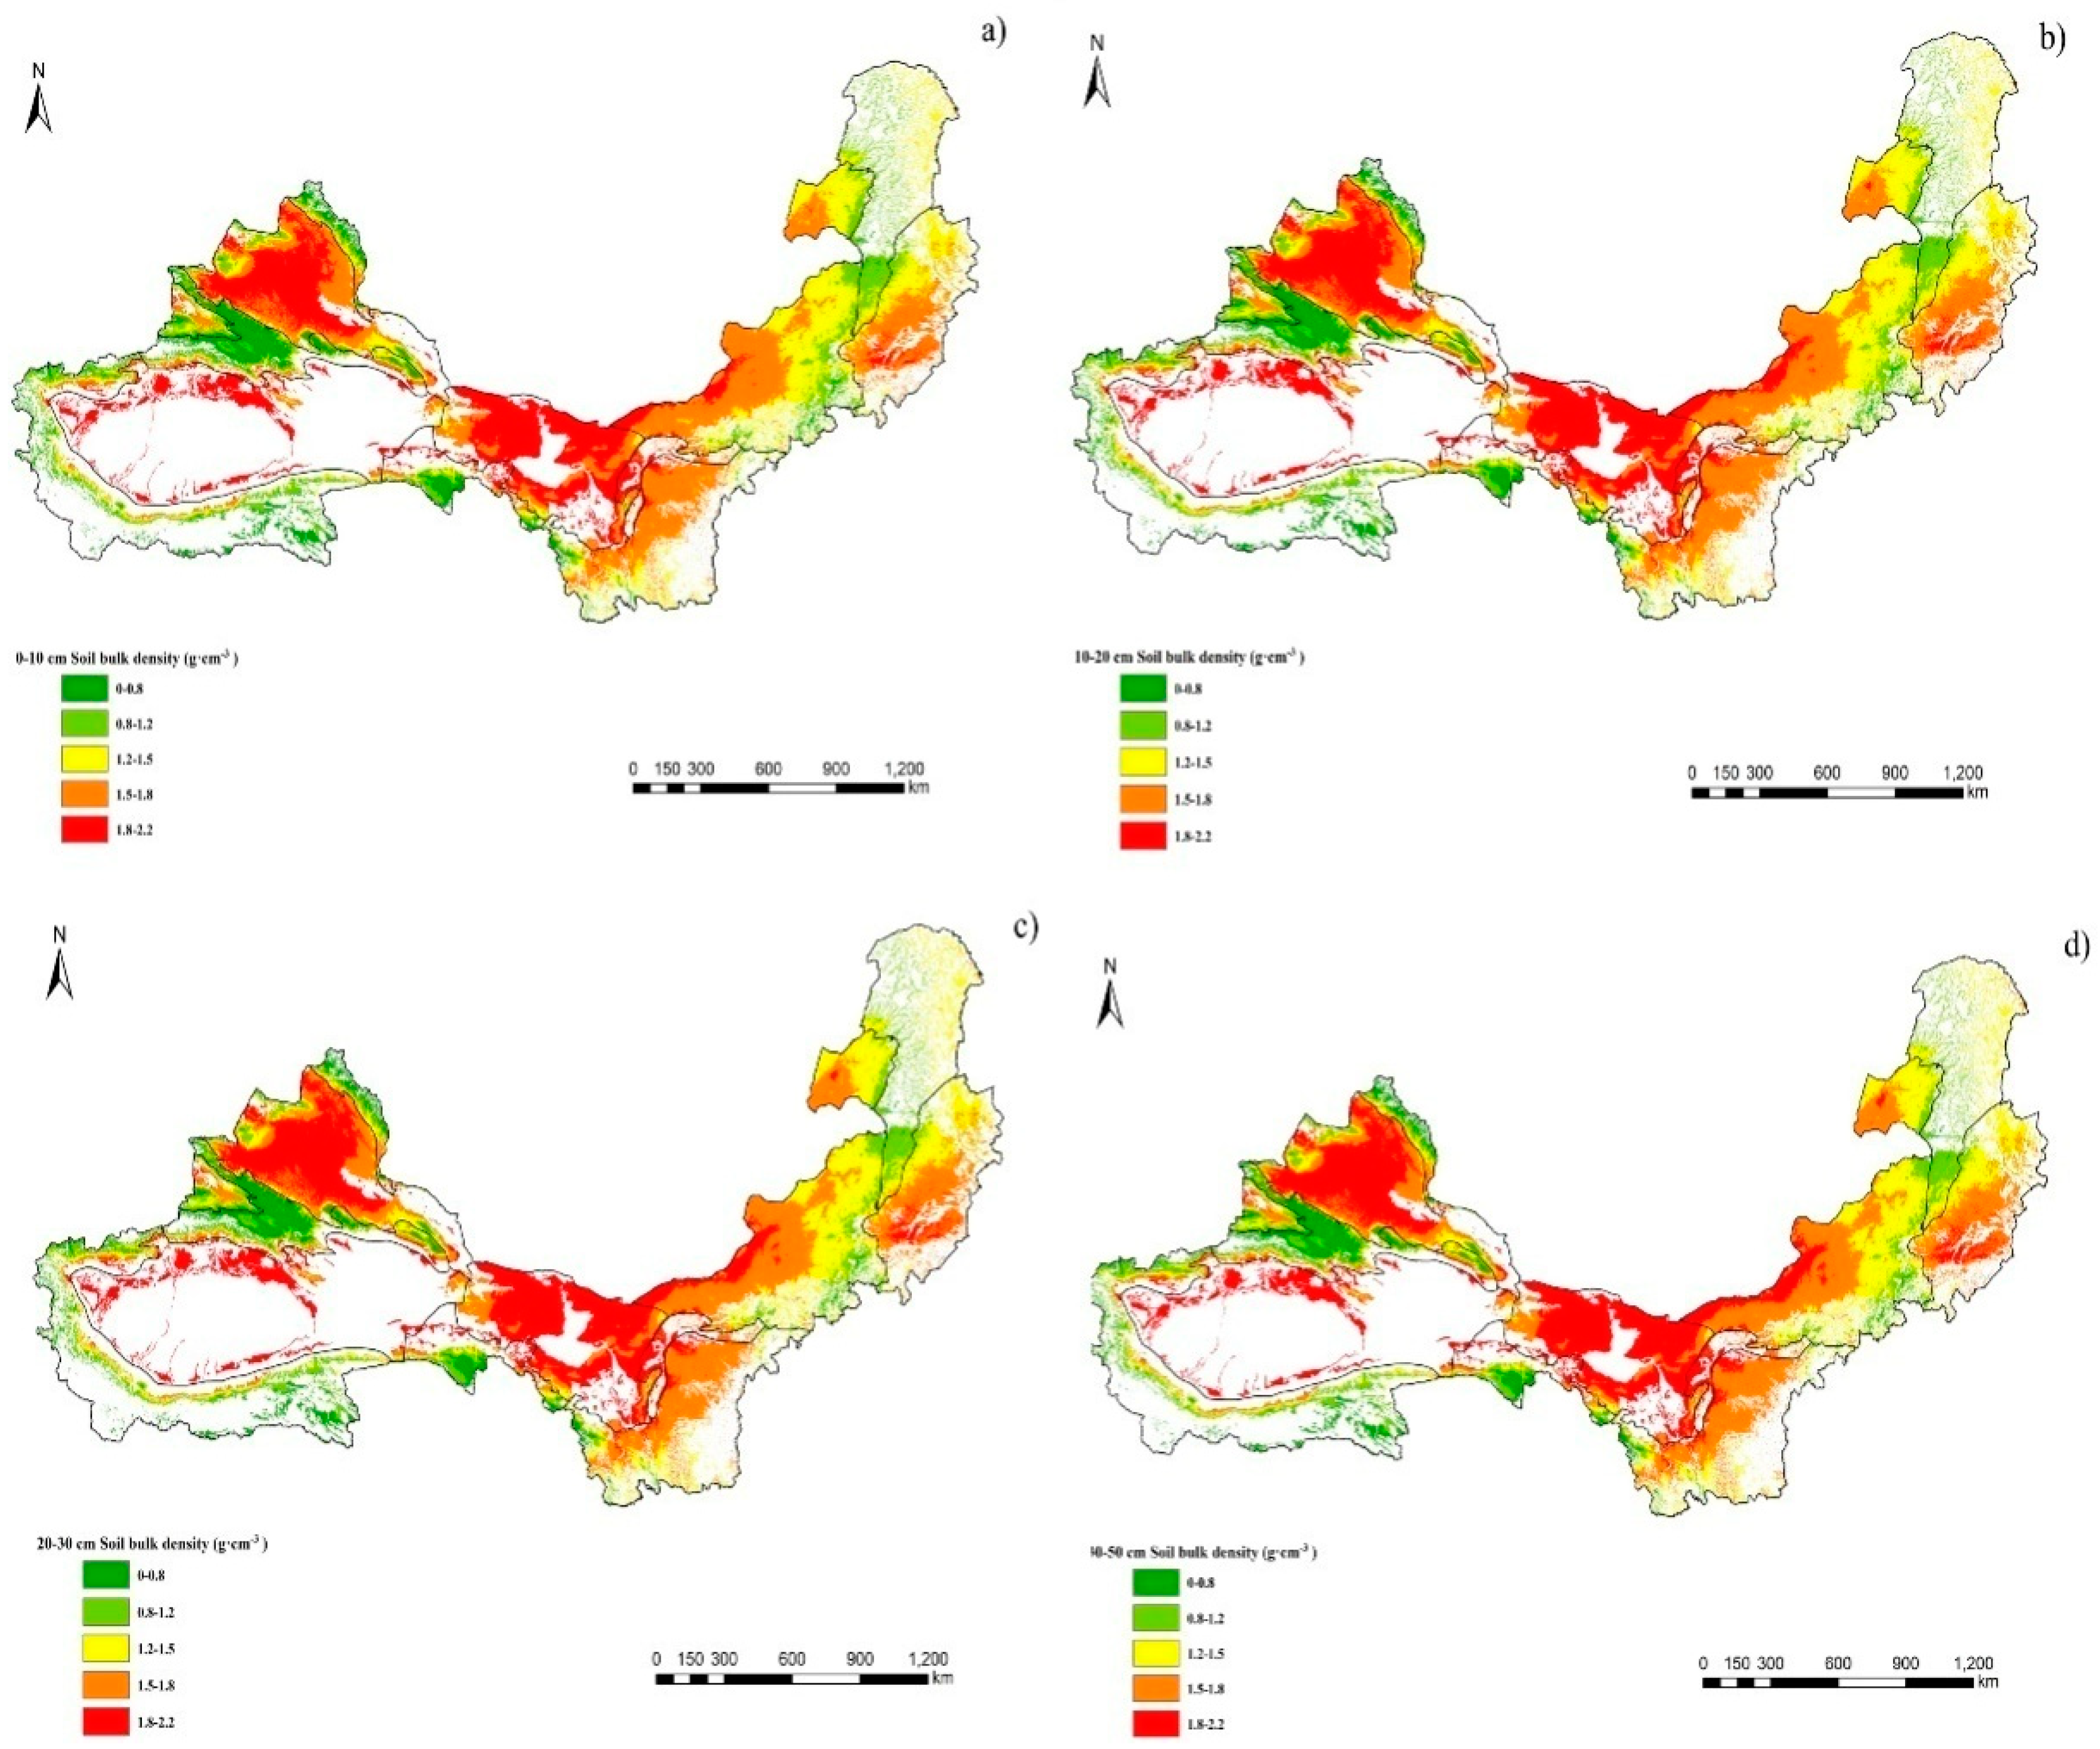
3.1. Spatial Distribution and Patterns of Stratified Soil Bulk Density of Grassland in Northern China

Based on the data of surface soil bulk density available from soil survey reports, with the geographic element spatial data mentioned above including altitude, NDVI, annual mean temperature, annual rainfall, accumulated temperature (>10 °C), humidity, the spatial distribution of surface soil (0–10 cm) soil bulk density (Figure 3a) was established using MWRM model [40]. A total of 190 sample points was used to model validation, to compare with average value of different layers of soil bulk density (0–10 cm, 10–20 cm, 20–30 cm, 30–50 cm). The spatial distribution of soil bulk density in the northern grasslands were established by extracting and removing the non-grassland geographical units, such as desert and farmland.
Based on the validation analysis for 190 test sites (Figure 4) in the northern grassland region, the mean prediction error (MPE), root mean square error (RMSE), relative error, and R2 of the surface soil bulk density (0–50 cm) was 0.018, 0.223, 16.2%, and 0.5386, respectively. The testing results indicated that the spatial distribution of surface soil bulk density of grassland surface layer (0–10 cm) using MWRM model [39] is highly reliable and accurate, which could be used to calculate the spatial data of surface soil bulk density.
According to the spatial pattern of stratified soil bulk density (Figure 3a–d), the spatial variation of soil bulk density in different soil layers is consistent, which is high in central and northwest in grasslands of northern China (mainly distributed the temperate desert and temperate desert steppe), and low in the east and southwest (mainly distributed the temperate meadow grassland and montane meadow).
Regarding statistical analysis in Figure 5, the value for soil bulk density in grasslands of northern China, accounting for 61.58% of the total grassland area, was normally >1.5 g·cm−3. Class I soil bulk density (0–0.8 g·cm−3) was sporadically distributed in Tianshan Mountain and Altai Mountains, and the main grassland type was alpine meadow, accounting for 4.54% of the total grassland area. Class II soil bulk density (0.8–1.2 g·cm−3) was concentrated in Tianshan Mountain, Altai Mountains, Da Hinggan Ling Prefecture and Amir–Kunlun–Altun Plateau Region, and the main grassland type was montane meadow, accounting for 13.16% of the total grassland area. Class III soil bulk density (1.2–1.5 g·cm−3) was concentrated in the eastern of Inner Mongolia Plateau and Hulunbuir Plateau, and the main grassland type was temperate meadow grassland and montane meadow, accounting for 20.74% of the total grassland area. Class IV soil bulk density (1.5–1.8 g·cm−3) was concentrated in the western of Inner Mongolia Plateau, northern of the Junggar Basin and Loess Plateau and edge of Alxa Plateau, and the main grassland type was temperate steppe and temperate desert steppe, accounting for 36.03% of the total grassland area. Class V soil bulk density (>1.8 g·cm−3) was concentrated in the southern of Junggar Basin, edge of Tarim basin and central of Alxa Plateau, and the main grassland type was temperate desert, accounting for 25.55% of the total grassland area. In addition, with the increase of soil depth, the proportion of class V soil bulk density grassland has increased. Compared with the surface layer (0–10 cm), the total area of class V soil bulk density grassland increased by 21.27% in 30–50 cm soil layer. Meanwhile, the proportion of class I, II, III and IV soil bulk density (0–1.8 g·cm−3) grassland has decreased, and the total area of 30–50 cm soil layer decreased by 3.3%, 5.06%, 7.48%, 5.43%, respectively, compared with surface soil (0–10 cm).

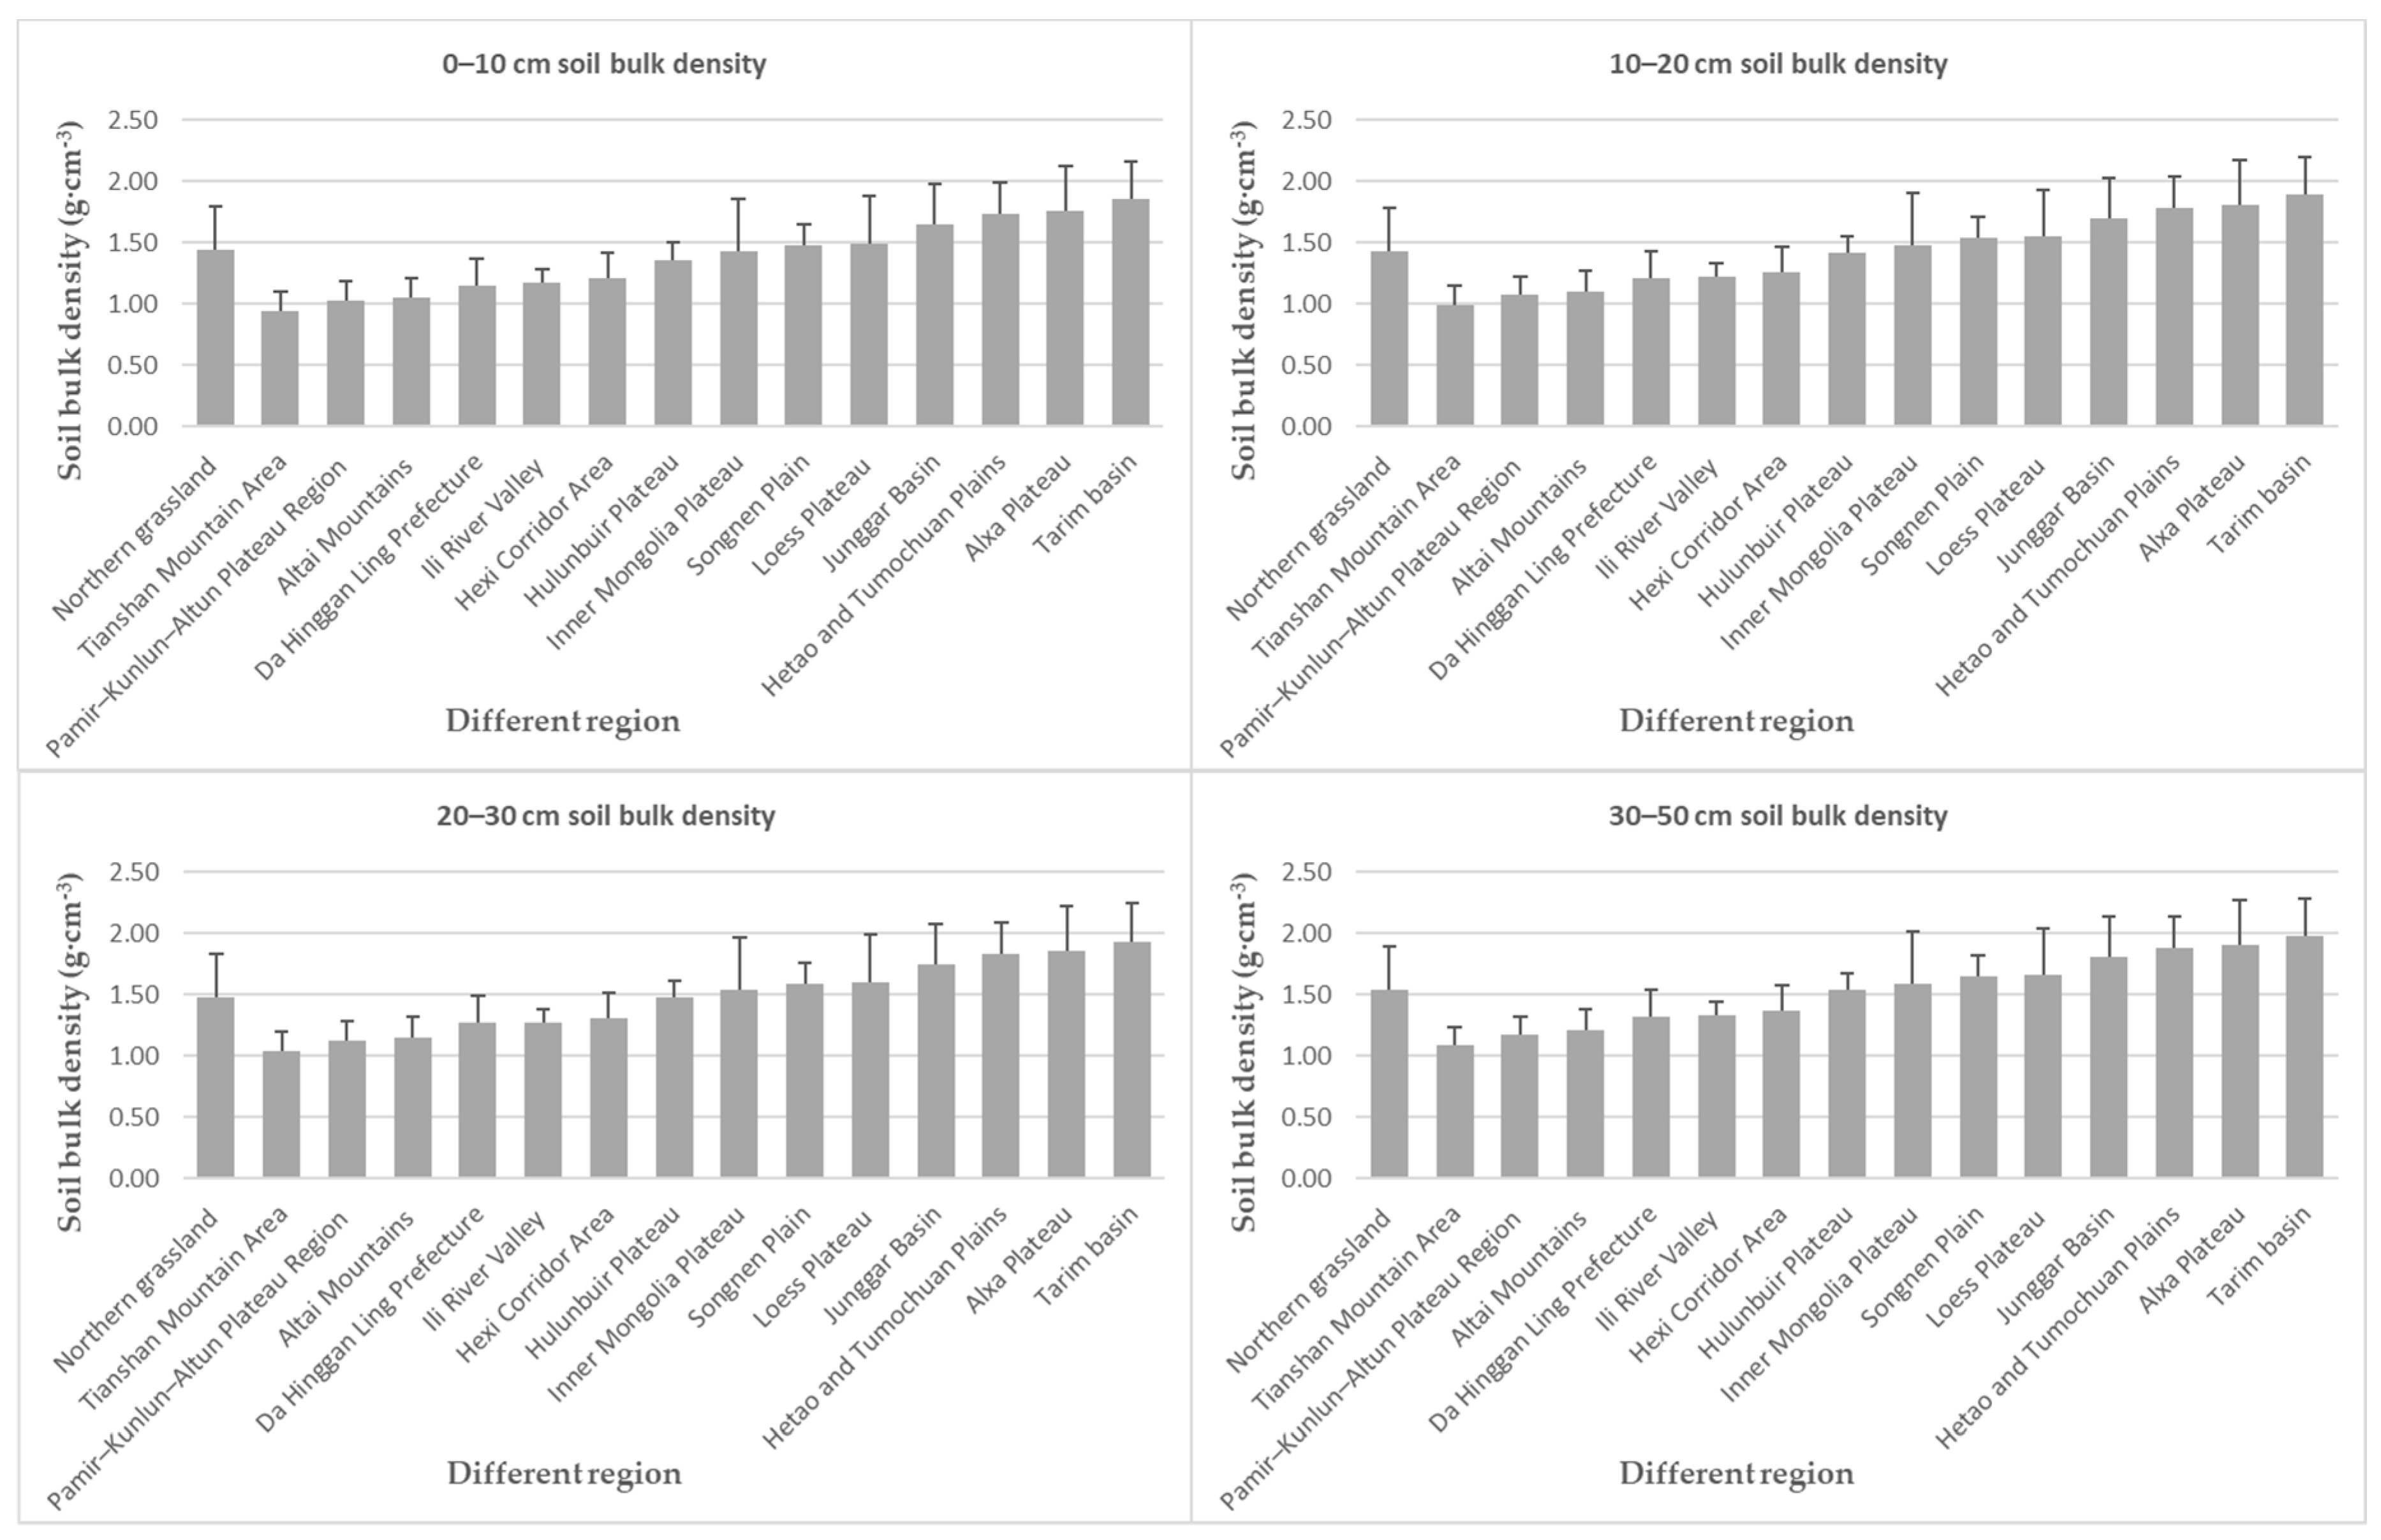
3.2. Comparison of Stratified Soil Bulk Density in Different Geographic Regions

Considering the analyses of main geographical distribution (Figure 6 and Table 2), the distribution of stratified soil bulk density in different geographical regions showed a trend from low to high. Mean soil bulk density of grassland in the grasslands of northern China was 1.52 g·cm−3, the maximum soil bulk density is 2.23 g·cm−3 while the minimum soil bulk density was 0.14 g·cm−3. The lowest soil bulk density value was observed in Tianshan Mountain area, with a mean soil bulk density of 1.01 g·cm−3 and surface soil bulk density was 0.94 g·cm−3. Conversely, the highest soil bulk density value was observed in the grassland of Tarim basin, with a mean soil bulk density of 1.91 g·cm−3 and surface soil bulk density of 1.85 g·cm−3. The results showed that the high value of soil bulk density mainly distributed in plain and basin, which was arid climate, and the low value of soil bulk density mainly distributed in mountain and plateau, which was humid climate.

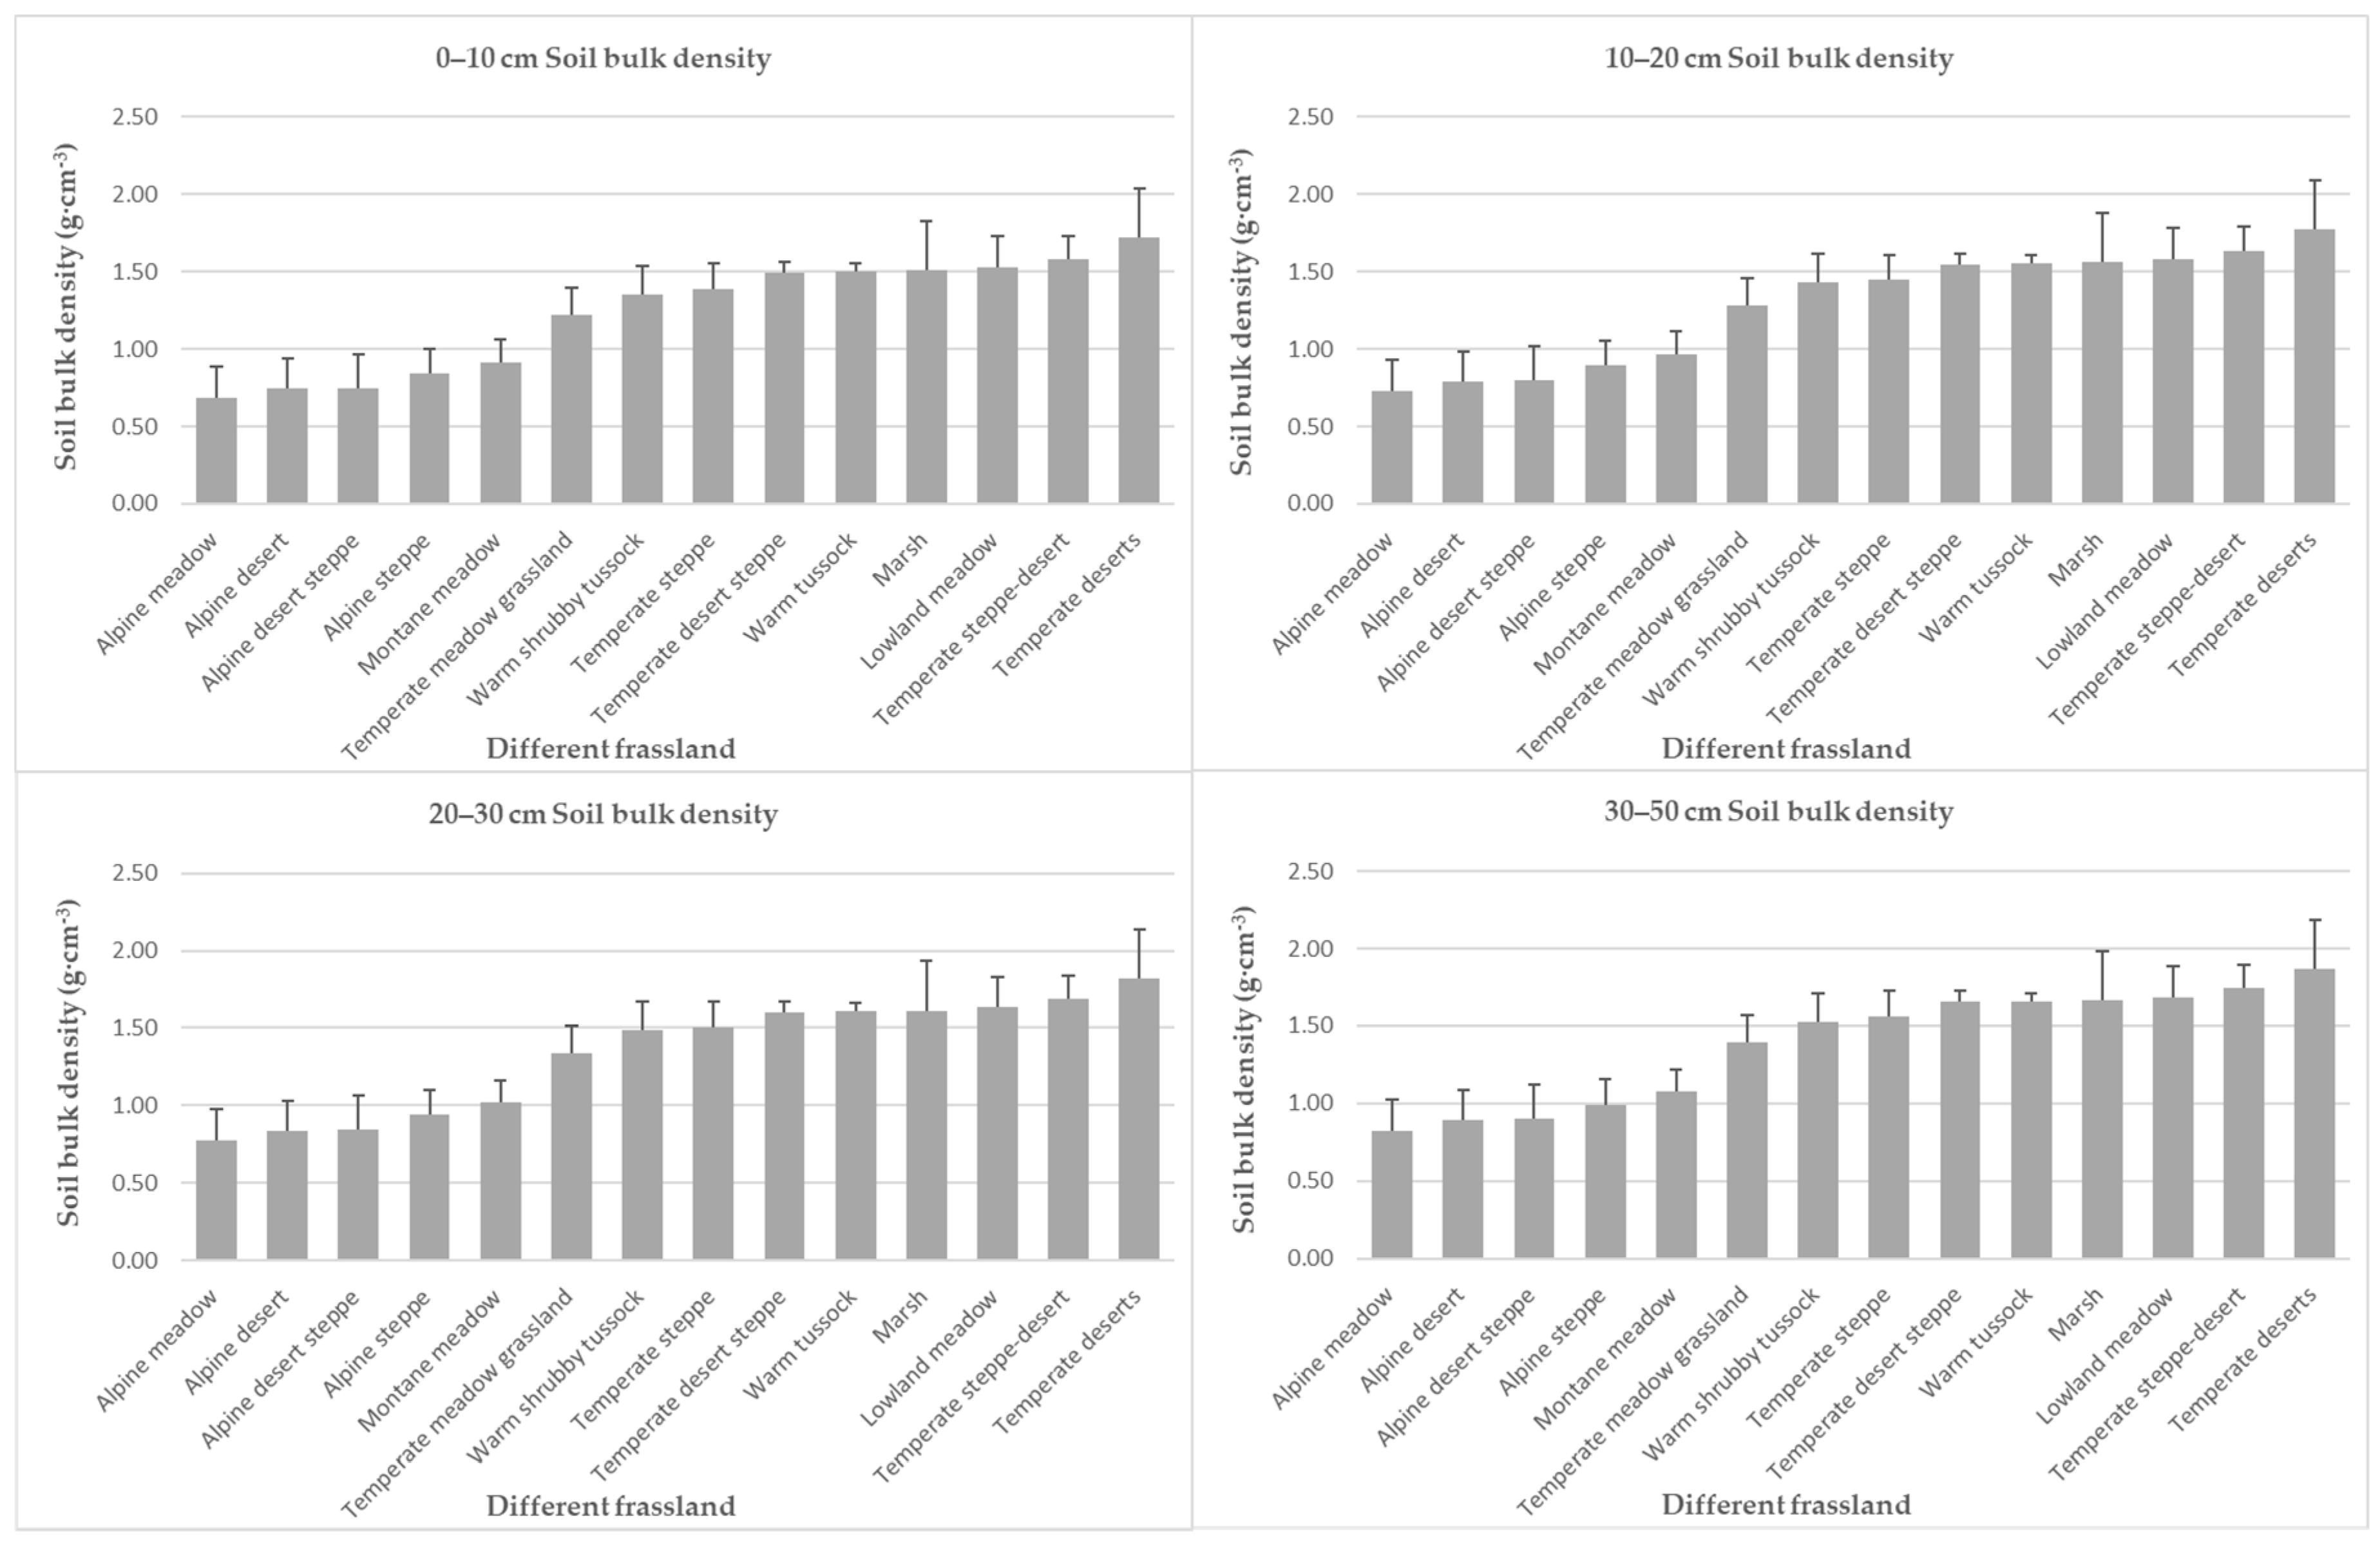
3.3. Comparison of Stratified Soil Bulk Density in Different Grassland Types

According to the data of grassland types in the grassland of northern China [36], soil bulk density data of main grassland types were extracted, and statistical analysis of different types of stratified soil bulk density was conducted (Table 3 and Figure 7). The result revealed that the soil bulk density of different grassland types varied significantly, among which the alpine meadow had the lowest soil bulk density, with mean soil bulk density of 0.75 g·cm−3 and surface soil bulk density of 0.68 g·cm−3. The soil bulk density of temperate desert had the highest value which was 1.80 g·cm−3 and mean surface soil bulk density was 1.72 g·cm−3. The results showed that the high value of soil bulk density mainly distributed in desert which was arid climate, and the low value of soil bulk density mainly distributed in steppe and meadow which was humid climate.

4. Discussion

4.1. Relationship Between Grassland Type, Organic Carbon Content and Soil Bulk Density

The change of soil bulk density is not only influenced by soil properties, such as texture, compactness, and land use type [2,41], but also by soil physical and chemical properties, such as clay content, water content, silt content, depth, PH value, and organic carbon content [42]. However, the most important factor influencing the change of soil bulk density is organic carbon content [43,44]. The content of soil organic carbon is comprehensive result of organic matter input and mineralization, and, for the grassland ecosystem, the input of organic matter mainly relies on the photosynthesis of herb and litter of small shrub. However, the ability of organic matter input for different types of grassland shows difference, causing differences in organic carbon content and thus affecting the soil bulk density.
On the other hand, the formation and distribution of soil types are adapted to the bioclimatic zone, and the soil bulk density of different grassland types varies widely. For grassland in the study area, there are three main types of grassland: temperate steppe, temperate desert steppe, and temperate meadow grassland. Three compatible soil types, namely chestnut soil, brown soil, and chernozem soil, were formed. The soil physical and chemical properties of the three soil types, such as texture and water content, are significantly different, and these differences affect the distribution of vegetation in turn. In general, soil porosity of brown soil is greater than that of chernozem soil, resulting in increased soil hardness and reduced soil water holding capacity, which will increase soil bulk density. Céspedes [41] found that the increase of soil bulk density would significantly affect the accumulation and holding capacity of soil organic carbon content. The change of grassland type leads to the increase or decrease of soil bulk density, which affects the soil organic carbon content also.

4.2. Accuracy Analyses of Soil Bulk Density Data

According to the comparative analysis of soil bulk density research results of different regions by different scholars, the soil bulk density stratification data estimated in this study is close to the results of various scholars (Table 4), which basically reflects the distribution of grassland soil bulk density spatial distribution pattern in the temperate steppe region of northern China. But there are significant differences in individual regions. In this study, we collected the relevant studies of seven main geographical areas in the study area. However, because of the difficulties and uncertainties of soil bulk density sampling, along with the variation and heterogeneity of sample site settings, the prediction models for soil bulk density established by different scholars were rather diverse, leading to differences in soil bulk density measurements. Zhou [37] employed the multivariate weighted regression model (MWRM) [39] for the prediction of 198 sampling sites in Yili Xinjiang and obtained extremely different results. This difference might be attributed to the fact that Zhou [37] did not estimate the soil bulk density based on the soil depth of Yili area. Other studies have shown that there are significant differences in soil bulk density between different soil depth ranges in the vertical direction in the Yili region [45]. Moreover, because of the special topography of Yili region, the soil layer contains more gravel, which increases the variability of soil bulk density in the vertical direction. Zhang [45] found that the presence of gravel can increase soil bulk density by approximately 16%, which indicates that the difference in soil composition of 0–30 cm in Yili area will cause significant changes in soil bulk density. Cheng [46] mainly measured the soil bulk density of 0~30cm in the montane meadow of the northern slope of the Tianshan Mountains, and the number of samples was small, which did not fully reflect the actual situation of the Tianshan Mountains soil. Wang [47] performed soil bulk density analyses at 27 sampling sites of Hulunbeir grassland, and the results were significantly different from those obtained in the present study. Although this difference may be attributed to the limited number of sampling points that may not fully reflect the overall soil characteristics of the region, it is also noteworthy that Wang [47] selected samples of desertification gradient from Hulunbeir region without sampling other types of grassland. This difference may also be affected by the boundary of the study area, soil heterogeneity, and so on.

4.3. Application and Problems of Pedotransfer Function

China has a vast territory, complex and changeable natural geographical environment, and the relationship between soil bulk density and other soil properties in different soil types could be considerably diverse. Therefore, most studies have fully considered the territoriality of soil when applying a Pedotransfer function model for soil bulk density [50,51,52]. Moreover, based on the classification of soil system, Han [50] grouped the existing soil data of China and established a polynomial model for each soil subtype. Although this approach improved the accuracy of the model for prediction to a certain extent, it was not suitable for complex soil environment and did not consider the variation trend of soil bulk density in vertical profile. On the other hand, the models proposed in other studies, such as the previous empirical models, did not consider factors including topography, climate, and parent materials [53,54]. Therefore, it is necessary to construct more accurate soil bulk density Pedotransfer function for large-scale prediction of soil bulk density.
In the present study, a stratified Pedotransfer function model for soil bulk density in the grasslands of northern China was established using the complete soil bulk density profile data from a grassland survey conducted by the Pilot Project of Chinese Academy of Sciences. The impact of regional differences and vertical profile on soil bulk density was completely considered, in combination with climate and topography among other factors. The accuracy of soil bulk density prediction was improved to a certain extent.

5. Conclusions

In this study, based on the sampled data, we simulated the spatial pattern of soil bulk density 0–50 cm in northern China grassland using MWRM model and stratified soil Pedotransfer function. The result indicated that: (i) The soil bulk density in grassland of northern China was high in the central and northwestern regions and low in the eastern regions. The mean soil bulk density of grassland was 1.52 g·cm−3. (ii) Soil bulk density shows spatial heterogeneity, and its distribution trend is consistent with grassland type. (iii) According to the validation results (MPE = 0.018, RMSE = 0.223, relative error = 16.2%, R2 = 0.5386), our Pedotransfer function provides insights into the construction of stratified data for soil bulk density estimation at a large scale, which raised accuracy of soil organic matter calculation.

Author Contributions

Conceptualization, Huazhong Zhu and Huaping Zhong; methodology, Huaping Zhong; software, Yuxin Qiao; validation, Yuxin Qiao and Yuzhe Li; formal analysis, Yuxin Qiao; investigation, Huaping Zhong and Yuxin Qiao; resources, Yuxin Qiao; data curation, Yuxin Qiao; writing—original draft preparation, Yuxin Qiao; writing—review and editing, Yuxin Qiao and Yuzhe Li; visualization, Yuxin Qiao; supervision, Yuzhe Li; project administration, Huazhong Zhu; funding acquisition, Yuzhe Li. All authors have read and agreed to the published version of the manuscript.

Funding

This work was supported by the National Science and Technology Foundation work (grant numbers 2011FY110400-3, 2012FY111900-2); National Science and Technology Infrastructure Platform–Earth System Scientific Data Sharing Platform (grant number 2005DKA32300); and Technical and basic work data integration and normalization (2013FY110900); Natural Sciences Foundation of China (41971276).

Acknowledgments

We are grateful to the students who study in China Agriculture University for collecting field data and sample. This study supported by Investigation on the Degradation and Causes of Grassland Resources in Key Pastoral Areas of Temperate Grassland in China project and the Pilot Project of the Chinese Academy of Sciences.

Conflicts of Interest

The authors declare no conflict of interest. The funders had no role in the design of the study; in the collection, analyses, or interpretation of data; in the writing of the manuscript, or in the decision to publish the results.

References

  1. Suuster, E.; Ritz, C.; Roostalu, H.; Reintam, E.; Kõlli, R.; Astover, A. Soil bulk density pedotransfer functions of the humus horizon in arable soils. Geoderma 2011, 163, 74–82. [Google Scholar] [CrossRef]
  2. Dexter, A.R. Soil physical quality. Geoderma 2004, 120, 201–214. [Google Scholar] [CrossRef]
  3. Rawls, W.J. Estimating Soil Bulk Density From Particle Size Analysis and Organic Matter Content1. Soil Sci. 1983, 135, 123–125. [Google Scholar] [CrossRef]
  4. Alexander, E.B. Bulk densities of California soils in relation to other soil properties. Soil Sci. Soc. Am. J. 1980, 44, 689–692. [Google Scholar] [CrossRef]
  5. Huang, C.Q.; Shao, M.A. Soil shrinkage and hydrostructural characteristics of three swelling soils in Shaanxi, China. J. Soils Sediments 2011, 11, 474–481. [Google Scholar] [CrossRef] [Green Version]
  6. Manrique, L.A.; Jones, C.A. Bulk Density of Soils in Relation to Soil Physical and Chemical Properties. Soil Sci. Soc. Am. J. 1991, 55, 476–481. [Google Scholar] [CrossRef]
  7. Silva, A.P.D.; Kay, B.D.; Perfect, E. Management versus inherent soil properties effects on bulk density and relative compaction. Soil Tillage Res. 1997, 44, 81–93. [Google Scholar] [CrossRef]
  8. Gifford, R.M.; Roderick, M.L. Soil carbon stocks and bulk density: Spatial or cumulative mass coordinates as a basis of expression? Global Chang. Biol. 2010, 9, 1507–1514. [Google Scholar] [CrossRef]
  9. Gupta, S.C.; Larson, W.E. Estimating Soil Water Retention Characteristics From Particle Size Distribution, Organic Matter Percent, and Bulk Density. Water Resour. Res. 1979, 15, 1633–1635. [Google Scholar] [CrossRef]
  10. Hart, R.H. Soil Bulk Density and Water Infiltration as Affected by Grazing Systems. J. Range Manag. 1987, 40, 307–309. [Google Scholar]
  11. Bache, B.W.; Chesworth, W.; Chesworth, W.; Gessa, C.; Lewis, D.T. Encyclopedia of Soil Science; Springer: Dordrecht, The Netherlands, 2008; pp. 74–75. [Google Scholar] [CrossRef]
  12. Harrison, A.F.; Bocock, K.L. Estimation of Soil Bulk-Density from Loss-on-Ignition Values. J. Appl. Ecol. 1981, 18, 919–927. [Google Scholar] [CrossRef]
  13. Kazuki, N.; Shin, U.; Shoji, H.; Akihiro, I.; Masahiro, K. A pedotransfer function for estimating bulk density of forest soil in Japan affected by volcanic ash. Geoderma 2014, 213, 36–45. [Google Scholar]
  14. Kaur, R.; Kumar, S.; Gurung, H.P. A pedo-transfer function (PTF) for estimating soil bulk density from basic soil data and its comparison with existing PTFs. Aust. J. Soil Res. 2002, 40, 847–858. [Google Scholar] [CrossRef]
  15. Sevastas, S.; Gasparatos, D.; Botsis, D.; Siarkos, I.; Diamantaras, K.I.; Bilas, G. Predicting bulk density using pedotransfer functions for soils in the Upper Anthemountas basin, Greece. Geoderma Reg. 2018, 14, e00169. [Google Scholar] [CrossRef]
  16. Alqinna, M.I.; Jaber, S.M. Predicting Soil Bulk Density Using Advanced Pedotransfer Functions in an Arid Environment. Trans. ASABE 2013, 56, 963–976. [Google Scholar]
  17. Mcbratney, A.B.; Minasny, B.; Stephen, R.C.; RWillem, V. From pedotransfer functions to soil inference systems. Geoderma 2002, 109, 41–73. [Google Scholar] [CrossRef]
  18. Minasny, B.; Hartemink, A.E. Predicting soil properties in the tropics. Earth-Sci. Rev. 2011, 106, 52–62. [Google Scholar] [CrossRef]
  19. Kätterer, H.; Andrén, O.; Jansson, P.-E. Pedotransfer functions for estimating plant available water and bulk density in Swedish agricultural soils. Acta Agric. Scand. 2006, 56, 263–276. [Google Scholar]
  20. Han, G.Z.; Zhang, G.L.; Gong, Z.T.; Wang, G.F. Pedotransfer Functions for Estimating Soil Bulk Density in China. Soil Sci. 2012, 177, 158–164. [Google Scholar] [CrossRef]
  21. Benites, V.M.; Machado, P.L.O.A.; Fidalgo, E.C.C.; Coelho, M.R.; Madari, B.E.J.G. Pedotransfer functions for estimating soil bulk density from existing soil survey reports in Brazil. Geoderma 2007, 139, 90–97. [Google Scholar] [CrossRef]
  22. SakİN, E.; Deliboran, A.; Tutar, E. Bulk density of Harran plain soils in relation to other soil properties. Afr. J. Agric. Res. 2011, 6, 1750–1757. [Google Scholar]
  23. Tomasella, J.; Hodnett, M. Estimating soil water retention characteristics from limited data in Brazilian Amazonia. Soil Sci. 1998, 163. [Google Scholar] [CrossRef]
  24. Kida, M.F.; Fujitake, N. Organic Carbon Stabilization Mechanisms in Mangrove Soils: A Review. Forests 2020, 11, 981. [Google Scholar] [CrossRef]
  25. Tranter, G.; Minasny, B.; Mcbratney, A.B. Estimating Pedotransfer Function Prediction Limits Using Fuzzy—Means with Extragrades. Soil Sci. Soc. Am. J. 2010, 74, 1967–1975. [Google Scholar] [CrossRef]
  26. Calhoun, F.G.; Smeck, N.E.; Slater, B.L.; Bigham, J.M.; Hall, G.F. Predicting bulk density of Ohio Soils from Morphology, Genetic Principles, and Laboratory Characterization Data. Soil Sci. Soc. Am. J. 2001, 65, 811–819. [Google Scholar] [CrossRef]
  27. Vos, B.D.; Meirvenne, M.V.; Quataert, P.; Deckers, J.; Muys, B. Predictive Quality of Pedotransfer Functions for Estimating Bulk Density of Forest Soils. Soil Sci. Soc. Am. J. 2005, 69, 500–510. [Google Scholar] [CrossRef]
  28. Wuest, S.B. Correction of Bulk Density and Sampling Method Biases Using Soil Mass per Unit Area. Soil Sci. Soc. Am. J. 2009, 73, 312–316. [Google Scholar] [CrossRef] [Green Version]
  29. Haines, W.B. The volume changes with variations of water content in soil. J. Agric. Sci. 1923, 13, 296–310. [Google Scholar] [CrossRef]
  30. Coughlan, K.J. The nature of changes in bulk density with water content in a cracking clay. Aust. J. Soil Res. 1977, 15, 27–37. [Google Scholar]
  31. Logsdon, S.D.; Cambardella, C.A. Temporal changes in small depth-incremental soil bulk density. Soil Sci. Soc. Am. J. 2000, 64, 710–714. [Google Scholar] [CrossRef]
  32. Imbrenda, V.; D’Emilio, M.; Lanfredi, M.; Macchiato, M.; Simoniello, T. Indicators for the estimation of vulnerability to land degradation derived from soil compaction and vegetation cover. Eur. J. Soil Sci. 2014, 65, 907–923. [Google Scholar] [CrossRef] [Green Version]
  33. Jackson, J.R.B. The Vertical Distribution of Soil Organic Carbon and Its Relation to Climate and Vegetation; Wiley: Hoboken, NJ, USA, 2000; Volume 10, pp. 423–436. [Google Scholar]
  34. Baritz, R.; Seufert, G.; Montanarella, L.; Ranst, E.V. Carbon concentrations and stocks in forest soils of Europe. For. Ecol. Manag. 2010, 260, 262–277. [Google Scholar] [CrossRef]
  35. Hou, X.Y.; Ding, Y.; Wu, X.H. Impact of Climate Change and Adaption in Northern Grassland of China; Science Press: Beijing, China, 2014; pp. 34–46. [Google Scholar]
  36. Fan, L.G.; Lin, J. Rangland Resource of China; China Science and Technology Press: Beijing, China, 1996; pp. 175–325. [Google Scholar]
  37. Zhou, L.L.; Zhu, H.Z.; Zhong, H.P.; Yang, H.; Shao, X.M.; Zhou, X.J. Spatial analysis of soil bulk density in Yili, Xinjiang Uygur Autonomous Region, China. Acta Pratac. Sin. 2016, 25, 64–75. [Google Scholar]
  38. Qiao, Y.X.; Zhu, H.Z.; Zhong, H.P.; Wu, Z.W.; Zhou, L.L. Spatial interpolation analysis of grassland below-ground biomass in the Inner Mongolia Autonomous Region, China. Acta Pratac. Sin. 2016, 25, 1–2. [Google Scholar]
  39. Wang, S.Z.; Fan, J.W.; Zhong, H.P.; Li, Y.Z.; Zhu, H.Z.; Qiao, Y.X.; Zhang, H.Y. A multi-factor weighted regression approach for estimating the spatial distribution of soil organic carbon in grasslands. Catena 2019, 174, 248–258. [Google Scholar] [CrossRef]
  40. Céspedes-Payret, C.; Bazzoni, B.; Gutiérrez, O.; Panario, D. Soil Organic Carbon vs. Bulk Density Following Temperate Grassland Afforestation. Environ. Process. 2017, 4, 75–92. [Google Scholar] [CrossRef]
  41. Sonja, A.H.; Brandt, C.C.; Jardine, P.M. Using soil physical and chemical properties to estimate bulk density. Soil Sci. Soc. Am. J. 2005, 69, 51–56. [Google Scholar]
  42. Gosselink, J.G.; Hatton, R.; Hopkinson, C.S. Relationship of Organic Carbon and Mineral Content to Bulk Density in Louisiana Marsh Soils. Soil Sci. 1984, 137, 177–180. [Google Scholar] [CrossRef]
  43. Martin, W.; Livia, U.; Eleanor, H.; Birgit, L.; Margit, v.L.; Erika, M.-S.; Bas, v.W.; Eva, R.; Mareike, L.; Noelia, G.-F.; et al. Soil organic carbon storage as a key function of soils—A review of drivers and indicators at various scales. Geoderma 2019, 333, 149–162. [Google Scholar] [CrossRef]
  44. Cheng, P. Effects of Graze on Soil Moisture and Weight of Meadow in the North Slope of Tianshan Mountain. J. Anhui Agric. Univ. 2010, 38, 5194–5196. [Google Scholar]
  45. Han, G.; Wang, D.; Xie, X. Pedotransfer functions for prediction of soil bulk density for major types of soils in China. Acta Pedol. Sin. 2016, 51, 93–102. [Google Scholar]
  46. Wang, H.; Zhao, W.Z.; Wu, L.Y. Prediction of Bulk Density of Soils in the Loess Plateau Region of China. Surv. Geophys. 2014, 35, 395–413. [Google Scholar] [CrossRef]
  47. Wang, H.; Zhao, W.Z.; Li-Yu, W.U. Change of Soil Physical Properties with Precipitation Gradient in Desert Region of Hexi Corridor. Bull. Soil Water Conserv. 2010, 30, 46–51. [Google Scholar]
  48. Wang, J.; Zhou, R.L.; Zhao, H.L.; Zhao, X.Y. Comparison of Soil Physical and Chemical Properties in the Desertification Process of Hulunbeier Sandy Land and Songnen Sandy Land. J. Dersert. Res. 2011, 31, 309–314. [Google Scholar]
  49. Zhang, W.T.; Chen, S.; Liu, Y.H.; Sheng, J.D.; Yue, S.U. Soil Bulk Density Variation of Grassland in Ili Valley and the Measurement. Xinjiang Agric. Sci. 2017, 54, 165–170. [Google Scholar]
  50. Xiong, Z.Q.; Li, S.C.; Lu, Y.; Liu, G.H.; Zhang, Q.F.; Liu, W.Z. Topography and land use effects on spatial variability of soil denitrification and related soil properties in riparian wetlands. Ecol. Eng. 2015, 83, 437–443. [Google Scholar] [CrossRef]
  51. Li, Y.; Chen, D.; White, R.E.; Zhu, A.; Zhang, J. Estimating soil hydraulic properties of Fengqiu County soils in the North China Plain using pedo-transfer functions. Geoderma 2007, 138, 261–271. [Google Scholar] [CrossRef]
  52. Tranter, G.; Minasny, B.; Mcbratney, A.B.; Murphy, B.; Mckenzie, N.J.; Grundy, M.; Brough, D. Building and testing conceptual and empirical models for predicting soil bulk density. Soil Use Manag. 2010, 23, 437–443. [Google Scholar] [CrossRef]
  53. Hong, S.Y.; Minasny, B.; Han, K.H.; Kim, Y.; Lee, K. Predicting and mapping soil available water capacity in Korea. PeerJ 2013, 1, e71. [Google Scholar] [CrossRef]
  54. Périé, C.; Ouimet, R. Organic carbon, organic matter and bulk density relationships in boreal forest soils. Can. J. Soil Sci. 2008, 88, 315–325. [Google Scholar] [CrossRef]
Figure 1. Spatial distribution of the northern grassland in China and distribution of survey sample sites.
Ijgi 09 00682 g001
Figure 2. The flow chart of methodology.
Ijgi 09 00682 g002
Figure 3. Spatial distribution mapping of stratified soil bulk density of northern grasslands: (a) 0–10 cm soil bulk density; (b) 10–20 cm soil bulk density; (c) 20–30 cm soil bulk density; (d) 30–50 cm soil bulk density.
Ijgi 09 00682 g003
Figure 4. Validation of surface soil (0–50cm) soil bulk density estimation of northern grasslands.
Ijgi 09 00682 g004
Figure 5. Proportion of stratified soil bulk density.
Ijgi 09 00682 g005
Figure 6. Stratified soil bulk density in different depths and geographical regions. Mean +1SD.
Ijgi 09 00682 g006
Figure 7. Stratified soil bulk density in different depths and grassland types. Mean +1SD.
Ijgi 09 00682 g007
Table 1. Different datasets source and application.
DatasetInvestigation on the Degradation and Causes of Grassland Resources in Key Pastoral Areas of Temperate Grassland in ChinaPilot Project of the Chinese Academy of Sciences Other Datasets
Sample Numbers587143587
ApplicationFor spatial model construction and validation, spatial interpolationFor stratified model constructionFor spatial interpolation
Model construction397 117 397
Model validation190 (Applied in SPTF model validation)None190 (Applied in SPTF model)
Table 2. Statistical analysis in different geographical regions.
Major Geographical Areas0–50 cm Soil Bulk Density (g·cm−3)
MaximumMinimumAverageStandard DeviationCV
Northern grasslands 2.230.141.520.350.23
Hulunbuir Plateau1.750.861.450.160.11
Da Hinggan Ling Prefecture1.740.551.240.150.12
Songnen Plain1.930.661.560.170.11
Inner Mongolia Plateau1.910.571.510.220.15
Hetao and Tumochuan Plains1.911.131.810.110.06
Loess Plateau 1.900.381.570.210.13
Alxa Plateau1.980.651.830.140.08
Hexi Corridor Area2.030.351.290.430.33
Tarim basin2.230.801.910.170.09
Tianshan Mountain Area2.060.141.010.390.38
Ili River Valley 1.850.371.250.330.26
Junggar Basin2.060.151.730.260.15
Altai Mountains 1.880.201.100.360.33
Pamir–Kunlun–Altun Plateau Region 1.980.341.130.310.27
Table 3. Statistical analysis in different grassland types.
Main Grassland Types0–50 cm Soil Bulk Density (g·cm−3)
MaximumMinimumAverageStandard DeviationCV
Temperate meadow grassland 1.910.421.310.200.15
Temperate steppe 1.930.451.480.190.13
Temperate desert steppe 1.900.551.570.220.14
Alpine steppe 1.740.420.920.160.17
Alpine desert steppe 1.370.340.820.140.17
Temperate steppe-desert 1.920.701.660.180.11
Temperate deserts 2.050.501.800.190.10
Alpine desert 1.370.430.820.160.20
Warm tussock 1.641.371.580.070.04
Warm shrubby tussock 1.471.271.450.050.03
Lowland meadow 2.230.471.610.320.20
Montane meadow 1.920.360.990.200.20
Alpine meadow 1.750.150.750.150.20
Marsh 1.950.731.590.320.20
Table 4. Comparison of soil bulk density research results in different regions.
AreaNumber of SamplesSoil Bulk Density (Depth)Soil Bulk Density (Depth)References
Inner Mongolia1981.45 (0–10 cm)1.42 (0–10 cm)[38]
Yili, Xinjiang1461.01 (0–30 cm)1.22 (0–30 cm)[37]
Tianshan, Xinjiang110.94 (0–10 cm)0.94 (0–10 cm)[46]
The Loess Plateau7481.40 (0–5 cm & 20–25 cm)1.55 (0–30 cm)[48]
Songnen Plain271.45 (0–10 cm)1.48 (0–10 cm)[47]
Hulunbuir Plateau271.55 (0–10 cm)1.36 (0–10 cm)[47]
Hexi Corridor Area361.26 (0–10 cm)1.21 (0–10 cm)[49]
Publisher’s Note: MDPI stays neutral with regard to jurisdictional claims in published maps and institutional affiliations.

