Article

Impact of UAV Surveying Parameters on Mixed Urban Landuse Surface Modelling

by
Muhammad Hamid Chaudhry
1,2,*,
Anuar Ahmad
1 and
Qudsia Gulzar
2
1
Geoformation, Faculty of Built Environment & Surveying, Universiti Teknologi Malaysia, Skudai 81310, Malaysia
2
Centre for GIS, University of the Punjab, Lahore 54590, Pakistan
*
Author to whom correspondence should be addressed.
ISPRS Int. J. Geo-Inf. 2020, 9(11), 656; https://doi.org/10.3390/ijgi9110656
Submission received: 15 September 2020 / Revised: 14 October 2020 / Accepted: 22 October 2020 / Published: 31 October 2020

Abstract

:
Unmanned Aerial Vehicles (UAVs) as a surveying tool are mainly characterized by a large amount of data and high computational cost. This research investigates the use of a small amount of data with less computational cost for more accurate three-dimensional (3D) photogrammetric products by manipulating UAV surveying parameters such as flight lines pattern and image overlap percentages. Sixteen photogrammetric projects with perpendicular flight plans and a variation of 55% to 85% side and forward overlap were processed in Pix4DMapper. For UAV data georeferencing and accuracy assessment, 10 Ground Control Points (GCPs) and 18 Check Points (CPs) were used. Comparative analysis was done by incorporating the median of tie points, the number of 3D point cloud, horizontal/vertical Root Mean Square Error (RMSE), and large-scale topographic variations. The results show that an increased forward overlap also increases the median of the tie points, and an increase in both side and forward overlap results in the increased number of point clouds. The horizontal accuracy of 16 projects varies from ±0.13m to ±0.17m whereas the vertical accuracy varies from ± 0.09 m to ± 0.32 m. However, the lowest vertical RMSE value was not for highest overlap percentage. The tradeoff among UAV surveying parameters can result in high accuracy products with less computational cost.

1. Introduction

Mapping and surveying always complement each other. Advancements in surveying techniques and technologies results in the accuracy enhancement of mapping products. The digital era has revolutionized surveying technologies and techniques. Developments in surveying technologies such as satellite remote sensing, aerial surveying, Light Detection and Ranging (LIDAR), and so on, complemented with image processing techniques and software developments have revolutionized 3D mapping (terrain modelling) of the Earth’s surface. The 3D mapping of the Earth’s surface is commonly known as a Digital Surface Model (DSM). DSM is a digital representation of the horizontal and vertical dimension related to the Earth including all natural and manmade objects in a grid cell structure. In all socio-economic activities of human beings, the Earth’s surface has great importance. Its mapping has been addressed by researchers in the geoscience community in the past few decades. The surface of the Earth is being modelled by earth scientists as 2D (Planimetric map), 2.5D (Topographic map), and 3D (DSM). Commencing from the early 1300s with ‘Jacob Staff’ and ‘Compass’ until today, the generation of elevation models have evolved from hand drawn or field drawn (With Plane Table Alidade in late 1800s) topo and planimetric maps, to digital representations as DSMs [1]. A DSM represents the elevation associated with the surface of the Earth including topography and all natural or human-made features located on the surface of the Earth [2]. DSM is one of the most fundamental geospatial products and has been used in many applications [3]. More importantly, recent developments in photogrammetry allow high-resolution photo-realistic terrain models to be easily constructed, producing unprecedented visualizations of the Earth’s surface [4].
Topographic maps are the basic datasets of any countries’ National Spatial Data Infrastructure (NSDI); therefore, temporal changes and complete coverage especially in remote rugged terrains and in dense urban areas is challenging with ground surveying techniques. Satellite images and digital image processing techniques set a great challenge to ground surveying techniques for the processing and visualization of three-dimensional models of the Earth’s surface. Nowadays, DSM can be produced by different kinds of data such as geodetic surveys, satellite imagery (optical or radar), aerial photographs (conventional or UAV), and laser scanners (airborne or terrestrial) [5,6].
Photogrammetry is a remote sensing technique that utilizes at least two images of a scene to derive the three-dimensional location of features within the scene from known values of camera position, focal length, and orientation [7]. Photogrammetry was most likely invented in the 1420s during the Italian Renaissance when painters would represent three-dimensional scenes in a two-dimensional medium while creating the sensation of depth. The actual term photogrammetry was coined in 1867, when Albrecht Meydenbauer began measuring photographs to create architectural surveys, which he called “photogrammetrie” [8]. Today, the goal of photogrammetry is to take two-dimensional images from different perspectives and create a three-dimensional representation of the same space. Over the past decade, there have been significant developments in photogrammetric techniques based on images from UAV for generating digital elevation models (DEM) [9].
The term Unmanned Aerial Vehicle (UAV) is commonly used in Artificial Intelligence, computer science, and robotics, as well as in the photogrammetry and remote sensing communities. UAV as a concept includes the remotely piloted aerial vehicle, the attached sensor payload, and the required flight planning and data processing software [10]. UAV has emerged as a low-cost alternative to the conventional photogrammetric system for an image capturing platform with high capability of spatio-temporal resolution to achieve a variety of goals [11]. UAVs have shown great potential in performing numerous surveying, mapping, and remote sensing tasks with extremely high-resolution data in low altitude flying and imaging conditions [12]. UAVs have the ability to produce data products such as 3D point cloud, DSM, orthophoto, Digital Terrain Model (DTM), contour line, etc., that are more scale appropriate for micro topographic investigations [13,14].
UAV platforms are increasingly used for the generation of very high resolution maps for geoscience studies which require unreachable areas instead of time-consuming ground-based traditional measurement techniques [15,16]. The use of UAVs for surveying purposes such as mapping, 3D modelling, point cloud extraction, and orthophoto generation has become a standard operation in recent years [17]. The UAV photogrammetric process includes UAV flight planning, deploying and processing ground control points (GCPs), and check points (CPs), image data acquisition, image processing and mapping products evaluation with respect to the mapping project. UAV data quality is affected by multiple factors such as sensor and flight parameters. As UAVs have emerged as the latest and widely used surveying equipment worldwide, researchers in the remote sensing community have been investigating effects of UAV flight planning parameters for various applications in earth sciences. Flight planning refers to the initial determination of flight geometry, given the area of interest and the required end-product, and thus the desired accuracy [18]. The most important flight planning parameters are flight time, flying height, flight lines, pattern and images, side and forward overlap percentage.
For 3D modelling, there must be a sufficient overlap in images classified as side overlap and forward overlap. The side overlap is the overlap between two adjacent flight path lines, whereas the overlap between two successive images on the same path is called the forward overlap or end lap. The overlap percentage will determine the number of flight lines, the number of images captured, and the time interval between image capturing. In any photogrammetric project, side and forward overlap percentage along flight speed determine the capture of a scene in multiple images from multiple view angles. Thus, the overlap of images determines the quality of UAV photogrammetric products, as it affect the point density as a function of viewing angle.
Along with image overlap percentage, the pattern of flight lines also affects the number of images capturing an individual scene. A number of flight line patterns can be developed on the basis of the dimension of study area and the data requirement. However, in the earth sciences community, the flight line pattern is generally either a lawn mower flight plan (plane moving back and forth in parallel flight lines) or a perpendicular flight plan (plane moving back and forth in two orthogonal perpendicular patterns). A number of researchers in geosciences applications have studied the effect of UAV images overlap on mapping products’ quality but they have made little mention of flight path plan as a key factor effecting the quality of photogrammetric products, coupled with image overlap percentage. Xing and Huang [19] used only two images for an experimental study of image overlap effects on Scale Invariant Feature Transform (SIFT) algorithm performance by varying the overlap from 10% to more than 90% and suggested the threshold of degree of overlap 55% for route direction and 30% for lateral direction. Dandois et al. [20] analyzed UAV data for tree height measurement with two variations of forward overlap (96%, 60%) and four variations of side overlap (20%, 40%, 60%, and 80%). They concluded that maximizing the photographic overlap, especially forward overlap, is crucial for minimizing canopy height error and for the overall sampling of the forest canopy. Yet, high overlap results in more photos and increased computation time, irrespective of the computation equipment, highlighting important trade-offs between data quality and the ability to rapidly produce high quality results. Mesas-Carrascosa et al. [21] studied 80–50% forward overlap and 70–40% side overlap for archeological site mapping. Mesas-Carrascosa et al. [22] investigated two different forward overlap and side overlap settings: 60–30% and 70–40%, with a forward overlap of 60% and 70% and a side overlap of 30% and 40% for crop mapping, and suggested that 70% forward overlap and 40% side overlap provided the desired results. Frey et al. [23] generated multiple overlap projects from a single flight project by selecting the number of pictures for forest mapping through the lawn mower flight plan. Domingo, et al. [24] studied the effects of image overlap on biomass prediction in tropical forests. For UAV surveys, the image forward overlap was fixed to 90% and the side overlap varied from 80% to 70%. The findings of this study was that best biomass model was obtained by using 70% side overlap and 90% forward overlap. Seifert et al. [25] sampled for images at varying frequencies to obtain forward overlap ratios ranging between 91% and 99% for forest mapping through UAV captured videos. Gabara and Sawicki [26] assessed the multivariate accuracy of UAV surveys conducted with 85% and 65% forward overlap and 85%, 65%, and 45% side overlap. The study was conducted to evaluate the impact of less forward and side overlap and the reduction of image number on the significant decrease of the bundle block adjustment (BBA) accuracy. It was concluded that the optimal variant in terms of accuracy and computing time using standard grade workstation is with reduced photos that overlap at the level of 65% for both forward overlap and side overlap.
However, as per the latest available information, image overlap percentage parameter in relation to the perpendicular flight plan for large scale topographic variations still needs to be addressed by researchers. Topographical mapping is one of the oldest surveying applications and this technique is ever-evolving. Aerial photography and digital photogrammetry is one of the most important modern mediums for topographic mapping [27].
The hypothesis of this research is that the perpendicular flight plan, also termed as cross-hatch or double grid, minimizes the effect of the forward overlap and side overlap percentage. Cabreira et al. [28] provided a review of multiple flight line patterns according to the shape of the area. As per the basic principle of photogrammetry, an increase in percentage of side overlap and forward overlap means that a particular scene will be captured in a greater number of images. The results are a greater number of matched feature points, 3D point clouds, and simultaneously, the enhanced accuracy of DSM. However, an increase in forward overlap and side overlap results in an increase of the number of images and subsequently an increased processing time of the photogrammetric project. A similar objective can be achieved by flying UAV in perpendicular flight lines. Also, a similar objective of capturing an individual scene in a greater number of images can be achieved by perpendicular flight lines. Therefore, by developing a perpendicular flight plan, less percentage overlap and a smaller number of images, processing can be used for a high density of the 3D point cloud resulting in more accurate DSM.
In this research, 16 photogrammetric projects with perpendicular flight plans were compared with a variation of 55–85% forward overlap and side overlap from a constant flying height, flying time, and flying speed. The acquired images were processed in Pix4D software by using 10 GCPs and 18 CPs. To compare the effects of the image overlap variations on photogrammetric data and products such as tie points, point cloud, horizontal and vertical Root Mean Square Error (RMSE) and large scale topographic variations were employed. Figure 1 provides a detailed workflow for this study. The entire study is carried out in three main phases, namely: data acquisition, data processing, and analysis. The main features of each phase provided in Figure 1 will be discussed in the next section of this paper.

2. Study Site

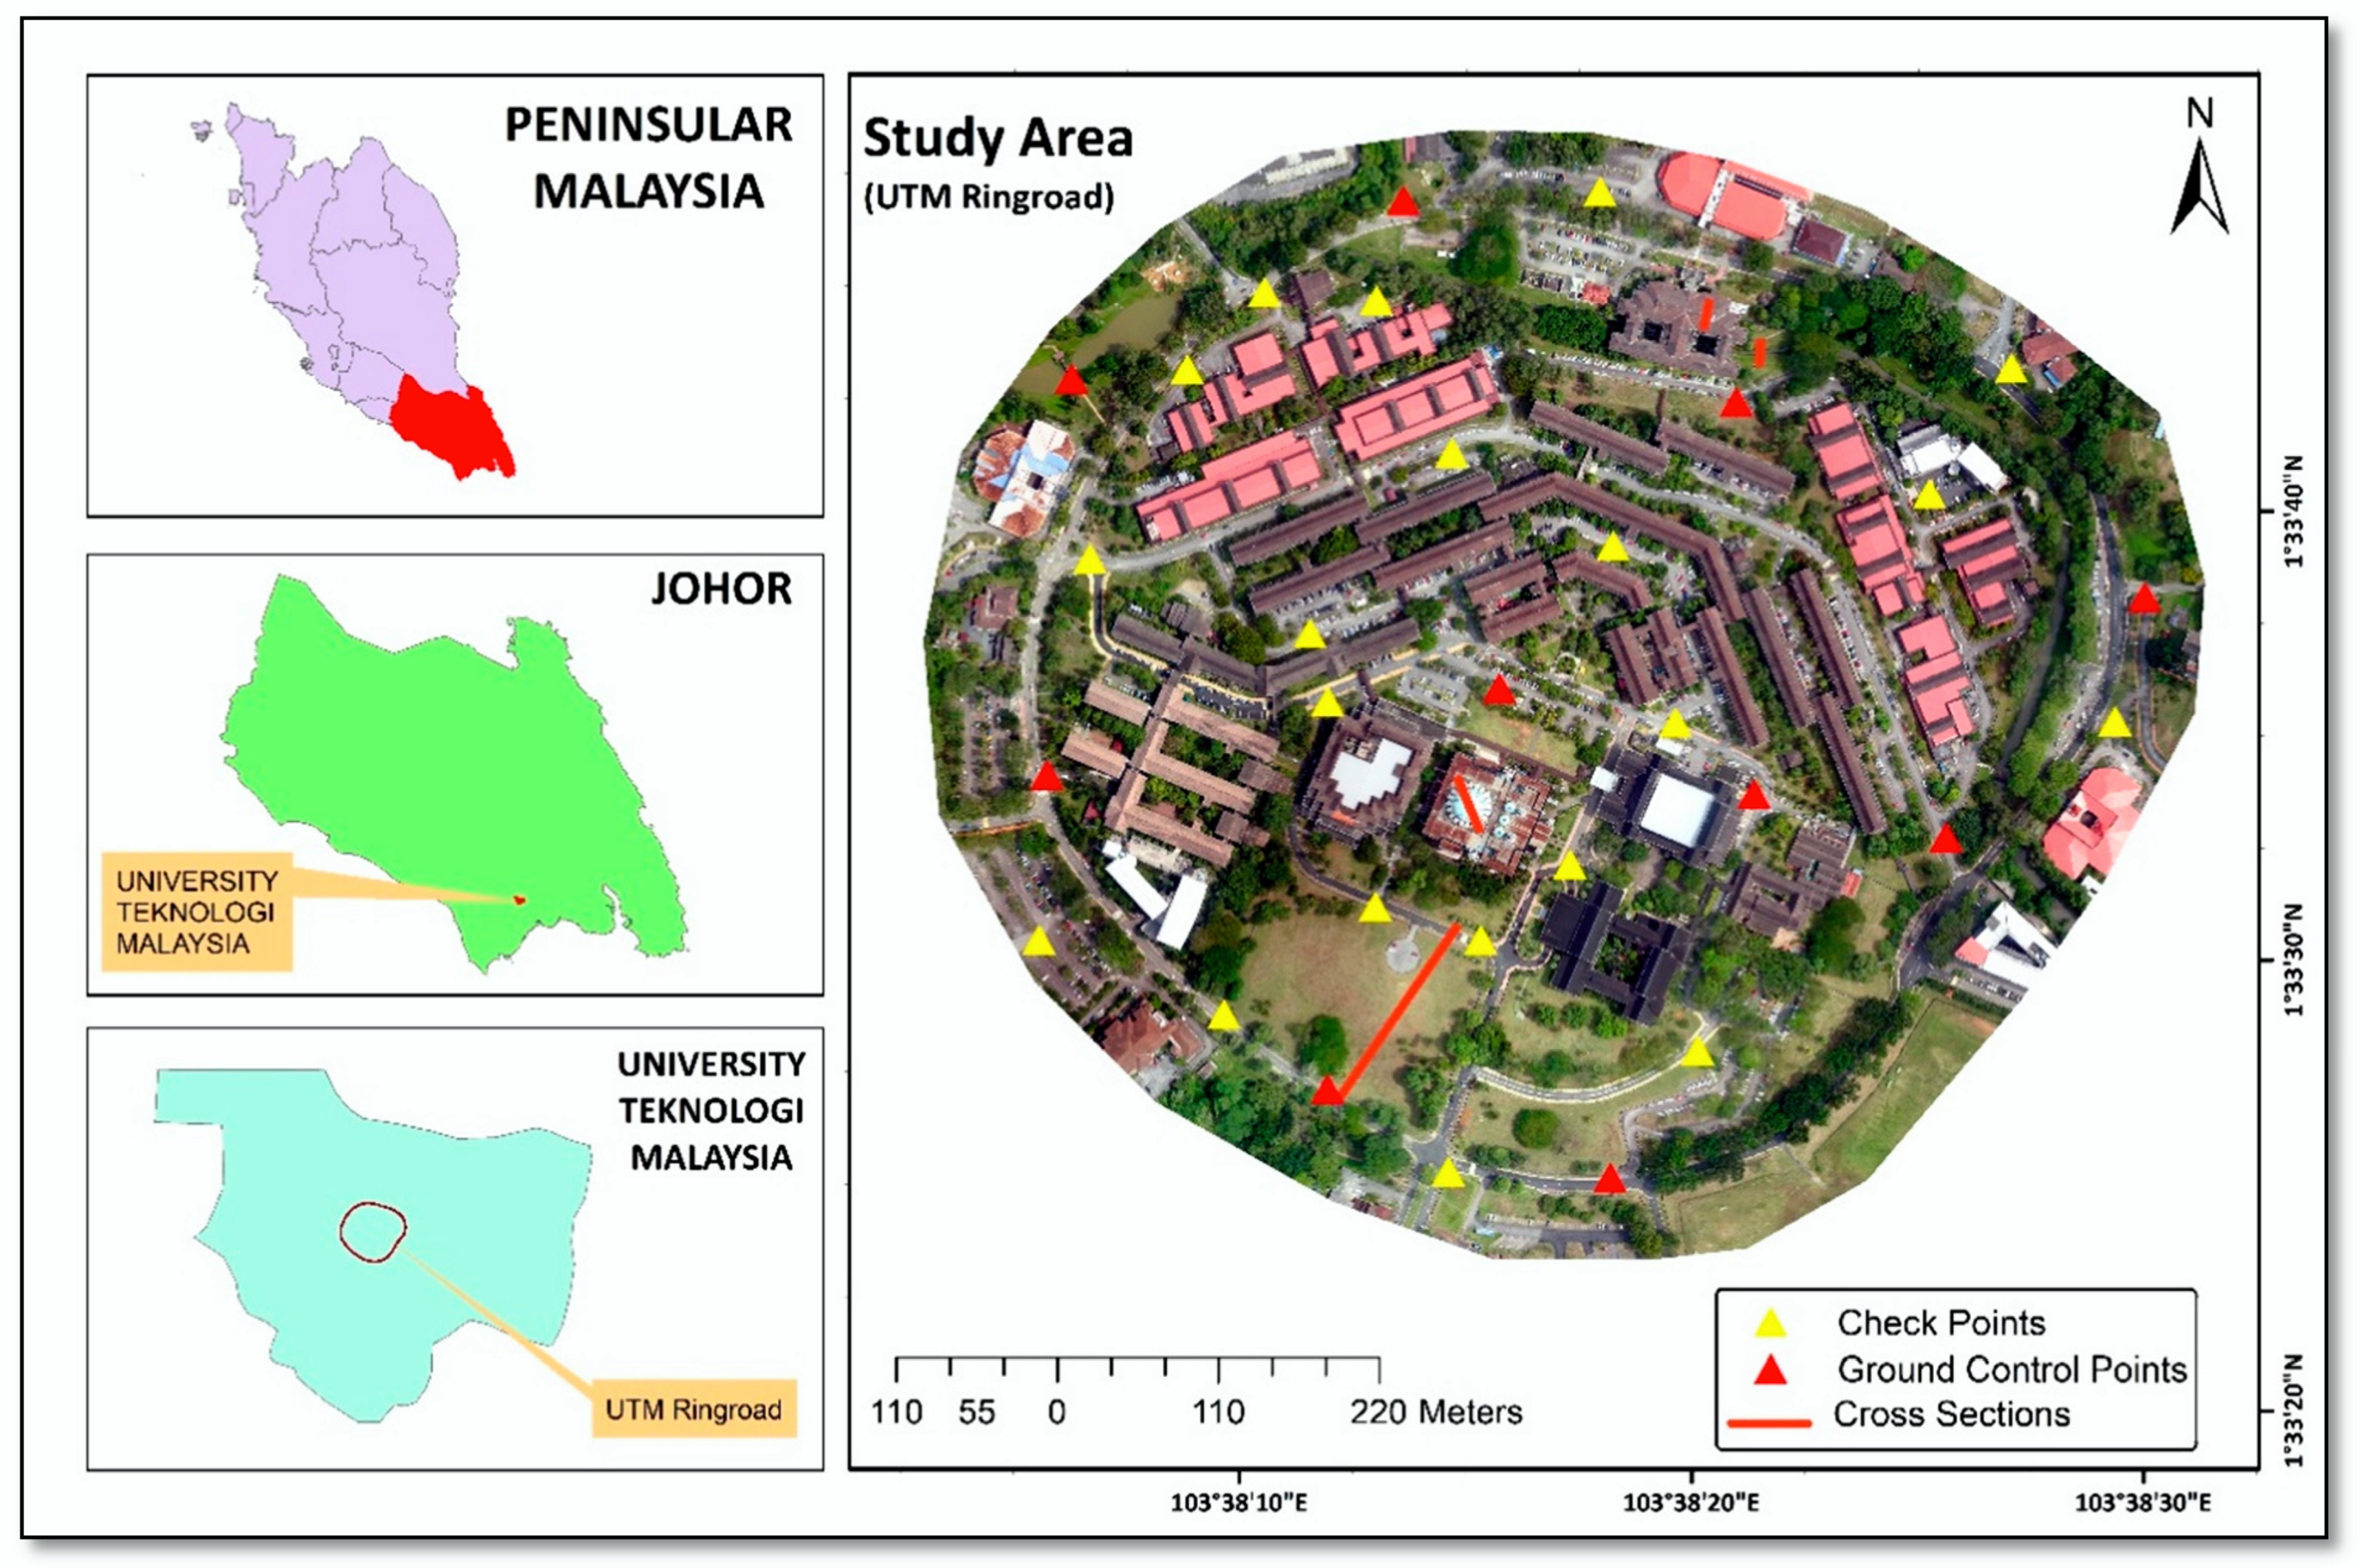
The study site was selected on the basis of the heterogeneity of land covers and topographic variations. The area being captured through UAV photogrammetry is 0.51 km2 in University Technology Malaysia, Johor, Malaysia. This area is bounded from Top 172,957.68663 m, Left 347,951.55466 m, Right 349,070.47732 m and Bottom 171,999.48669 m, Universal Transverse Mercator zone 48N coordinates. Malaysia is an equatorial country characterized by hot sunny and rainy days so most appropriate time of survey is before noon in term of rain and solar illumination angle. The study area (UTM-Johor campus) houses approximately 575 buildings. The compact inner circle consists of four faculties, an administrative zone, a mosque, a library, and a main hall. This area was developed with a radial concept [29]. The study area is situated on small hill with a gentle slope bounded with varying slope angles. The elevation varies from 37.4 m to 107 m. Figure 2 shows the study area showing a complex of buildings, roads, green patches, and tall trees with terrain undulation.

3. Data Acquisition

3.1. UAV Flight Planning and Images Acquisition

The UAV equipment used in this study was a Da-Jiang Innovations (DJI) Phantom 4 Advanced model, developed by SZ DJI Technology Corporation Limited (Shenzhen, China) with 20-megapixel scanner on board. This model is of medium size, with a net weight of 1388 g, and a diagonal wheelbase (propeller size excluded) of only 350 mm. The DJI Phantom 4 Advanced is able to fly with a maximum altitude of 6000 m and a flying range of 5000 m. Equipped with a 5870 mAh LiPo 4S battery, the DJI Phantom 4 Advanced has approximately 30 min of maximum flight time, and its maximum wind speed resistance ranges from 29 to 38 kph. It is equipped with a remote controller with a 2.4–2.483 GHz operating frequency with a maximum transmission distance of 5 km according to the Federal Communication Commission (FCC) and 3.5 km according to Conformité Européenne (CE) (https://www.dji.com/phantom-4/info). Equipped with the Flight Autonomy system made up of 5 vision sensors, dual-band satellite positioning (GPS and GLONASS), ultrasonic rangefinders and redundant sensors, the Phantom 4 Advanced is able to hover precisely in places with GPS and can fly in complex environments. The dual forward vision sensors can see as far as 30m out front, and enable auto brake, hover, or detour in front of obstacles within a 15m range. This alongside the numerous intelligent flight modes (Draw, Active Track, Tap Fly, Return to Home, and Gesture Mode) allows for unsurpassed freedom to focus on the picture and less on the piloting. The Phantom 4 Advanced can also shoot in RAW format and adjust its aperture on the fly. The result is unparalleled image quality (Information collected from DJI forum on 17 September 2020). Its hovering abilities along with vertical takeoff and landing capabilities make its design particularly attractive in close quarters, such as crowded urban areas [30].
Before UAV surveying, it was important the get acquainted with the study area so that we could choose the appropriate flight planning parameters. So, as a first step in data acquisition phase, a reconnaissance survey was conducted with major observations of the heights of man-made infrastructure, tree clusters, and terrain variations to ensure that the UAV flight plan would be compatible with the UAV platform endurance.
The UAV Flight Plan is a time-ordered list of orders that a UAV has to complete to fulfil the designed mission (i.e., take off, go to a waypoint, then hover to take a picture, then reach a second waypoint, then hover again to take a picture, complete the survey, and finally, land). Nowadays, there are many dedicated tools for the definition of missions for UAVs. These tools allow the user to manually fly the UAV or to establish a set of points that conform a path to be followed by the UAV. They rely in standard map technologies such as Google Maps and offer a 2D point of view [31]. The survey plan was prepared and executed by using Drone Deploy software. Drone Deploy is an online application that can be used on both a PC and a mobile device. Its main goal is to make surveying by UAV easy for every kind of user. Drone Deploy services can roughly be separated into two categories: Flight automation and data capture. Drone Deploy allows the user to precisely lay out the route for the UAV to fly and decide when the pictures will be taken by the UAV [32].
As the main objective of this study was to investigate the effect of image overlap percentage in relation to flight line pattern, other parameters such as flight height, UAV survey time, flight line pattern etc., were kept constant for all 16 photogrammetric projects. Table 1 depicts an overview of the UAV flight parameters.
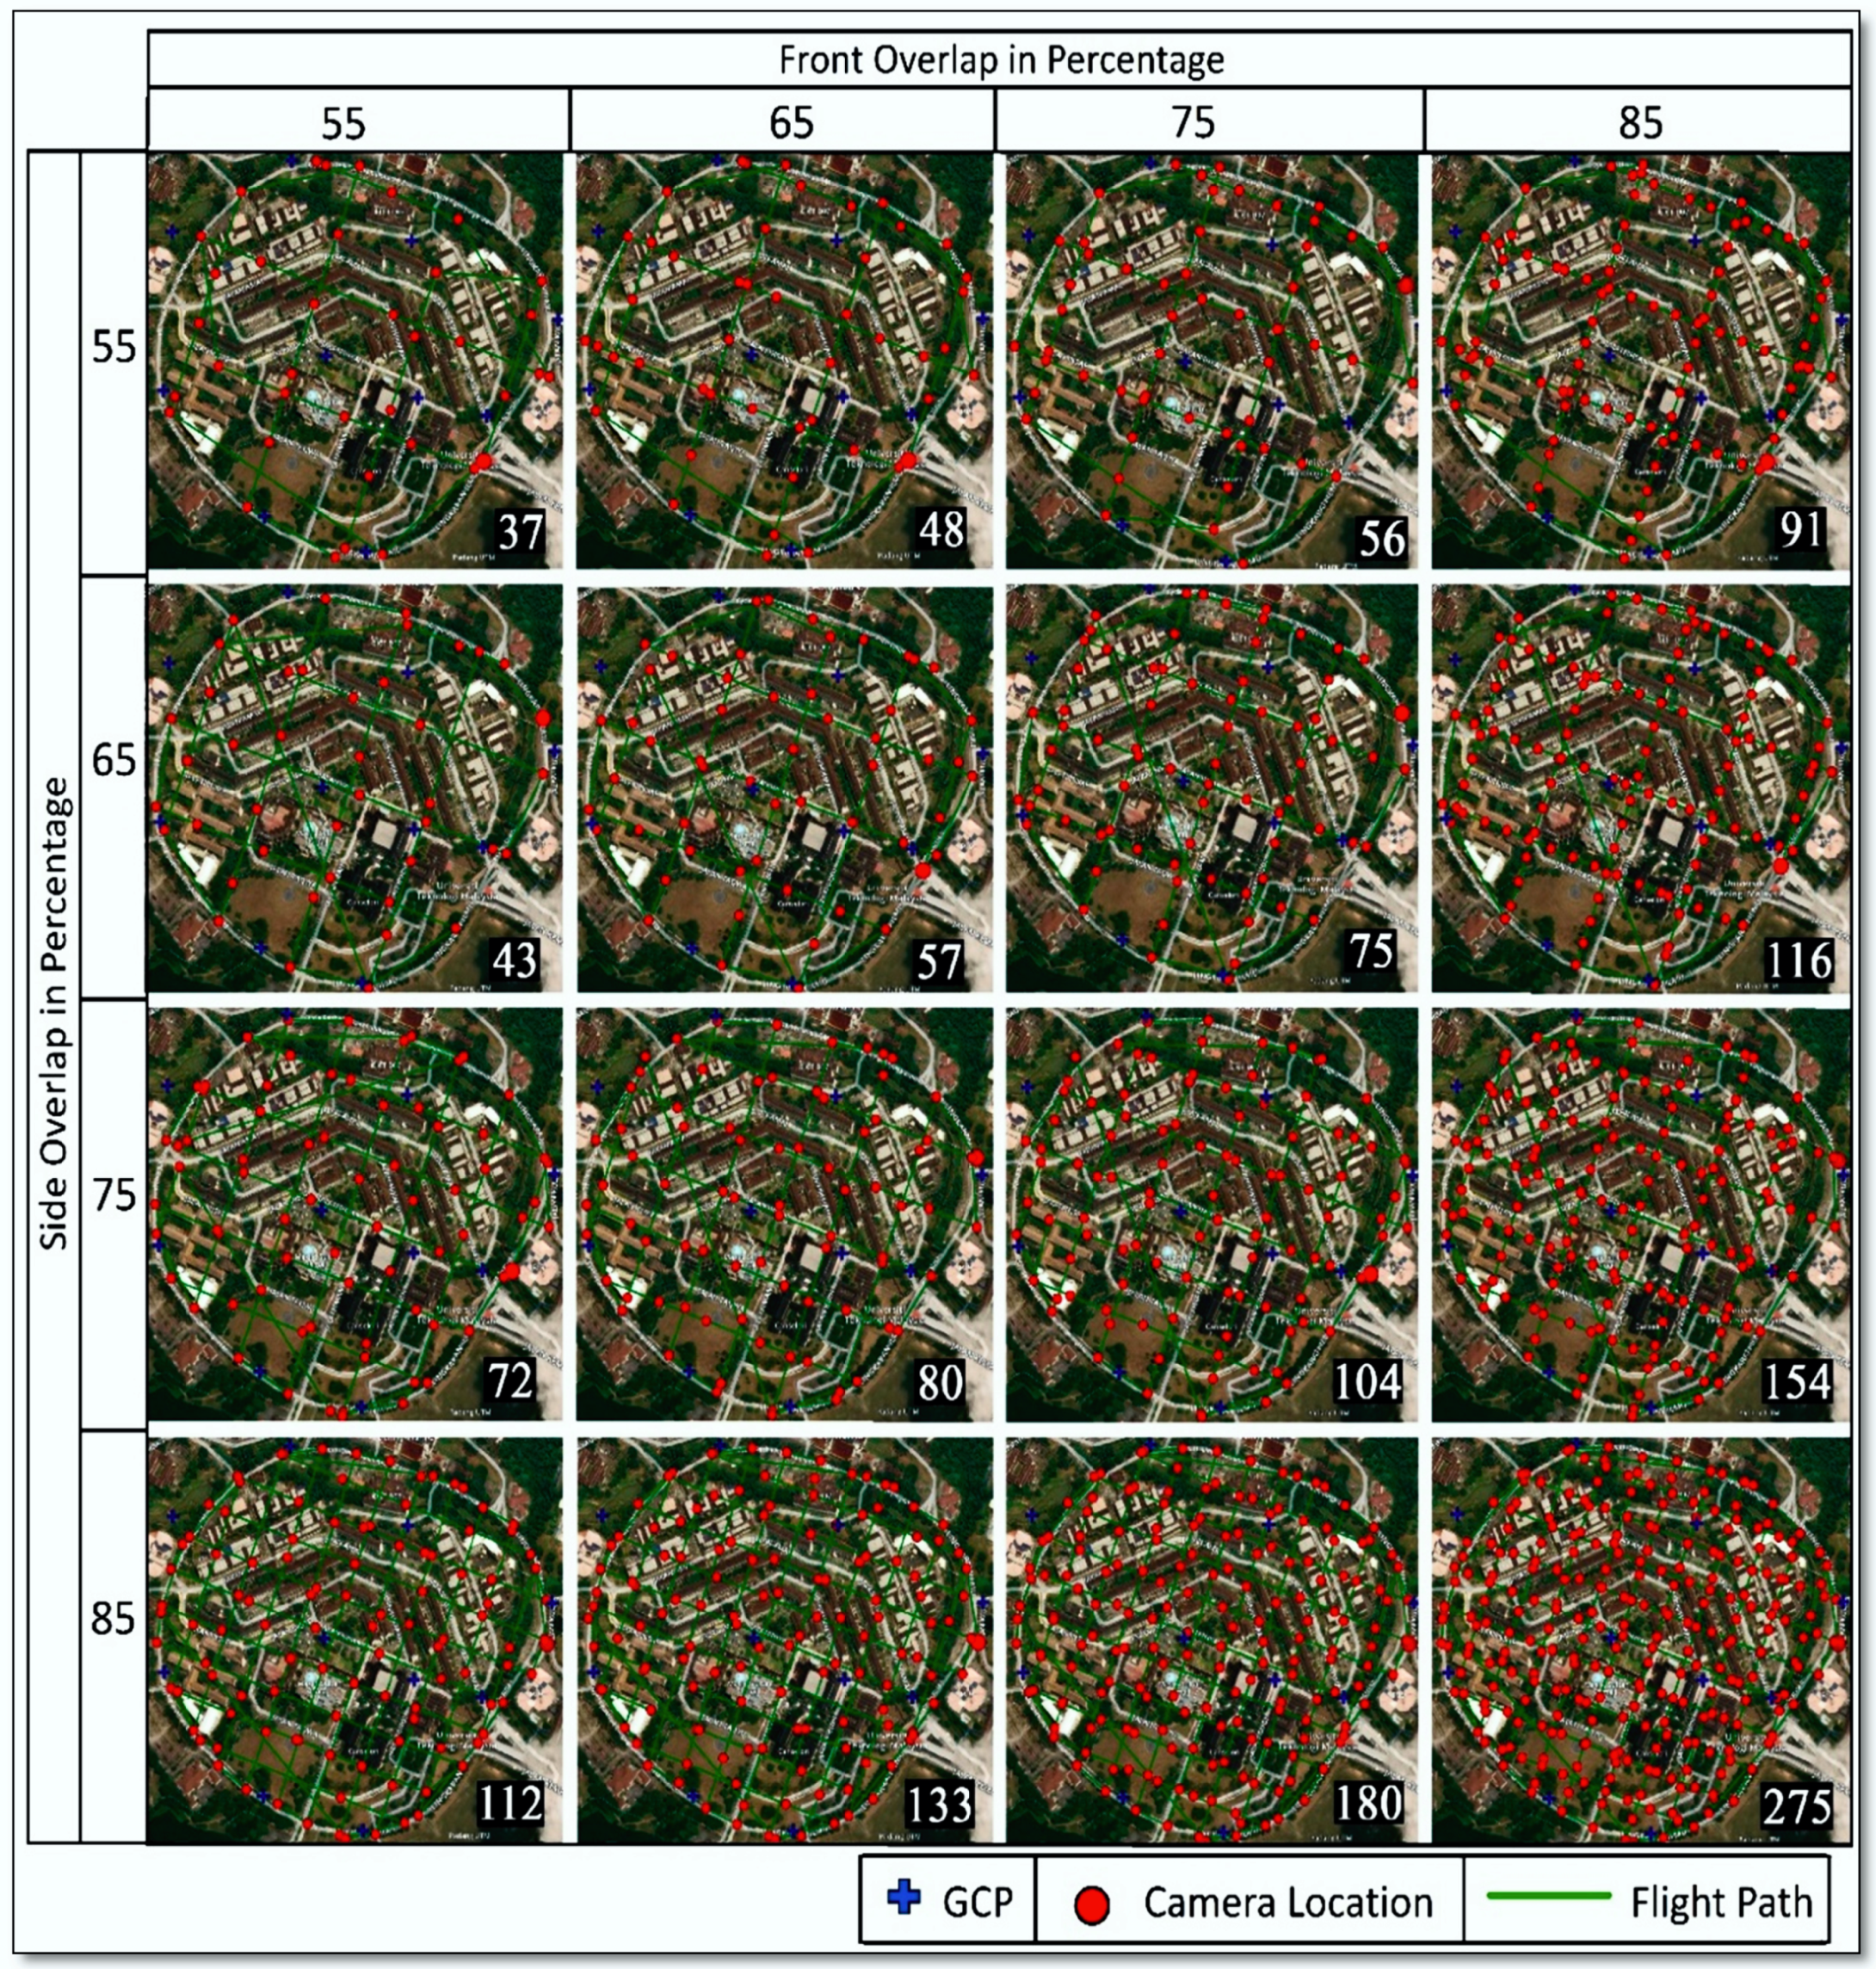
All the flights had perpendicular flight lines with 300 m flight height. Flight height has become an integral part of photogrammetry. Primarily in close-range photogrammetry utilizing UAV, flight altitude turns into a more sensitive issue. Despite its impact on the expected ground sampling distance (GSD) size, lower flight altitude demands a longer acquisition time to complete the entire area. As the most significant limitation for a UAV is its battery life, in most scenarios, a larger area of interest will probably end in multiple flight acquisition. If the image acquisition takes too long, another problem related to the presence of shadow arises. The shadow changes its shape due to the movement of the sun and negatively influences the results [33]. As the tallest structure in study area is 107 m high, a 300 m flight height was planned with two major considerations: firstly, due to the high rise buildings, a low flight height can result in the dead ground effect causing low quality images and secondly, it was preferable to cover the area in single flight as per the battery time of DJI Phantom 4 Advanced. The data acquisition time was in between 10.00 am to 12 noon, to maintain and minimize the effect of solar illumination, shadow, and reflectance effect. The image forward and side overlap percentages had four variations ranging from 55% to 85% resulting in 16 survey projects. Figure 3 shows the flight plans for multiple overlaps demonstrating the changes in the number of flight lines and number of images captured by changing the image overlap parameter. A total number of images captured in 16 surveys varied from a minimum of 37 to a maximum of 275 images (i.e., red dot indicate way point or exposure station) selected for final processing.

3.2. Base Data Acquisition

Apart from the UAV images, base data is also required for photogrammetric processing and accuracy assessment. GCPs and CPs are mainly used for indirect georeferencing and accuracy assessment of UAV data products. Ground control points (GCPs) are artificial targets or natural objects within the scene with a known position that can then be identified and used to orient the final model [4]. For GCPs and CPs, a common practice among geoscientist is to deploy artificial marks in study area before UAV survey and acquire their precise position through fast static GPS technique. The size of these artificial marks is in accordance with ground GSD and it is assured that they are visible in UAV photographs. However, in this study, there was a large variation in the number of photographs of the 16 surveys; therefore, the GCPs and CPs were collected after the UAV survey. The selection of GCPs and CPs was made on the basis of the condition that they mainly consisted of objects recognizable in all photogrammetric projects and well distributed with respect to land cover and terrain variations. Figure 3 also shows the locations of GCPs and CPs (i.e, blue cross) as all of them are well distributed in study area and are mostly on the roads away from tall infrastructure. They mainly consisted of traffic marks on roads, manhole covers, and identifiable points on foot paths. The precise locations of these points were acquired with fast static GPS. Fast static GPS is a technique where the rover receiver and base (reference) station observe location at the same time. The locations of the points are determined after post processing by using Trimble Business Centre software.
For this study, a TOPCON GR5 survey grade receiver was used and the observed data was further processed in Trimble Business Centre by incorporating data from continuously operating reference stations (CORS) available in the University Technology Malaysia (UTM) named the ISKANDAR network. The final point coordinates were produced in Universal Transverse Mercator (UTM) Projection by using World Geodetic System 84 (WGS84) as Datum.

4. Data Processing

Over the past decade, there have been significant developments in photogrammetric techniques based on images from UAV [16]. Digital photogrammetry has well established techniques for generating 3D models of the Earth from 2D overlapping photographs. A number of open source and commercial based software are available for UAV data processing. The main objective of image processing is to create a dense point cloud. In digital photogrammetry, an image-based point cloud is obtained with a structure from motion (SFM) approach. Given a set of images acquired from different observation points, SFM recovers the position and orientation of the camera for each input image and a three-dimensional reconstruction of the scene in form of a sparse point cloud. After this first sparse reconstruction, it is possible to run a dense reconstruction phase using Multi-View Stereo (MVS) [34]. The advantages provided by the SFM algorithm leads to improvements in the quality of terrain products derived from aerial photogrammetry with UAVs [35].
In this research, 16 photogrammetric projects were processed using the Pix4D Mapper software, version 4.5.2, which incorporated the SIFT algorithm in traditional SFM procedure described in [36,37,38,39,40,41,42,43,44]. The Pix4DMapper was the flagship product of the Swiss company Pix4D, now part of the Parrot Group. It is a comprehensive end to end photogrammetry package that can handle photographic inputs from UAV and other camera rigs, video, fisheye, or 360° images as well as spectral images including thermal. Pix4D uses a modified structure-from-motion, or SFM, approach to process UAV imagery. SFM is a photogrammetric technique used to estimate the three-dimensional (3D) structure of objects from multiple two-dimensional (2D) offset image sequences [45]. SFM, using SIFT to match features, can calculate the camera position and its orientation from images only, without prior information of their parameters. The resulting point cloud is suitable for georectification. It has been widely used in the field of photogrammetry for processing UAV images and generating orthomosaics and textured models. It provides a complete photogrammetric workflow and uses multi-core CPU and GPU technique for efficiency acceleration [46].
In Figure 1, photogrammetric workflow which has been used in this research has been elaborated. The first step is feature point matching. The images were calibrated automatically based on Exchangeable Image File Format (EXIF) information for tie point’s generation. EXIF information is a metadata for each picture giving details of on-board GPS measurements used for the initial feature points identification. Image matching is an establishment of the correspondence from a point recorded in two or more images and estimates its corresponding 3D position using collinearity or the projection model. This method typically has two steps: (1) in the image space, depth maps are produced from the stereo or multi-view stereo pair calculation by considering the disparity between image pair, (2) then these depth maps are merged to create a 3D point cloud in object space [47,48]. The calibrated images are indirectly georeferenced using GCPs to generate a dense 3D point cloud. Image georeferencing is the process of assigning spatial information to an image to define its location with respect to a ground coordinate system. Georeferencing is generally the first step of most photogrammetric applications, being a prerequisite for their metric exploitation [49]. Indirect georeferencing provides accurate positioning results in required geodetic datum depending on the accuracy and reference datum of the used GCPs coordinates [50]. A 3D point cloud, in its simplest terms, refers to a point data set in an image space with X, Y, and Z coordinates. With this 3D dense point cloud, a mesh is generated to produce orthomosaic, DSM, DTM, and contour lines. The DSM resolution of all 16 photogrammetric projects ranged between 0.083 and 0.085 m. Thereafter, all DSMs were resampled by using Nearest Neighbor technique to 0.08 m resolution in order to make them compatible for comparative analysis.

5. Analysis

As shown in Figure 1, the photogrammetric projects in this study were compared in four different ways to identify the effect of image overlap percentage and evaluate the general idea that an increase in image overlap percentage results in the enhanced accuracy of the photogrammetric products. The statistical products of different photogrammetric processes are compared.
The first product in SFM workflow are the tie points, so tie points are compared for 16 projects. Tie points refer to image points from different images which correspond to the same ground points [51]. The number of tie points has a significant influence on triangulation process and accuracy of resultant DSM. Table 2 provides median of tie points per calibrated images after georeferencing the data. A detailed analysis of median tie point values shows that there was a logical increase with respect to forward overlap. It means that with a constant side overlap, an increase in forward overlap percentage and in the median value of tie points occurs. However, with a constant forward overlap, an increase in side overlap does not give rise to an increase in the median value of tie points, because of which the maximum number of tie points cannot be found with maximum forward and side overlap. Rather, the maximum median value of tie points is identified with highest forward overlap and lowest side overlap percentage. Moreover, the first and second highest values are found in projects with maximum forward overlap and increasing side overlap. However, this trend cannot be observed with the third and fourth highest values.
In the photogrammetric process, the next step is to produce a dense 3D point cloud on the basis of tie points for DSM generation. This step is computationally the most expensive part in terms of time. Table 2 shows computational time used for 3D point cloud generation, and there is huge variation as compared to the time used for THE DSM generation. Moreover the difference between minimum overlap and maximum overlap projects is 8 hours, 52 min, and 35 s. Table 2 shows the number of 3D points in each photogrammetric project but it does not follow the trend of tie points with respect to forward and side overlap percentage. It observes a logical increase in the number of 3D points with an increase in both forward and side overlap. As a result, the maximum number of 3D points are in the photogrammetric project with the maximum forward and side overlap and a similar trend is observed with other values in order.
As already mentioned, the accuracy of photogrammetric products can be ensured in several ways, thus, the next research workflow is the accuracy assessment of the final output (DSM) through RMSE. Table 2 also provides accuracy measure from Pix4D software generated quality report, since Pix4D has a mean reprojection-error values below 2 pixels across all spatial scales [52]. However, as compared to median of tie points per calibrated image and number of 3D point cloud in Table 2, an entirely different trend is observed in RMSE values as per Pix4D report given in Table 2. As such, the basic idea that increased overlap can enhance accuracy is not witnessed in this report as the minimum RMSE is in 65% side and 55% in forward overlap project. Meanwhile, the maximum is observed in 75% for both forward and side overlap the second highest figure is in 85% for both forward and side overlap. Moreover, no consistent trend can be observed with changes in both forward and side overlap parameters.
To obtain more insight into the effects of change in forward and side overlap percentage, CPs were used to measure the accuracy. A basic method is to analyze the residues of the bundle adjustment (BA) by computing the RMSE of the residues on the GCPs or by using the coordinates measured on the ground independently of the points with which to compare the coordinates measured on the photogrammetric model [53], based on the American Society for Photogrammetry and Remote Sensing (ASPRS) accuracy standards 2014 [39]. UAV technology and computer vision based photogrammetric techniques are relatively new in the mapping and surveying domain.
The evaluations of quality parameters are mainly based on experimental research in specific fields. A number of countries and mapping organizations are currently considering developing rules and regulations for UAV surveying and defining standards for incorporating UAV data in their national databases updating programs. However, in general, no international standards can be observed for large scale 3D surface modelling. The researchers are mainly investigating with respect to specific applications. The American Society for Photogrammetry and Remote Sensing (ASPRS) developed large scale mapping accuracy standards for digital orthophotos and DEM in 2014 and these standards are independent of pixel size, map scale, and contour interval [54].
As a statistical parameter, the RMSE values are described, which are interpreted as a “square root of the average of the set of squared differences between dataset coordinate values and coordinate values from an independent source of higher accuracy for identical points” [26]. In this study, check points based RMSEr (horizontal accuracy) and RMSEz (vertical accuracy) of all 16 photogrammetric projects were calculated and compared with ASPRS accuracy standards as per the following formulas:
R M S E x = ± i ( x d a t a ( i ) x r e f e r e n c e ( i ) ) n 2
where x d a t a ( i ) = Check points observed x through fast static with CORS as base station, x r e f e r e n c e ( i ) = Check points reference x observed directly from each orthomosaic generated by using Pix4D Mapper, and n = Number of check points
R M S E y = ± i ( y d a t a ( i ) y r e f e r e n c e ( i ) ) n 2
where y d a t a ( i ) = Check points observed y through fast static with CORS as base station y r e f e r e n c e ( i ) = Check points reference y observed directly from each orthomosaic generated by using Pix4D Mapper, and n = Number of check points
R M S E r = R M S E x 2 + R M S E y 2
R M S E x 2 = Calculated in Equation (1), R M S E y 2 = Calculated in Equation (2):
R M S E z = ± ( z d a t a ( i ) z r e f e r e n c e ( i ) ) n 2
where z d a t a ( i ) = Check points observed z through fast static with CORS as base station z r e f e r e n c e ( i ) = Check points reference z observed directly from each orthomosaic generated by using Pix4D Mapper, and n = Number of check points
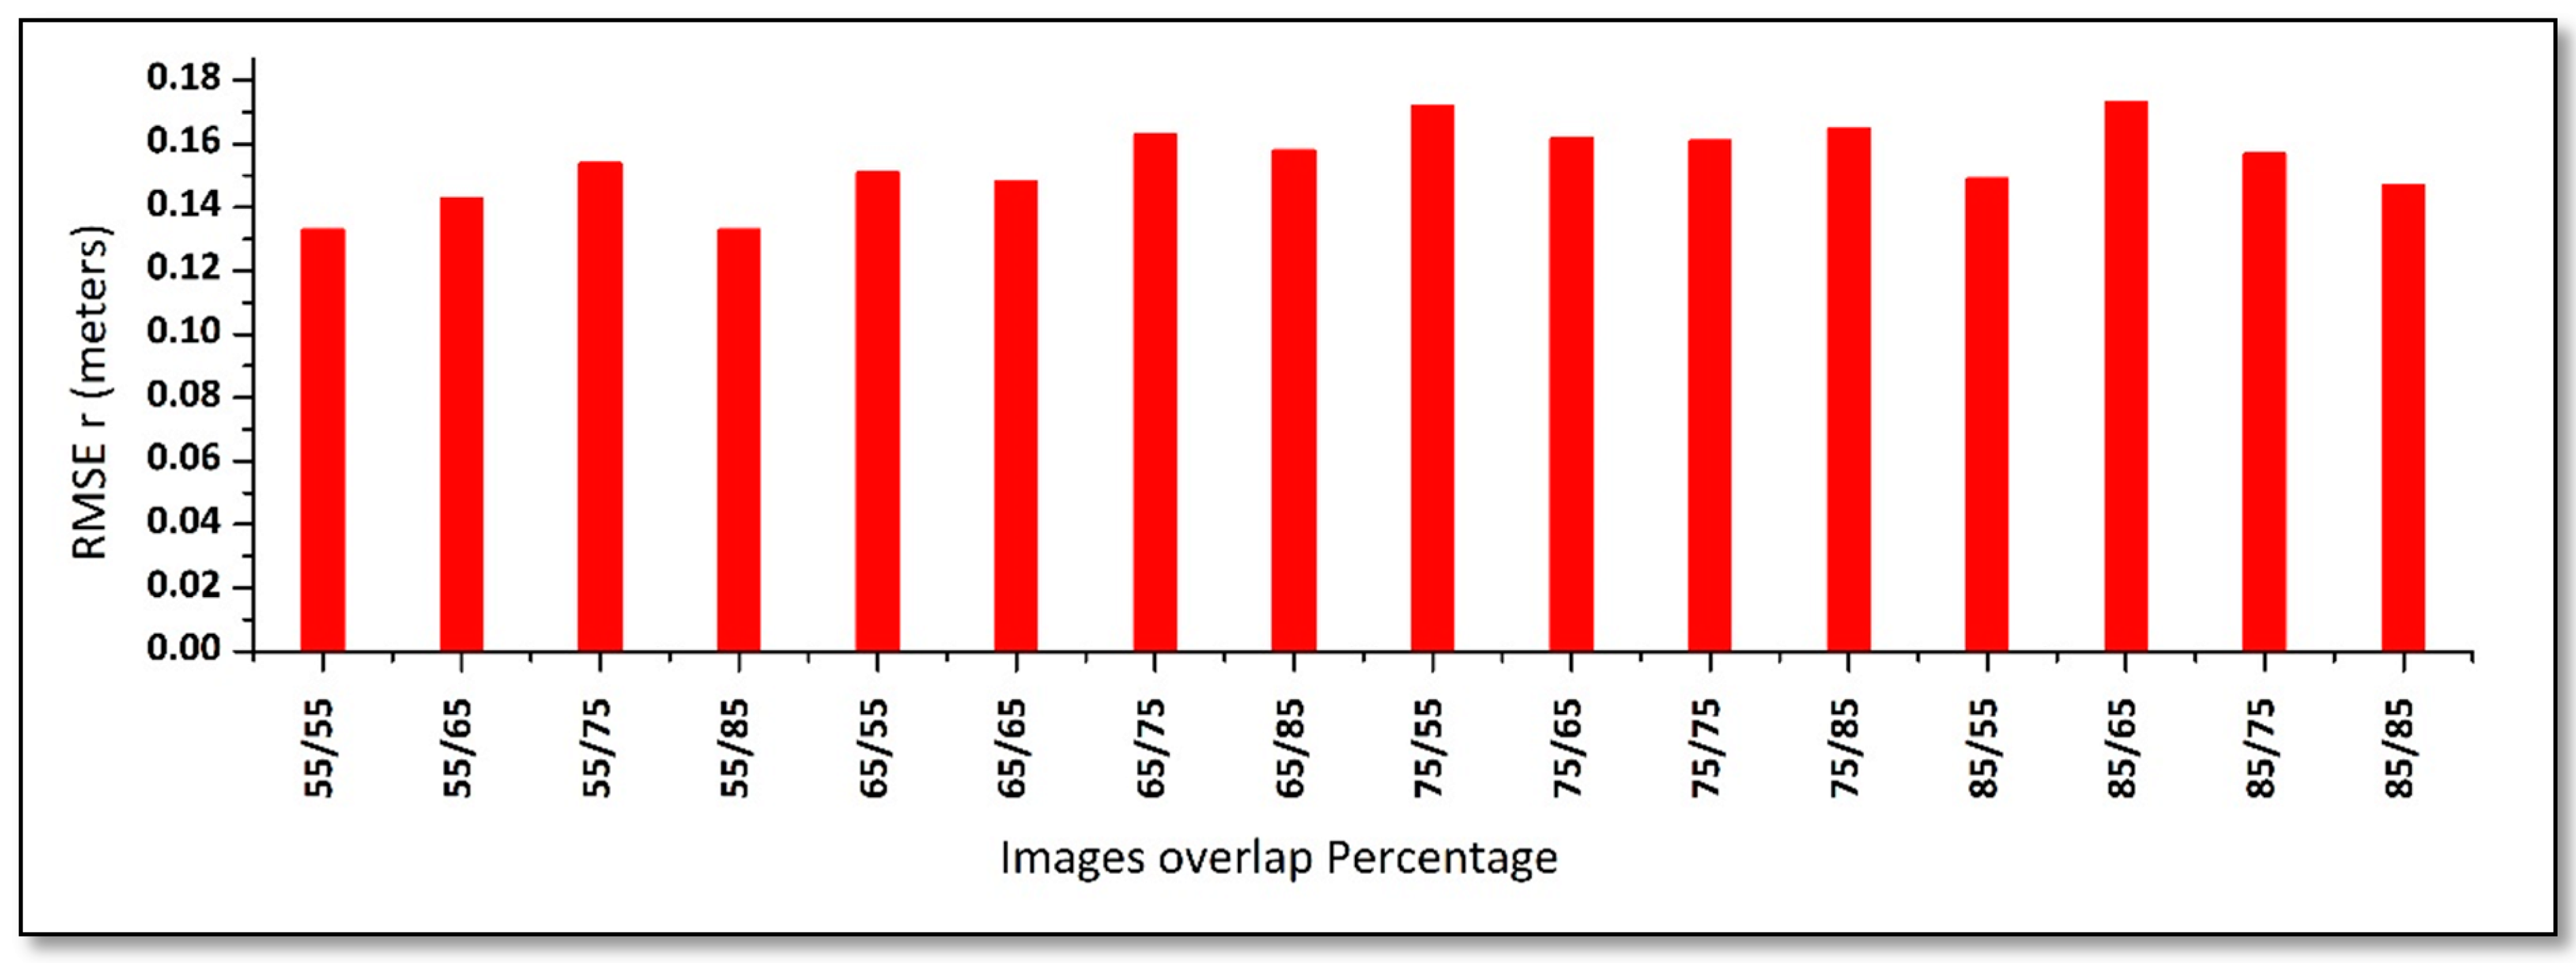
The highest level of accuracy as per ASPRS standards is defined as Class 1 [39]. The results indicated that the horizontal and vertical accuracy of all 16 photogrammetric projects ranged within the Class 1 accuracy measures of ASPRS 2014. As shown in Figure 4, horizontal accuracy (RMSEr) ranged between 0.13 m to 0.17 m. As the major investigations were related to topographic variations, the vertical accuracy was of major concern. Vertical accuracy (RMSEz) shown in Figure 5, had minimum value 0.09 m and a maximum value of 0.32 m, however, the behavior of this data set was not consistent with the increase of forward or side overlap percentages as the maximum RMSEz value was in 85%/85% overlap project and the minimum value was in 75% forward and 85% side overlap project.
Most researchers have investigated UAV photogrammetric products quality for entire data sets by using RMSE measurements. However, some have also investigated the vertical accuracy for small subsets of 3D data of different terrain types. Pipaud et al. [55] investigated the utility of DEMs for delineating different landforms. Liu et al. [56] calculated DEM errors for different landform types and altitude. Hu et al. [57] observed the accuracy of DEMs for plain, hill, and mountainous terrain. Podgórski et al. [58] 2019 assessed the accuracy for different slopes. Kramm and Hoffmeister [59] calculated topographic roughness index for multiple sourced DEMs including UAV generated data.
In this study, a further investigation of data accuracy with respect to large scale topographic variations of four different profiles (A–D) was carried out. Figure 6 shows comparisons in all 16 photogrammetric DSMs.
In general, the first profile A (the building roof top) as shown in Figure 6 shows a better result on left side than on right side. However, still it is bearable as per standards. The only significant line in this graph which has some different behavior is the lowest line which shows data from 55% side and 55% forward overlap but it still shows the correct pattern of building roof top. The second profile Figure 6B shows the dome of the mosque building; the lines in this graph are close to each other, especially for the left side of the dome. However, some of the lines are not uniform or close to one another on right side near the top of the dome, which is due to some noise caused by surface reflection. Perhaps the effect of sunlight caused the reflection of the surface material of the dome. Also, it is clearly seen that all the graphs close to one another towards the bottom of the dome on the right side.
Figure 6C shows the slope area. All the observed lines are close to one another for this type of feature, which indicates that all the forward and side overlap percentages cannot affect the mapping of such feature and can be further used. No significant difference is created by the change in flight overlap for this type of feature. Finally, in the last profile D, shown in Figure 6, one can easily see that the overlap does not affect the result on both left and right side of the stream. The lines are close to one another. Perhaps the reflection on both side of the stream is good same as the slope in Figure 6C. However, as the depth of the stream increases, the lines represent the stream properly and even cross each other. This problem arises perhaps because the SFM model does not work properly for water bodies. In digital photogrammetry, image matching usually fails for homogenous features with uniform tone without a proper pattern or texture.

6. Conclusions and Recommendations

UAV photogrammetry is one of the latest technologies in the mapping industry for the provision of high spatio-temporal resolution terrain data in a digital environment. Its application for surveying small areas is of major interest to researchers in the earth sciences community. With recent developments in modern digital image processing, together with the ever-increasing capability of the personal computer, photogrammetric drawing presents a flexible and accessible survey tool. The quality of UAV DSM is dependent on a number of factors, such as sensor quality, platform properties, flight parameters, and image processing techniques. Flight parameters like flight height, flying speed, flight time, flying path, and image percentage overlap are a tradeoff between DSM quality and photogrammetric project computational cost. However, among all these parameters, images overlap percentage is considered to be the key factor affecting the quality of DSM in terms of image matching, tie point generation, and 3D point cloud. Generally, it is considered that a high image overlap will result in an enhanced quality of DSM, but an increase in overlap percentage a short base line for aerial triangulation and view angle problems may also cause geometric errors. Moreover, a huge increase in number of images because of high overlap requires more disk space and computation time. Table 2 gives an overview of the projects’ computational cost and identifies with reference to Minimum RMSE as per Pix4D report that a better quality DSM is produced with a smaller computation time of 13 m, 41 s by processing only 43 images with 65% side and 55% forward overlap. This study evaluates the tradeoff between the characteristics of image overlap percentage with another important parameter, flight line pattern. The results indicate that the desired results can be achieved through perpendicular flight lines with less percentage overlap. As shown in Table 2, there is a huge time difference in computational cost of photogrammetric projects with minimum and maximum overlap percentage but there is not a challenging difference in the data products.
Flight line pattern is mainly addressed by researchers in the computer vision domain, but it is a missing component amongst researchers in the earth sciences field. A number of researchers have studied image overlap effects for certain applications such as forestry, archeology, and crop monitoring, but mainly they have either not mentioned the type of flight path or surveyed through lawn mower flight path resulting in a smaller number of images. Future research can be based upon a comparative analysis of multiple flight path coverage plans for DSM quality with an emphasis on micro topographic investigations.

Author Contributions

Conceptualization, Muhammad Hamid Chaudhry; Formal analysis, Muhammad Hamid Chaudhry; Funding acquisition, Muhammad Hamid Chaudhry; Methodology, Muhammad Hamid Chaudhry; Supervision, Anuar Ahmad; Writing–original draft, Muhammad Hamid Chaudhry; Writing–review & editing, Anuar Ahmad and Qudsia Gulzar. All authors have read and agreed to the published version of the manuscript.

Funding

This research received no external funding.

Acknowledgments

First of all we acknowledge the permission given by Department of Surveying and Mapping Malaysia (DSMM) and Civil Aviation Authority Malaysia (CAAM) to perform UAV based surveys in UTM Malaysia, Johor Campus. This research cannot possible without the support of Associate Professor Tajul Ariffin, Head of Geomatic Innovation Research Group, Faculty of Built Environment and Surveying, UTM, especially his student Muhammad Farid Bin Mohd Yazair who helped a lot for the GCP establishment and final processing, this work also may not possible without the support provided by Khairunnizam bin Md Ribut from Photogrammetry and Remote Sensing Lab, FBES, UTM, for software support.

Conflicts of Interest

The authors declare no conflict of interest.

References

  1. Bandara, K.R.M.U.; Samarakoon, L.; Shrestha, R.P.; Kamiya, Y. Automated Generation of Digital Terrain Model using Point Clouds of Digital Surface Model in Forest Area. Remote Sens. 2011, 3, 845–858. [Google Scholar] [CrossRef] [Green Version]
  2. El Garouani, A.; Alobeid, A.; El Garouani, S. Digital surface model based on aerial image stereo pairs for 3D building. Int. J. Sustain. Built Environ. 2014, 3, 119–126. [Google Scholar] [CrossRef] [Green Version]
  3. Han, Y.; Qin, R.; Huang, X. Assessment of dense image matchers for digital surface model generation using airborne and spaceborne images—An update. Photogramm. Rec. 2020, 35, 58–80. [Google Scholar] [CrossRef]
  4. Fleming, Z.; Pavlis, T. An orientation based correction method for SfM-MVS point clouds—Implications for field geology. J. Struct. Geol. 2018, 113, 76–89. [Google Scholar] [CrossRef]
  5. Uysal, M.; Toprak, A.S.; Polat, N. DEM generation with UAV Photogrammetry and accuracy analysis in Sahitler hill. Measurement 2015, 73, 539–543. [Google Scholar] [CrossRef]
  6. Varlik, A.; Selvi, H.; Kalayci, I.; Karauğuz, G.; Öğütcü, S. Investigation of the compatibility of fasillar and eflatunpinar hittite monuments with close-range photogrammetric technique. Mediterr. Archaeol. Archaeom. 2016, 16, 249–256. [Google Scholar]
  7. Tavani, S.; Granado, P.; Corradetti, A.; Girundo, M.; Iannace, A.; Arbués, P.; Muñoz, J.A.; Mazzoli, S. Building a virtual outcrop, extracting geological information from it, and sharing the results in Google Earth via OpenPlot and Photoscan: An example from the Khaviz Anticline (Iran). Comput. Geosci. 2014, 63, 44–53. [Google Scholar] [CrossRef]
  8. Redweik, P. Photogrammetry. In Sciences of Geodesy; Xu, G., Ed.; Springer: Berlin/Heidelberg, Germany, 2013. [Google Scholar] [CrossRef]
  9. Mathews, A.; Jensen, J. Visualizing and Quantifying Vineyard Canopy LAI Using an Unmanned Aerial Vehicle (UAV) Collected High Density Structure from Motion Point Cloud. Remote Sens. 2013, 5, 2164–2183. [Google Scholar] [CrossRef] [Green Version]
  10. Agudo, P.; Pajas, J.; Pérez-Cabello, F.; Redón, J.; Lebrón, B. The Potential of Drones and Sensors to Enhance Detection of Archaeological Cropmarks: A Comparative Study Between Multi-Spectral and Thermal Imagery. Drones 2018, 2, 29. [Google Scholar] [CrossRef] [Green Version]
  11. Polat, N.; Uysal, M. An Experimental Analysis of Digital Elevation Models Generated with Lidar Data and UAV Photogrammetry. J. Indian Soc. Remote Sens. 2018, 46, 1135–1142. [Google Scholar] [CrossRef]
  12. Xia, G.-S.; Bai, X.; Ding, J.; Zhu, Z.; Belongie, S.; Luo, J.; Datcu, M.; Pelillo, M.; Zhang, L. DOTA: A Large-scale Dataset for Object Detection in Aerial Images. In Proceedings of the IEEE Conference on Computer Vision and Pattern Recognition (CVPR), Salt Lake City, UT, USA, 18–22 June 2018; pp. 3974–3983. [Google Scholar]
  13. Laliberte, A. Unmanned aerial vehicle-based remote sensing for rangeland assessment, monitoring, and management. J. Appl. Remote Sens. 2009, 3. [Google Scholar] [CrossRef]
  14. Anderson, K.; Gaston, K.J. Lightweight unmanned aerial vehicles will revolutionize spatial ecology. Front. Ecol. Environ. 2013, 11, 138–146. [Google Scholar] [CrossRef] [Green Version]
  15. Agüera-Vega, F.; Carvajal-Ramírez, F.; Martínez-Carricondo, P.; Sánchez-Hermosilla López, J.; Mesas-Carrascosa, F.J.; García-Ferrer, A.; Pérez-Porras, F.J. Reconstruction of extreme topography from UAV structure from motion photogrammetry. Measurement 2018, 121, 127–138. [Google Scholar] [CrossRef]
  16. Zeybek, M.; Şanlıoğlu, İ. Point cloud filtering on UAV based point cloud. Measurement 2019, 133, 99–111. [Google Scholar] [CrossRef]
  17. Casella, V.; Chiabrando, F.; Franzini, M.; Manzino, A.M. Accuracy Assessment of a UAV Block by Different Software Packages, Processing Schemes and Validation Strategies. ISPRS Int. J. Geo-Inf. 2020, 9, 164. [Google Scholar] [CrossRef] [Green Version]
  18. Rupnik, E.; Nex, F.; Toschi, I.; Remondino, F. Aerial multi-camera systems: Accuracy and block triangulation issues. ISPRS J. Photogramm. Remote Sens. 2015, 101, 233–246. [Google Scholar] [CrossRef]
  19. Xing, C.; Huang, J. An improved mosaic method based on SIFT algorithm for UAV sequence images. In Proceedings of the 2010 International Conference on Computer Design and Applications, Qinhuangdao, China, 25–27 June 2010; pp. V1-414–V1-417. [Google Scholar]
  20. Dandois, J.P.; Olano, M.; Ellis, E.C. Optimal Altitude, Overlap, and Weather Conditions for Computer Vision UAV Estimates of Forest Structure. Remote Sens. 2015, 7, 13895–13920. [Google Scholar] [CrossRef] [Green Version]
  21. Mesas-Carrascosa, F.J.; Notario Garcia, M.D.; Merono de Larriva, J.E.; Garcia-Ferrer, A. An Analysis of the Influence of Flight Parameters in the Generation of Unmanned Aerial Vehicle (UAV) Orthomosaicks to Survey Archaeological Areas. Sensors 2016, 16, 1838. [Google Scholar] [CrossRef] [Green Version]
  22. Mesas-Carrascosa, F.J.; Clavero Rumbao, I.; Torres-Sánchez, J.; García-Ferrer, A.; Peña, J.; López Granados, F. Accurate ortho-mosaicked six-band multispectral UAV images as affected by mission planning for precision agriculture proposes. Int. J. Remote Sens. 2017, 38, 2161–2176. [Google Scholar] [CrossRef]
  23. Frey, J.; Kovach, K.; Stemmler, S.; Koch, B. UAV Photogrammetry of Forests as a Vulnerable Process. A Sensitivity Analysis for a Structure from Motion RGB-Image Pipeline. Remote Sens. 2018, 10, 912. [Google Scholar] [CrossRef] [Green Version]
  24. Domingo, D.; Ørka, H.O.; Næsset, E.; Kachamba, D.; Gobakken, T. Effects of UAV Image Resolution, Camera Type, and Image Overlap on Accuracy of Biomass Predictions in a Tropical Woodland. Remote Sens. 2019, 11, 948. [Google Scholar] [CrossRef] [Green Version]
  25. Seifert, E.; Seifert, S.; Vogt, H.; Drew, D.; van Aardt, J.; Kunneke, A.; Seifert, T. Influence of Drone Altitude, Image Overlap, and Optical Sensor Resolution on Multi-View Reconstruction of Forest Images. Remote Sens. 2019, 11, 1252. [Google Scholar] [CrossRef] [Green Version]
  26. Gabara, G.; Sawicki, P. Multi-Variant Accuracy Evaluation of UAV Imaging. Surveys: A Case Study on Investment Area. Sensors 2019, 19, 5229. [Google Scholar] [CrossRef] [PubMed] [Green Version]
  27. Chaudhry, M.H.; Ahmad, A.; Gulzar, Q. A comparative study of modern UAV platform for topographic mapping. IOP Conf. Ser. Earth Environ. Sci. 2020, 540. [Google Scholar] [CrossRef]
  28. Cabreira, T.; Brisolara, L.; Ferreira Jr, P.R. Survey on Coverage Path Planning with Unmanned Aerial Vehicles. Drones 2019, 3, 4. [Google Scholar] [CrossRef] [Green Version]
  29. Najad, P.G.; Ahmad, A.; Zen, I.S. Approach to Environmental Sustainability and Green Campus at Universiti Teknologi Malaysia: A Review. Environ. Ecol. Res. 2018, 6, 203–209. [Google Scholar] [CrossRef]
  30. Otto, A.; Agatz, N.; Campbell, J.; Golden, B.; Pesch, E. Optimization approaches for civil applications of unmanned aerial vehicles (UAVs) or aerial drones: A survey. Networks 2018, 72, 411–458. [Google Scholar] [CrossRef]
  31. Besada, J.A.; Bergesio, L.; Campana, I.; Vaquero-Melchor, D.; Lopez-Araquistain, J.; Bernardos, A.M.; Casar, J.R. Drone Mission Definition and Implementation for Automated Infrastructure Inspection Using Airborne Sensors. Sensors 2018, 18, 1170. [Google Scholar] [CrossRef] [PubMed] [Green Version]
  32. Hinge, L.; Gundorph, J.; Ujang, U.; Azri, S.; Anton, F.; Abdul Rahman, A. Comparative Analysis of 3d Photogrammetry Modeling Software Packages for Drones Survey. ISPRS Int. Arch. Photogramm. Remote Sens. Spat. Inf. Sci. 2019, XLII-4/W12, 95–100. [Google Scholar] [CrossRef] [Green Version]
  33. Rock, G.; Ries, J.; Udelhoven, T. Sensitivity analysis of UAV-photogrammetry for creating digital elevation models (DEM). In Proceedings of the Conference on Unmanned Aerial Vehicle in Geomatics, Zurich, Switzerland, 14–16 September 2011. [Google Scholar]
  34. Bianco, S.; Ciocca, G.; Marelli, D. Evaluating the Performance of Structure from Motion Pipelines. J. Imaging 2018, 4, 98. [Google Scholar] [CrossRef] [Green Version]
  35. Ruiz, J.J.; Diaz-Mas, L.; Perez, F.; Viguria, A. Evaluating the accuracy of dem generation algorithms from UAV imagery. Int. Arch. Photogramm. Remote Sens. Spatial Inf. Sci. 2013, XL-1/W2, 333–337. [Google Scholar] [CrossRef]
  36. Verhoeven, G. Taking computer vision aloft—Archaeological three-dimensional reconstructions from aerial photographs with photoscan. Archaeol. Prospect. 2011, 18, 67–73. [Google Scholar] [CrossRef]
  37. Lowe, G. SIFT—The scale invariant feature transform. Int. J. 2004, 2, 91–110. [Google Scholar]
  38. Fonstad, M.A.; Dietrich, J.T.; Courville, B.C.; Jensen, J.L.; Carbonneau, P.E. Topographic structure from motion: A new development in photogrammetric measurement. Earth Surf. Process. Landf. 2013, 38, 421–430. [Google Scholar] [CrossRef] [Green Version]
  39. Whitehead, K.; Hugenholtz, C.H. Applying ASPRS Accuracy Standards to Surveys from Small Unmanned Aircraft Systems (UAS). Photogramm. Eng. Remote Sens. 2015, 81, 787–793. [Google Scholar] [CrossRef]
  40. Girod, L.; Nuth, C.; Kääb, A.; Etzelmüller, B.; Kohler, J. Terrain changes from images acquired on opportunistic flights by SfM photogrammetry. Cryosphere 2017, 11, 827–840. [Google Scholar] [CrossRef] [Green Version]
  41. Nagarajan, S.; Khamaru, S.; De Witt, P. UAS based 3D shoreline change detection of Jupiter Inlet Lighthouse ONA after Hurricane Irma. Int. J. Remote Sens. 2019, 40, 9140–9158. [Google Scholar] [CrossRef]
  42. Koci, J.; Jarihani, B.; Leon, J.X.; Sidle, R.; Wilkinson, S.; Bartley, R. Assessment of UAV and Ground-Based Structure from Motion with Multi-View Stereo Photogrammetry in a Gullied Savanna Catchment. ISPRS Int. J. Geo-Inf. 2017, 6, 328. [Google Scholar] [CrossRef] [Green Version]
  43. Chiabrando, F.; Sammartano, G.; Spanò, A.; Spreafico, A. Hybrid 3D Models: When Geomatics Innovations Meet Extensive Built Heritage Complexes. ISPRS Int. J. Geo-Inf. 2019, 8, 124. [Google Scholar] [CrossRef] [Green Version]
  44. Salach, A.; Bakuła, K.; Pilarska, M.; Ostrowski, W.; Górski, K.; Kurczyński, Z. Accuracy Assessment of Point Clouds from LiDAR and Dense Image Matching Acquired Using the UAV Platform for DTM Creation. ISPRS Int. J. Geo-Inf. 2018, 7. [Google Scholar] [CrossRef] [Green Version]
  45. Pricope, N.G.; Mapes, K.L.; Woodward, K.D.; Olsen, S.F.; Baxley, J.B. Multi-Sensor Assessment of the Effects of Varying Processing Parameters on UAS Product Accuracy and Quality. Drones 2019, 3, 63. [Google Scholar] [CrossRef] [Green Version]
  46. Jiang, S.; Jiang, C.; Jiang, W. Efficient structure from motion for large-scale UAV images: A review and a comparison of SfM tools. ISPRS J. Photogramm. Remote Sens. 2020, 167, 230–251. [Google Scholar] [CrossRef]
  47. Li, J.; Li, E.; Chen, Y.; Xu, L.; Zhang, Y. Bundled depth-map merging for multi-view stereo. In Proceedings of the 2010 IEEE Computer Society Conference on Computer Vision and Pattern Recognition, San Fransisco, CA, USA, 13–18 June 2010; pp. 2769–2776. [Google Scholar]
  48. Remondino, F.; Spera, M.G.; Nocerino, E.; Menna, F.; Nex, F.; Gonizzi-Barsanti, S. Dense image matching: Comparisons and analyses. In Proceedings of the 2013 Digital Heritage International Congress (DigitalHeritage), Marseille, France, 28 October–1 November 2013; pp. 47–54. [Google Scholar]
  49. Verykokou, S.; Ioannidis, C. A Photogrammetry-Based Structure from Motion Algorithm Using Robust Iterative Bundle Adjustment Techniques. ISPRS Ann. Photogramm. Remote Sens. Spat. Inf. Sci. 2018, IV-4/W6, 73–80. [Google Scholar] [CrossRef] [Green Version]
  50. Erol, S.; Özögel, E.; Kuçak, R.A.; Erol, B. Utilizing Airborne LiDAR and UAV Photogrammetry Techniques in Local Geoid Model Determination and Validation. ISPRS Int. J. Geo-Inf. 2020, 9, 528. [Google Scholar] [CrossRef]
  51. Shin, J.-I.; Cho, Y.-M.; Lim, P.-C.; Lee, H.-M.; Ahn, H.-Y.; Park, C.-W.; Kim, T. Relative Radiometric Calibration Using Tie Points and Optimal Path Selection for UAV Images. Remote Sens. 2020, 12, 1726. [Google Scholar] [CrossRef]
  52. Burns, J.H.R.; Delparte, D. Comparison of Commercial Structure-from-Motion Photogrammety Software Used for Underwater Three-Dimensional Modeling of Coral Reef Environments. ISPRS Int. Arch. Photogramm. Remote Sens. Spat. Inf. Sci. 2017, XLII-2/W3, 127–131. [Google Scholar] [CrossRef] [Green Version]
  53. Sanz-Ablanedo, E.; Chandler, J.; Rodríguez-Pérez, J.; Ordóñez, C. Accuracy of Unmanned Aerial Vehicle (UAV) and SfM Photogrammetry Survey as a Function of the Number and Location of Ground Control Points Used. Remote Sens. 2018, 10, 1606. [Google Scholar] [CrossRef] [Green Version]
  54. Abdullah, Q.; Maune, D.; Smith, D.; KarlHeidemann, H. New Standard for New Era: Overview of the 2015 ASPRS Positional Accuracy Standards for Digital Geospatial Data. Photogramm. Eng. Remote Sens. 2015, 81, 173–176. [Google Scholar] [CrossRef]
  55. Pipaud, I.; Loibl, D.; Lehmkuhl, F. Evaluation of TanDEM-X elevation data for geomorphological mapping and interpretation in high mountain environments—A case study from SE Tibet, China. Geomorphology 2015, 246, 232–254. [Google Scholar] [CrossRef]
  56. Liu, K.; Song, C.; Ke, L.; Jiang, L.; Pan, Y.; Ma, R. Global open-access DEM performances in Earth’s most rugged region High Mountain Asia: A multi-level assessment. Geomorphology 2019, 338, 16–26. [Google Scholar] [CrossRef]
  57. Hu, Z.; Peng, J.; Hou, Y.; Shan, J. Evaluation of Recently Released Open Global Digital Elevation Models of Hubei, China. Remote Sens. 2017, 9, 262. [Google Scholar] [CrossRef] [Green Version]
  58. Podgórski, J.; Kinnard, C.; Pętlicki, M.; Urrutia, R. Performance Assessment of TanDEM-X DEM for Mountain Glacier Elevation Change Detection. Remote Sens. 2019, 11, 187. [Google Scholar] [CrossRef] [Green Version]
  59. Kramm, T.; Hoffmeister, D. A Relief Dependent Evaluation of Digital Elevation Models on Different Scales for Northern Chile. ISPRS Int. J. Geo-Inf. 2019, 8, 430. [Google Scholar] [CrossRef] [Green Version]
Figure 1. Workflow diagram.
Ijgi 09 00656 g001
Figure 2. Study Area.
Ijgi 09 00656 g002
Figure 3. Flight plan and number of images.
Ijgi 09 00656 g003
Figure 4. RMSEr for Digital Surface Model (DSM) accuracy assessment.
Ijgi 09 00656 g004
Figure 5. RMSEz for DSM accuracy assessment.
Ijgi 09 00656 g005
Figure 6. Profile graph for large scale topographic investigations, (A) Building roof top typical of the Tropical region, (B) Dome, (C) Slope, (D) Stream.
Ijgi 09 00656 g006
Table 1. Flight parameters.
Flight ParametersSpecifications
Flight Height300 m
Flight Speed15 m/s
Flight modeAutonomous
Camera20MP
Focal Length24 mm equivalent
GSD8.36–8.45
Aspect Ratio4:3 (4864 × 3648)
UAV survey time10.00 am–12 noon
Image Format.jpg
Table 2. Comparative statistics of Unmanned Aerial Vehicle (UAV) Photogrammetric products.
Flight Overlap PercentageNo. of Photos UsedMedian of Tie Points per Calibrated ImageNo. of 3D Point CloudTime
(3D Point Cloud Generation)
Time
(DSM Generation)
RMSE (m) as per Pix4D
SideForward
55553782475,919,92511 m:48 s11m:58s0.124
55654811,1267,332,41622 m:13 s13m:29s0.119
55755613,6947,437,67522 m:22s13m:33s0.086
55859119,67210,832,27201 h:21 m:05 s25m:11s0.135
65554310,1476,346,40220 m:45 s13m:41s0.081
65655711,8957,895,43326 m:51 s14m:40s0.106
65757515,4319,340,52637 m:38 s29m:16s0.099
658511618,14212,523,80201 h:20 m:26 s24m:21s0.126
75557212,2619,136,79443 m:50 s16m:57s0.132
75658013,6709,668,80301 h:08 m:40 s34m:22s0.128
757510414,50211,216,78152 m:45 s22m:45s0.161
758515417,55214,643,38701 h:45 m:12 s31m:23s0.144
855511213,71812,339,13801 h:00 m:45 s23m:23s0.096
856513313,83713,606,58001 h:11 m:53 s22m:39s0.147
857518016,58616,187,01603 h:14 m:01 s26m:01s0.133
858527517,83124,256,44209 h:04 m:23 s51m:23s0.157
Publisher’s Note: MDPI stays neutral with regard to jurisdictional claims in published maps and institutional affiliations.