Evolution and Optimization of Urban Network Spatial Structure: A Case Study of Financial Enterprise Network in Yangtze River Delta, China


Abstract
1. Introduction
2. Research Background
3. Data and Methods
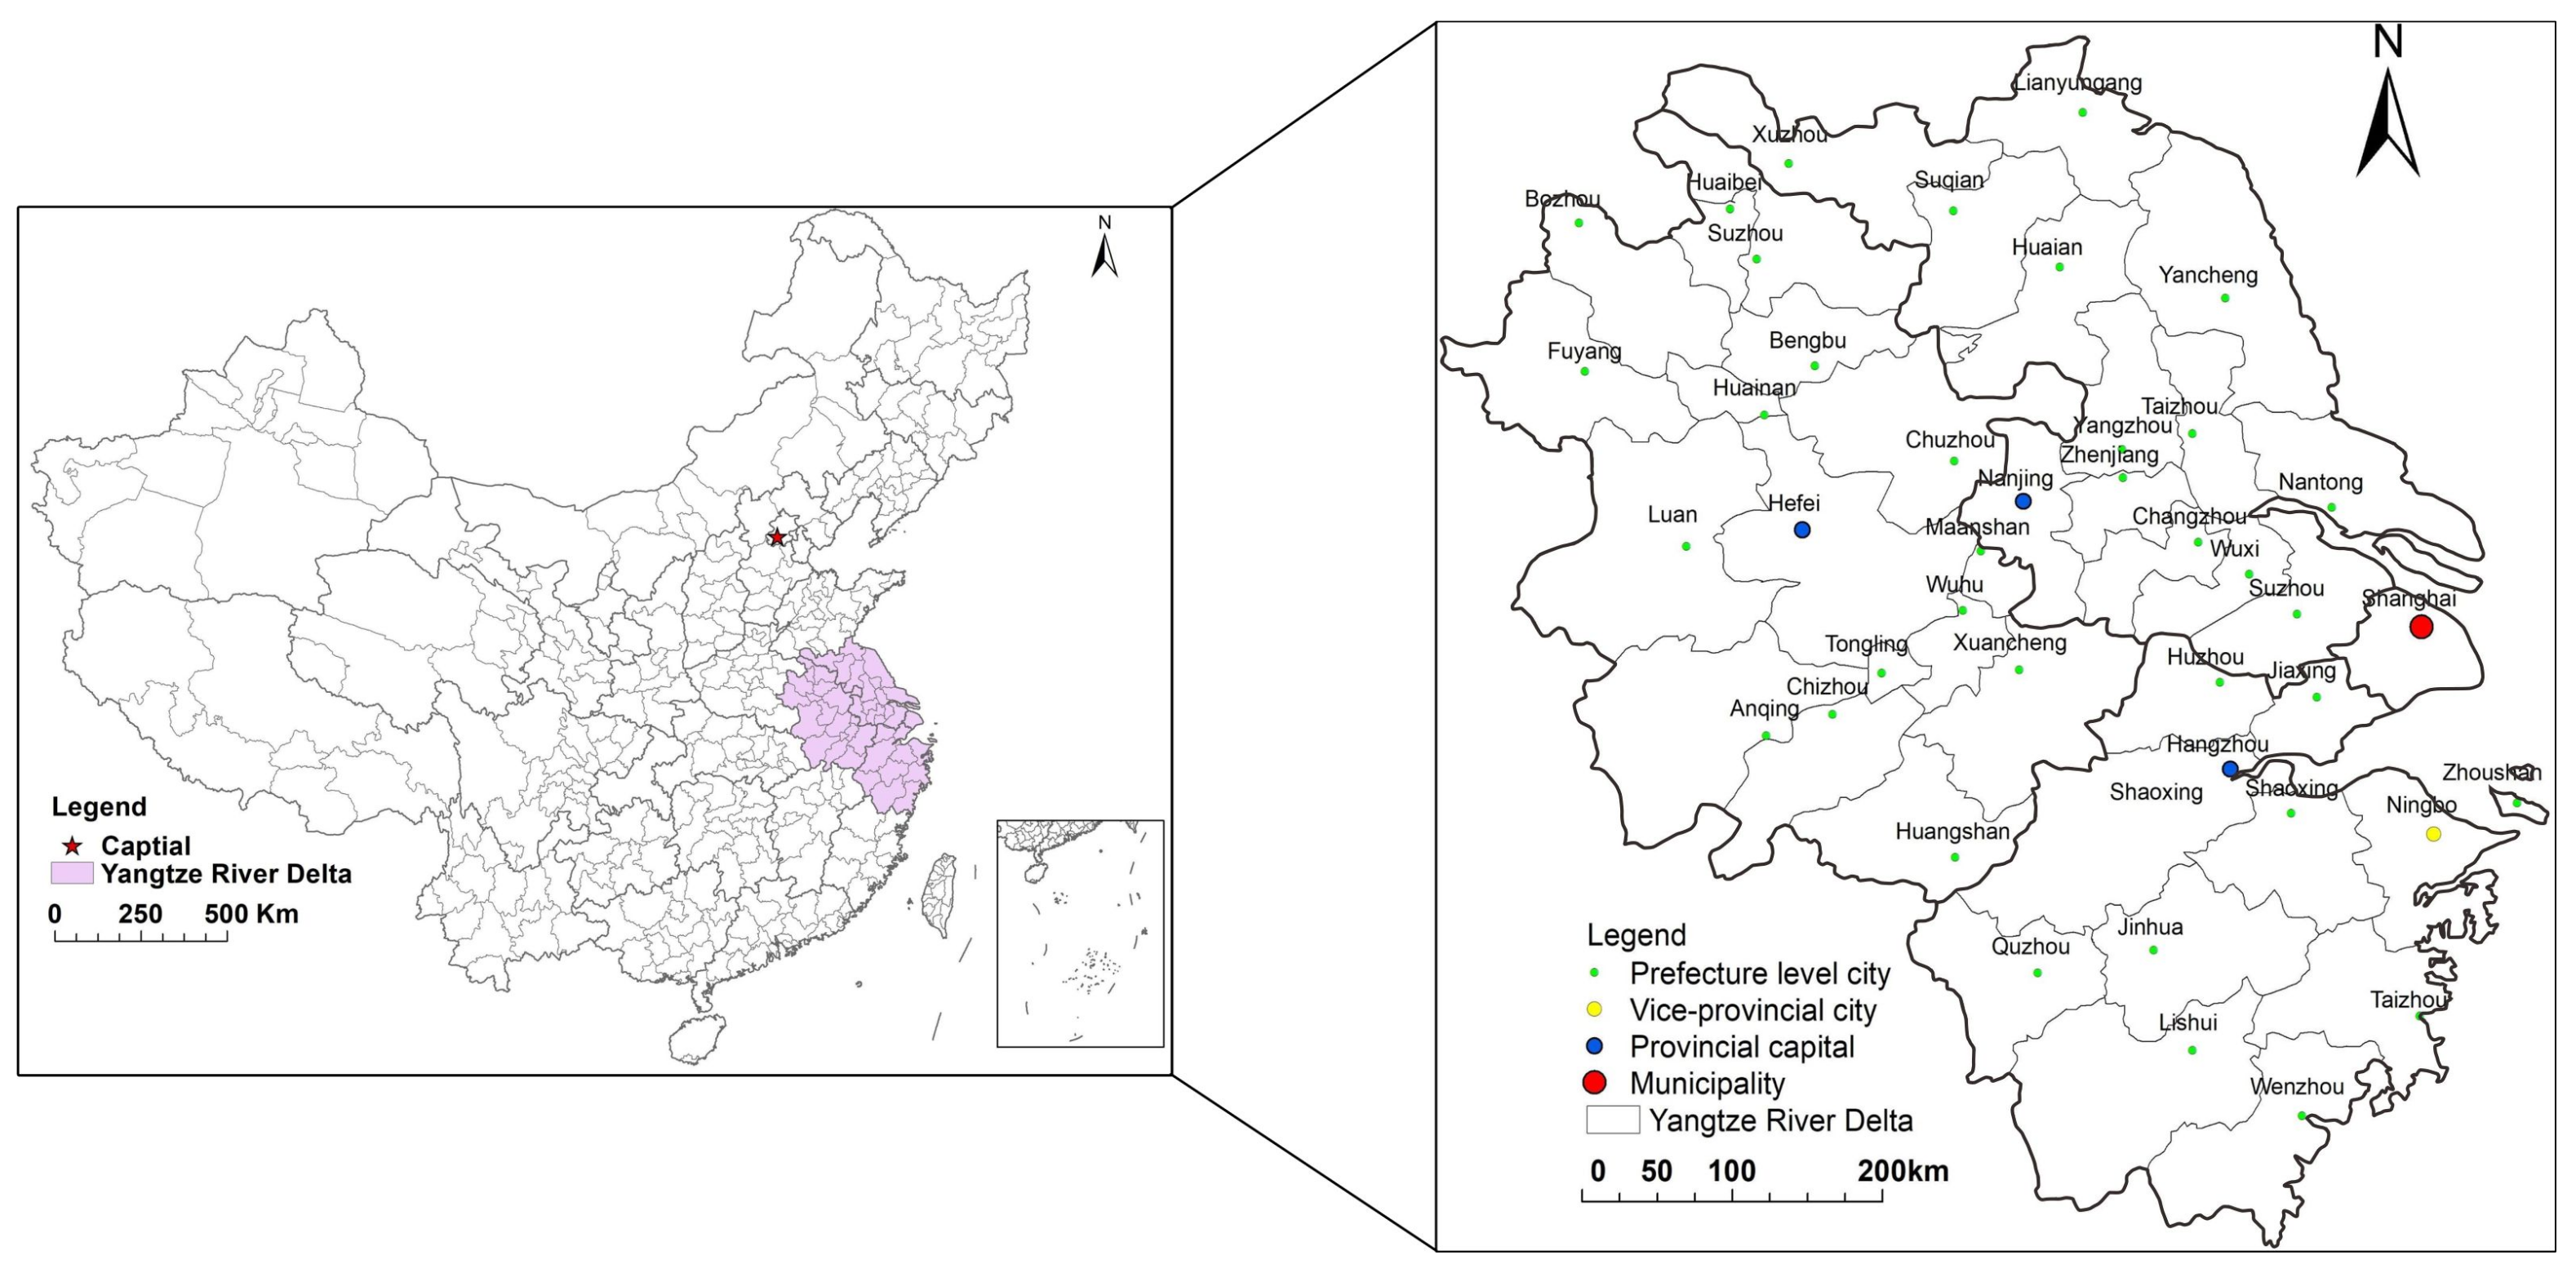
3.1. Study Area
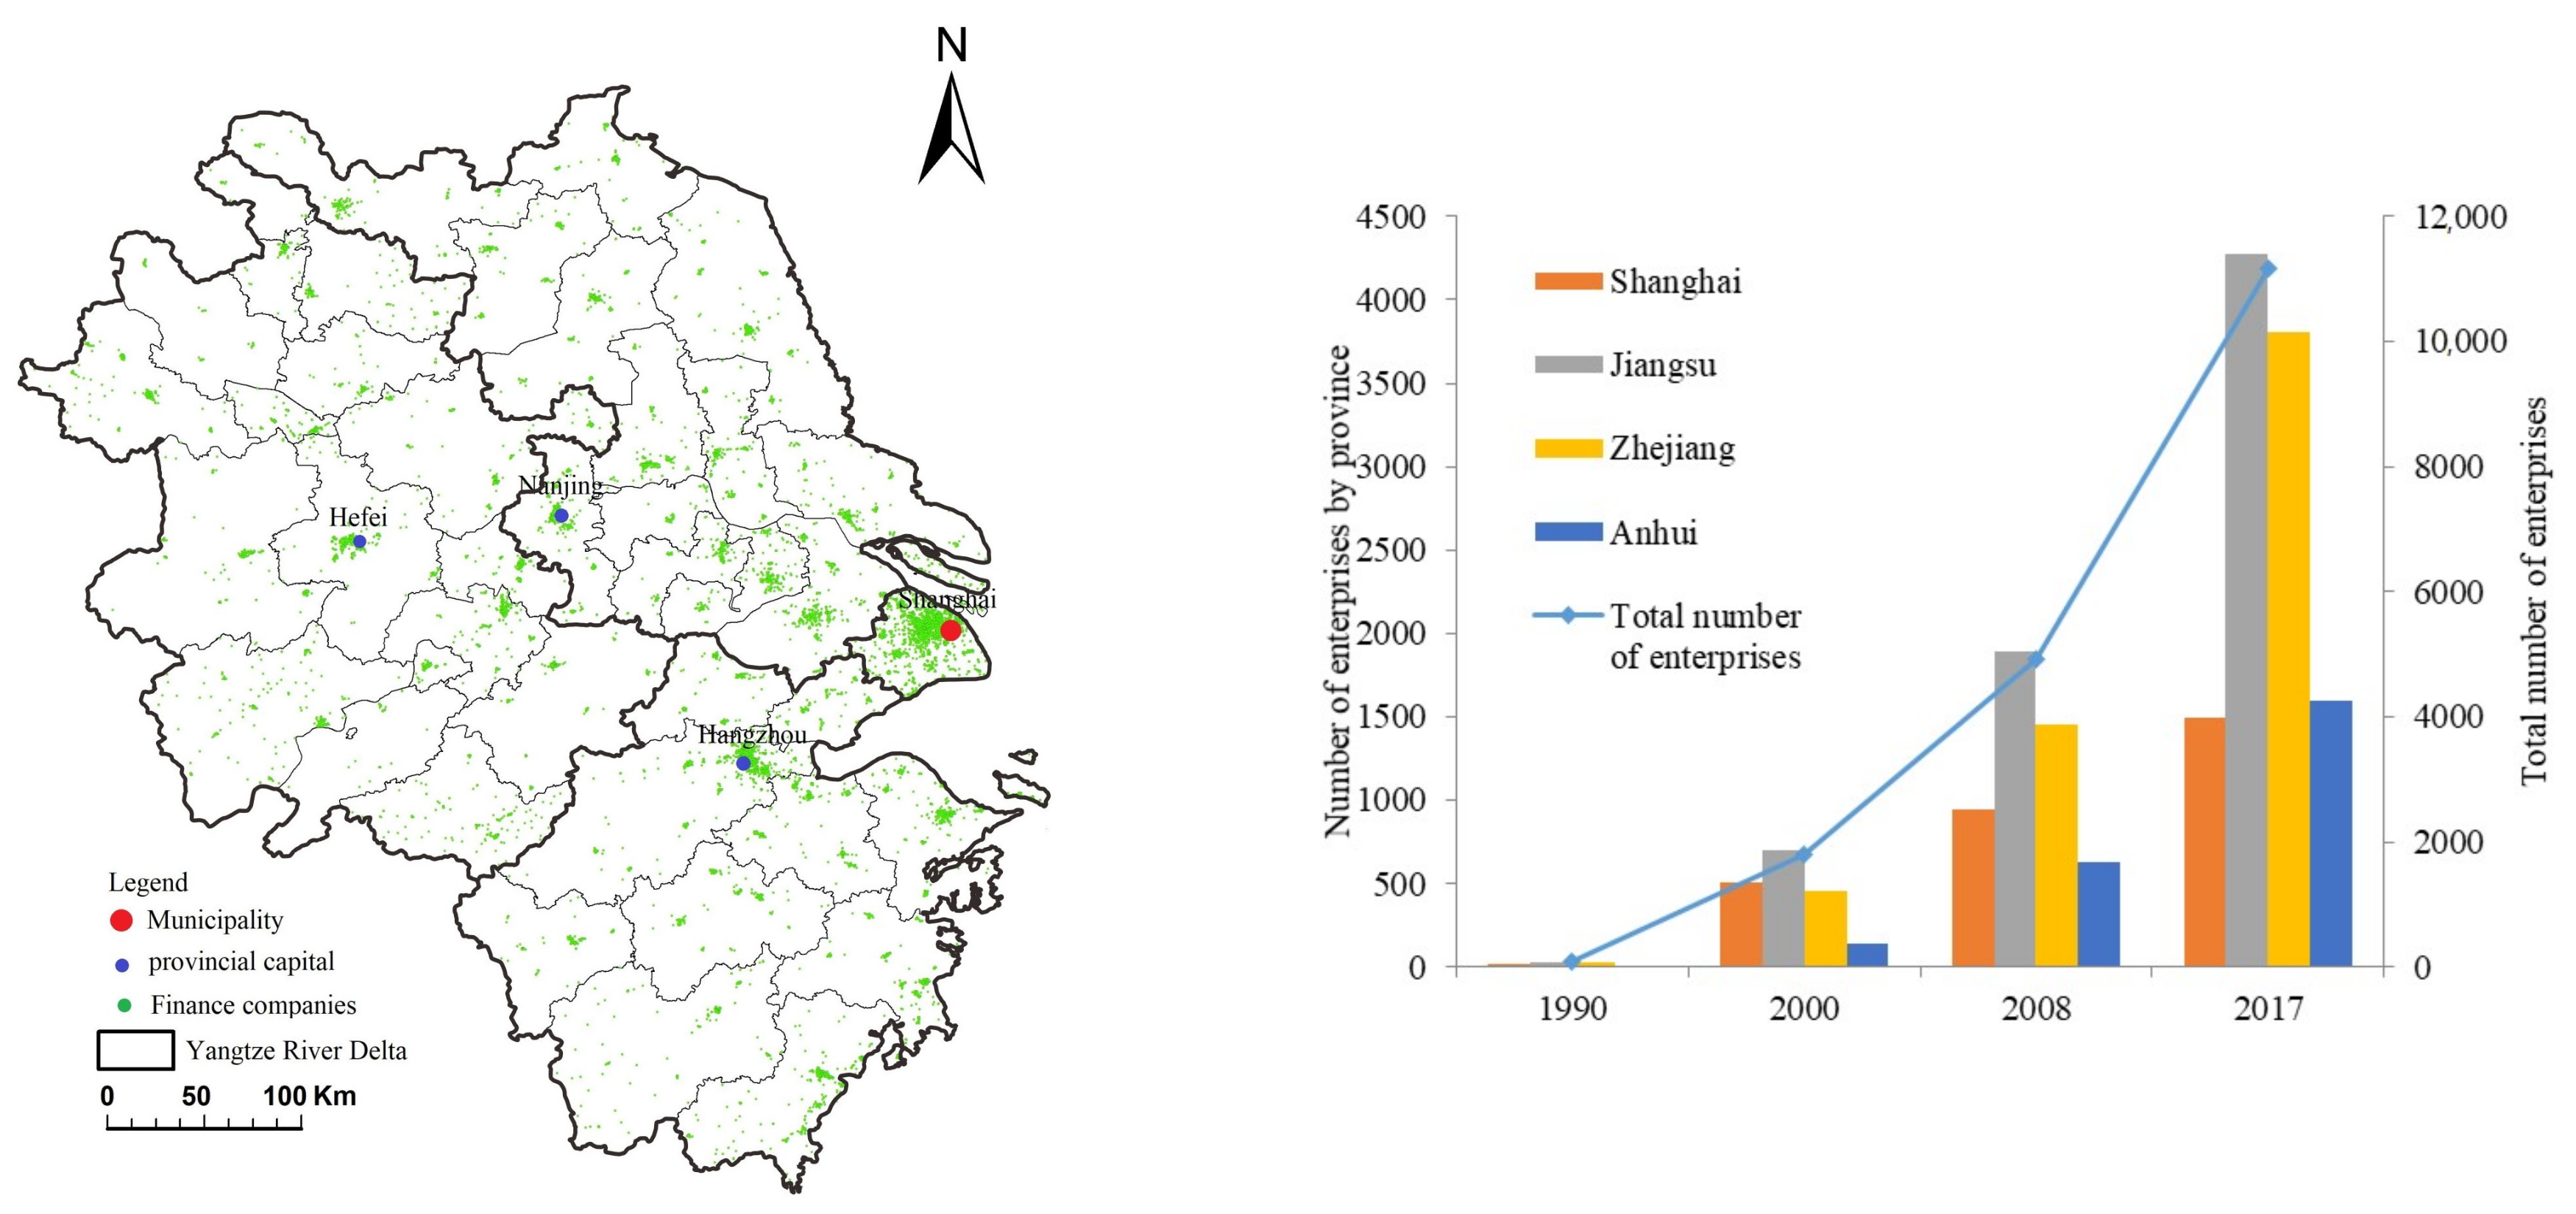
3.2. Data Sources and Network Construction
3.3. Methods
3.3.1. Interlocking Network Model
3.3.2. Degree Centrality
3.3.3. Network Density
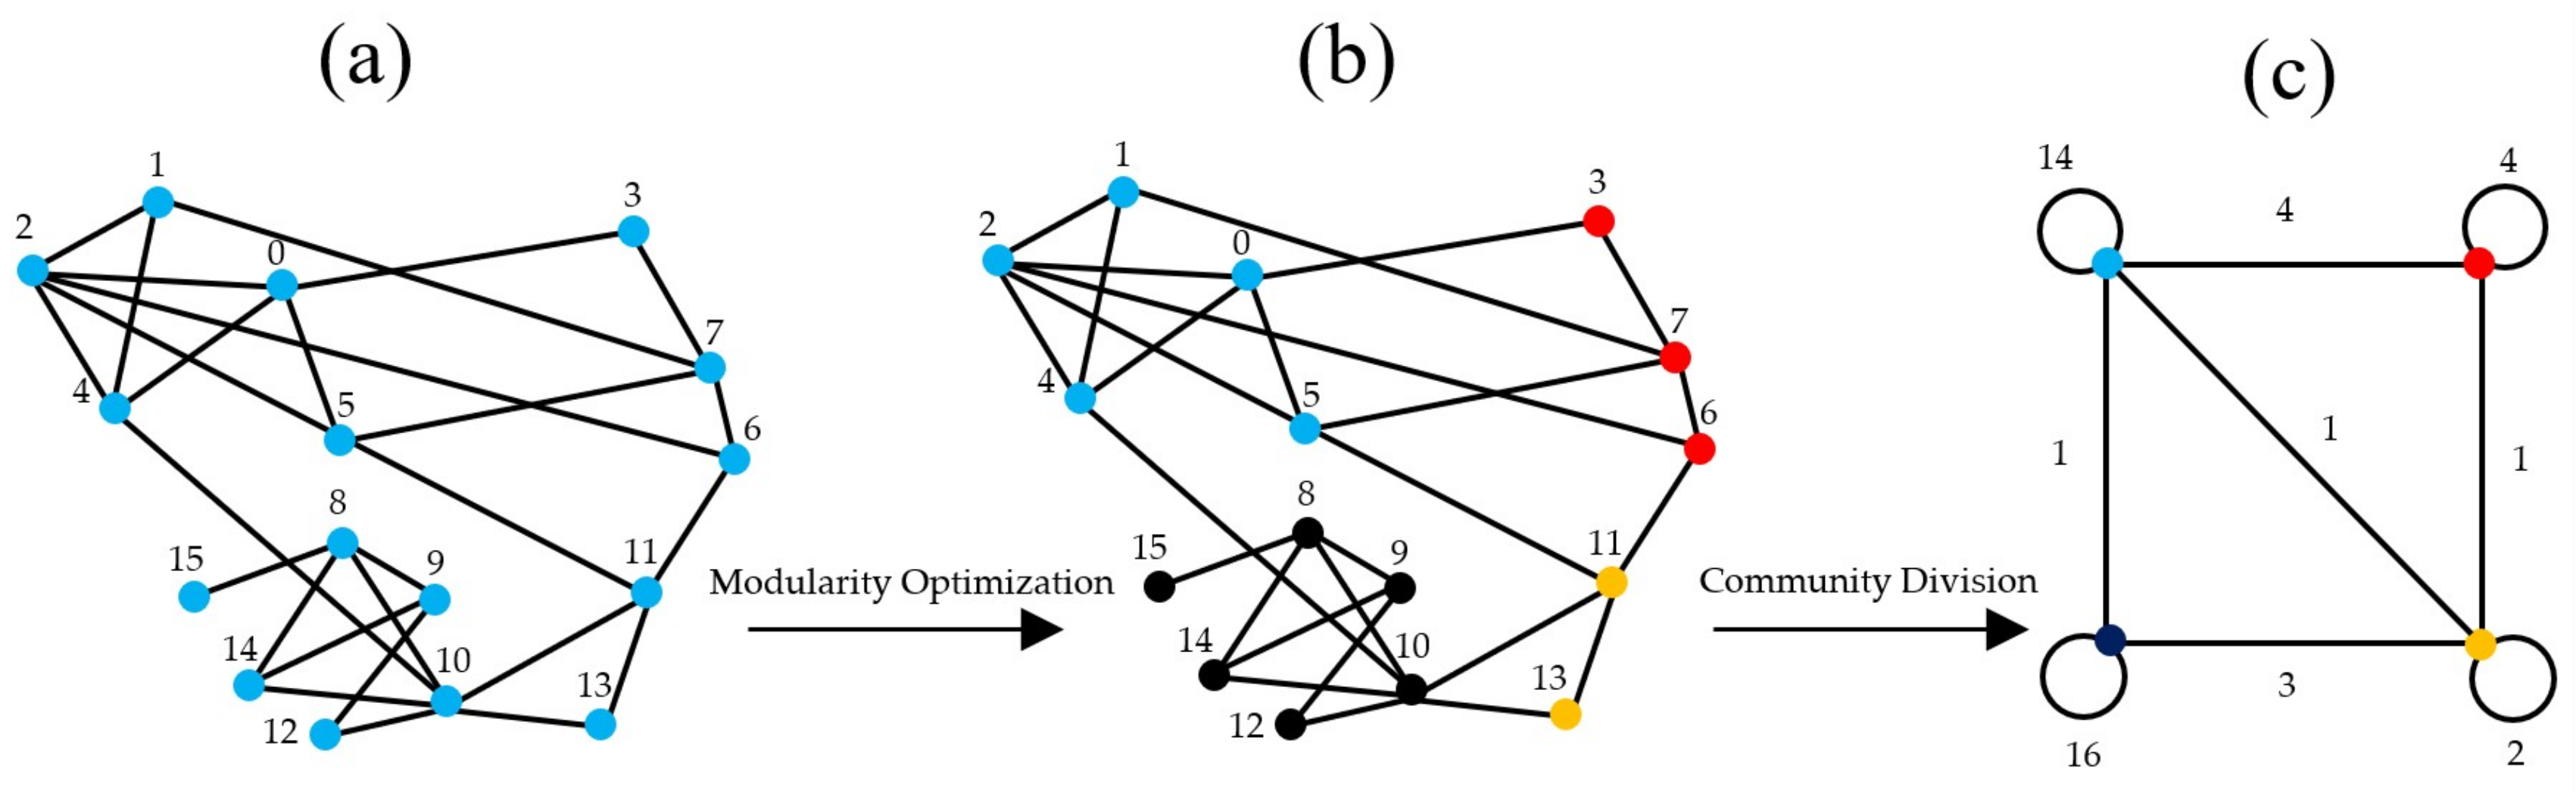
3.3.4. Modularity
3.3.5. Multidimensional Scaling
- The strength of connections between cities in 1990, 2000, 2008, and 2017 is processed into a matrix form that can be recognized by SPSS software.
- The processed data are imported into SPSS software, and the Stress coefficient in the MDS model is used to analyze its fitting degree. Generally, a Stress coefficient less than 0.2 indicates a better fitting effect.
- SPSS software is used to generate a spatial perception map that represents the relationship between cities based on the strength of connections between them. Through the spatial perception map combined with previous research, we can abstract expression of its spatial relationship.
3.3.6. Quadratic Assignment Procedure
- We constructed a 41 × 41 spatial matrix of the connections between cities (the R value calculated above) and used it as the dependent variable (Y).
- With reference to relevant literature, we selected some factors that may affect the urban network, and constructed these factors into a 41 × 41 spatial matrix.
- We took the city connection matrix as the dependent variable (Y) and the influencing factor matrix as the independent variable (X), and imported them into the QAP relational regression model for regression analysis. This step was implemented in UCINET.
4. Result
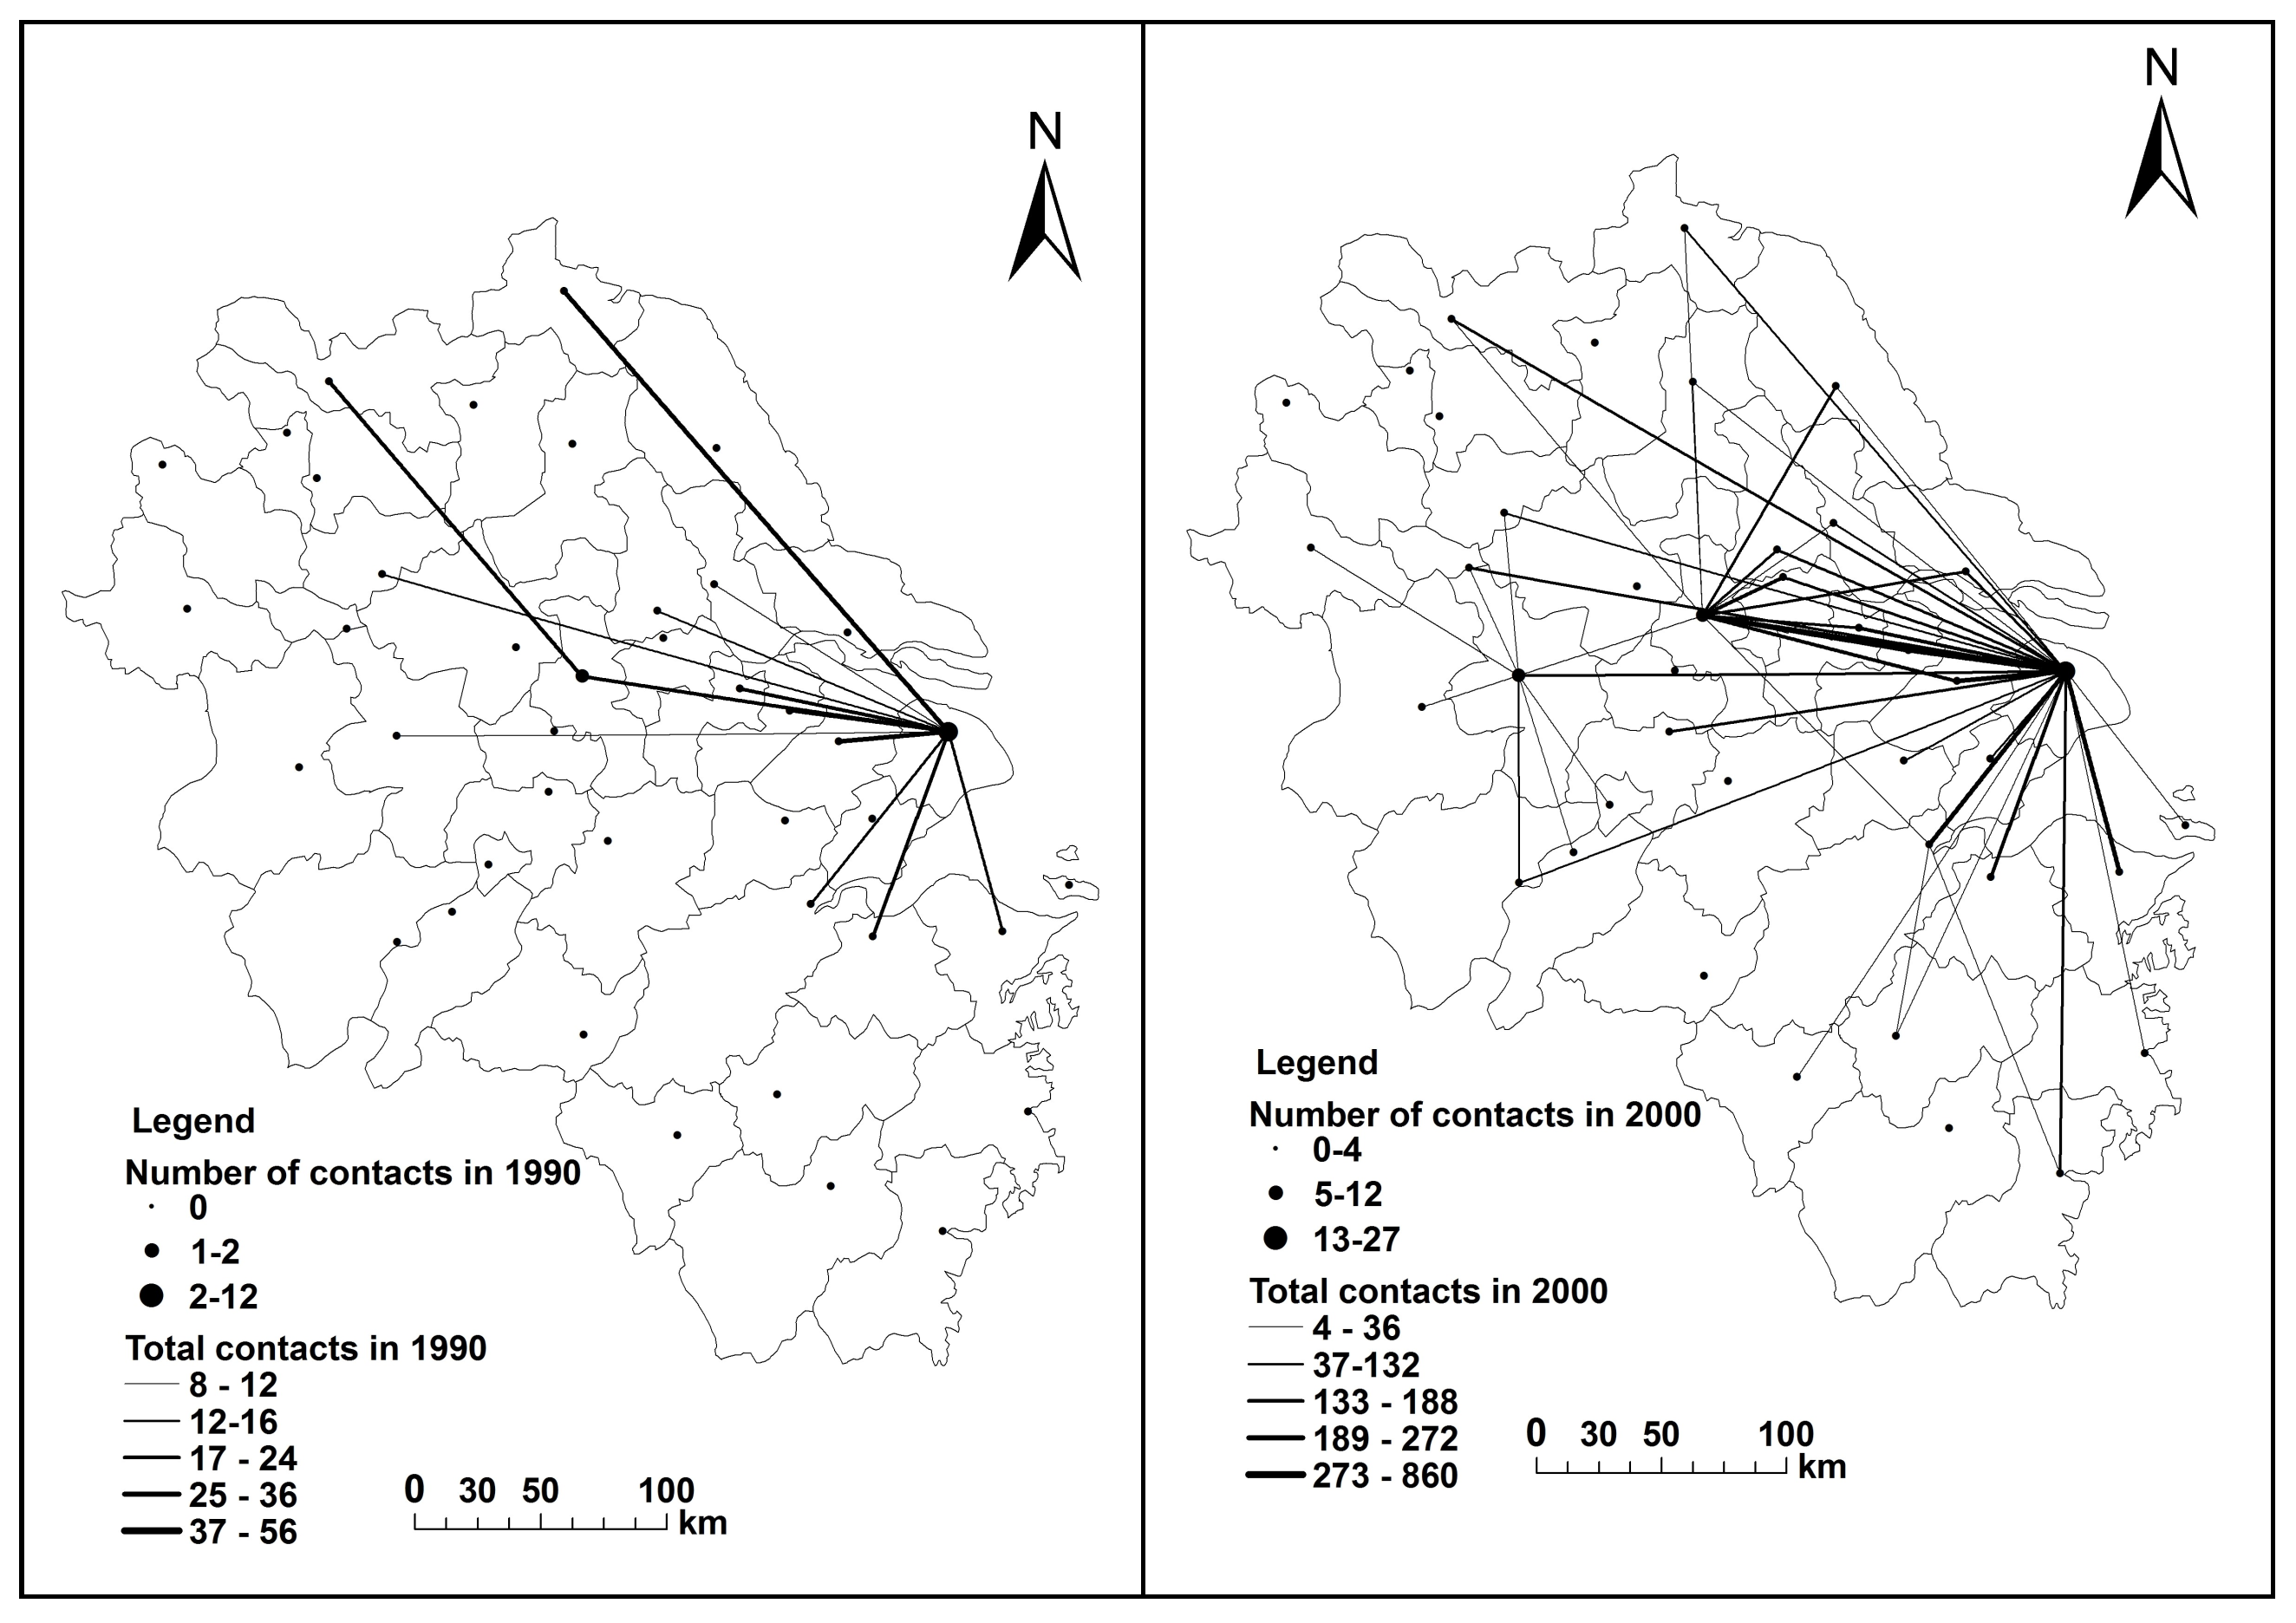
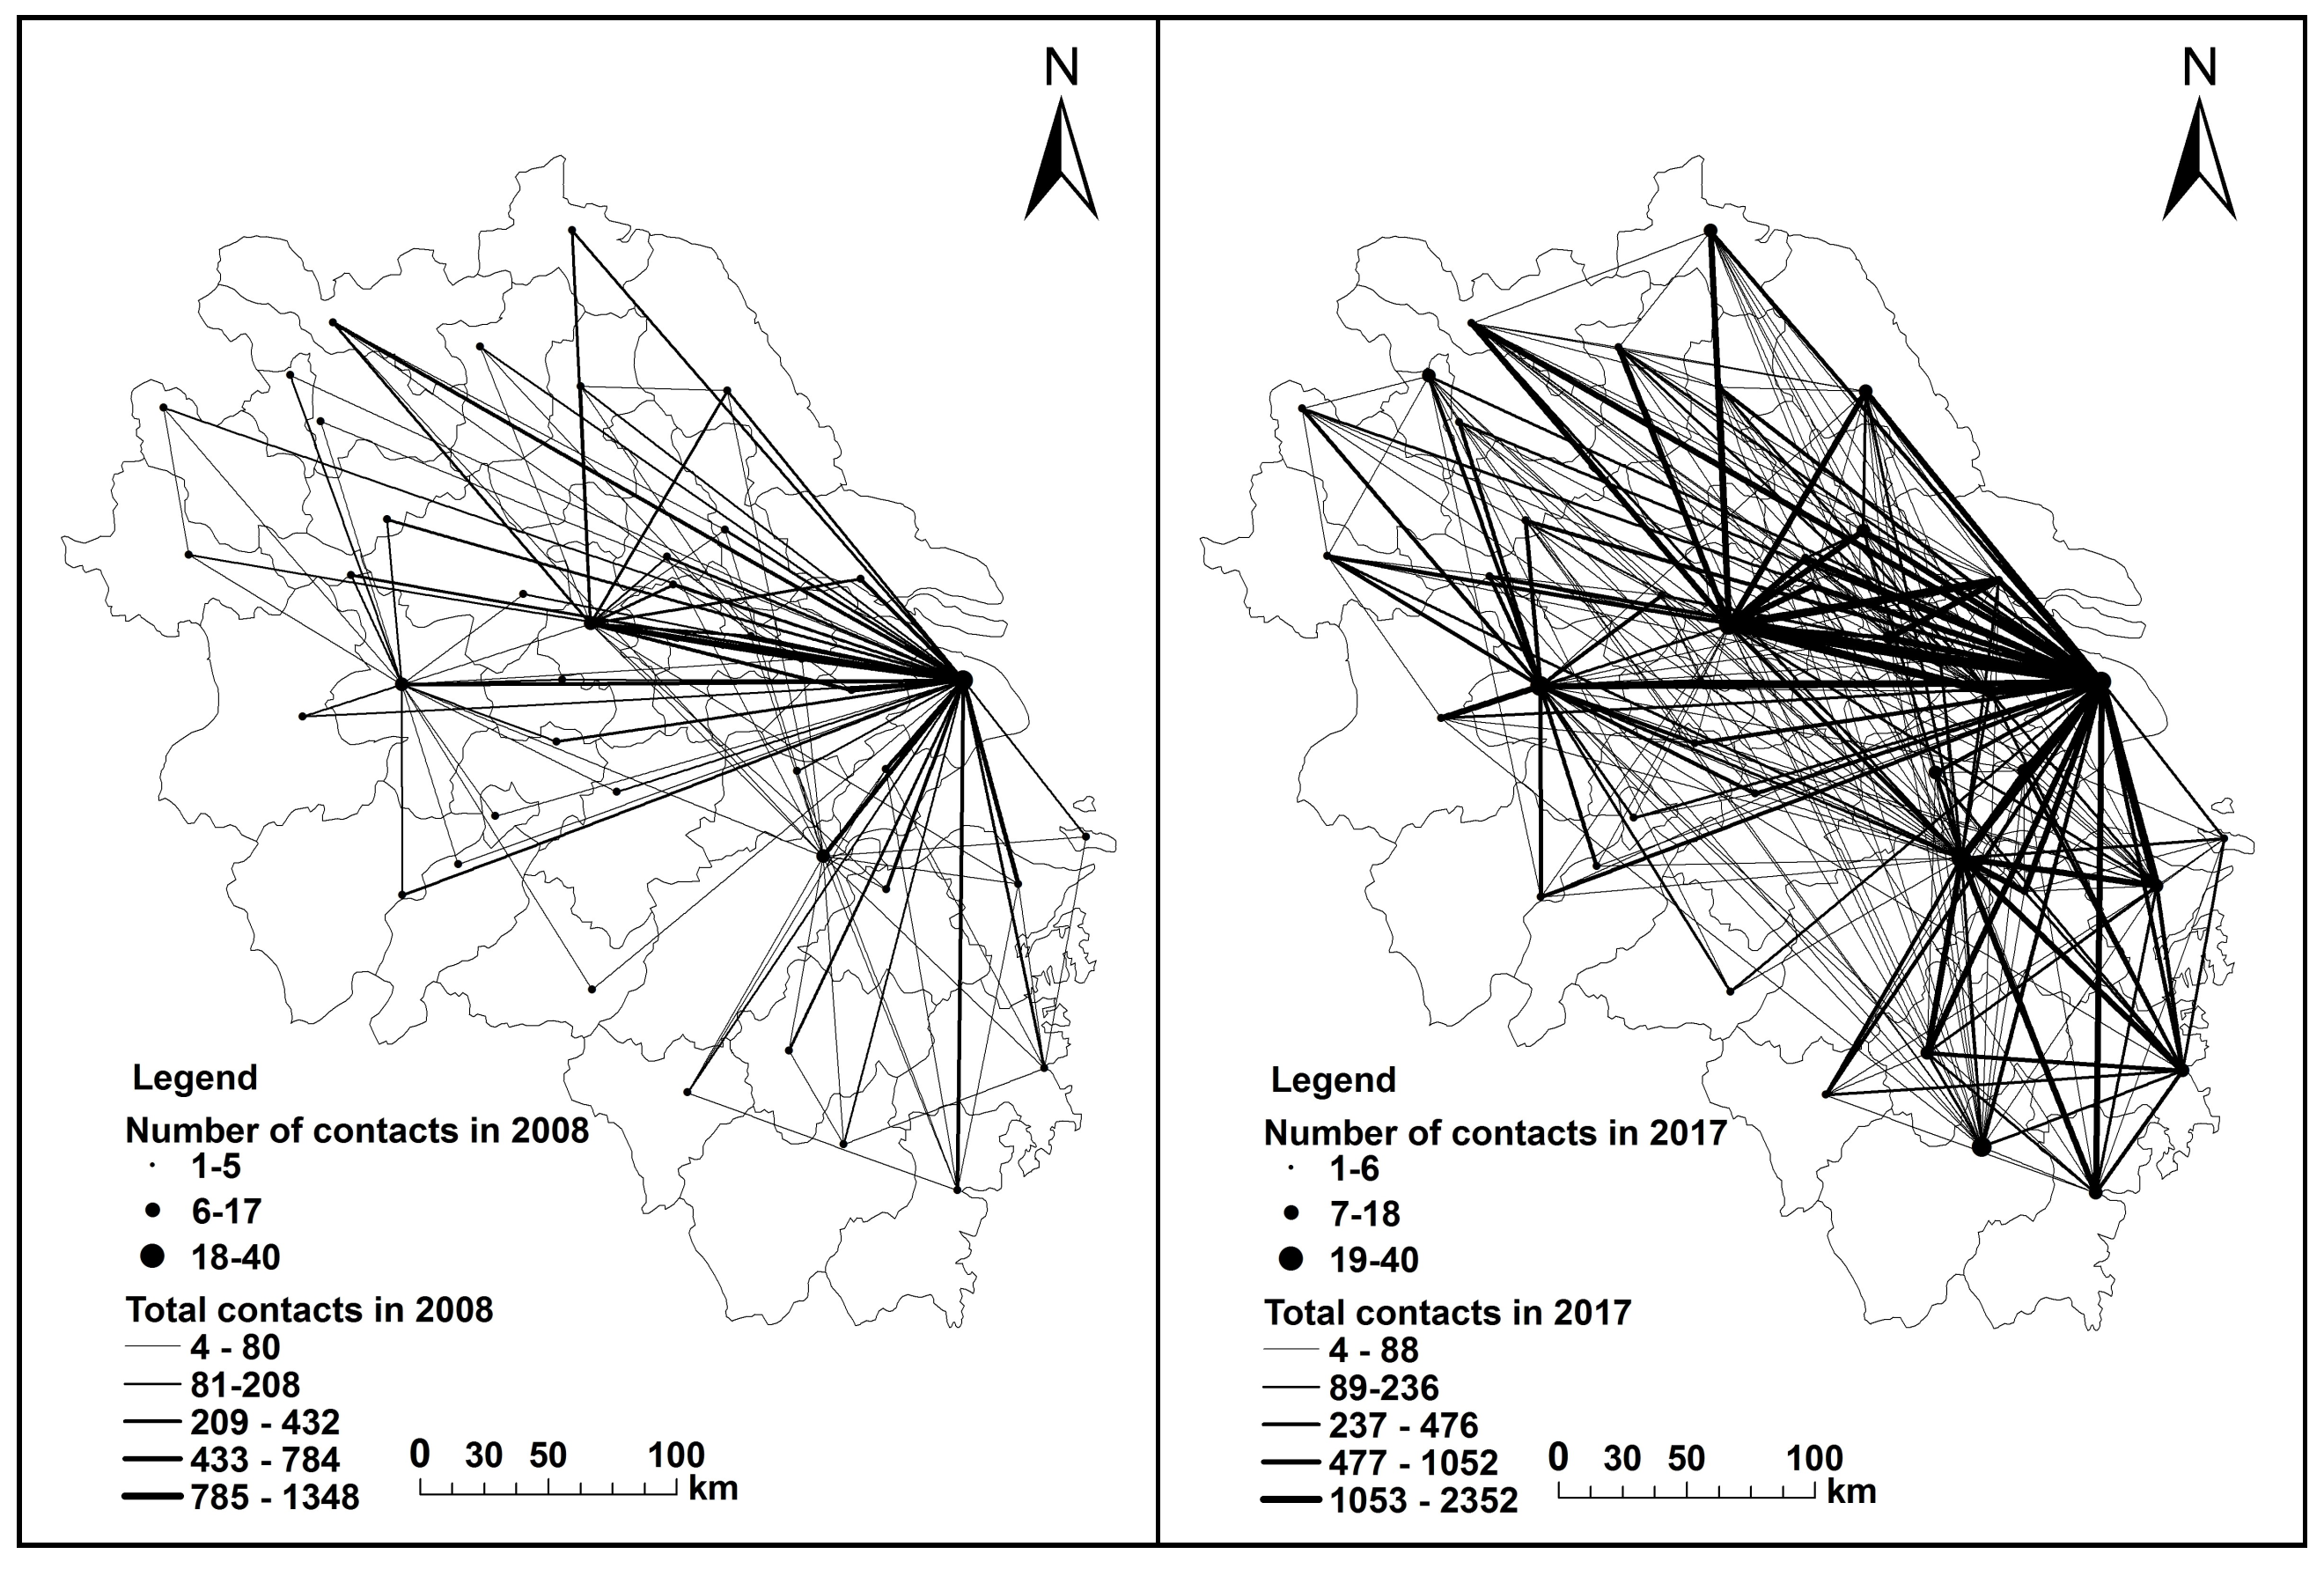
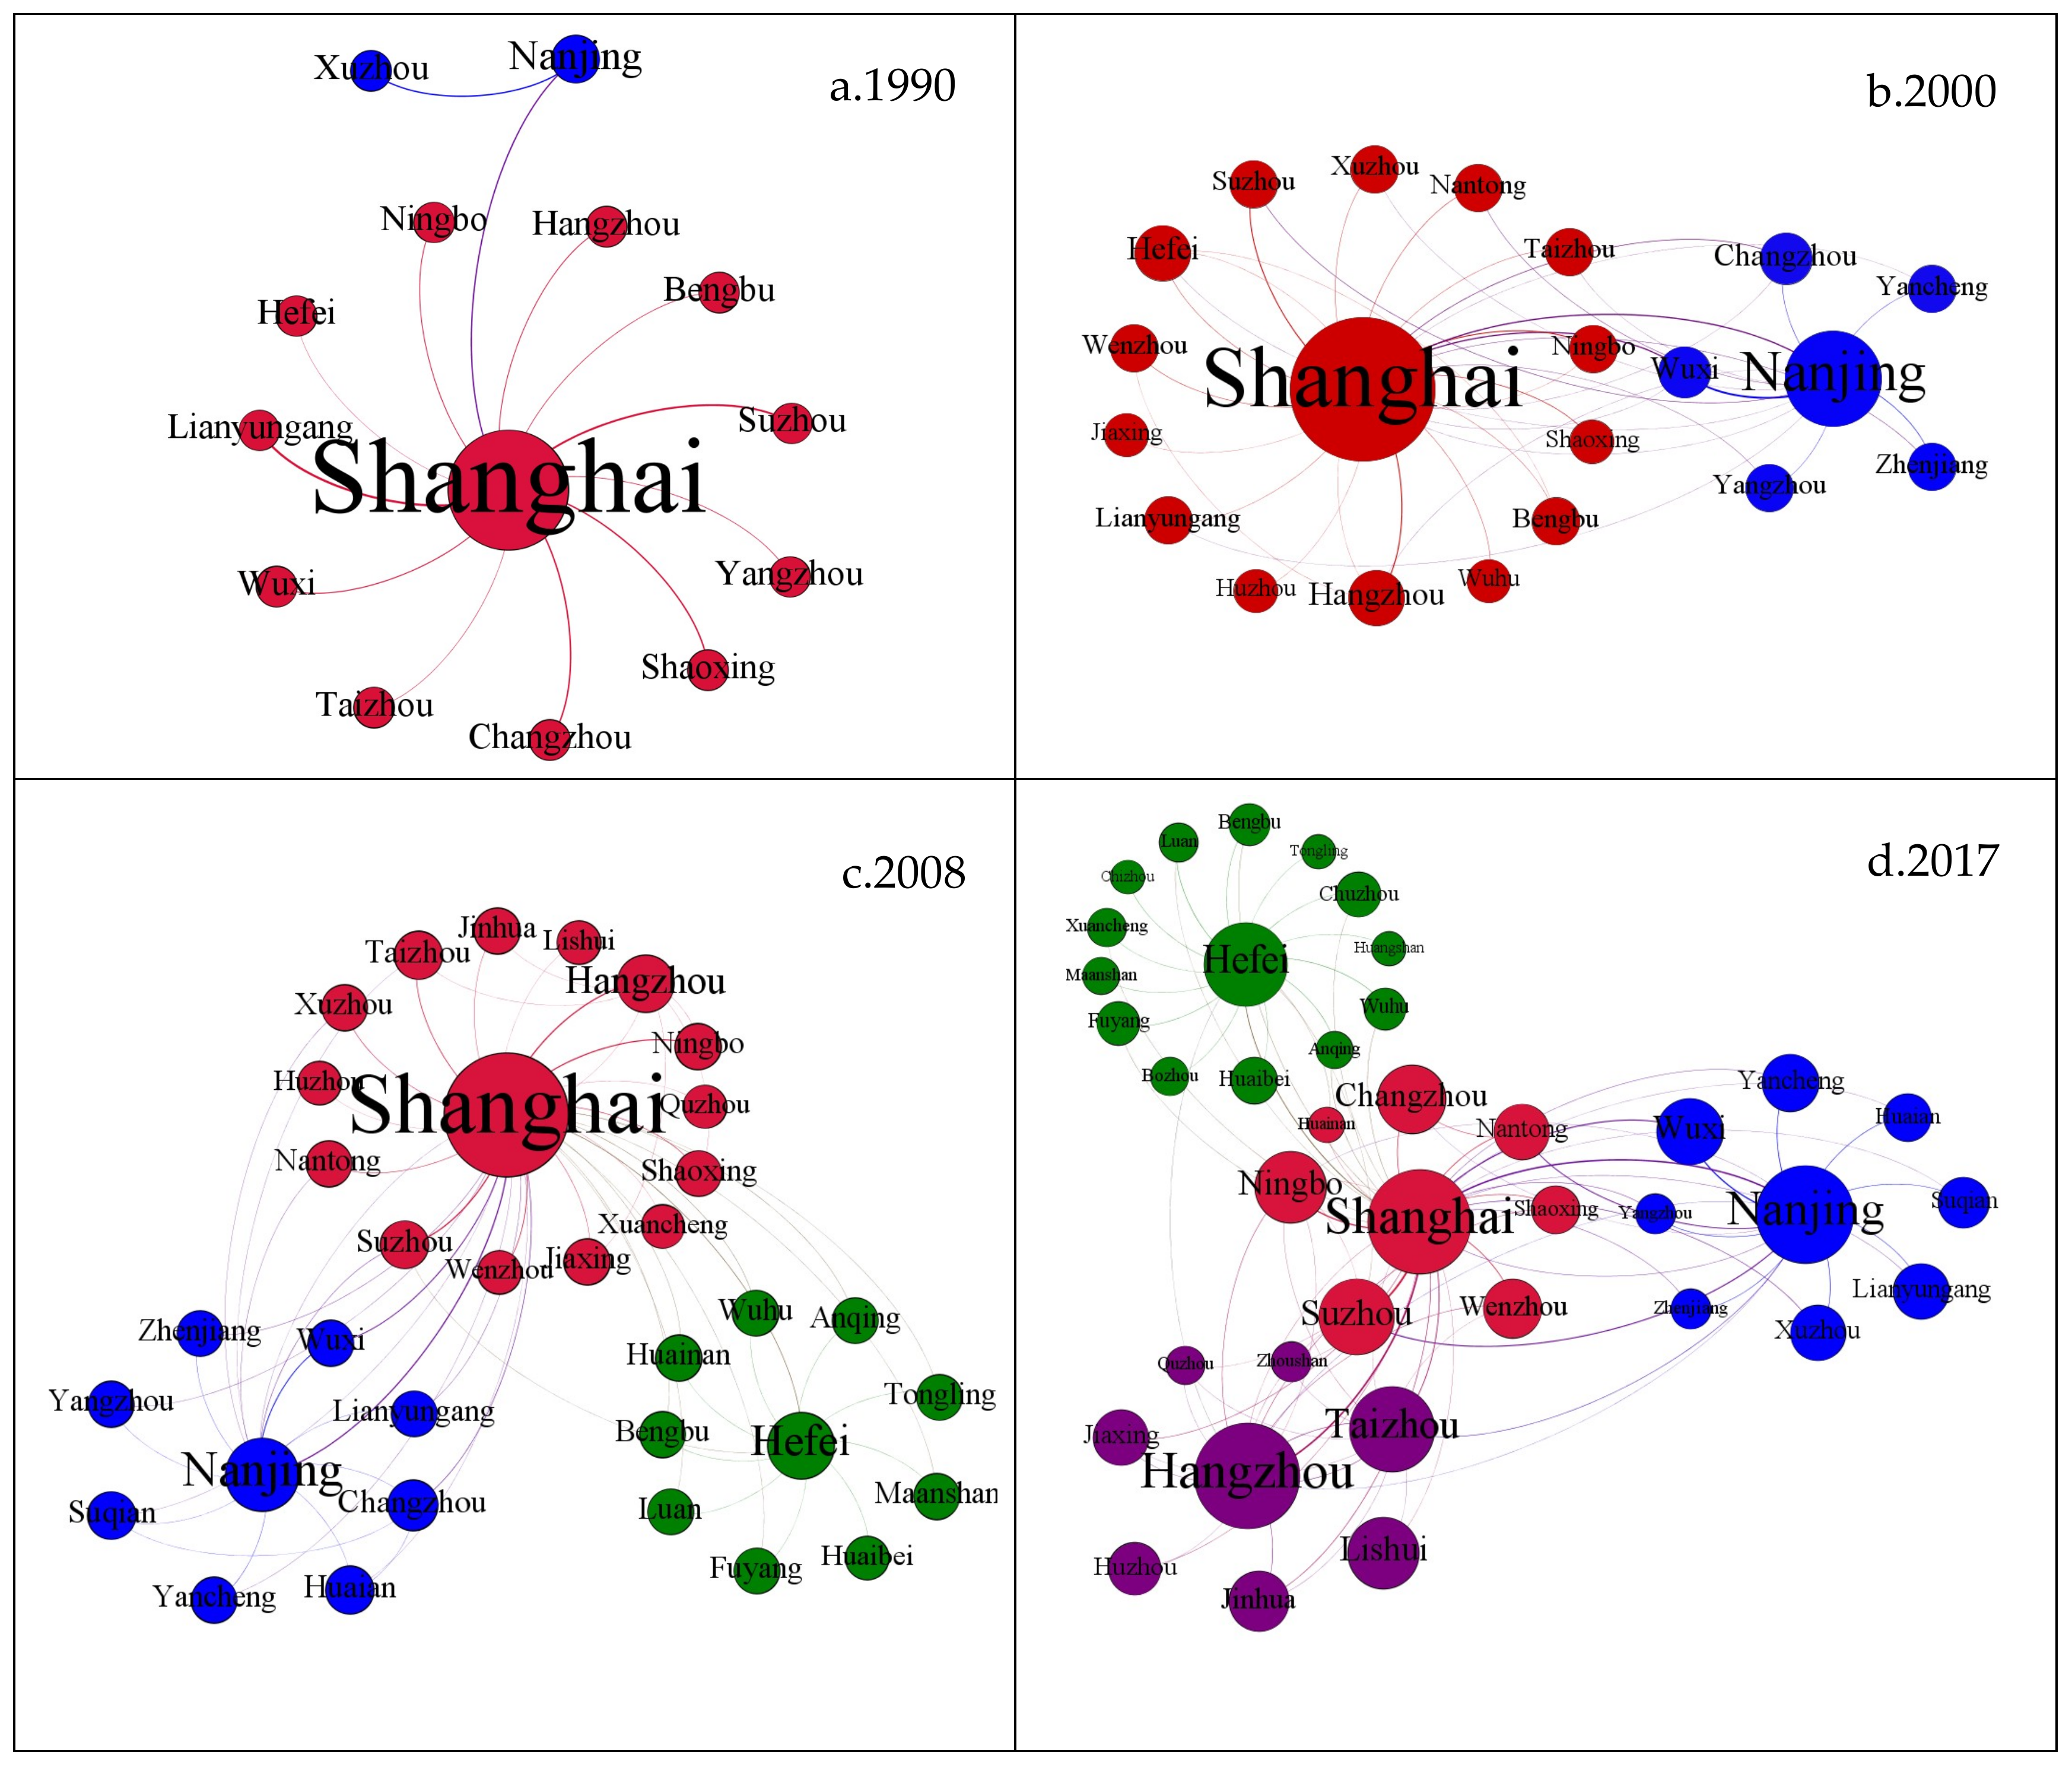
4.1. Spatial Connection Identification
4.2. Community Division of Urban Network Spatial Structure
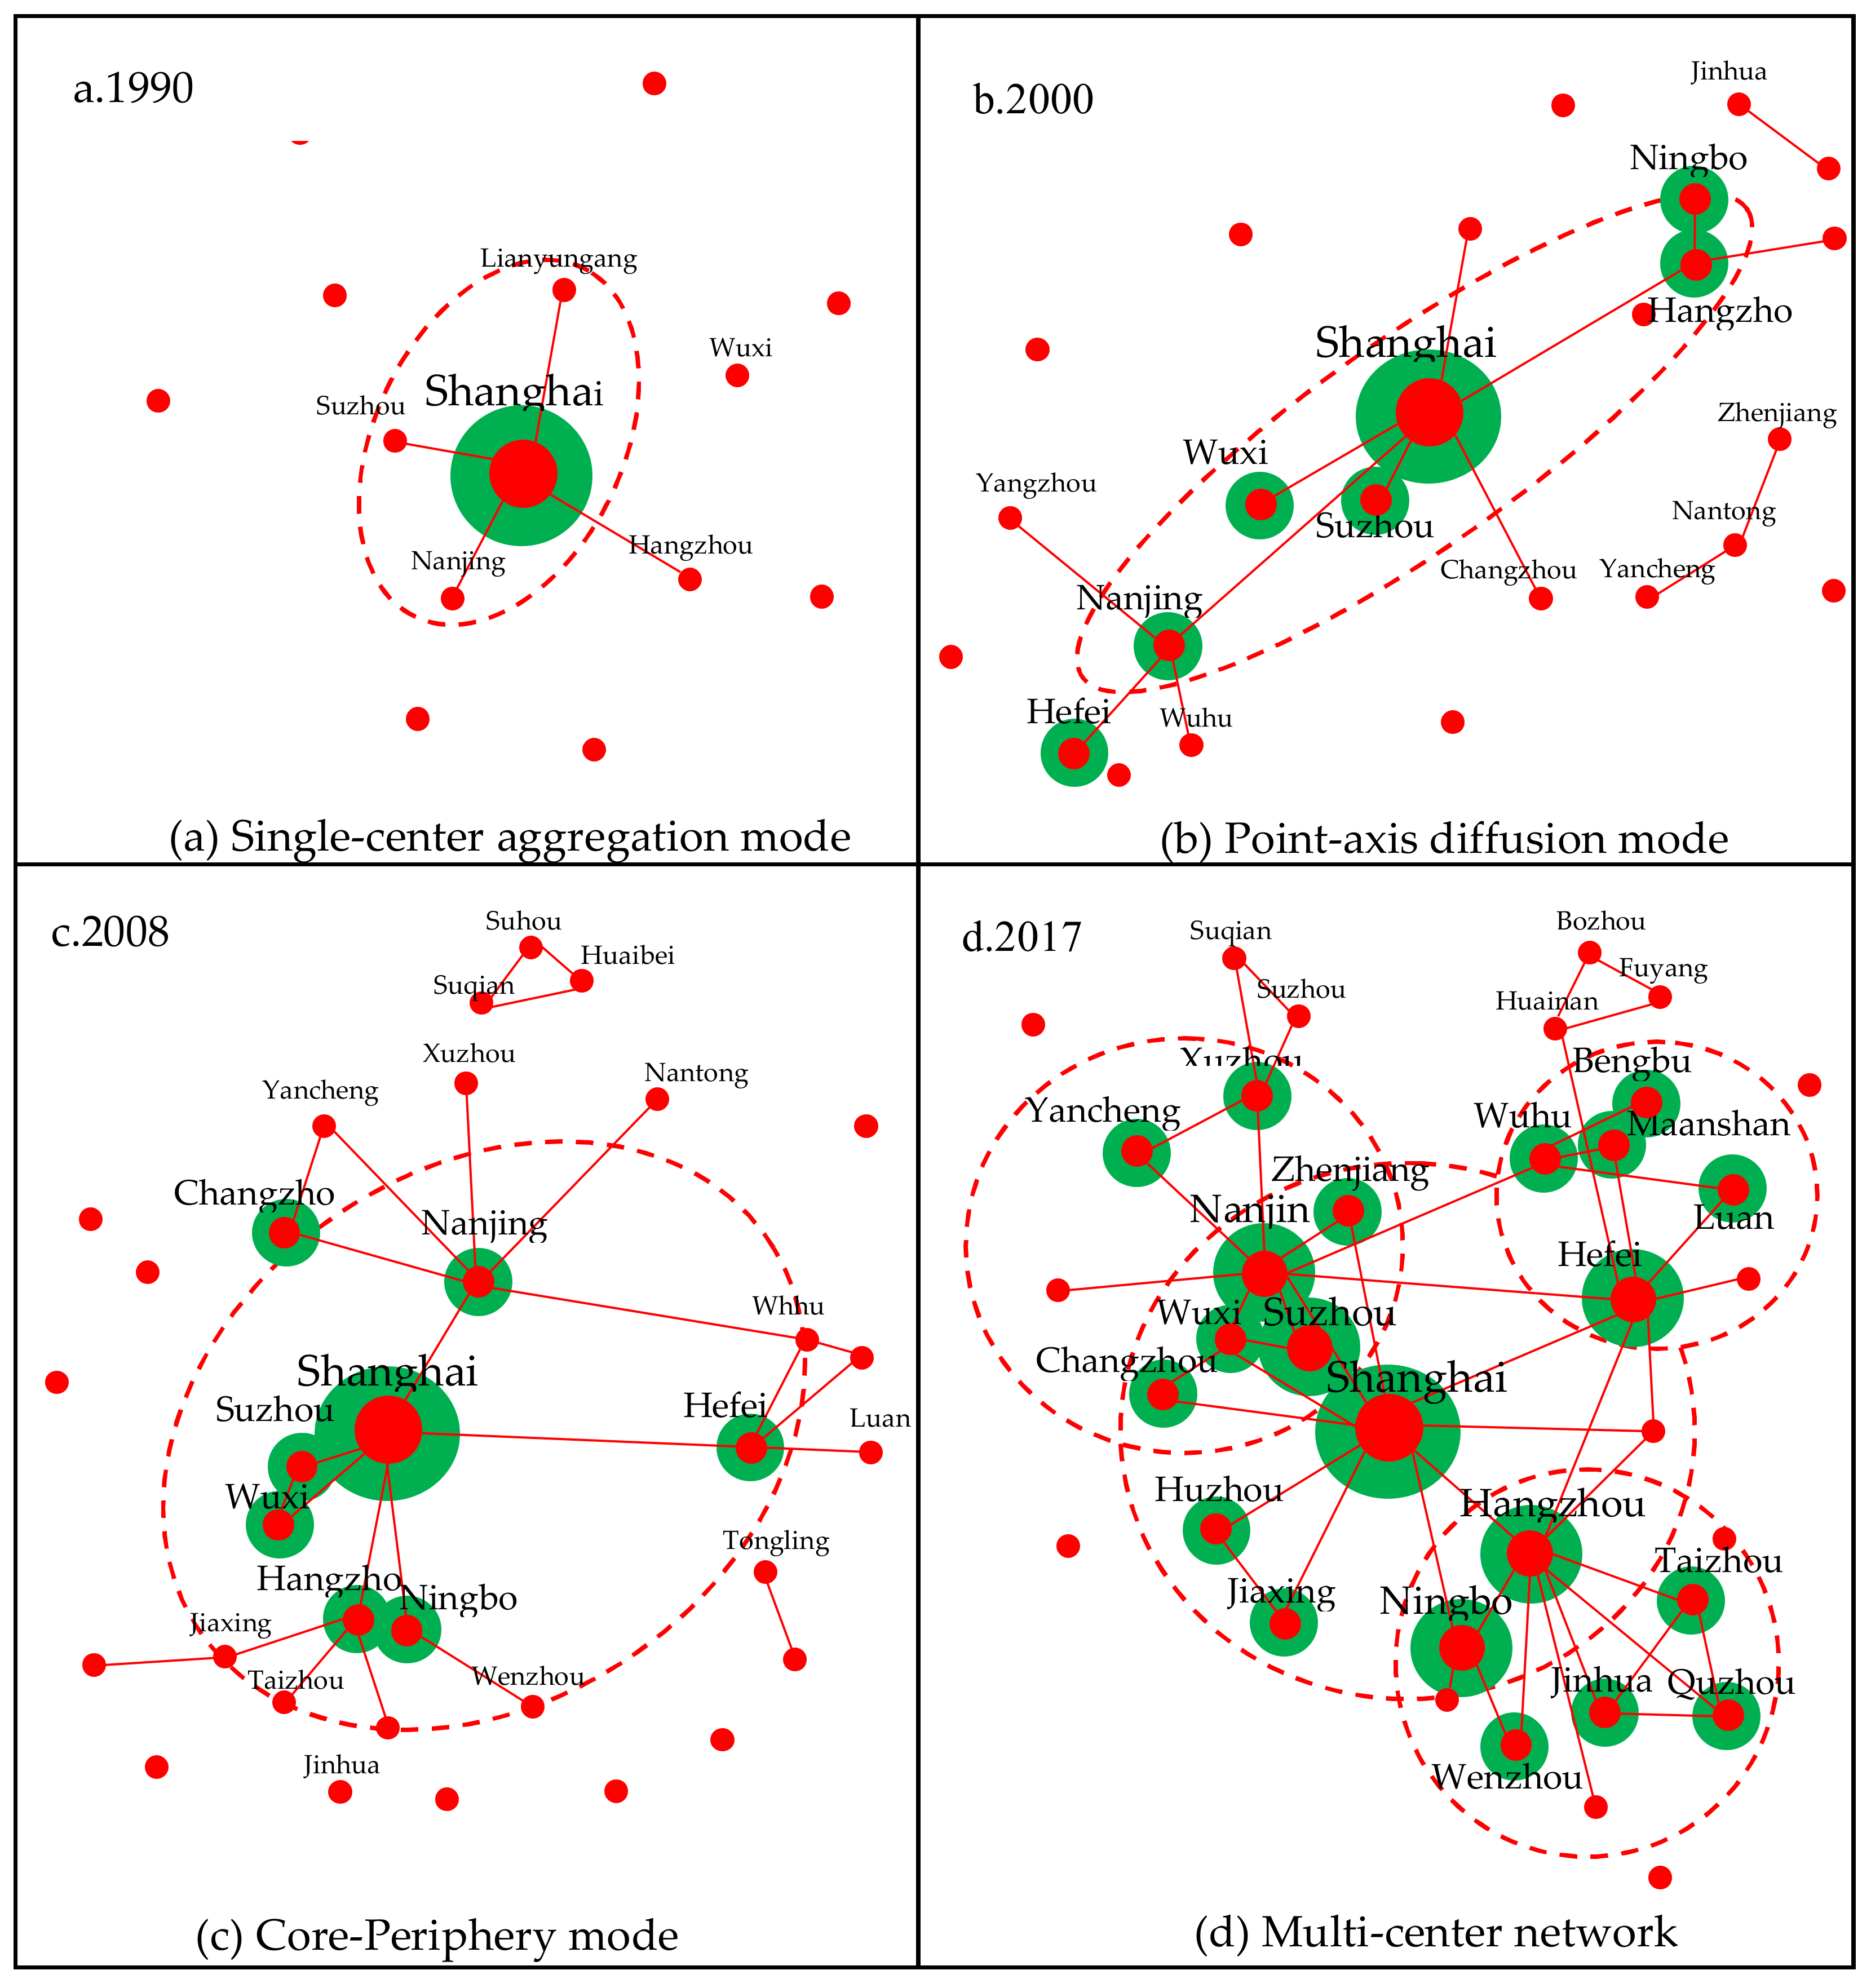
4.3. Evolution Mode of the Urban Network Spatial Structure
4.3.1. Single-Center Agglomeration Mode
4.3.2. Point-Axis Diffusion Mode
4.3.3. Core-Periphery Mode
4.3.4. Multi-Center Network Mode
4.4. Potential Determinants of the Strength of Urban Network Connections
4.4.1. Index Selection and Relationship Regression Model Construction
4.4.2. Potential Determinants of Urban Networks
5. Urban Network Spatial Structure Optimization Measures
- (1)
- Strengthen the resource agglomeration and diffusion capabilities of core cities in the network, and facilitate the liberalization of resource flow. The development of spatial networking has enhanced the cities’ resource exchange capacities and allocation efficiencies, and reduced the risk of opportunistic behavior. The network core cities have a strong ability to gather and spread resources, and act as a bridge and intermediary in the development of the urban network. However, the high-quality integrated development of the Yangtze River Delta cannot only rely on network core cities. In the future, it is necessary to further strengthen the construction of transportation infrastructure, reduce the cost of factor flow, and improve the connection efficiency of edge cities.
- (2)
- Optimize the spatial distribution of resources and guide the rational positioning of cities. Our research found that network core cities had higher network status and stronger control over network edge cities. It is not surprising that due to the socialist system with Chinese characteristics, a large number of high-quality resources such as policies and funds are mainly concentrated in municipalities and provincial capitals (Beijing, Shanghai, Guangzhou, and Shenzhen). The continuous growth of industries and populations in large cities is creating increasing amounts of economic and social conflict. However, some small cities suffer from population loss and lagging economic and industrial development due to the lack of resources. Therefore, we must change the past development concept, optimize the spatial allocation of resources, and promote the coordinated development of urban population–economy–industry. It should also be noted that coordinated development is not equalized development without difference between cities. It is necessary to clarify the positioning of urban functions, reduce the “siphon effect” of core cities through function transfer and optimizing resource allocation, and guide the specialization and characteristic development of non-core cities.
- (3)
- Through network spillover effects, strengthen the connection strength between network edge cities and core cities. Compared with the traditional spatial structure, the urban network spatial structure can accelerate the flow of resources to take advantage of the spillover effects of the economy, technology, and knowledge of the core cities. The spillover of economy, technology, and knowledge can promote industrial upgrades and technological progress in lower-level cities [54]. However, we also found that network spillover effects are related to factors such as geographic distance and cultural differences. This means that it is difficult for cities at the edge of the network to receive network spillover effects. Therefore, it is necessary to enhance the connection between network edge cities and core cities through industrial transfer and technical guidance.
- (4)
- Construct a multi-center network development mode to promote the integrated development of the Yangtze River Delta. More and more scholars believe that with the continuous development of China’s economy, a single-center cluster with Shanghai as the center is not conducive to the coordinated development of the Yangtze River Delta. Our research also shows that the current urban spatial structure of the Yangtze River Delta has developed from a single-center agglomeration to a multi-center network, which may have been driven by a variety of factors such as the market, government, and economy, and is a relatively ideal spatial development mode. However, due to historical factors, cultural differences and policy factors, forming a reasonable division of labor and coordination mechanism among cities in the Yangtze River Delta will be difficult. It may cause vicious competition in economic and industrial development, which is not conducive to the coordinated development of urban networks [55]. Therefore, we must make full use of tangible and intangible approaches to strengthen the docking of urban industries and the division of labor to avoid redundant construction and vicious competition.
6. Conclusions
- (1)
- Optimize the spatial distribution of resources and guide the rational positioning of cities.
- (2)
- Through the network spillover effect, enhance the connection strength between the network edge cities and the core cities.
- (3)
- Construct a multi-center network development mode to promote the integrated development of the Yangtze River Delta.
Author Contributions
Funding
Acknowledgments
Conflicts of Interest
References
- Landesmann, M.A.; Stoellinger, R. Structural change, trade and global production networks: An ‘appropriate industrial policy’ for peripheral and catching-up economies. Struct. Chang. Econ. D 2019, 48, 7–23. [Google Scholar] [CrossRef]
- Coe, N.M.; Yeung, W.C. Global Production Networks: Theorizing Economic Development in an Interconnected World. J. Econ. Geogr. 2016, 34, lbv038. [Google Scholar] [CrossRef]
- Wu, K.; Fang, C.; Zhao, M. The intercity space of flow influenced by high-speed rail: A case study for the rail transit passenger behavior between Beijing and Tianjin. Acta Geogr. Sin. 2013, 68, 159–174. [Google Scholar] [CrossRef]
- Taylor, P.J.; Derudder, B.; Faulconbridge, J.; Hoyler, M.; Ni, P.F. Advanced Producer Service Firms as Strategic Networks. Global Cities as Strategic Places. Econ. Geogr. 2014, 90, 267–291. [Google Scholar] [CrossRef]
- Friedmann, J. China’s Urban Transition; University of Minnesota Press: Minneapolis, MN, USA, 2005; pp. 111–116. [Google Scholar] [CrossRef]
- Gui, Q.; Liu, C.; Du, D. Does network position foster knowledge production? Evidence from international Scientific collaboration network. Growth Chang. 2018, 49, 594–611. [Google Scholar] [CrossRef]
- Cranmer, S.J.; Leifeld, P.; McClurg, S.D.; Rolfe, M. Navigating the Range of Statistical Tools for Inferential Network Analysis. Am. J. Polit. Sci. 2017, 61, 237–251. [Google Scholar] [CrossRef]
- Snijders, T.A.; Van De Bunt, G.G.; Steglich, C.E. Introduction to stochastic actor-based models for network dynamics. Soc. Netw. 2010, 32, 44–60. [Google Scholar] [CrossRef]
- Li, Z.R.; Zhen, F.; Fu, X.X. Mapping Urban Network Through Inter-firm Investment Relationship: A Case Study of Yangtze River Delta. Sci. Geogr. Sin. 2019, 39, 1763–1770. [Google Scholar] [CrossRef]
- Battiston, S.; Rodrigues, J.F.; Zeytinoglu, H. The network of inter-regional direct investment stocks across Europe. Adv. Complex Syst. 2007, 10, 29–51. [Google Scholar] [CrossRef]
- Balland, P.A.; Boschma, R.; Ravet, J. Network dynamics in collaborative research in the EU, 2003–2017. Eur. Plan. Stud. 2019, 27, 1811–1837. [Google Scholar] [CrossRef]
- Yeh, A.G.O.; Yang, F.F.; Wang, J. Producer service linkages and city connectivity in the mega-city region of China: A case study of the Pearl River Delta. Urban Stud. 2015, 52, 2458–2482. [Google Scholar] [CrossRef]
- Zhen, F.; Wang, X.; Yin, J.; Zhang, M. An Empirical Study on Chinese City Network Pattern Based on Producer Services. Chinese. Geogr. Sci. 2012, 23, 274–285. [Google Scholar] [CrossRef]
- Li, X.D. Spatial structure of the Yangtze river delta city network based on the pattern of listed companies network. Prog. Geogr. 2017, 33, 1587–1600. [Google Scholar] [CrossRef]
- Ji, F.F.; Cheng, W.; Wei, Y.H. Changing financial flow patterns and driving mechanisms of financial flows under the integration of the Yangtze River Delta: An analysis of the financial transaction data of listed companies. Acta Geogr. Sin. 2014, 69, 823–837. [Google Scholar] [CrossRef]
- Gomber, P.; Kauffman, R.J.; Parker, C.; Weber, B.W. On the fintech revolution: Interpreting the forces of innovation, disruption and transformation in financial services. J. Manag. Inform. Syst. 2018, 35, 220–265. [Google Scholar] [CrossRef]
- Mahutga, M.C.; Ma, X.; Smith, D.A.; Timberlake, M. Economic globalisation and the structure of the world city system: The case of airline passenger data. Urban Stud. 2010, 47, 1925–1947. [Google Scholar] [CrossRef]
- Tang, Z.; Li, T.; Li, C. Research on the interlocking network of major cities in China. City Plan. Rev. 2017, 1, 28–40. [Google Scholar] [CrossRef]
- Robinson, J. Global and world cities: A view from off the map. Int. J. Urban Reg. Res. 2002, 26, 531–554. [Google Scholar] [CrossRef]
- Chen, K.; Chen, G. The rise of international financial centers in mainland china. Cities 2015, 47, 10–22. [Google Scholar] [CrossRef]
- Meijers, E.J.; Burger, M.J. Spatial structure and productivity in US metropolitan areas. Environ. Plan. A 2010, 42, 1383–1402. [Google Scholar] [CrossRef]
- Lee, B. “Edge” or “edgeless” cities? Urban spatial structure in US metropolitan areas, 1980 to 2000. J. Reg. Sci. 2007, 47, 479–515. [Google Scholar] [CrossRef]
- Hesse, M. The Polycentric Metropolis: Learning from Mega-city Regions in Europe—Edited by Peter G. Hall and Kathy Pain. Int. J. Urban Reg. Res. 2010, 31, 496–498. [Google Scholar] [CrossRef]
- Hsu, W.T. Central Place Theory and City Size Distribution. Econ. J. 2012, 122, 903–932. [Google Scholar] [CrossRef]
- Berry, B.J.L.; Garrison, W.L. Recent Developments of Central Place Theory. Pap. Reg. Sci. 2010, 4, 107–120. [Google Scholar] [CrossRef]
- Roper, S.; Grimes, S. Wireless valley, silicon wadi and digital island—Helsinki, Tel Aviv and Dublin and the ICT global production network. Geoforum 2005, 36, 297–313. [Google Scholar] [CrossRef]
- Zhao, M.X.; Tang, Z.L. A network based measurement for urban hinterland area in Yangtze River Delta. Econ. Geogr. 2010, 30, 371–376. [Google Scholar] [CrossRef]
- Wu, Q.B.; Ning, Y.M. Headquarter locations of top 500 enterprises of Chinese manufacturing industries. Acta Geogr. Sin. 2010, 65, 139–152. [Google Scholar] [CrossRef]
- Zhou, Y.X.; Hu, Z.Y. Looking into the network structure of Chinese urban system from the perspective of air transportation. Geogr. Res. 2002, 21, 276–286. [Google Scholar] [CrossRef]
- Derudder, B.; Taylor, P.J.; Witlox, X.F.; Catalaon, G. Hierarchical Tendencies and Regional Patterns in the World City Network: A Global Urban Analysis of 234 Cities. Reg. Stud. 2003, 37, 875–886. [Google Scholar] [CrossRef]
- Castells, M. Globalisation, networking, cityisation: Reflections on the spatial dynamics of the information age. Urban Stud. 2010, 47, 2737–2745. [Google Scholar] [CrossRef]
- Huggins, R.; Prokop, D. Network structure and regional innovation: A study of university–industry ties. Urban Stud. 2017, 54, 931–952. [Google Scholar] [CrossRef]
- Zhang, G.P.; Guan, J.C.; Liu, X.L. The impact of small world on patent productivity in China. Scientometrics 2014, 98, 945–960. [Google Scholar] [CrossRef]
- Rossi, E.C.; Taylor, P.J. Banking networks across brazilian cities: Interlocking cities within and beyond brazil. Cities 2005, 22, 381–393. [Google Scholar] [CrossRef]
- Jiang, D.L.; Sun, Y.; Ren, H. Analyses on the city network characteristics of middle yangtze city agglomeration based on Baidu Index. Resour. Environ. Yangtze Basin. 2015, 24, 1654–1664. [Google Scholar] [CrossRef]
- Sheng, K.R.; Yang, Y.; Zhang, H.X. Cohesive subgroups and underlying factors in the urban network in China. Geogr. Res. 2019, 38, 2639–2652. [Google Scholar] [CrossRef]
- Ke, W.Q.; Chen, W.; Yu, Z.Y. Uncovering spatial structures of regional city networks from expressway traffic flow data: A case study from Jiangsu Province, China. Sustainability 2017, 9, 1541. [Google Scholar] [CrossRef]
- Scherngell, T.; Hu, Y. Collaborative knowledge production in China: Regional evidence from a gravity model approach. Reg. Stud. 2011, 45, 755–772. [Google Scholar] [CrossRef]
- Wang, Z.H.; Wang, D.C.; Hu, B.X.; Guo, Q.Z.; Xiu, L.N.; Zhao, H.T. Construction of ecological network in Yinzhou District of Tianjin considering landslide sensitivity. Acta Ecol. Sin. 2017, 38, 4351–4362. [Google Scholar] [CrossRef]
- Jauhiainen, J.S.; Moilanen, H. Towards fluid territories in European spatial development: Regional development zones in Finland. Environ. Plan. C Gov. Policy 2011, 29, 728–744. [Google Scholar] [CrossRef]
- Tseng, C.Y.; Lin, S.C.; Pai, D.C.; Tung, C.W. The relationship between innovation network and innovation capability: A social network perspective. Technol. Anal. Strateg. Manag. 2016, 28, 1029–1040. [Google Scholar] [CrossRef]
- Liu, W.C.; Cao, Y.H.; Liang, S.B.; Guo, J.Y. Spatial Effects of Cross Yangtze Highway Passage on Interurban Linkages in the Yangtze River Delta. Econ. Geogr. 2020, 40, 49–56. [Google Scholar] [CrossRef]
- Li, Y.C.; Phelps, N.A. Knowledge polycentricity and the evolving Yangtze River Delta megalopolis. Reg. Stud. 2017, 51, 1035–1047. [Google Scholar] [CrossRef]
- Liu, C.; Guan, M.; Duan, D. Spatial pattern and influential mechanism of interurban technology transfer network in China. Acta Geogr. Sin. 2018, 73, 1462–1477. [Google Scholar] [CrossRef]
- Qian, C.; Shen, L.Z.; Zhen, F. Spatial evolution of China’s internet enterprises and the characteristics of city network. Hum. Geogr. 2018, 33, 97–105. [Google Scholar] [CrossRef]
- Vincent, D.B.; Jean-Loup, G.; Renaud, L.; Etienne, L. Fast unfolding of communities in large networks. J. Stat. Mech. 2008. [Google Scholar] [CrossRef]
- Newman, M.E.J. Fast algorithm for detecting community structure in network. Phys. Rev. E 2004, 69, 066133. [Google Scholar] [CrossRef] [PubMed]
- He, Z.; Yang, Y.; Liu, Y.; Jin, F.J. Characteristics of evolution of global energy trading network and relationships between major countries. Prog. Geogr. 2019, 38, 1621–1632. [Google Scholar] [CrossRef]
- Liu, B.; Huang, S.; Fu, H. An application of network analysis on tourist attractions: The case of Xinjiang, China. Tour. Manag. 2017, 58, 132–141. [Google Scholar] [CrossRef]
- Meng, D.Y.; Feng, X.H.; Wen, Y.Z. City network structure evolution and organizational pattern in Northeast China from the perspective of railway passenger transport. Geogr. Res. 2017, 36, 1339–1352. [Google Scholar] [CrossRef]
- Boschma, R.A. Proximity and innovation: A critical assessment. Reg. Stud. 2005, 39, 61–74. [Google Scholar] [CrossRef]
- Wu, Q.B.; Ning, Y.M. China’s urban network based on spatial organization of electronic information enterprises. Geogr. Res. 2012, 31, 207–219. [Google Scholar] [CrossRef]
- Sidorov, S.P.; Faizliev, A.R.; Balash, V.A.; Gudkov, A.A.; Chekmareva, A.Z.; Levshunov, M. QAP Analysis of Company Co-mention Network. In International Workshop on Algorithms & Models for the Web-Graph; Springer: Cham, Switzerland, 2018. [Google Scholar] [CrossRef]
- Yin, J.; Zhen, F.; Wang, C.H. China’s city network pattern: An empirical analysis based on financial enterprises layout. Econ. Geogr. 2011, 31, 754–759. [Google Scholar] [CrossRef]
- Zhang, W.; Derudder, B.; Wang, J.; Witlox, F. An analysis of the determinants of the multiplex city networks in the Yangtze River Delta. Tijdschr. Econ. Soc. Geogr. 2019. [Google Scholar] [CrossRef]
- Zhang, M.D.; Xiao, H.; Sun, D.Q.; Li, Y. Spatial Differences in and Influences upon the Sustainable Development Level of the Yangtze River Delta Urban Agglomeration in China. Sustainability 2018, 10, 411. [Google Scholar] [CrossRef]
- Wang, T.; Hennemann, S.; Liefner, I.; Li, D. Spatial structure evolution of knowledge network and its impact on the NIS: Case study of biotechnology in China. Geogr. Res. 2011, 30, 1861–1872. [Google Scholar] [CrossRef]


 represents a type I city,
  represents a type II city,
  represents a type III city,
  represents a type IV city. The green surrounding the red node refers to the research of Li et al., and to a certain extent represents the urban hinterland. [14].
represents a type I city, represents a type II city, represents a type III city, represents a type IV city. The green surrounding the red node refers to the research of Li et al., and to a certain extent represents the urban hinterland. [14].
represents a type IV city. The green surrounding the red node refers to the research of Li et al., and to a certain extent represents the urban hinterland. [14].
represents a type I city, represents a type II city, represents a type III city, represents a type IV city. The green surrounding the red node refers to the research of Li et al., and to a certain extent represents the urban hinterland. [14].

| Stage of Development | Discrete | Point-Axis Diffusion | Core-Periphery | Polycentric Network |
|---|---|---|---|---|
| Spatial structure |  |  |  |  |
| Explanatory Variables | Correlation/Regression Coefficient | |||
|---|---|---|---|---|
| QAP Related Analysis | QAP Regression Analysis | |||
| Correlation Coefficient | P | Regression Coefficients | P | |
| Differences in economic development | ||||
| Per capita GDP | −0.123 * | 0.029 | 0.015 ** | 0.033 |
| Square of GDP per capita | −0.215 * | 0.055 | −0.012 ** | 0.037 |
| Tertiary industry output value | 0.210 ** | 0.017 | 0.201 ** | 0.048 |
| Fixed asset investment | −0.046 ** | 0.374 | −0.091 ** | 0.026 |
| Differences in financial development | ||||
| Financial-related ratios | 0.182 ** | 0.029 | 0.026 * | 0.051 |
| Differences in institutional development | ||||
| Local government fiscal expenditures | 0.062 * | 0.370 | −0.078 * | 0.091 |
| Geographical proximity | ||||
| Administrative relations | −0.049 ** | 0.014 | −0.025 | 0.337 |
Publisher’s Note: MDPI stays neutral with regard to jurisdictional claims in published maps and institutional affiliations. |
© 2020 by the authors. Licensee MDPI, Basel, Switzerland. This article is an open access article distributed under the terms and conditions of the Creative Commons Attribution (CC BY) license (http://creativecommons.org/licenses/by/4.0/).
Share and Cite
Zhang, Y.; Wang, T.; Supriyadi, A.; Zhang, K.; Tang, Z. Evolution and Optimization of Urban Network Spatial Structure: A Case Study of Financial Enterprise Network in Yangtze River Delta, China. ISPRS Int. J. Geo-Inf. 2020, 9, 611. https://doi.org/10.3390/ijgi9100611
Zhang Y, Wang T, Supriyadi A, Zhang K, Tang Z. Evolution and Optimization of Urban Network Spatial Structure: A Case Study of Financial Enterprise Network in Yangtze River Delta, China. ISPRS International Journal of Geo-Information. 2020; 9(10):611. https://doi.org/10.3390/ijgi9100611
Chicago/Turabian StyleZhang, Yizhen, Tao Wang, Agus Supriyadi, Kun Zhang, and Zhi Tang. 2020. "Evolution and Optimization of Urban Network Spatial Structure: A Case Study of Financial Enterprise Network in Yangtze River Delta, China" ISPRS International Journal of Geo-Information 9, no. 10: 611. https://doi.org/10.3390/ijgi9100611
APA StyleZhang, Y., Wang, T., Supriyadi, A., Zhang, K., & Tang, Z. (2020). Evolution and Optimization of Urban Network Spatial Structure: A Case Study of Financial Enterprise Network in Yangtze River Delta, China. ISPRS International Journal of Geo-Information, 9(10), 611. https://doi.org/10.3390/ijgi9100611