1. Introduction
Several applications have been introduced in recent years based on the usability of Geographic Information Systems (GIS) in synergy with a wide range of spatial tools that seem to provide solutions for public concerns, such as public health data analysis. In epidemiology or in a disease outbreak investigation, a geodatabase—a spatial database designed to store, query, and manipulate geographic information and spatial data—can be designed and constructed, without significant workload [
1]. Geographically referenced information regarding the location of cases, potential sources and likely directions of epidemic spreading in order to define dispersion patterns and rates, can be provided efficiently via digital mapping [
2].
It has been in the last few decades or so that GIS platforms became more user friendly, gradually migrating from desktop to the web, making it much more efficient and faster in reaching out answers or information products. Thousands of organizations are taking advantage of their location intelligence technology, as an integral part of their preparedness and response activities [
3]. Nowadays, the development of an increasingly high number of geoinformation algorithms and, especially, the establishment of online software operation through high-speed network infrastructures, gives the opportunity of real-time big data acquisition and processing, breaking new ground for innovative applications.
Regarding public health, GIS were initially used mainly in health planning in either qualitative way or following a quantitative approach as a supplementary method for improving health services or for modelling physical access to health care facilities [
4]. Another common use of GIS includes applications for disease surveillance mapping in order to keep tracking infections in long or short time periods [
5]. In particular, the term “disease mapping” has been introduced for the better understanding of the geographical distribution and the epidemic spread in the past or present [
6]. For predicting the potential disease spread [
3] along with the study of the required parameters that may affect an ongoing contagion, usually a disease modelling is carried out which is largely based on GIS maps and spatial statistics [
7,
8]. The interactivity of digital mapping and the overlaying of geographical, medical, anthropological, environmental, etc., data, along with the ability of easily changing scales of observation, have proved to be ideal for developing scenarios and recognizing relationships and spatial patterns. It has become crucial for epidemiological studies to collect data and analyze the spreading spatial patterns of a disease. Especially the mapping of disease-specific deaths caused by infectious viruses like Ebola and Zika, proved to be very helpful by providing different analytic tools and methods to turn raw data into critical information. Thus, medical geography has become essential, being regenerated by merging geographical science tools and practices within specific medical topics [
9].
Today, the imperative necessity for spatial data, as the COVID-19 disease spreads around the world, has led the scientific community and decision makers to design and implement applications based on GIS philosophy for mapping its progress and even providing real-time information to medical institutions, health systems and the public. Since this novel virus keeps spreading, it is the online, continuously refreshing digital maps that are used by the World Health Organization [
10] and other research groups (e.g., Johns Hopkins University [
11]), for real-time monitoring of new cases and related deaths, taking into consideration the economic, demographic, social and ecological prerequisites coming in various data formats (spreadsheets, web services, big and unstructured data) and from several sources. The GIS platforms help integrating and maintaining these datasets and on top of that provide geographic location, ensuring that the received information is always updated and reliable. They also support the analysis of medical care availability data, infection rates and mortality figures in a more quantitative way [
12].
The close observation of the spatio-temporal evolution of the COVID-19 disease is crucial for public health officials for monitoring the stage of the disease, since it is preceded by a time frame in which exposure and latency pass without revealing any symptoms. Towards this end, the GIS tools seem to be quite efficient for the timely identification of high-risk regions and hot spots and for feeding spread models with the necessary parameters [
13]. They can also identify community susceptibilities and risks, such as critical infrastructure gaps and vulnerable populations, with higher accuracy in space and time [
14].
The COVID-19 pandemic made clear that the understanding of the spatiotemporal dynamics of this disease is critical for its mitigation, as indicated by multiple health geography studies [
15]. The construction of quite a few GIS dashboards, which are updated multiple times per day, make the processed information available in a clear and efficient way, as the world relies on this particular information [
16] that can aid decision making, planning and community action. They have been also used by decision-making officials as an obvious argument to persuade the public for rapid measures related to travel bans and quarantines, by providing explicit spatial and temporal visualizations [
17]. The analyzed data are shared with the community through very sophisticated web sites and visualizing tools, worldwide and in Greece (e.g., Stavros Niarchos Foundation [
18], National & Kapodistrian University of Athens [
19]). GIS proves to be, among others, a very efficient and time-saving tool for providing situational awareness and, therefore, moving the necessary resources to the right places at the right times for supporting impacted areas and protecting human lives [
20].
2. Crowdsourcing: Taking GIS One Step Forward
As the need for faster, updated and location-wise data becomes a prerequisite for the operational use of GIS and in order to enhance data resources, a new term for real-time data collection has been introduced in the last few years: “
Crowdsourcing”, which is an emerging and powerful information procurement [
21]. Initially, it was referred to as volunteered geographic information (VGI) [
22,
23,
24,
25], social computing, collective intelligence or human computation [
26], through which several small pieces of information are requested from the crowd. It is a procedure for promptly collecting unfiltered raw data during emergency situations from a large, relatively open and often rapidly evolving group of web users. This task-oriented system provides a classification and characterization of statements by volunteers for the quick identification of a state [
27].
Crowdsourcing has become a powerful tool for a large number of data providers to contribute with information during crisis events and feed a specially designed platform for collecting, analyzing and displaying the information in a straightforward way. The added value of crowdsourcing on a GIS platform is the recording of the geolocation of the responder simultaneously with the other pieces of information. Since the geolocated data are sent via a mobile device that can be anywhere on the globe (as smart phones are equipped with global positioning systems), the value of the information increases [
22], especially during natural disasters and the subsequent crisis management [
3]. For example, crowdsourcing was widely used at 2010 Haiti earthquake, when trapped people shared messages and photos via social media networking, but not via a dedicated application. We should also mention the crowdsourcing risk management application for floods in the Brazilian territory [
28], or even more generalized information collection systems developed for disaster monitoring [
29], organizing and making lots of unstructured “big data” contributions usable [
30].
During the COVID-19 disease outbreak, several crowdsourcing applications were deployed and sent to the public, aiming at the entire population of a region or a group with specific vulnerabilities, such as cancer patients [
31], and surveying approaches either in local or more international level. Crowdsourcing data provide updated information within this continuously and dynamically changing situation [
32], by developing applications (Apps) for gathering and exchanging information related to the epidemic [
33], within minutes. For example, an App aiming to fill gaps in coronavirus spatial data is Opendemic [
34], which allows users to anonymously share their locations and relate COVID-19 symptoms health status aiming to receive alerts about other nearby cases, both potential and verified. Its developers, having in mind the lack of test kits, relied on self-reporting, by building a database open to public health authorities to be used in addition to the data they already have, in order to make decisions about the appropriate interventions. On the other hand, having a low rate of testing, which keeps the number of confirmed cases small, can mislead people causing a false sense of safety, so a secondary goal of the App is to make individuals stay alert.
Flusurvey [
35] is a hybrid App/Website, where any member of the UK public can register on the platform to report any symptoms they may experience, for being used by researchers at Public Health England and London School of Hygiene and Tropical Medicine to monitor disease trends in the UK. Similarly, the COVID Symptom Tracker [
36], developed in King’s College London, where people asked to self-report daily, even if they are well, aiming to identify high-risk areas in the UK and who is most at risk, by better understanding symptoms linked to underlying health conditions and how fast the virus is spreading in users’ area. However, it should be emphasized that this type of contact-tracing applications raises ethical and social considerations that must not be neglected [
37].
Another effort is led from the University of Maryland (COVID-19 Symptom Survey; [
38]), where a voluntary survey is conducted as part of a research study aiming to gain a better public understanding of where and how the coronavirus pandemic is spreading. The survey uses Facebook data to create a random ID and a statistical number that help to correct sample bias.
In addition, the anonymous COVID-19 Tracking Switzerland App/Website [
39] aims to collect as much data, as quickly as possible, for as many days as possible, and to provide a more detailed picture of the COVID-19 situation in different parts of the country. This effort is accompanied by a map showing categorized results of the survey as well as summary statistics and trends by region.
Finally, a different crowdsourcing app is Folding@home [
40], which is a distributed computing project for simulating protein dynamics, aiming to uncover novel protein structures of SARS-CoV-2 and how the human proteins interact with the virus. It relies on the collective power of volunteers’ home computers from all around the world to perform the complex calculations required, by installing a software program that runs the calculations when the computer otherwise would sit idle.
The current COVID-19 pandemic made clear that if public health experts can identify individuals who are infected as early as possible in the outbreak, there is a better chance of stopping its spread and minimizing its impact. At the beginning of the pandemic, there was (and still is, at many places around the globe) a limited capacity to reach people for mass testing; thus, a crowdsourcing application which residents could use to anonymously self-report their health status regularly could be significantly beneficial. This information could be of great use for the authorities to find out where gaps in confirmed cases are and locate areas where people are self-reporting symptoms, helping them to stay on top of emerging hot spots and identify targeted areas for intervention [
39].
Therefore, a respective crowdsourcing application for the Spatial Recording of COVID-19 Spread over Greece was developed by the Department of Geology and Geoenvironment, National and Kapodistrian University of Athens and is presented here along with the analysis of the collected data.
Our goals were:
To locate geographically those who feel they have symptoms, taking under consideration the possible inability to be tested and the likelihood of mild disease;
To determine the proportion of citizens who feel they have the symptoms and to detect any temporal changes in the answers (either from “No” to “Yes” or vice versa);
To familiarize citizens with these new technologies and to encourage public participation in emergency situations;
To share the results, if necessary, with the competent authorities for public interest; and
To assess the added value of crowdsourcing data in mapping the spatial distribution of a disease, rather than collect medical data that may have low objective value.
The novel aspect of this application is that it tried to respond as soon as possible to the challenges posed by a previously unseen global health crisis. Specifically, in Greece, no such application has been created and introduced for urgent situations, but only for everyday life issues on a local scale. Thus, we considered important to investigate how citizens will respond in such kind of technology and how the gathered information can be of value to the health/public authorities.
3. Materials and Methods
Due to the urgent circumstances, a commercial software was selected to create a survey and collect crowdsourcing data rapidly. Survey123 for ArcGIS (
https://survey123.arcgis.com/), which is part of the ESRI Geospatial Cloud and being a form-centric solution for creating, sharing and analyzing surveys was used. Data can be collected via smart phone devices, laptops, or desktops as a native App and via a browser, even without a stable internet connection. Moreover, it provides a quick analysis of the data, while captured data are immediately available in the ArcGIS platform for further analysis.
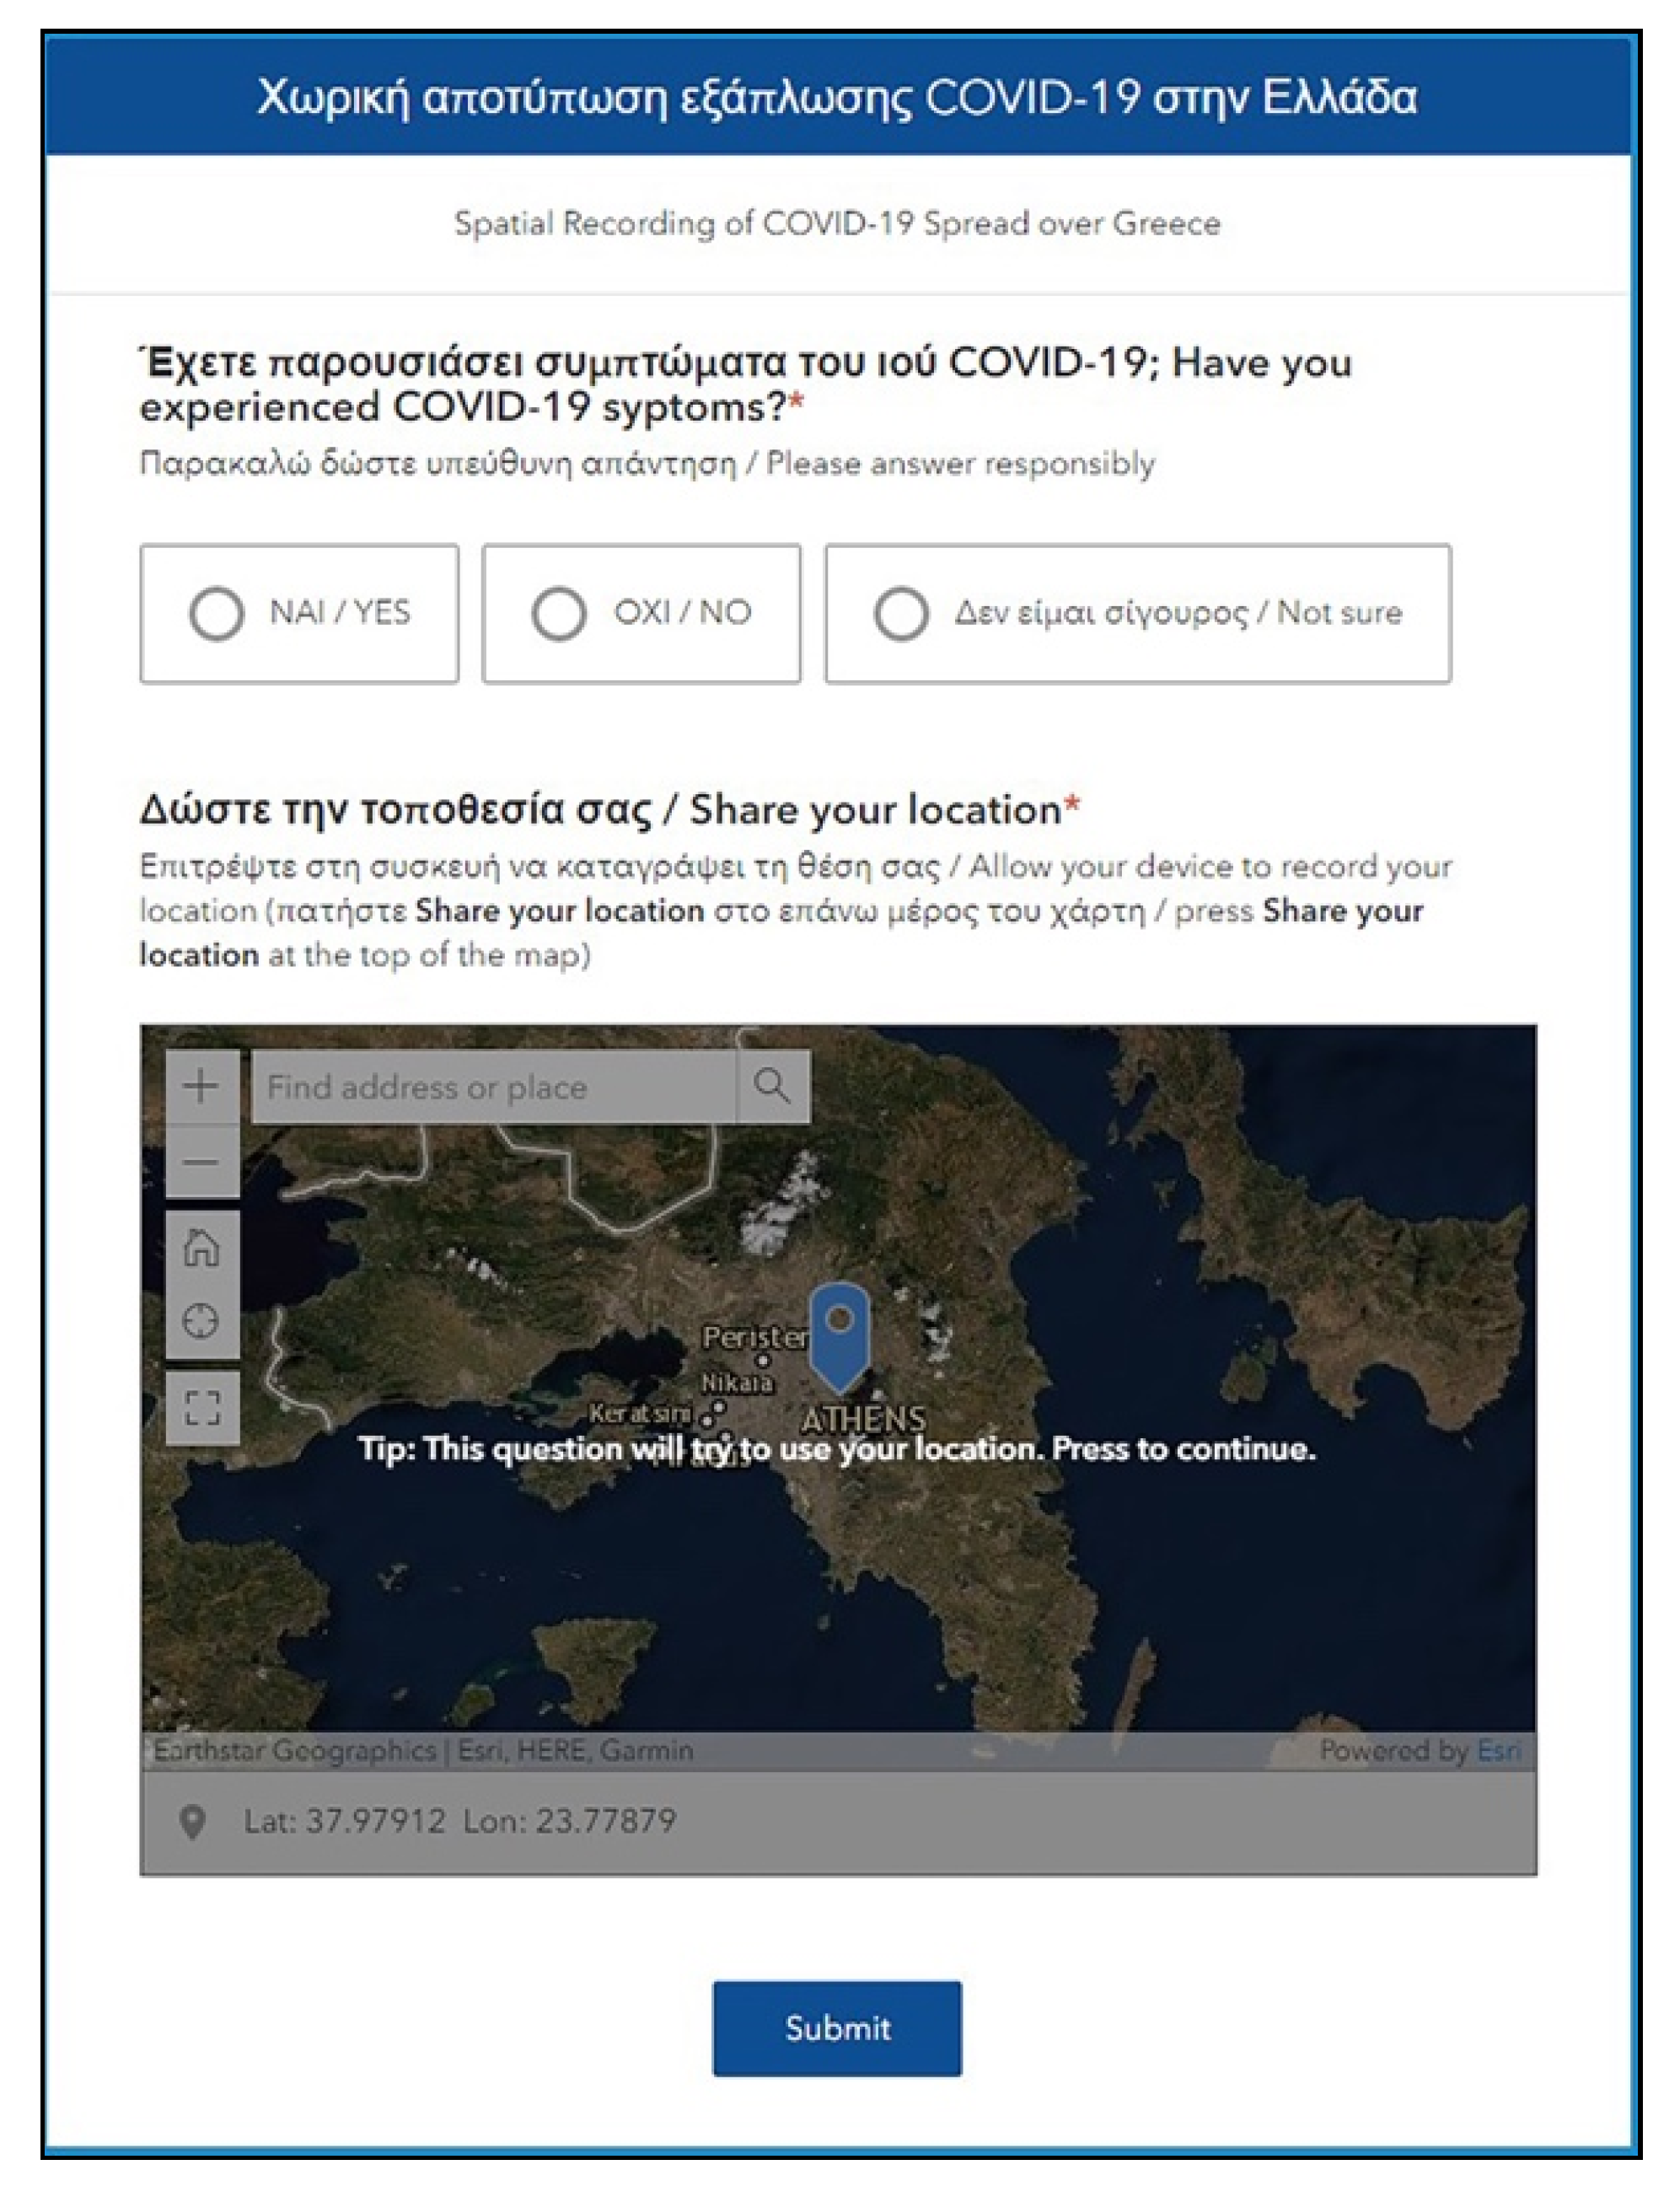
In the survey, a single closed-ended question was posted via a web app formulated as “Have you experienced COVID-19 symptoms?”, with the participants having to select among three predefined options, i.e., No, Not Sure and Yes. Being a research survey focusing on the applicability of crowdsourcing in emergency public health situations, having only one question to be answered, it made it easy and fast to conduct. This facilitated the extensive participation of the citizens who avoid, in general, engaging in questionnaires when too many questions are involved, preferring an easy survey-taking experience. Additionally, as at that point there were only three symptoms attributed to COVID-19 disease (fever, dry cough, shortness of breath), it was not deemed necessary to specify the symptoms in the question. However, if the survey is to be recirculated an updated list of symptoms should be added in the question.
Apart from the question to be answered, the users had also to share their location, either by allowing their device to locate it or by entering a position in the provided map (
Figure 1). Regarding participants’ personal information, only the location and the selected answer were recorded, along with a serial identification number. No other information was recorded that could disclose any personal information of the participants.
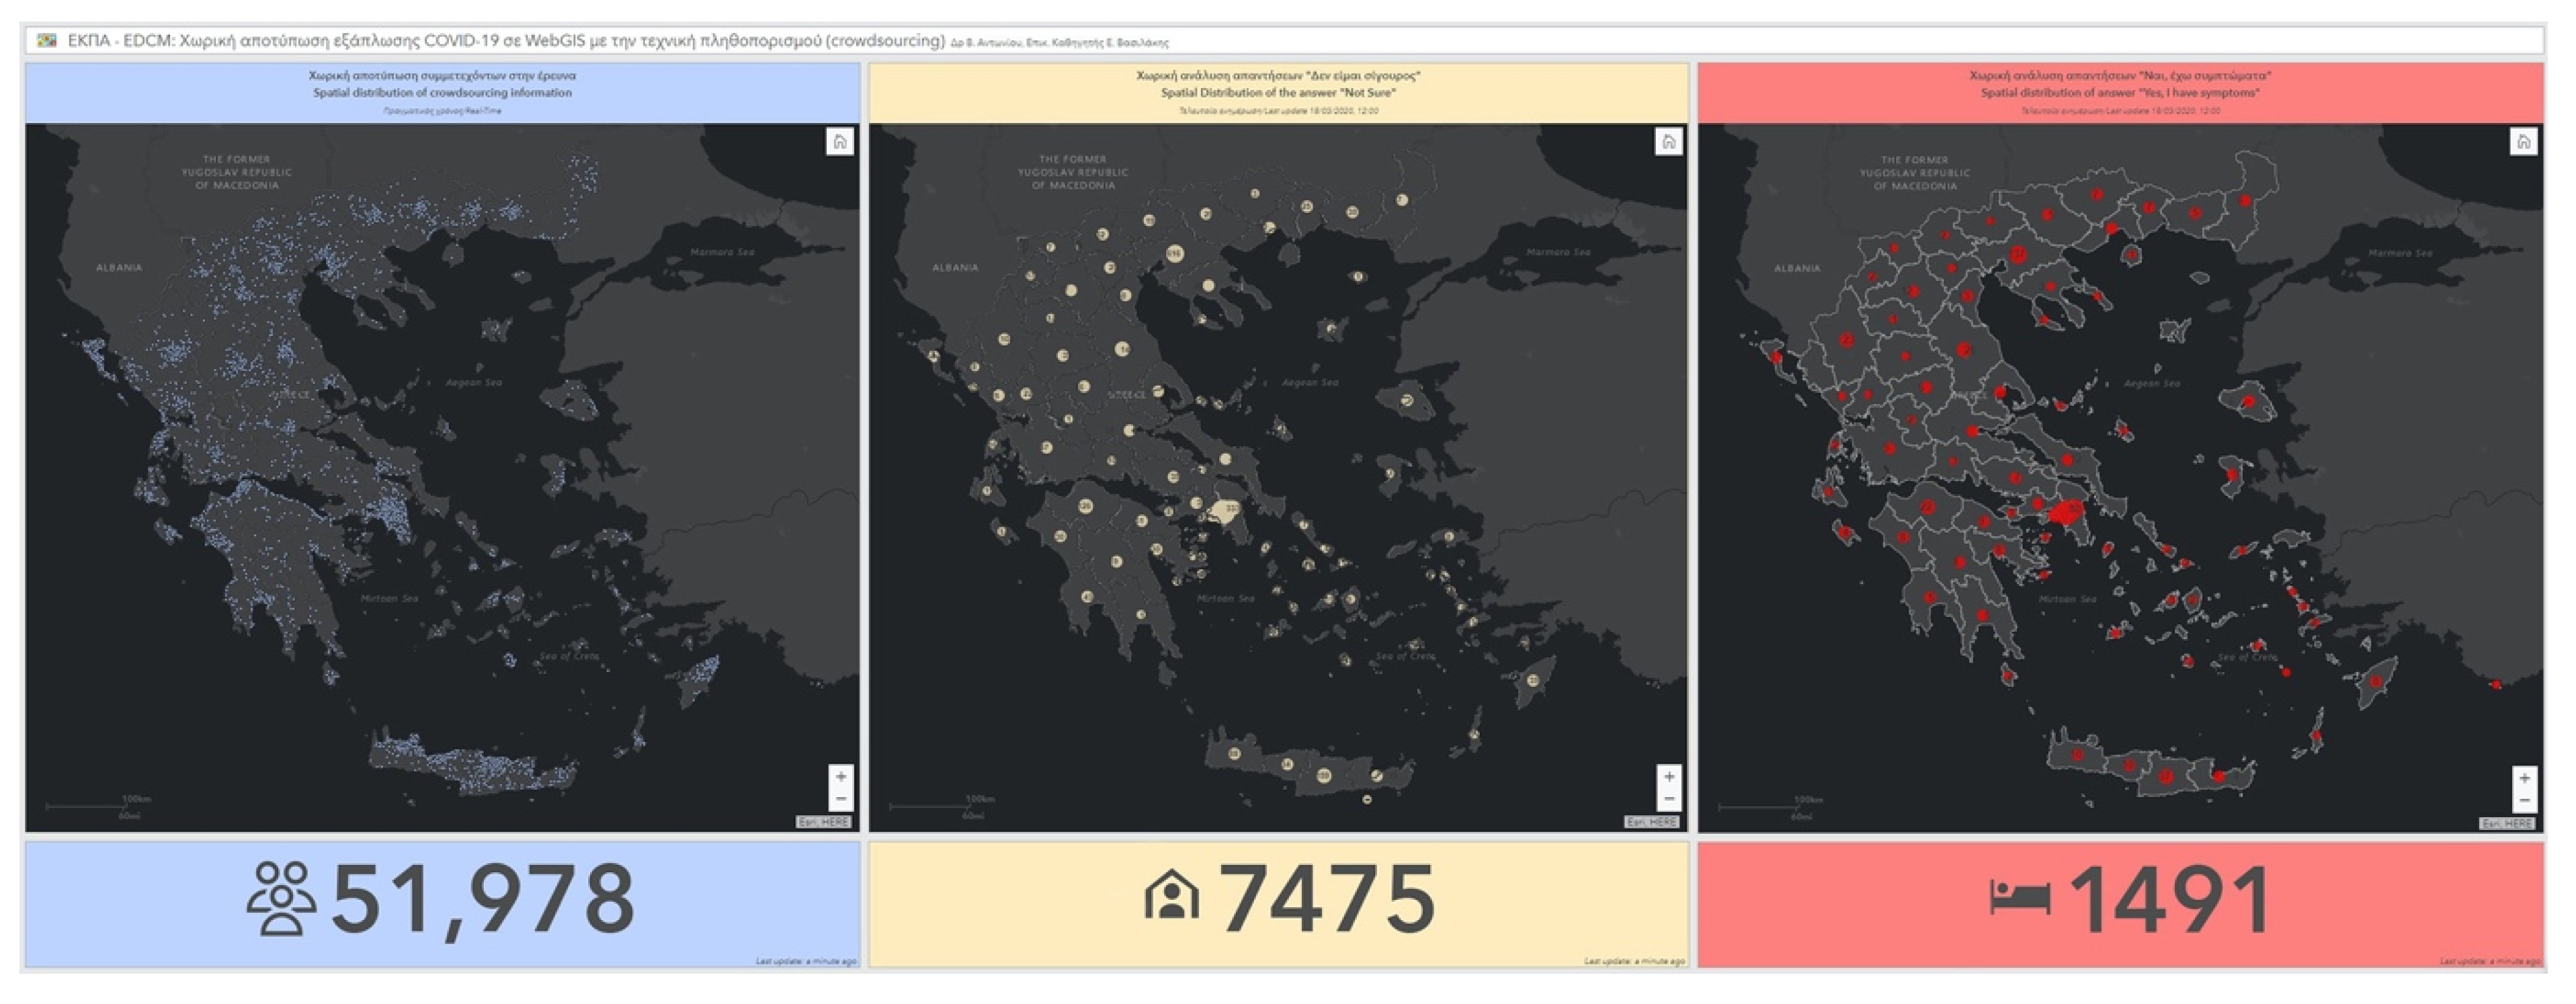
The survey was launched on the 16th of March 2020 via social media, business or personal e-mails and a press release to the media, while a couple of TV interviews were given. No other advertisement was made during the survey. In order to keep the users alert to respond again if their health condition change, a dashboard was created showing quickly analyzed results. The analysis was performed every 3 h, but the spatial distribution of the entries, as well as the indicators for each answer option (No, Yes, and Not Sure) were displayed at the public dashboard in real time (
Figure 2). The location privacy of the responders was assured by setting the appropriate definition of visibility range, through the design of the App. The survey kept on collecting data throughout the first wave of the epidemic, but the last online publication of the analysis results and the update of the dashboard’s information was on the 18th of March, 12:00 (EET). Due to the fact that the participation was unexpectedly high, we made the decision to discontinue public access to the data in order to be able to carefully process them and, most importantly, to avoid any misinterpretations by the public. Moreover, the publication of the results at that point, while the research was still in progress, could lead to a malicious or one-sided interpretation and introduce biased answers. It should be added that the increased participation exceeded the survey’s license capability, causing temporarily difficulties in launching “Survey123” interface and delays in the analysis. This could be overcome by an advanced commercial license.
In order to validate the survey data in the sense that the positive (Yes) answers coincided geographically with the COVID-19 cases or with highly populated areas, the demographic characteristics of Greece, as well as the officially confirmed COVID-19 cases and deaths, were taken under consideration (
Table 1). It should be added that the Greek territory is administratively divided in 13 Regions consisting of 74 Regional Units (NUTS 3 level; Regional Units and combinations thereof are largely equivalent to the former Prefectures), further divided in 332 Municipalities. For this end, a linear regression (via ArcGIS Ordinary Least Squares) was performed, considering the survey’s positive answers as dependent variable and the number of confirmed cases, population and population density as the explanatory variables, aiming to examine and explore any spatial relationships among them. However, it should be emphasized that the officially confirmed COVID-19 cases and deaths during the period of the survey were recorded on Region Unit level, thus, a higher spatial resolution analysis was not possible.
Finally, a comprehensive statistical analysis on the collected data (survey responses) was performed. The temporal variations of the ratios of each answer option (i.e., “No”, “Not Sure”, “Yes” over the total number of responses) were examined on the basis of their differences between consecutive days performing the test hypothesis and significance of proportions. The test compares two samples’ proportion of “successes” under the null hypothesis that there is no difference between the populations of the derived samples, i.e., the proportion of a certain answer option does not change statistically significantly between two consecutive days. The differences of the proportions follow approximately normal distribution and are tested at a selected level of significance by calculating the respective z-score [
41]. Furthermore, the spatial variations and the potential existence of spatial clustering of answers were investigated via hot spot analysis [
42,
43] involving the ArcGIS Hot Spot Analysis tools.
All the above analyses were performed for the entire Greek territory and for each Region, respectively. Special focus was given to the Regions of Attica and Central Macedonia, as these two Regions combined concentrate about 52% of the entire population of the country.
4. Results
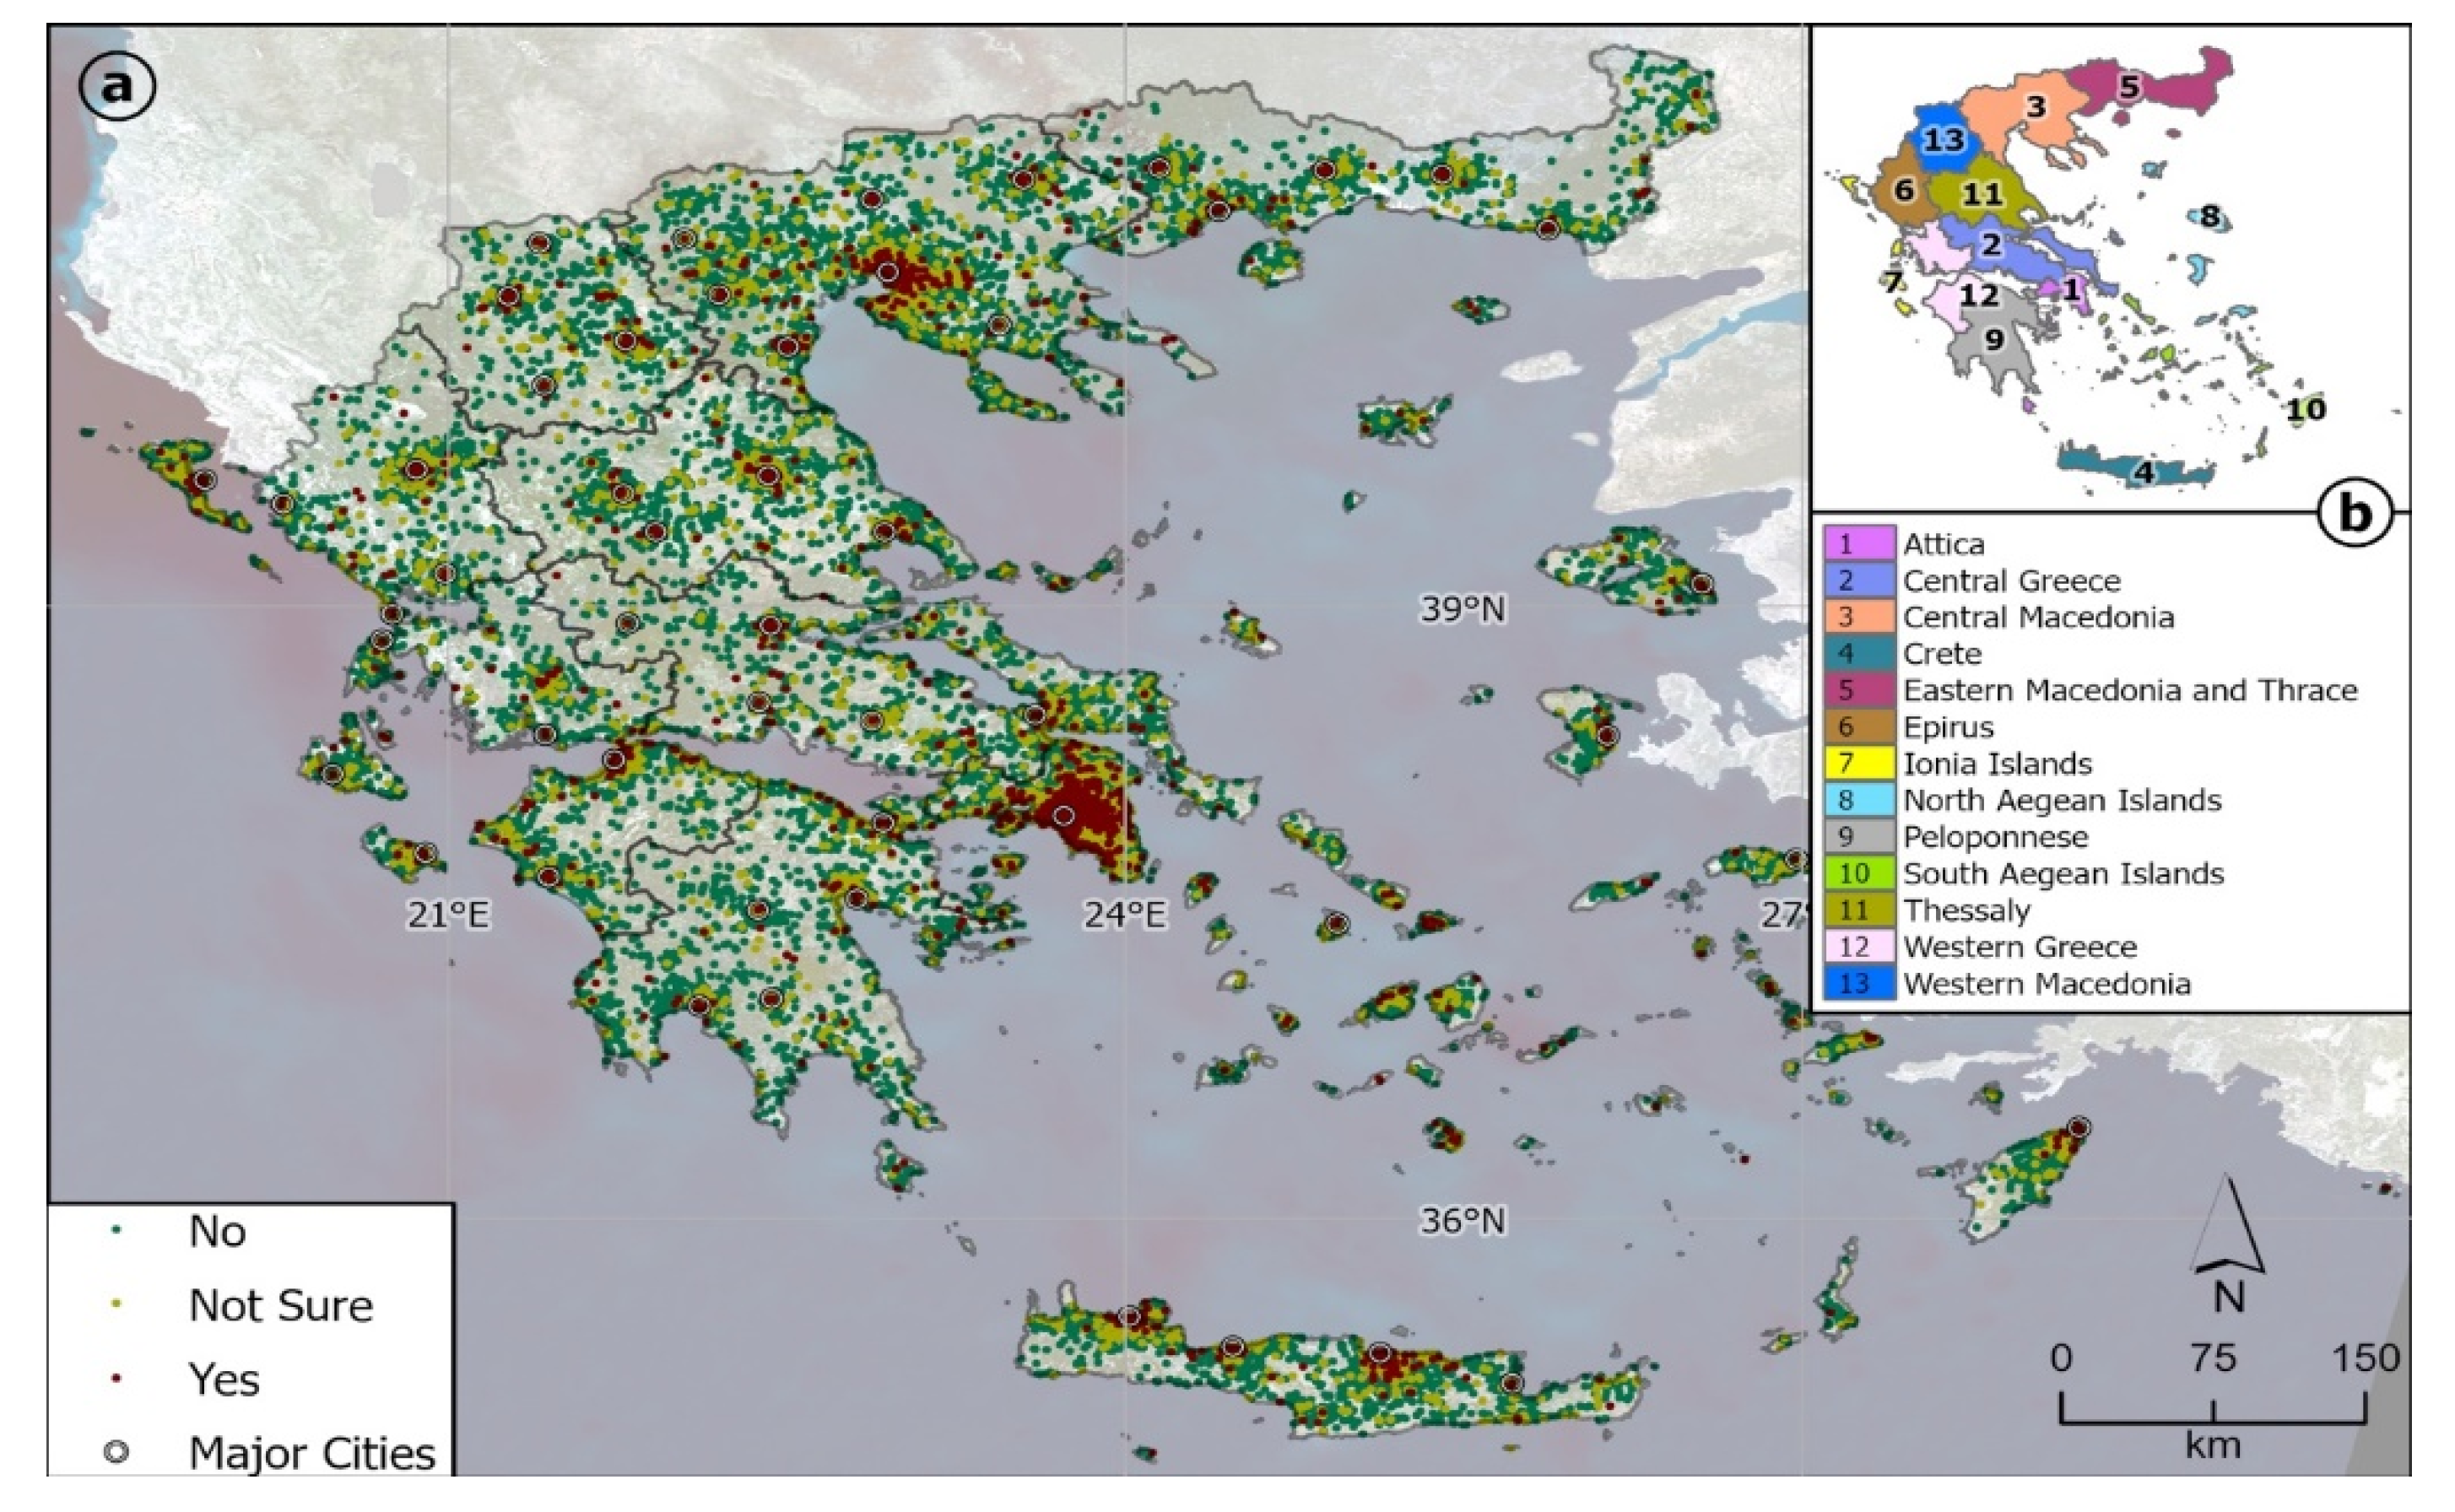
The survey is still active, but for statistical analysis purposes the first one-month period was selected (16/03/2020 till 16/04/2020). In this period, 212,715 responses were received. Although the survey was conducted for Greece, several responses were located worldwide, as well as offshore; thus, an initial step employing data engineering was important. Specifically, from the 212,715 entries, 207,762 were onshore and 4953 were offshore. The latter were excluded from the statistical approach, although many of them might have been responses from people either travelling by boat (since the total lockdown had not been applied yet) or some responders were using low-precision GPS mobile devices. From the onshore data, 205,993 entries were located in Greece (
Figure 3), while there were entries from abroad, mainly from Europe (most of them in Cyprus, Germany and the UK). All entries from abroad have been excluded from the subsequent analyses. Regarding responders’ location in Greece, the majority of the entries, are distributed within the Region of Attica (121,284) and the Region of Central Macedonia (25,549), which are the most densely populated Regions of Greece (see
Figure 3,
Table 2). Even though these two areas are discussed in more detail, similar analysis was made for all 13 Regions of Greece. Responses are well distributed within each Region, covering almost its entire area, with the majority of positive answers (Yes) to be more or less received from the higher populated big cities.
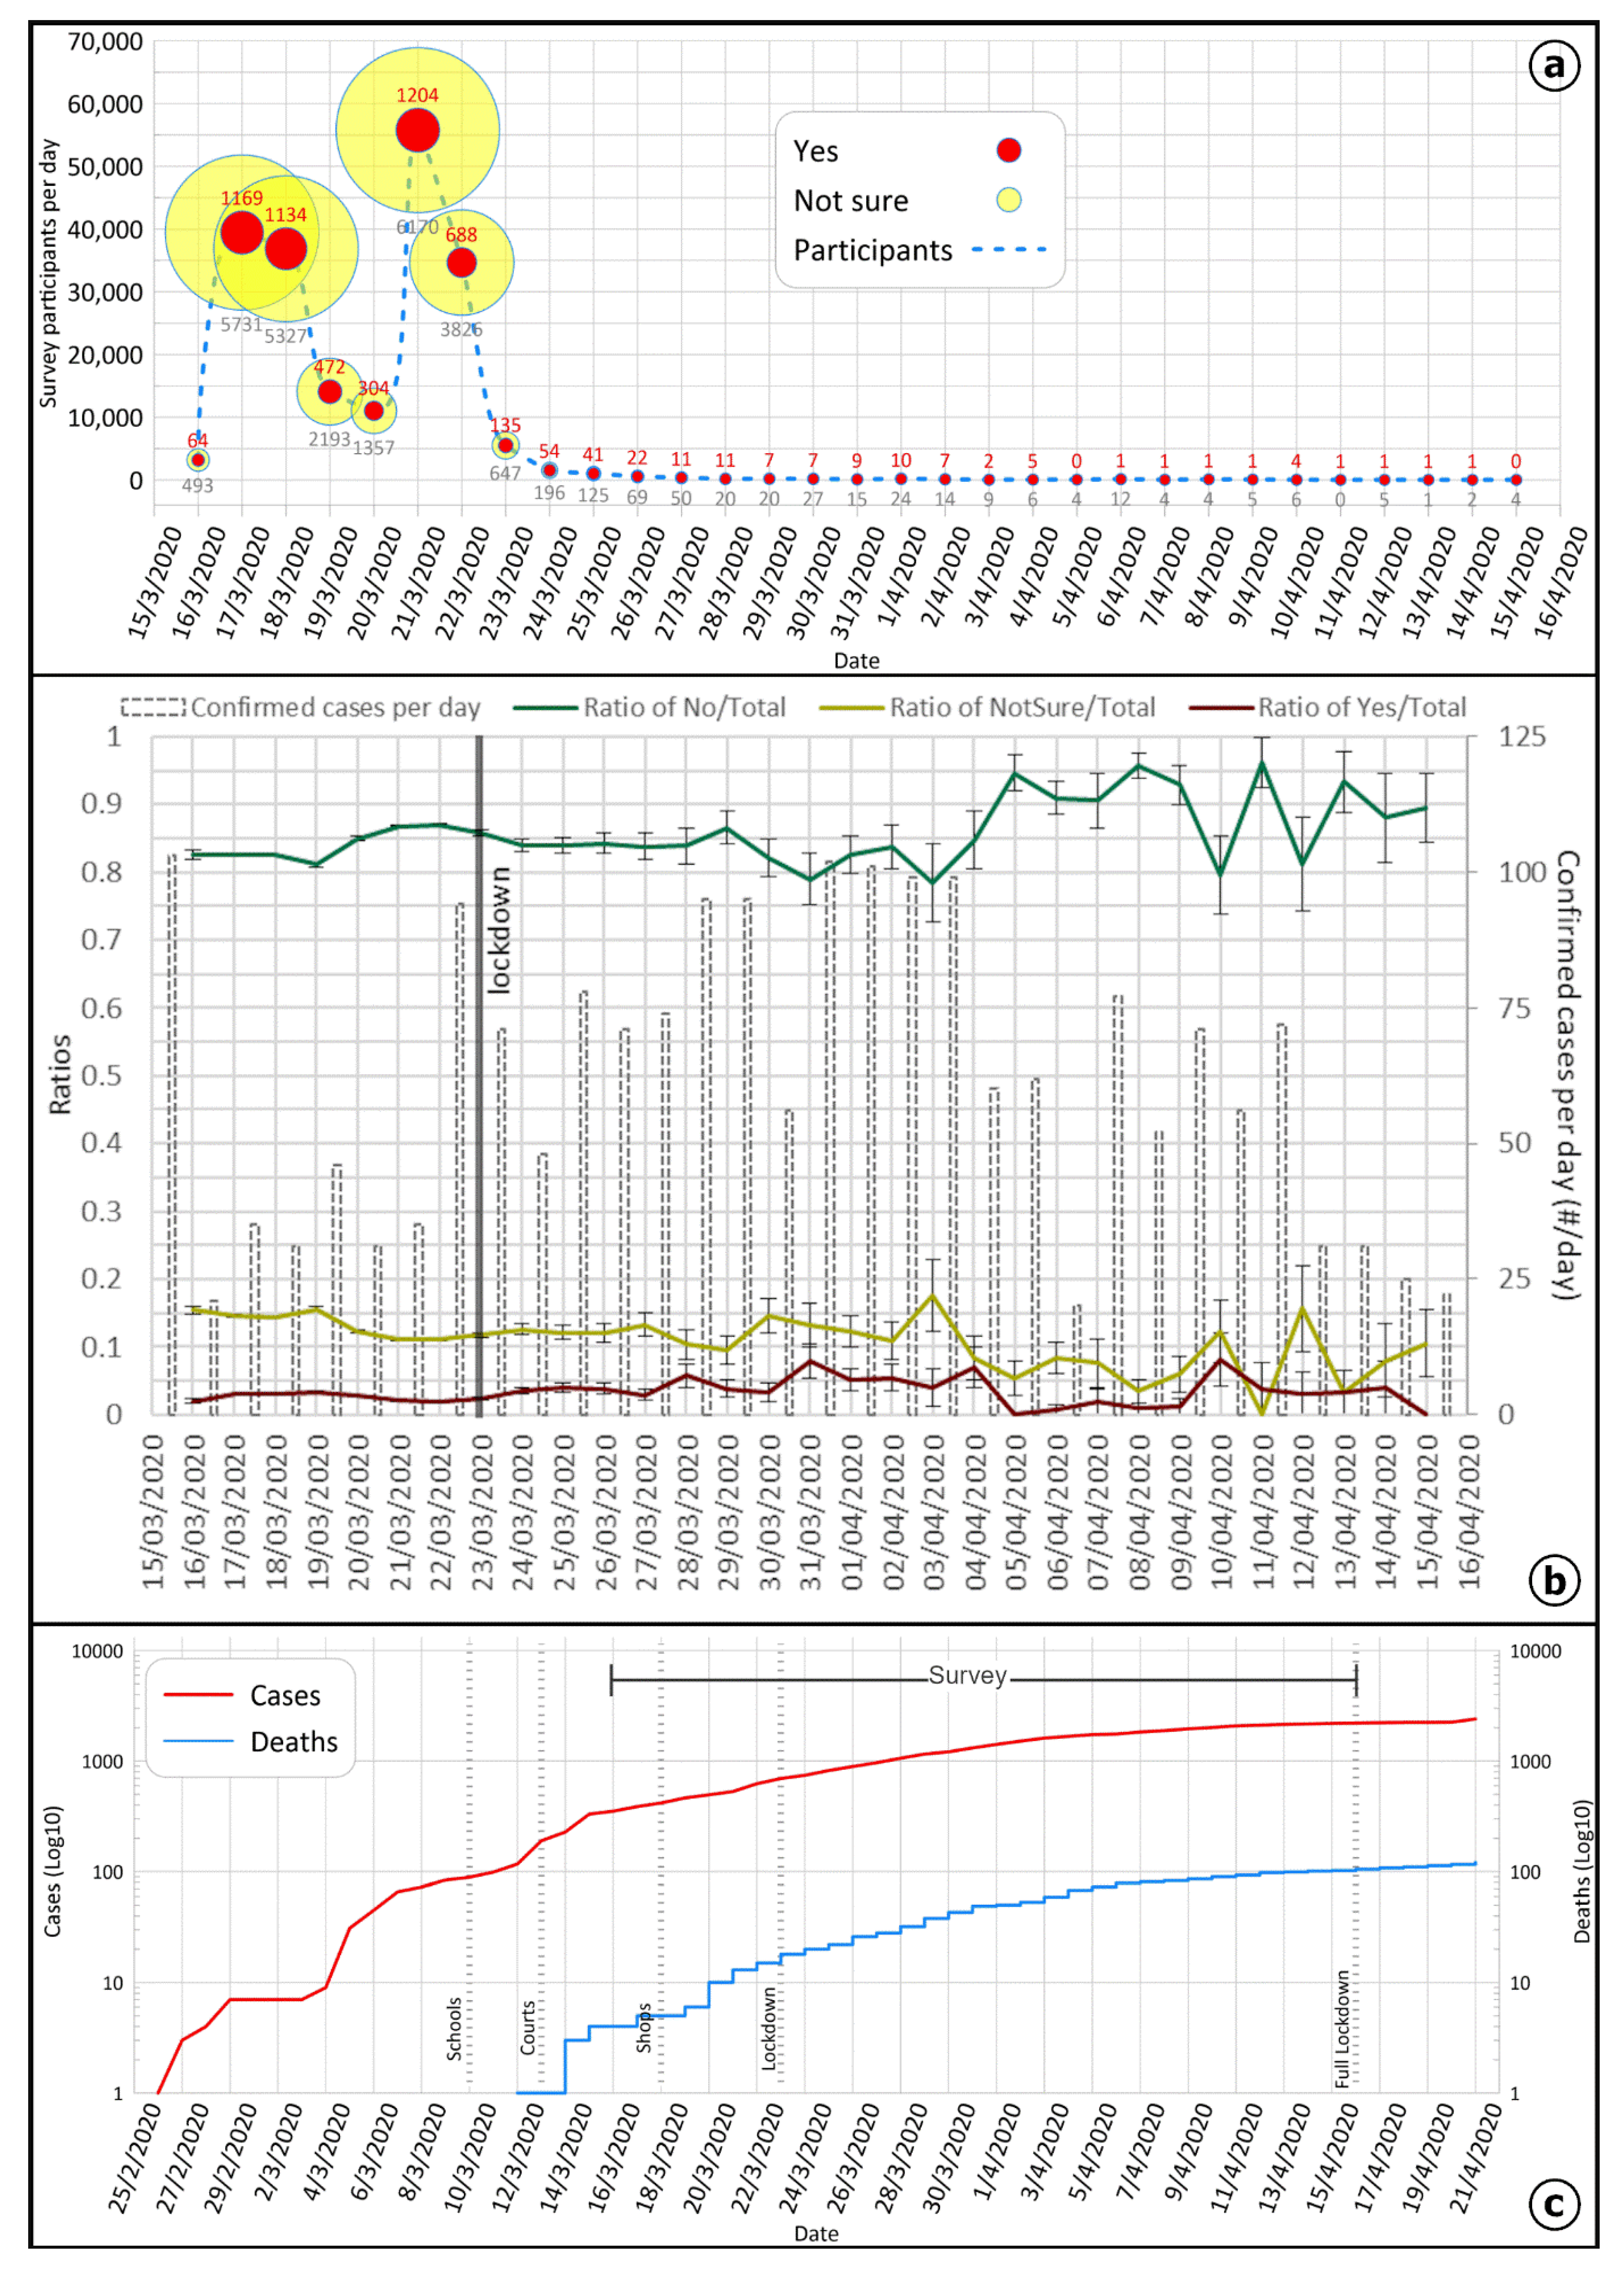
Even though the data of the first month are presented here, the first eight days (from 16/03/2020 to 23/03/2020) of the survey that include the greatest number (97,4%) of entries are retained for the subsequent statistical analysis, as the participation sharply dropped after 23/03/2020 (see
Video S1 in Supplementary Materials). Three milestone days can be highlighted: the second and the third day of the survey, i.e., 17th and 18th of March 2020, where 39,459 (19% of total entries) and 36,881 (18% of total entries) people responded to the survey, respectively, as well as the sixth day of the survey (21th of March), where the maximum number of entries was recorded, with 55,826 (27% of total entries) of the responses. Finally, out of the total responses (205,993): (a) 174,257 (84.6%) responded that they had no symptoms (No), (b) 5368 (2.6%) that they had symptoms (Yes) and (c) 26,368 (12.8%) said that they were not sure (Not Sure) (
Figure 4).
To aid the validation and further analysis of the data and, subsequently, to attempt the spatial tracking and temporal evolution of the COVID-19 epidemic, we collected and curated individual-level data from national, regional, and municipal health reports, as well as additional information from online reports (see
Table 1). The detailed, real-time and reliable data for emerging disease outbreaks are of high-importance and can help to generate robust evidence for the support of public health decision making. However, we should clarify that the practice of the Hellenic Ministry of Health, since the emergence of the pandemic in Greece, is to provide data of confirmed cases/deaths on a coarse spatial level, i.e., on Regional Units, which cover an area of ~1800 km
2 on average. Thus, this did not facilitate us to spatially connect the survey responses to any concentrations of confirmed COVID-19 cases.
Nonetheless, for getting a better insight on possible spatial relationships, we correlated the number of positive answers (Yes) with the population density on a Regional Unit level. The regression analysis showed that the positive answers (Yes) are statistically significantly (a = 0.01) related to the population and to the confirmed cases of the Regional Units, with the over- and under-prediction of the model for some Units (not shown) indicating that one or more explanatory variables are missing from the model.
In order to have a better insight of the temporal evolution of the participants’ perspective on their health condition and as the numbers of participants were gradually decreasing, the corresponding ratios of the different answer options were calculated for each day of the survey. Overall, the percentage of “No” over total answers is 84.6%, while the percentages of “Not Sure” and “Yes” were 12.8% and 2.6%, respectively (
Figure 4).
Regarding the daily ratios of the answers, it was found that there is a constant variation of the ratios in participants’ answers for the first 8 days of the survey, during which the population awareness regarding the progress of the COVID-19 pandemic was at the highest levels. Specifically, from 16 to 17/03/2020, the ratio of “Yes” increases significantly (a = 0.01), without any noticeable change in other two options of answers. At the same time, while the number of participants increased over one order of magnitude, the number of “No” increased at about 20 times. Two days later, from 18 to 19/03/2020, a virtually certain increase (a = 0.01) of “Not Sure” against “No” was recorded. Though from 19 to 20/03/2020 and from 20 to 21/03/2020, “Not Sure” and “Yes” substantially drop (a = 0.01), just to rise again two days later on the first two days of the lockdown (from 22 to 24/03/2020), with a statistically significant increase (a = 0.05) of “Yes”. It should be noted that 22/03/2020 is the day when the total lockdown was announced and the number of confirmed cases sharply increased. This change from No to Yes/Not Sure could be attributed to an actual change of people feeling or having the symptoms, connected with the actual increase of cases mainly in highly populated areas, or in their latent fear that they may have been infected; though, the latter assumption could be assessed only through a sociological or psychological analysis which cannot be performed with the available data of this study.
Any temporal changes in later days, even statistically significant, are not discussed as the number of participants is relatively small compared to the first eight days of the survey and, thus, more susceptible to biases.
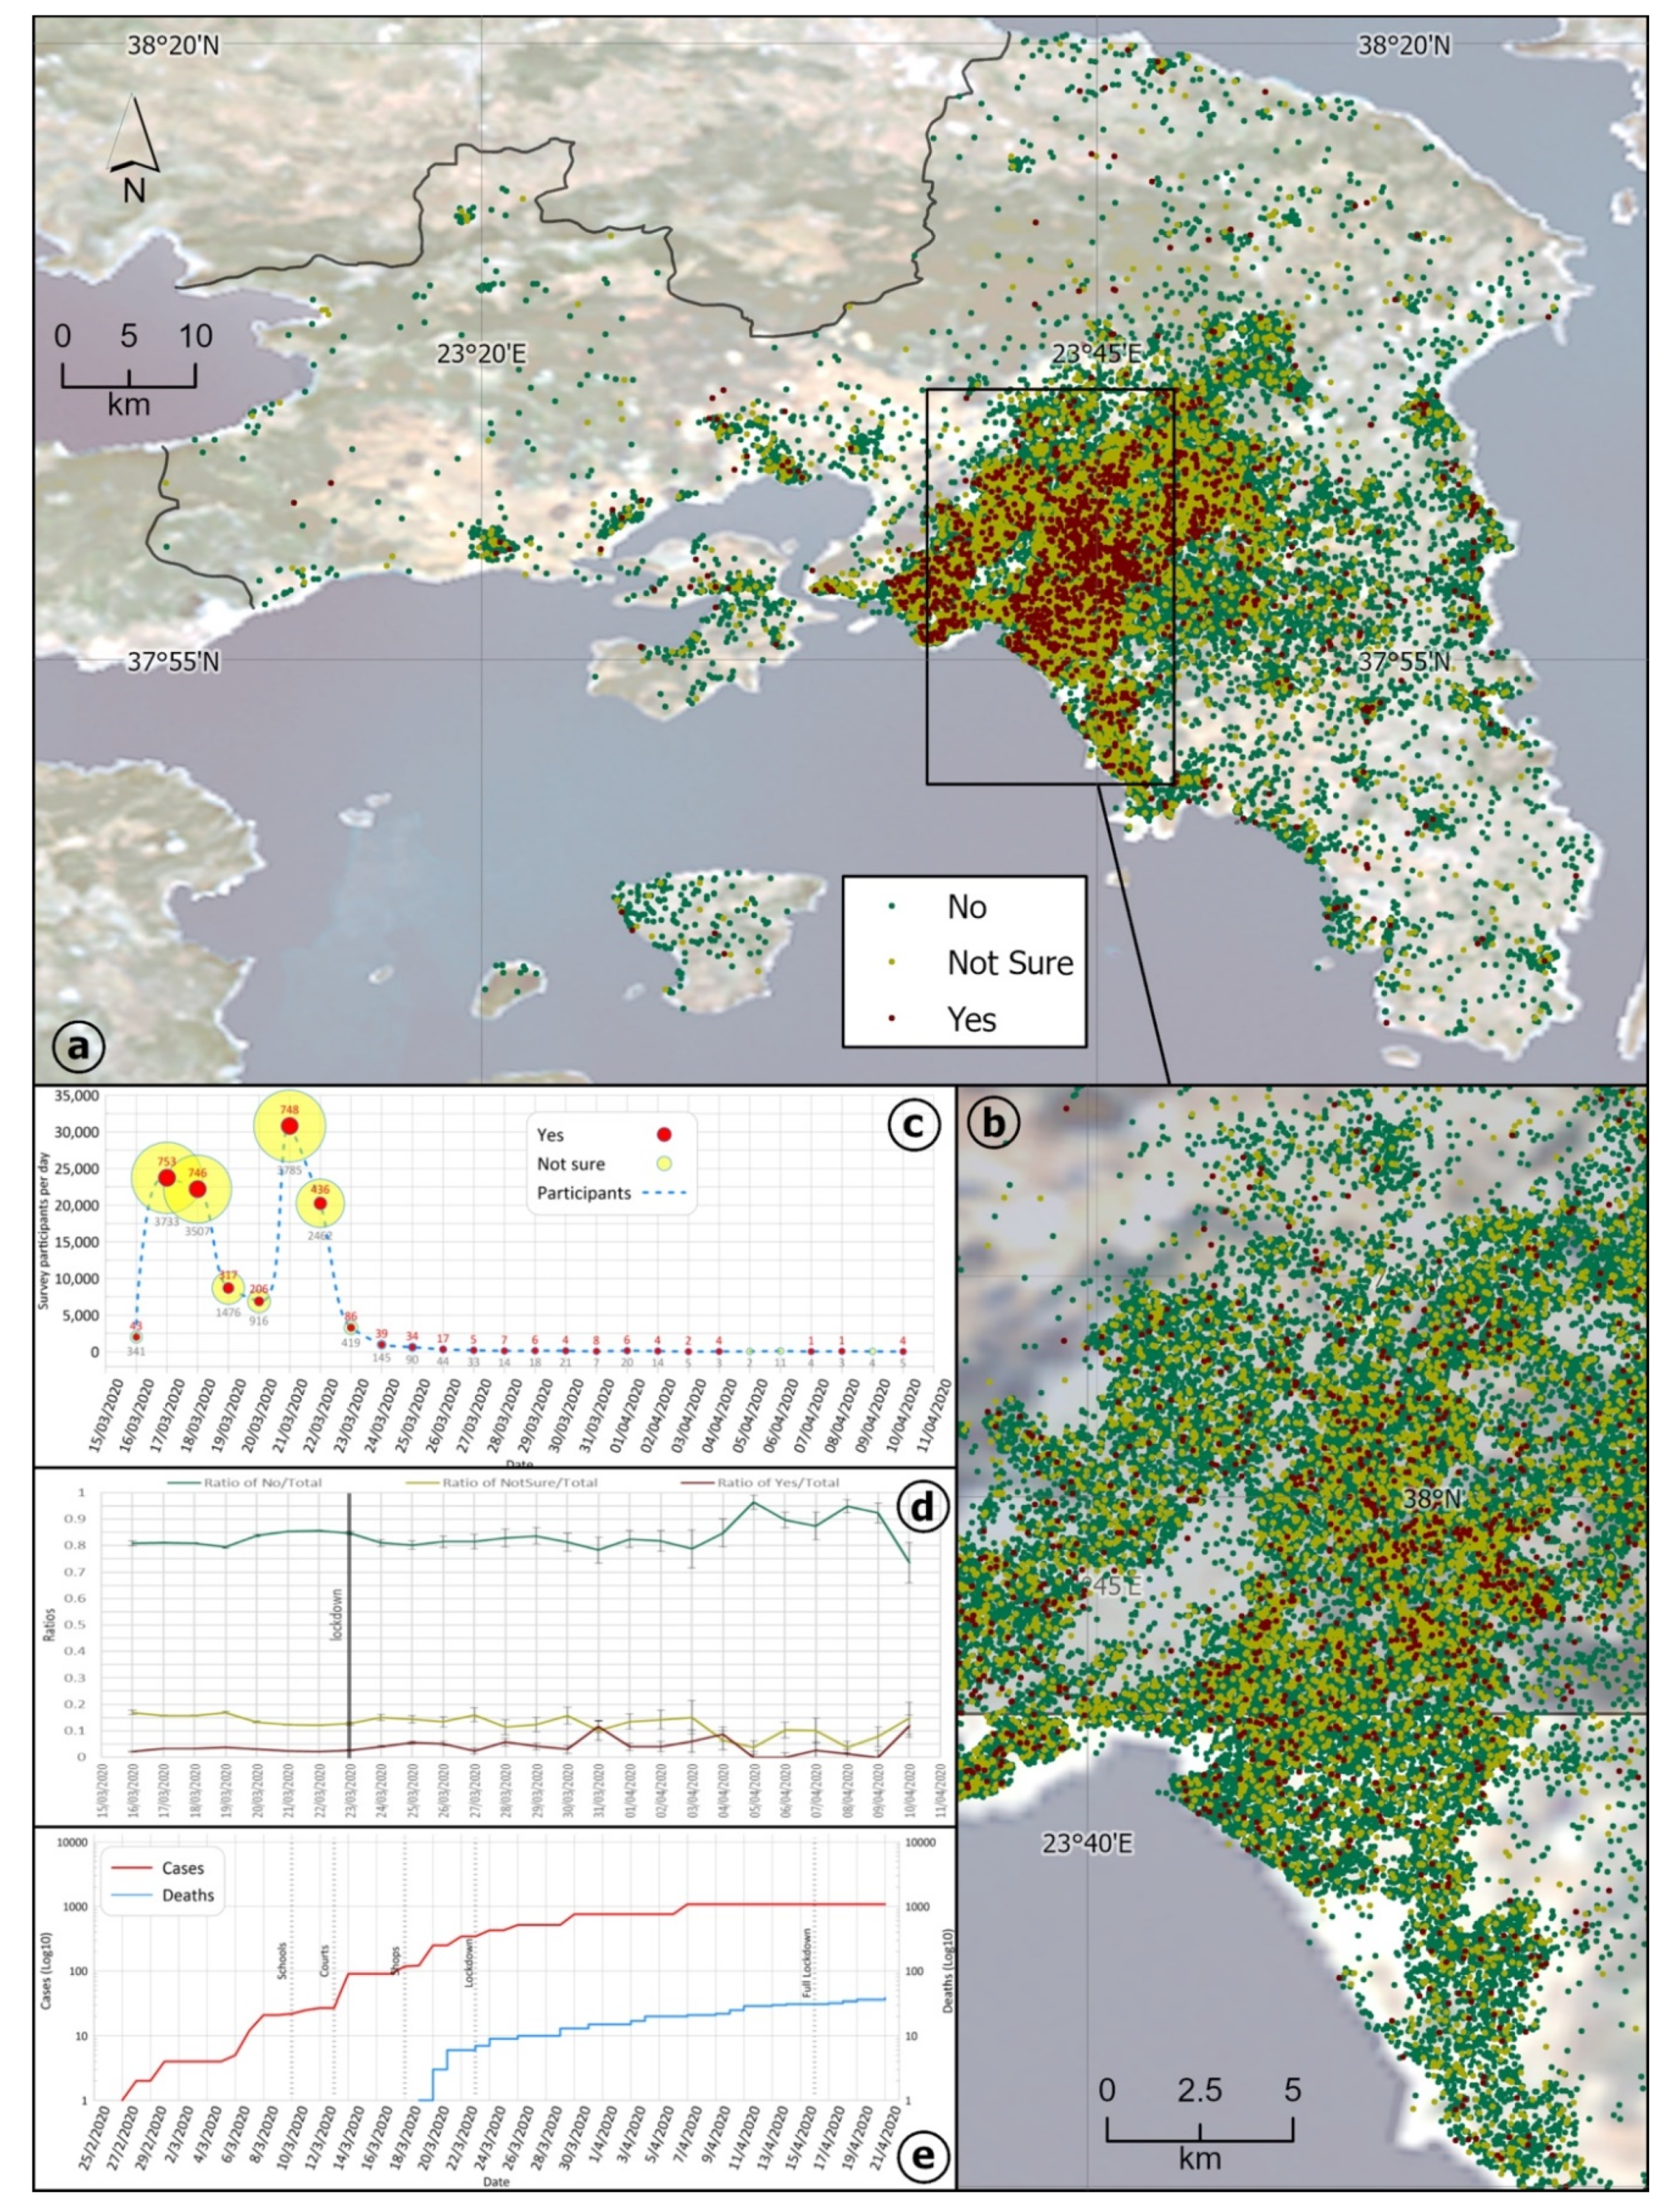
The above findings about the entire Greek territory are largely determined from the Region of Attica responses, which constitute 59% of total responses. The Region of Attica, which includes Athens, the capital of Greece, having a population of about 3.8M, concentrates about 35% of the entire population (general population estimation of the Hellenic Statistical Authority for 2019,
www.statistics.gr), while the population density is ~1000/Km
2 against ~55/Km
2 for the rest of the country. Responses cover the 2/3 of the region, with the NW part of Attica having small share in the survey, while “Yes” and “Not Sure” responses are located mostly in Athens metropolitan area and the surrounding towns, as well as the central eastern Attica coast (
Figure 5 and
Video S2 in Supplementary Materials).
Comparing the Attica percentages of the three different answer options against the rest Greek territory for the first eight days of the survey, it is virtually certain (a=0.01) that the percentages of “Yes” and “Not Sure” for Attica are significantly higher than the respective percentages for the rest of the country. This can be attributed to the fact that the density of confirmed cases in Attica is about nine times higher compared to the rest of the country (specifically, ~90.3 confirmed cases per 1M against ~10.6 confirmed cases per 1M from 16/03/2020 to 23/03/2020). Furthermore, it should be noted that the pronounced red area in
Figure 5a, corresponds to the Athens metropolitan area, a closed basin surrounded by mountains and the sea, where the vast majority of Attica population inhabits, with a population density of about 3500 inhabitants/km
2 and where the most Attica cases occurred.
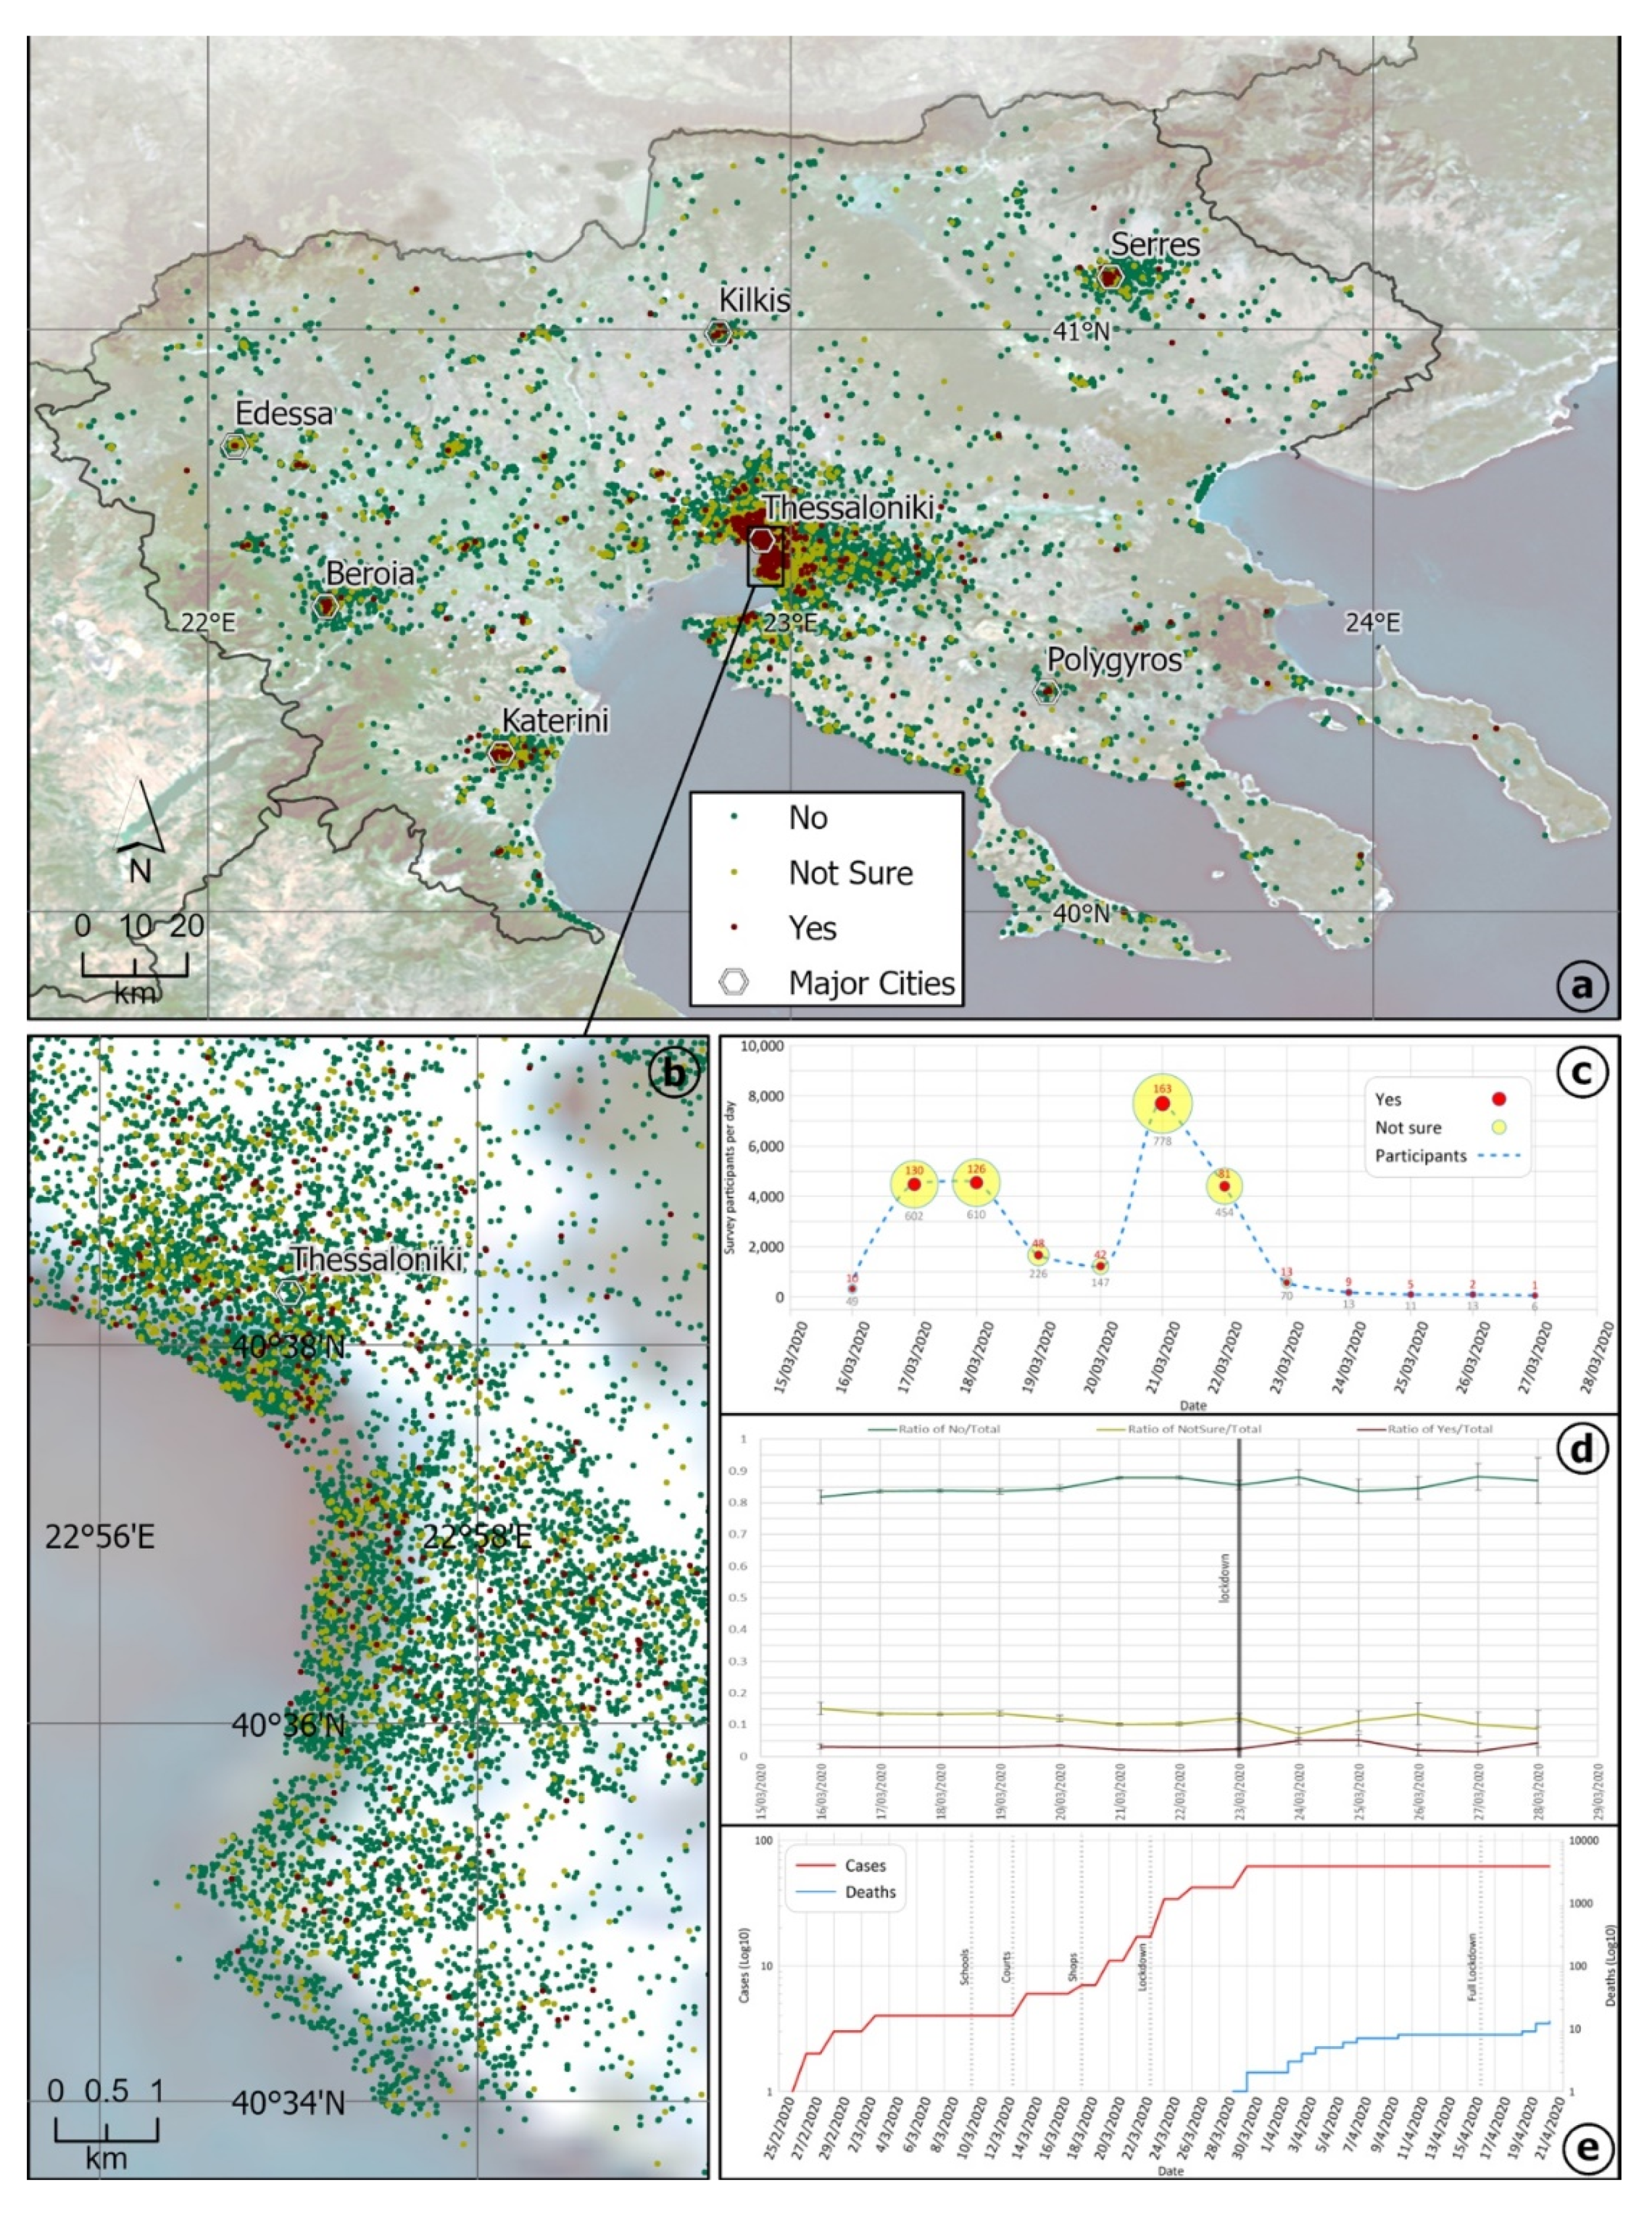
On the other hand, the responses from the Region of Central Macedonia, second in number of entries, where Thessaloniki (the second largest Greek city in terms of population) is located, are not uniformly distributed in the entire area, while the majority of “Yes” and “Not Sure” responses are located mainly in Thessaloniki and in Region’s bigger cities as well. Only the first 12 days are presented in
Figure 6, because after that period, the number of participants is relatively small. These ratios exhibit the same temporal evolution as for the entire country, though the only statistically significant change, with increased “No” against decreased “Not Sure” and “Yes”, is observed from 20 to 21/03/2020, when the number of participants increased by about 6 times (
Figure 6).
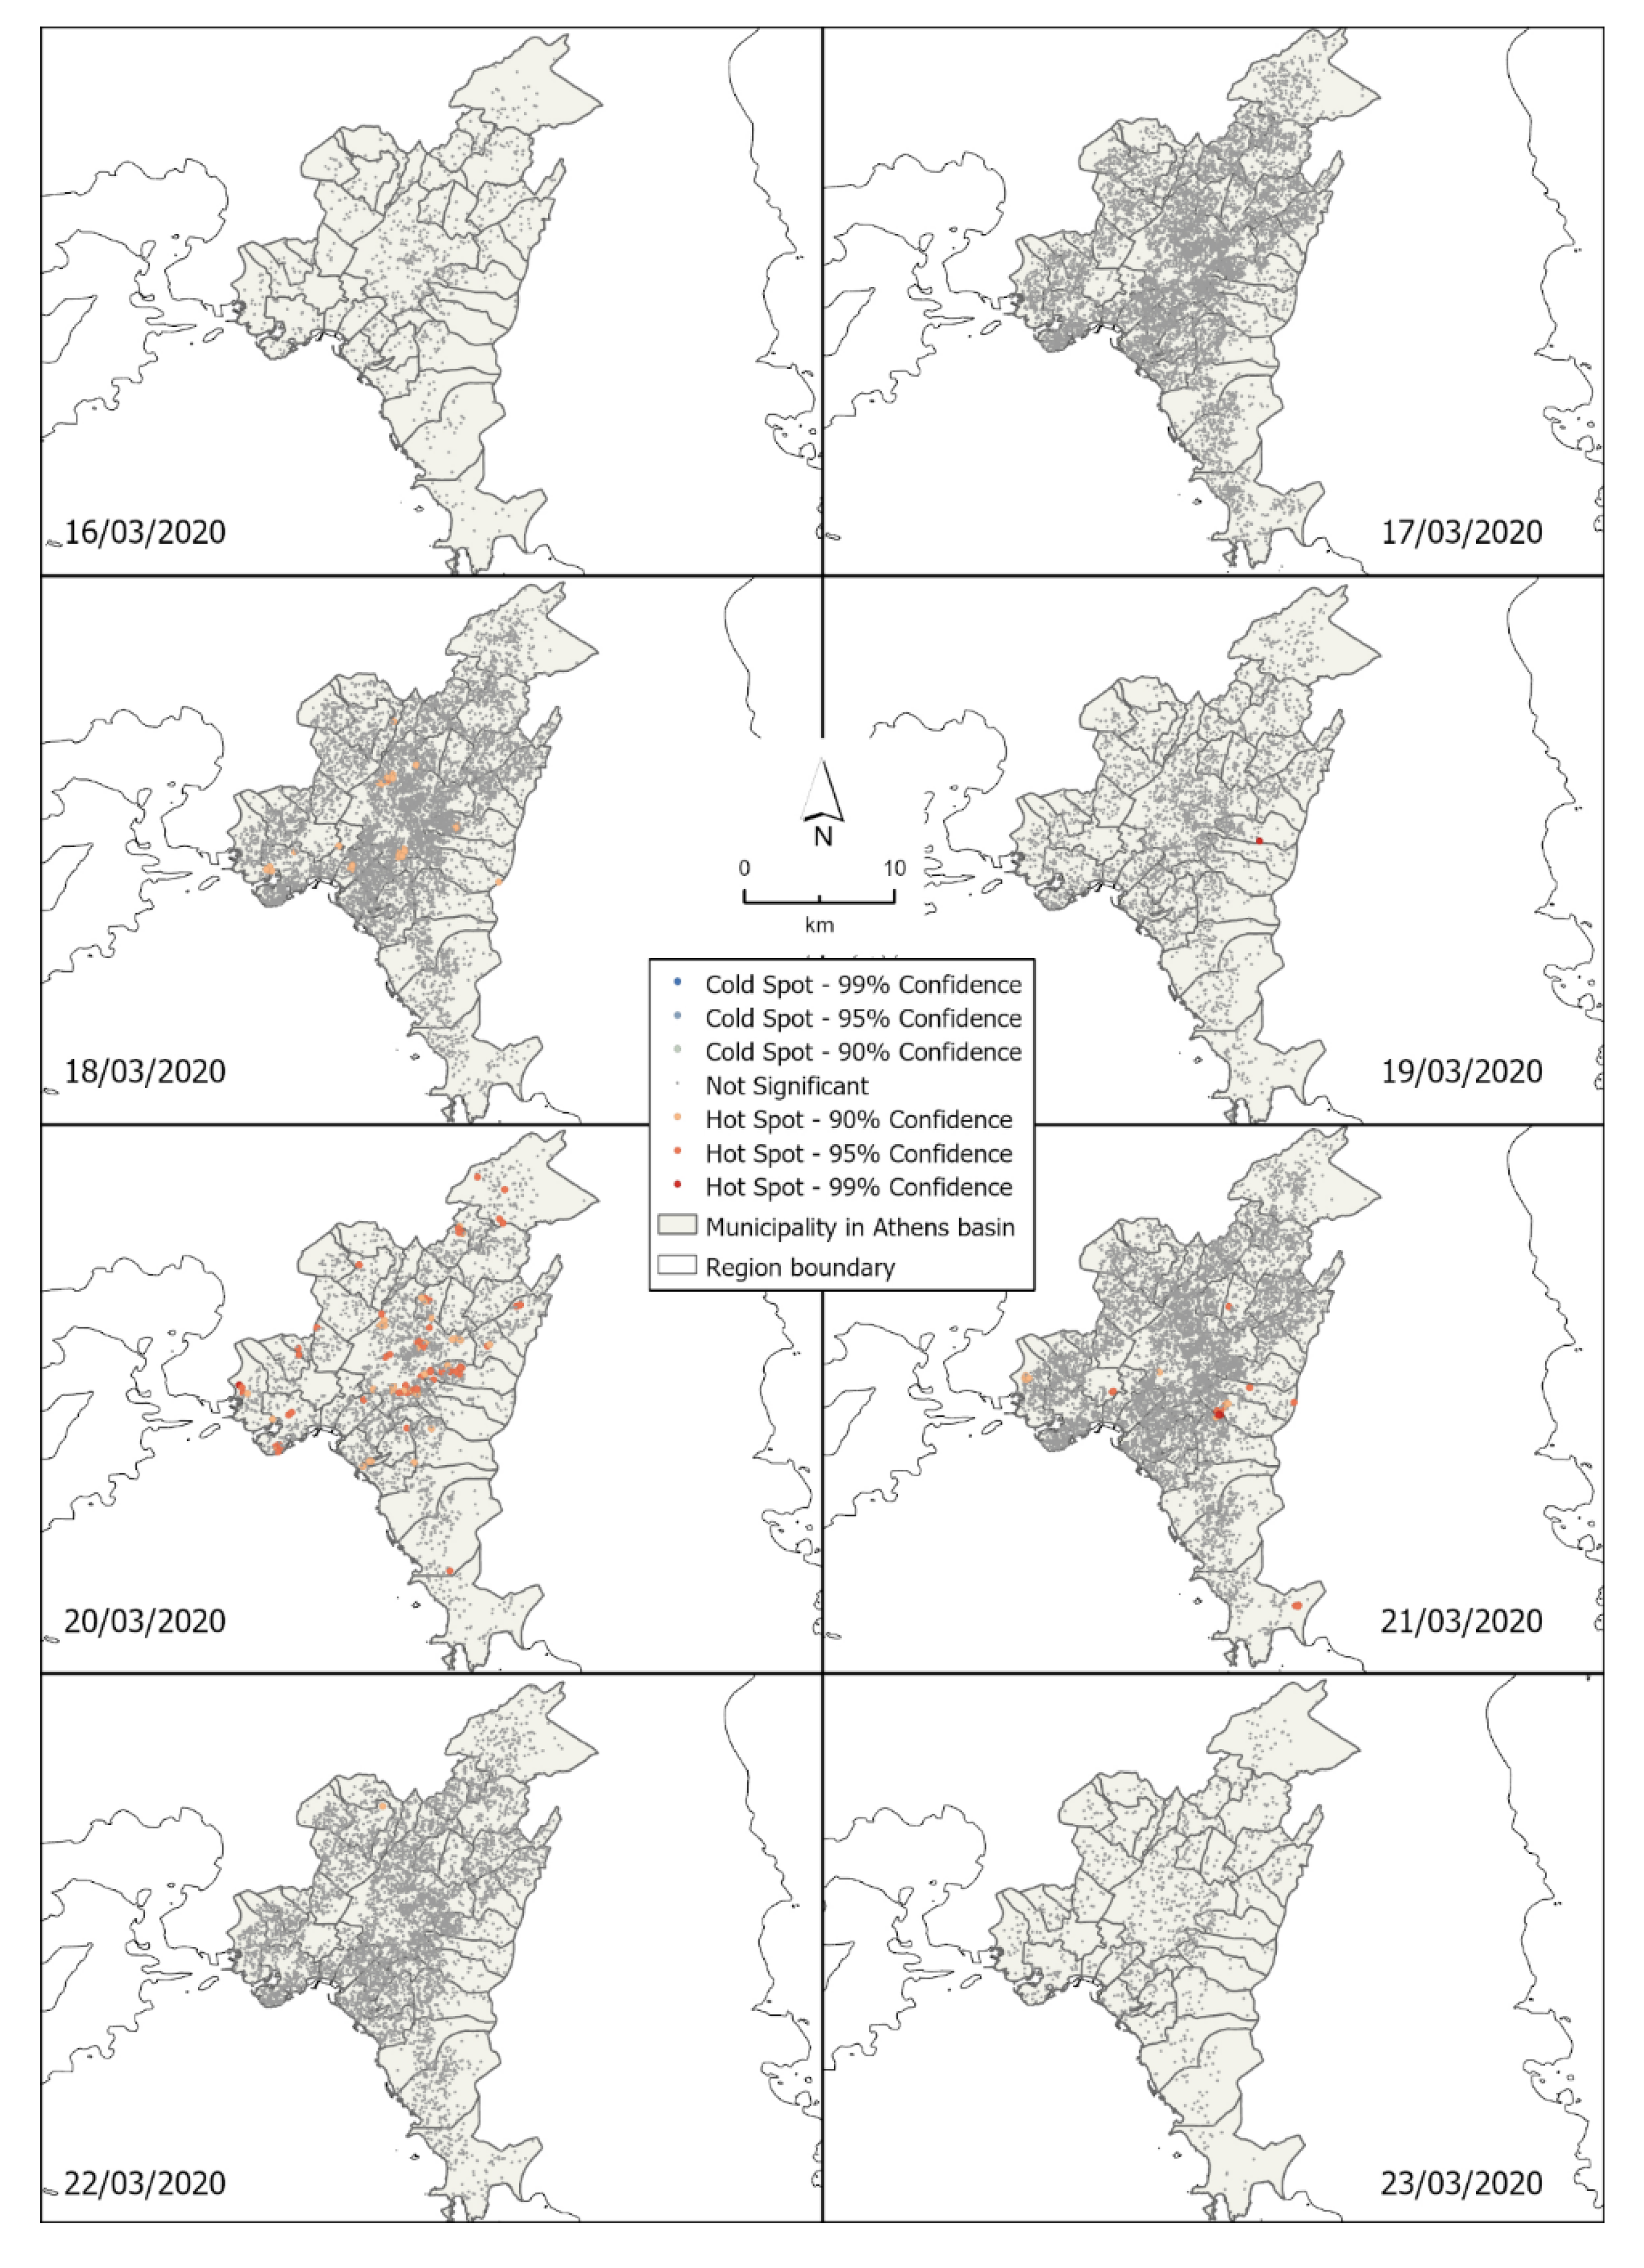
In an effort to assess the usefulness of the survey for timely interventions of the authorities at areas with increased positive answers (Yes) that might be connected with increased actual cases, a hot spot analysis was performed for the entire Greek territory, as well as for Athens metropolitan area, due to its high population density. The hot spot analysis can reveal conspicuous clusters of increased values of the examined variable. In our case hot spots correspond to clusters of Yes. It is found that apart from the larger cities that form hotspots, most other cities correspond to cold spots; i.e., to clusters of No. However, hot spots appear in several areas implying that increased cases may occur in smaller cities or villages (not shown). Specifically, in
Figure 7, the hot spot analysis for the Athens metropolitan area is presented on daily basis for the first 8 days of the survey, during which the highest participation was recorded. The first statistically significant hot spots are clustering during the third day of the survey and clearly form during the fifth and sixth day of the survey at several neighborhood locations in Athens metropolitan area and the surrounding towns and suburbs, but due to the limited number of days, it is not possible to recognize any changes in the spatial patterns of the hot spots. However, these findings indicate that such daily analysis could be valuable to the civil protection authorities.
5. Discussion and Conclusions
With the application presented here, an attempt was made to implement a crowdsourcing approach for mass data acquisition concerning the COVID-19 disease outbreak in Greece during spring 2020 for research purposes. The main goal was to locate geographical areas with increased number of people feeling the symptoms and to determine any temporal variations in the answers of participants.
Dealing with epidemics is challenging because the real-time data are voluminous and require time-consuming analysis and visualization. Pandemics, like any natural disaster, are emergencies that require quick action and support of the impacted populations; thus, the geographic perspective can provide valuable answers to some major challenges. The spatial distribution of the answers according to the participants own sense of symptoms, can be highly beneficial in terms of locating areas with increasing problem. Nevertheless, we should take under consideration the significant parameter that the elderly population with no competence in new technologies (internet applications, smart phones, social networking, etc.) might not be able to participate. For example, the only known concentrations of officially confirmed cases by the Hellenic National Public Health Organization, during the examined time period, were two remote villages at NW Greece. During the validation procedure of the survey data, no participation from this area was located, most probably due to the very elderly population that resides in these villages.
The combination of official real-time data with data collected via crowdsourcing is important for further spatial analysis; however, due to the absence of high-resolution geographical location of official cases in Greece, any spatial correlation and validation with official cases reporting was practically impossible.
Although no decision makers requested to share our survey raw data or results, many nonprofit organizations, other universities and individuals, contacted our research group for collaboration and sharing of practices and analyses results. However, this survey of collecting health data, clearly demonstrates that Health Organizations should, at least, examine the potential of using crowdsourcing applications to reach public within a short-time interval, taking under consideration the above-mentioned limitations, by establishing strict protocols in terms of confidentiality and responsibility and scheduling a continuous reminder for recurrent participation.
Each crowdsourcing application produces results that depend on the responsibility of participants. There are security valves, but they are not able to guarantee the validity of the incoming data. For example, high level of false positives from such apps could cause panic, while false negatives could spare in the rest of the community a false sense of safety [
37]. Therefore, the results of such research should be processed and analyzed in order to remove, if possible, for example suspicious multiple, or misplaced entries, malicious or not. The described application was rapidly and uniformly disseminated to the entire Greek territory via social media, within the first days of the pandemic alert and it was one of the first COVID-19 related applications worldwide. The extensive participation of the first days of this initiative increased our confidence in the reliability of the incoming data and the robustness of the statistical analysis. Data analysis showed that the answers did not exhibit any spurious trends in certain areas and any differences in answers’ ratios can be attributed in the population densities that are related to the citizens’ actual exposure to the disease. The increased numbers of participants experiencing symptoms coincided geographically with higher number of confirmed cases, i.e., the highest populated urban areas, while temporal variations were also detected that co-occur with the restriction measures. The hot spot analysis indicated that operational methodologies based on this kind of applications can prove to be valuable tools for health authorities in day-by-day decision making and interventions.
It is more than necessary to incorporate practices that implement approaches which do not require sharing of unencrypted location information outside of trusted health organizations, since location information can disclose personal identity through easy associations with participants’ work or home. This application indicated that this approach can be of significant usefulness, as participants do not worry about sharing sensitive information or answer several questions of secondary importance, which eventually reinforces the participation.
In conclusion, crowdsourcing applications for health data collection can reach public within a short time interval, although a continuous reminder for participation should be scheduled. The unanticipated extensive participation clearly showed the public willingness to contribute and communicate with the authorities via new technologies during emergency situations, providing the requested information. Furthermore, geostatistical analyses on operational basis within the context of crowdsourcing applications can be valuable tools for health authorities in day-by-day decision making and interventions.


