Combining UAV Imagery, Volunteered Geographic Information, and Field Survey Data to Improve Characterization of Rural Water Points in Malawi

 ,
,  ,
,
Abstract
1. Introduction
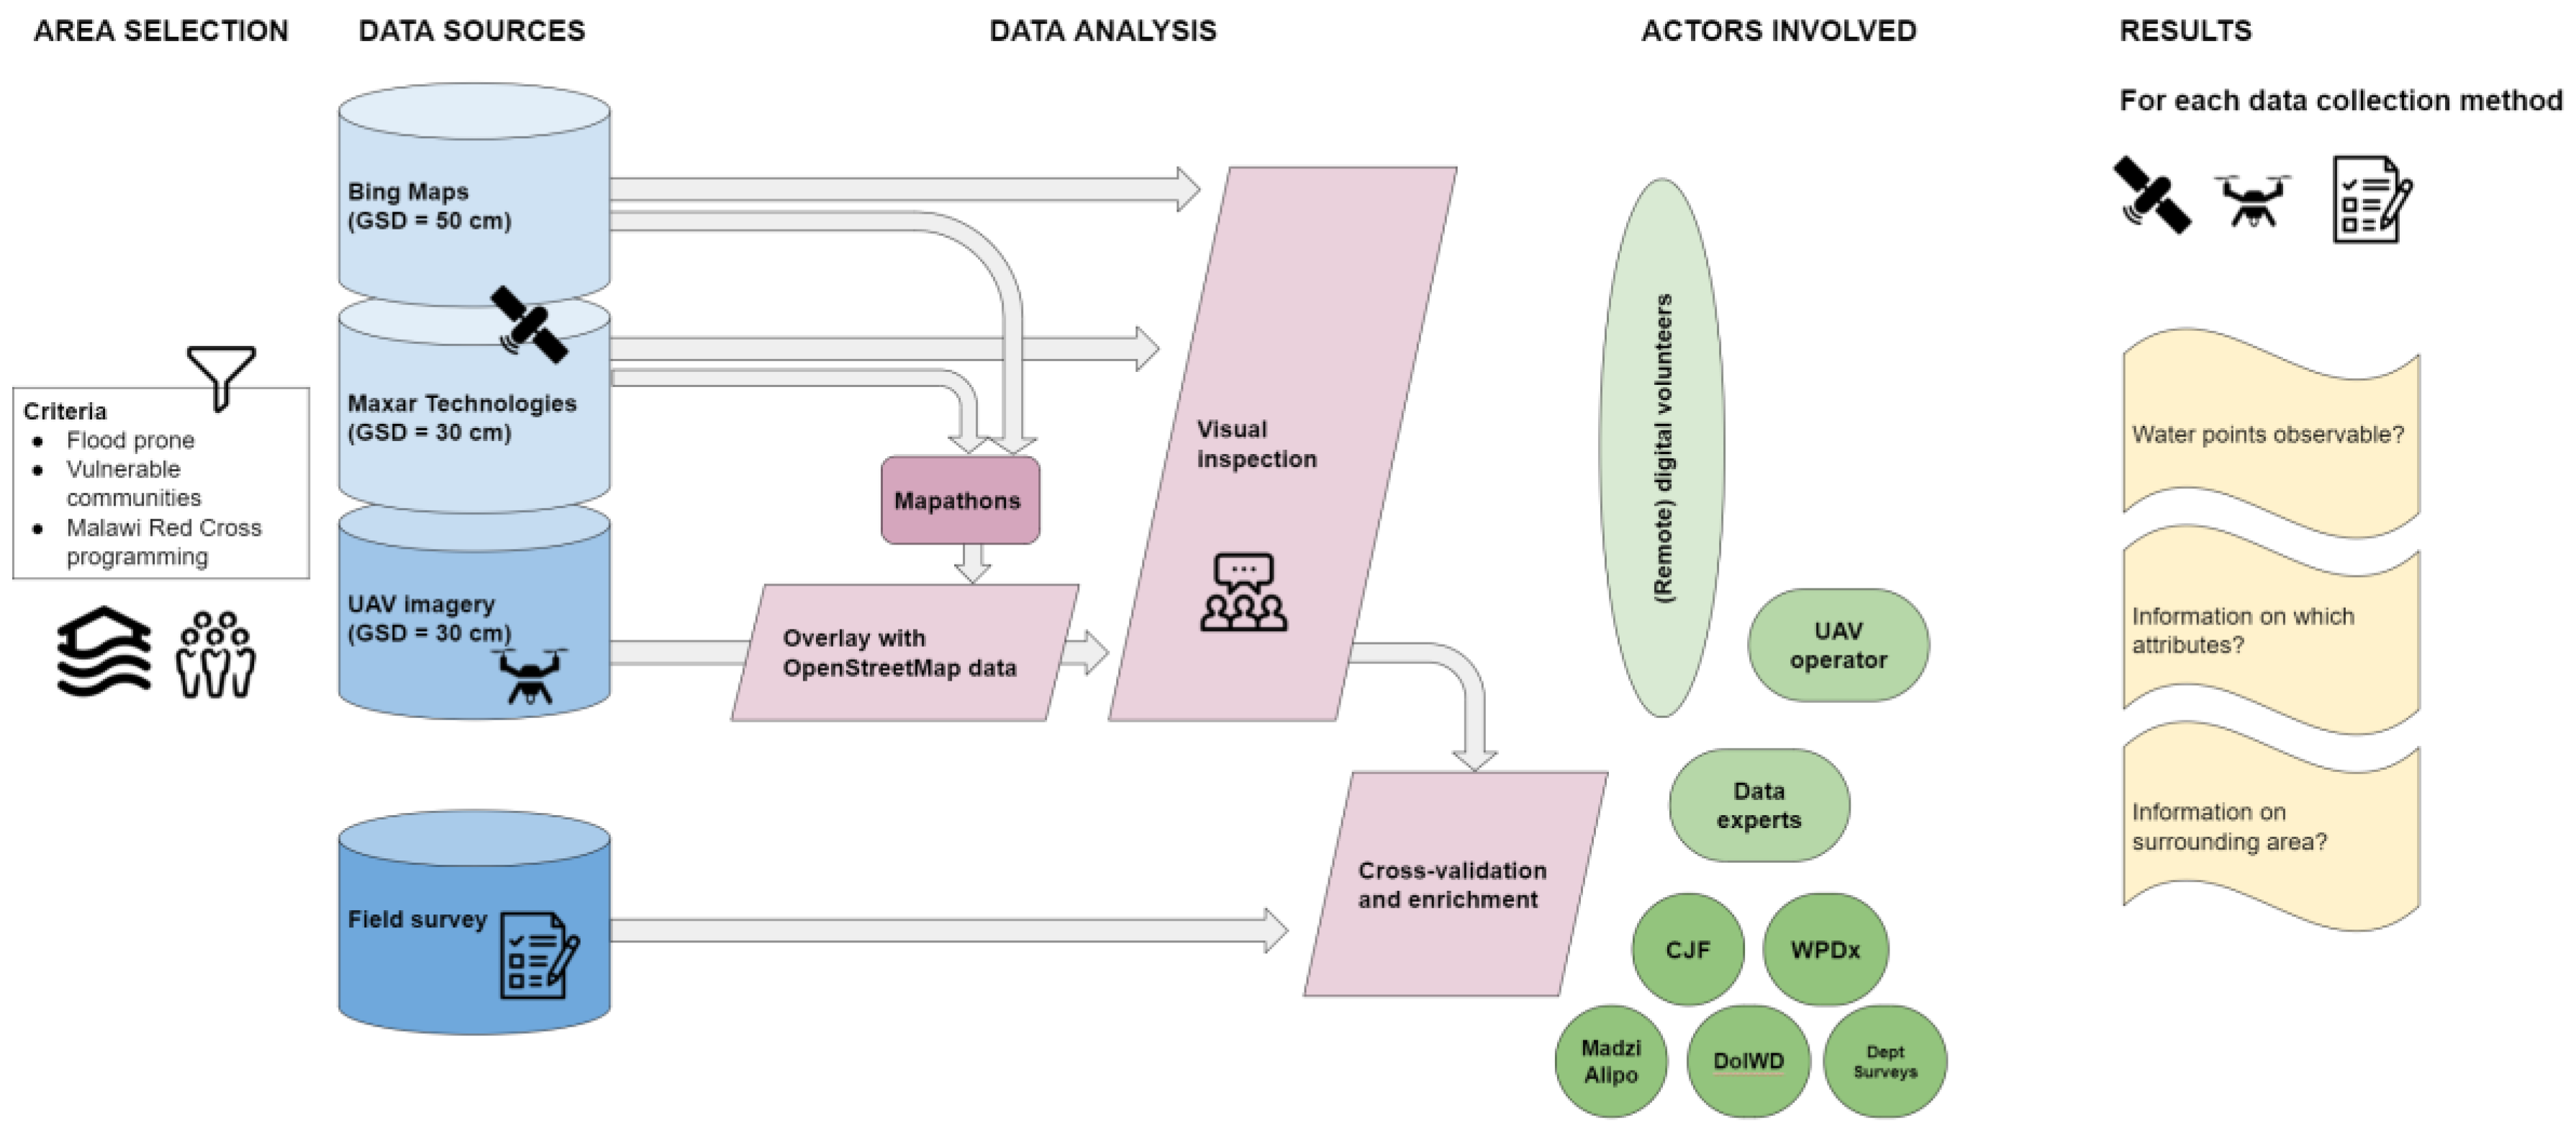
2. Materials and Methods
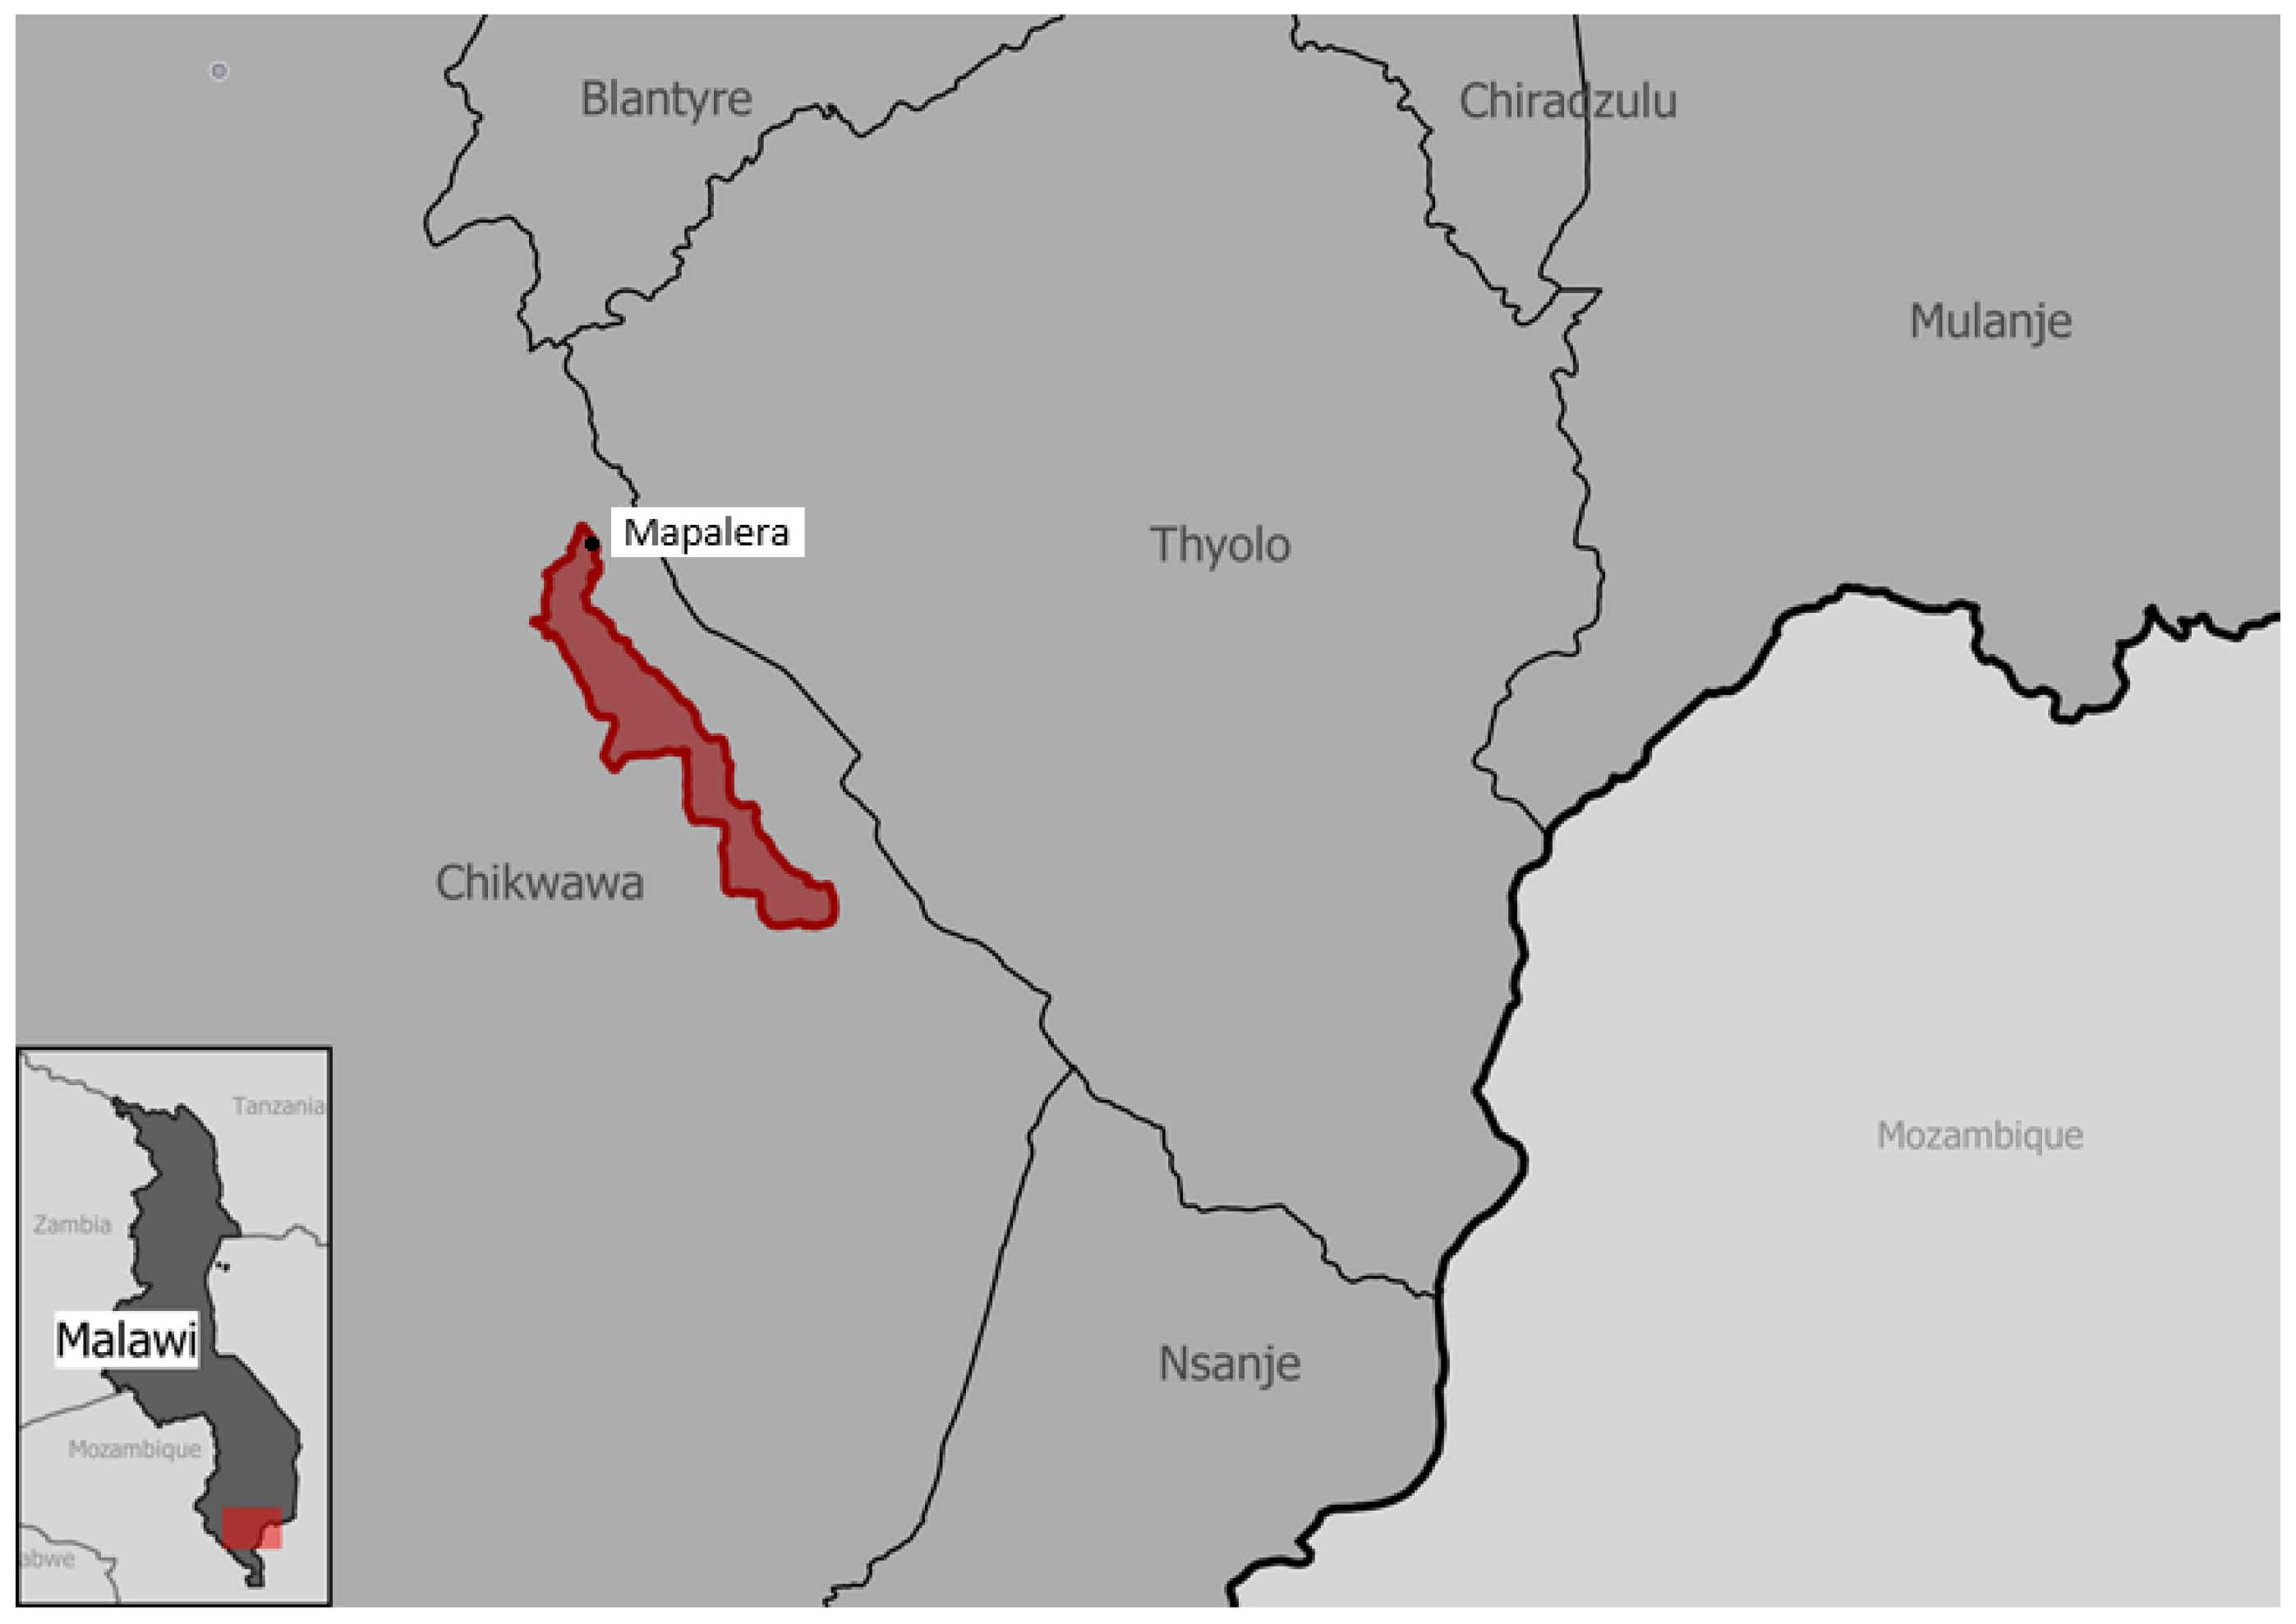
2.1. Area Selection
2.2. Data Sources
2.2.1. Satellite Imagery
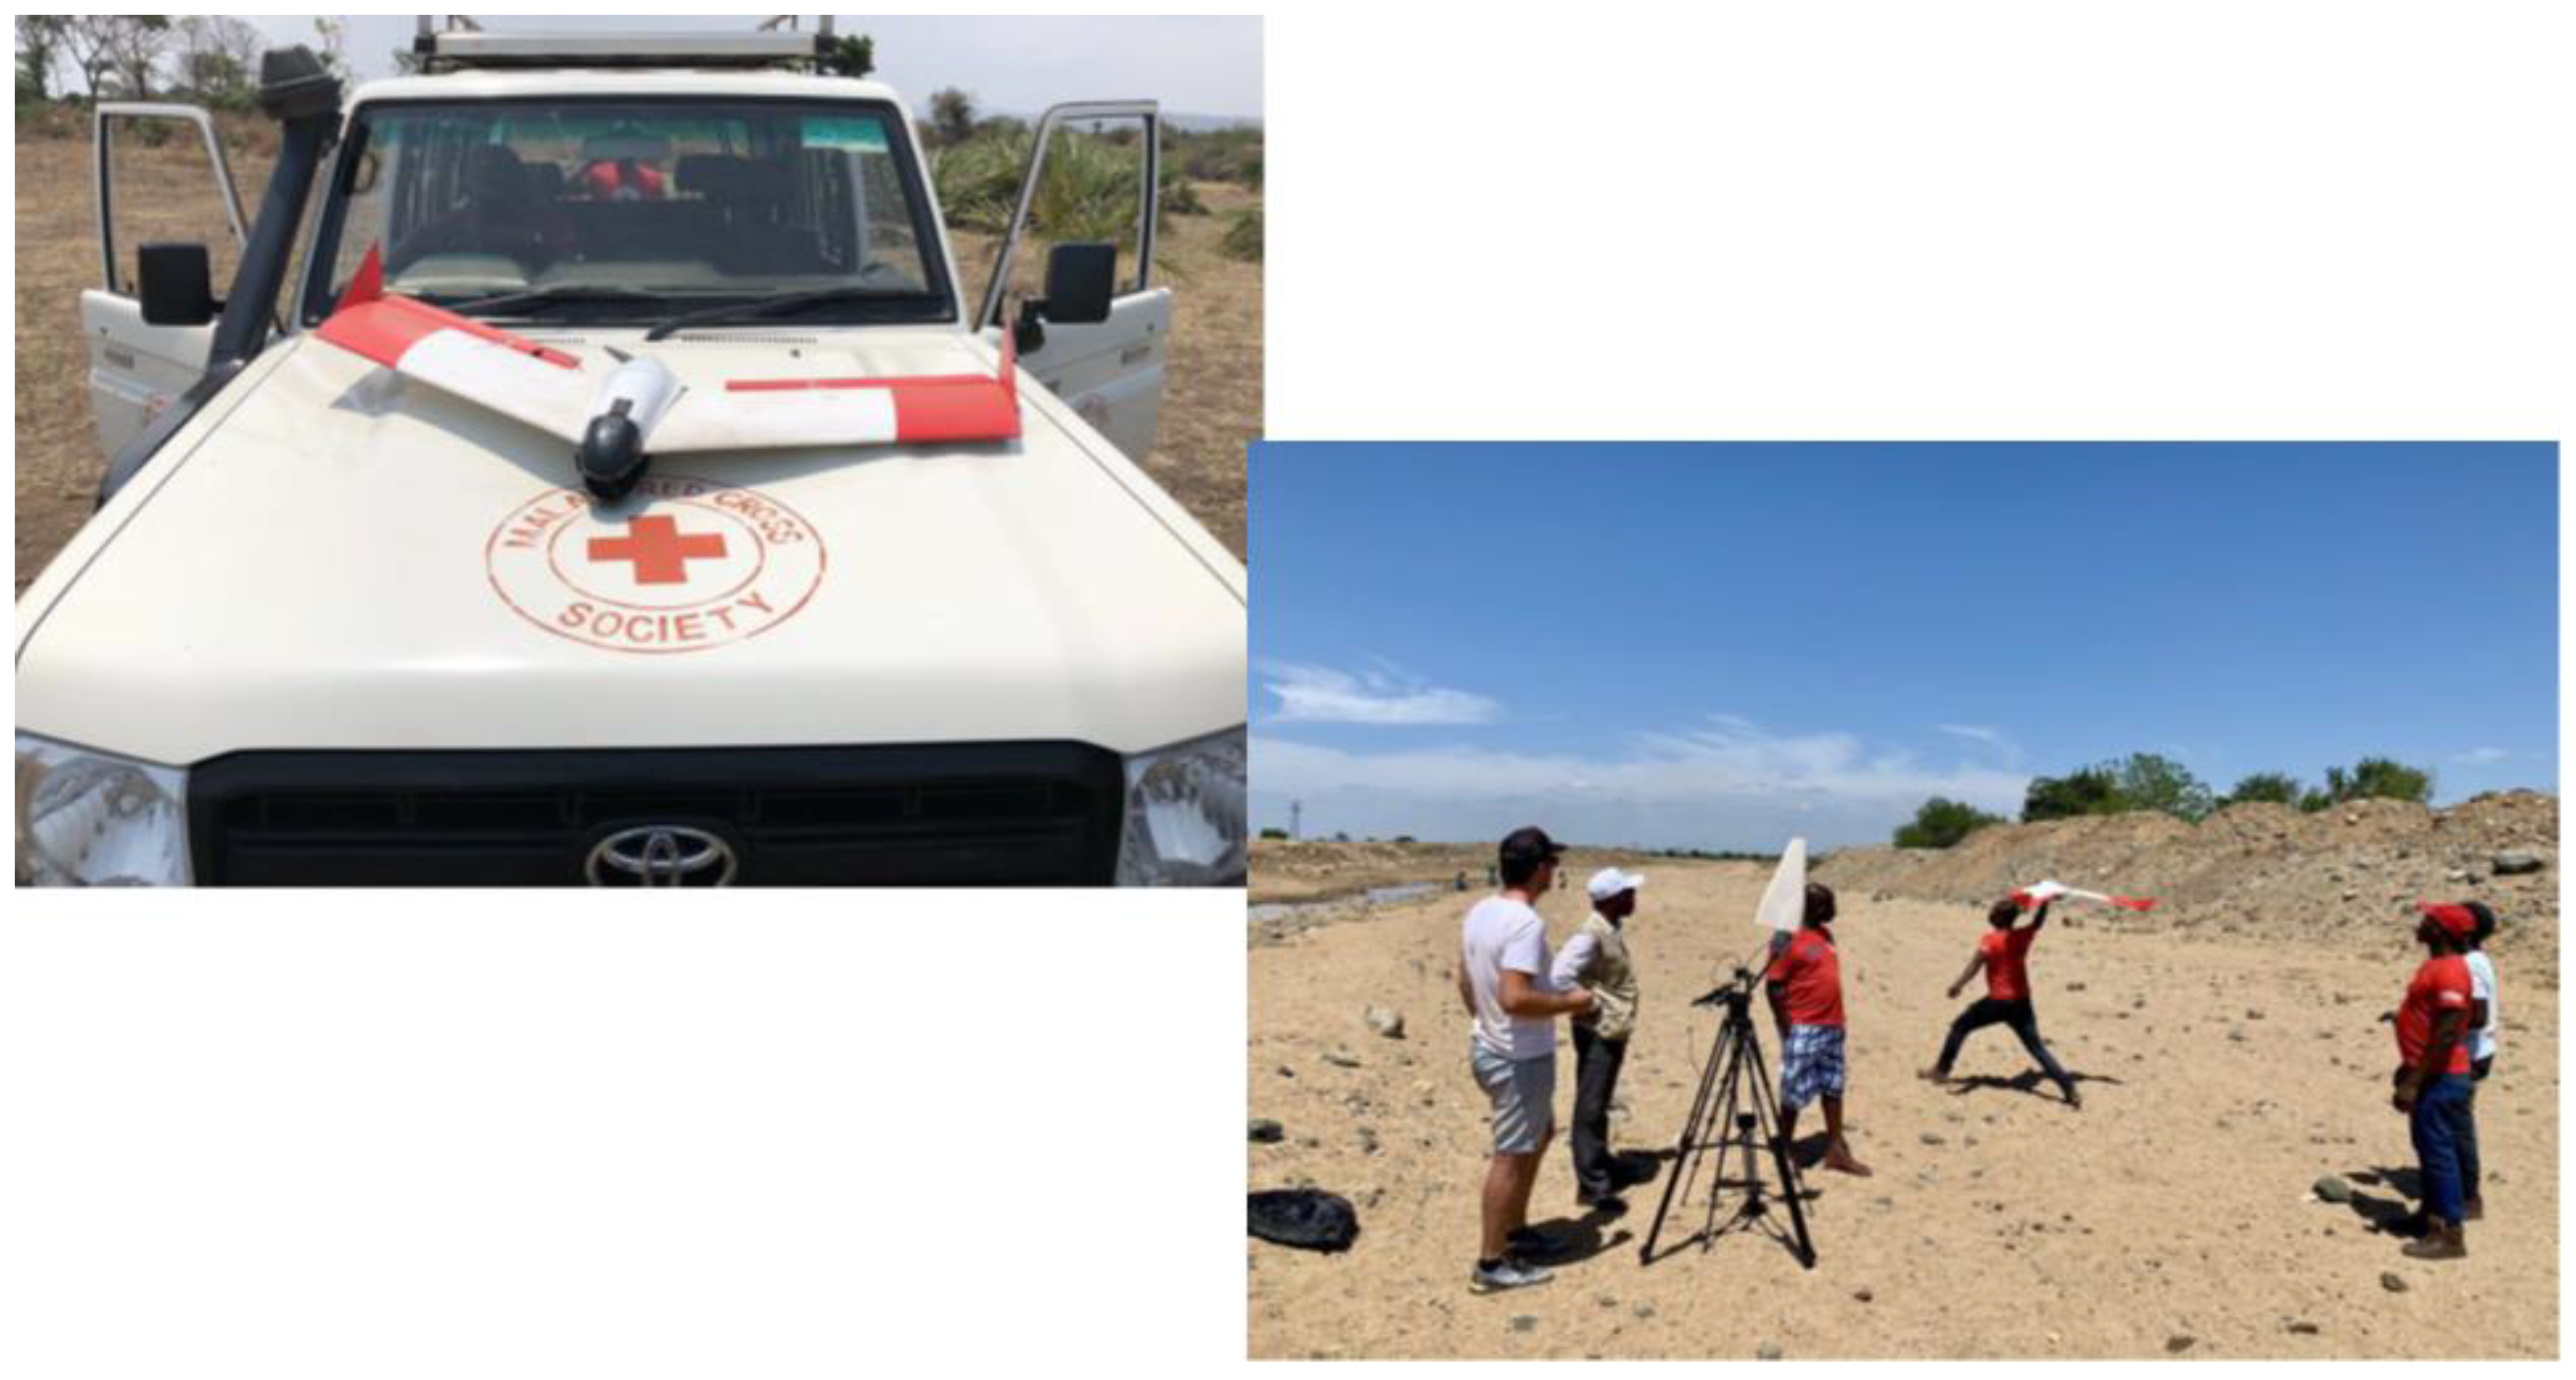
2.2.2. UAV Imagery
2.2.3. Field Survey Data
2.3. Analysing the Data
3. Results
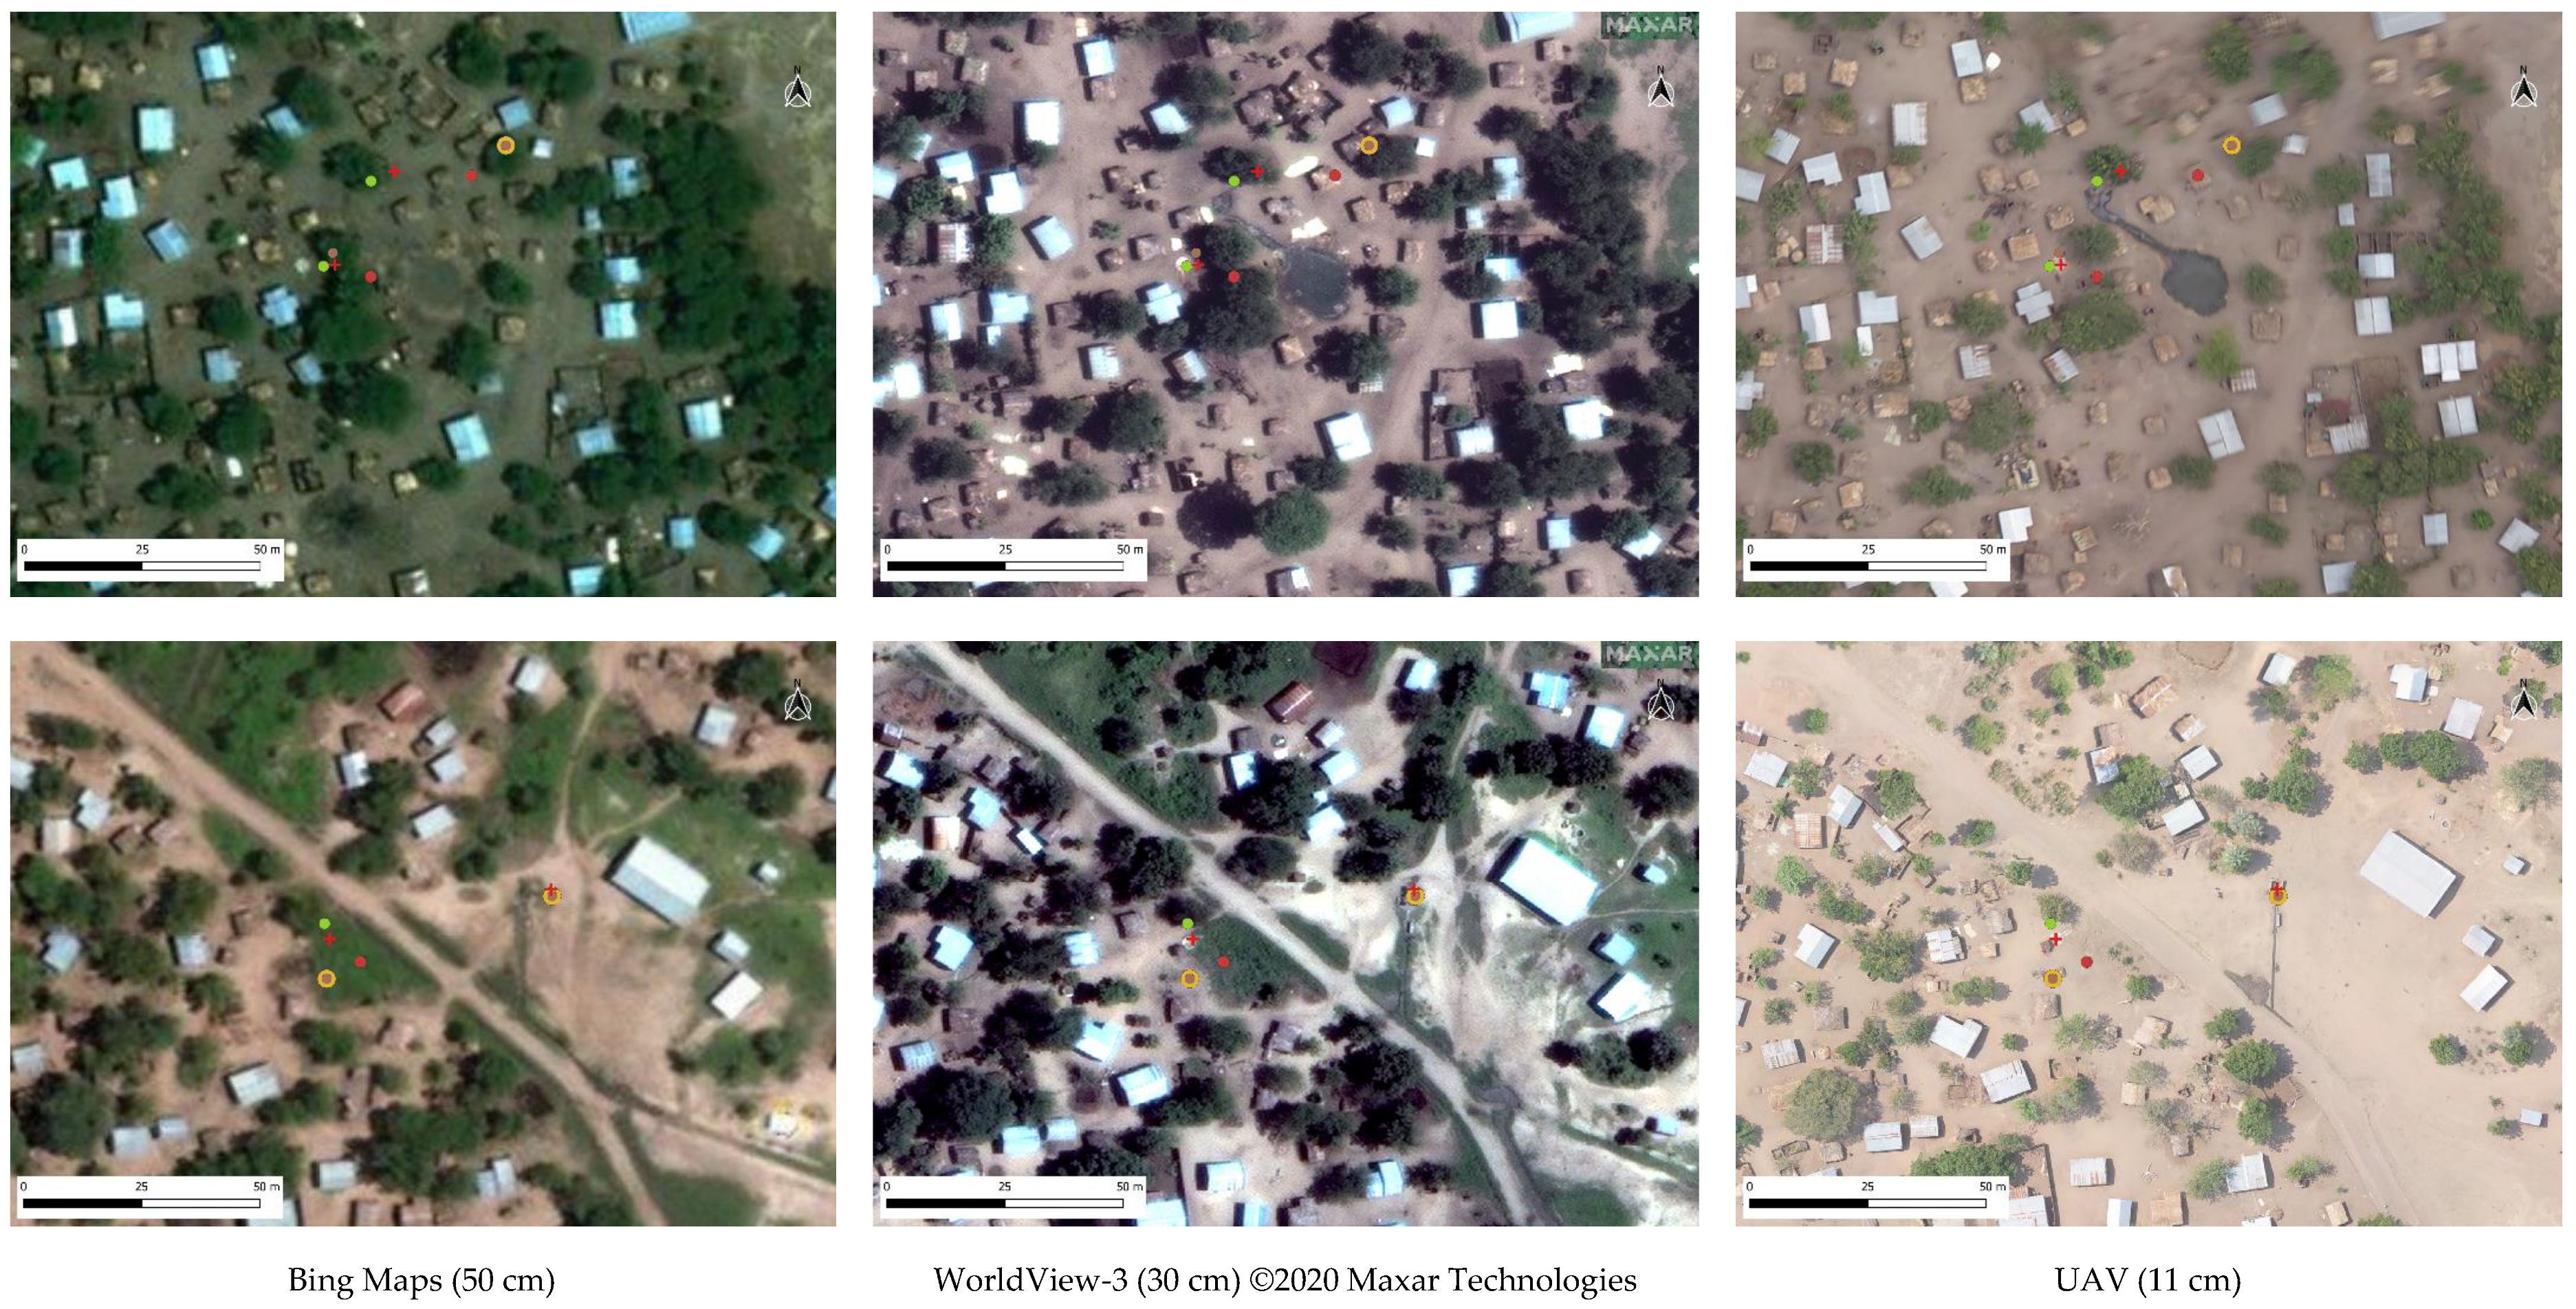
3.1. Results Satellite Imagery in Comparison to UAV Imagery
3.2. Results UAV imagery
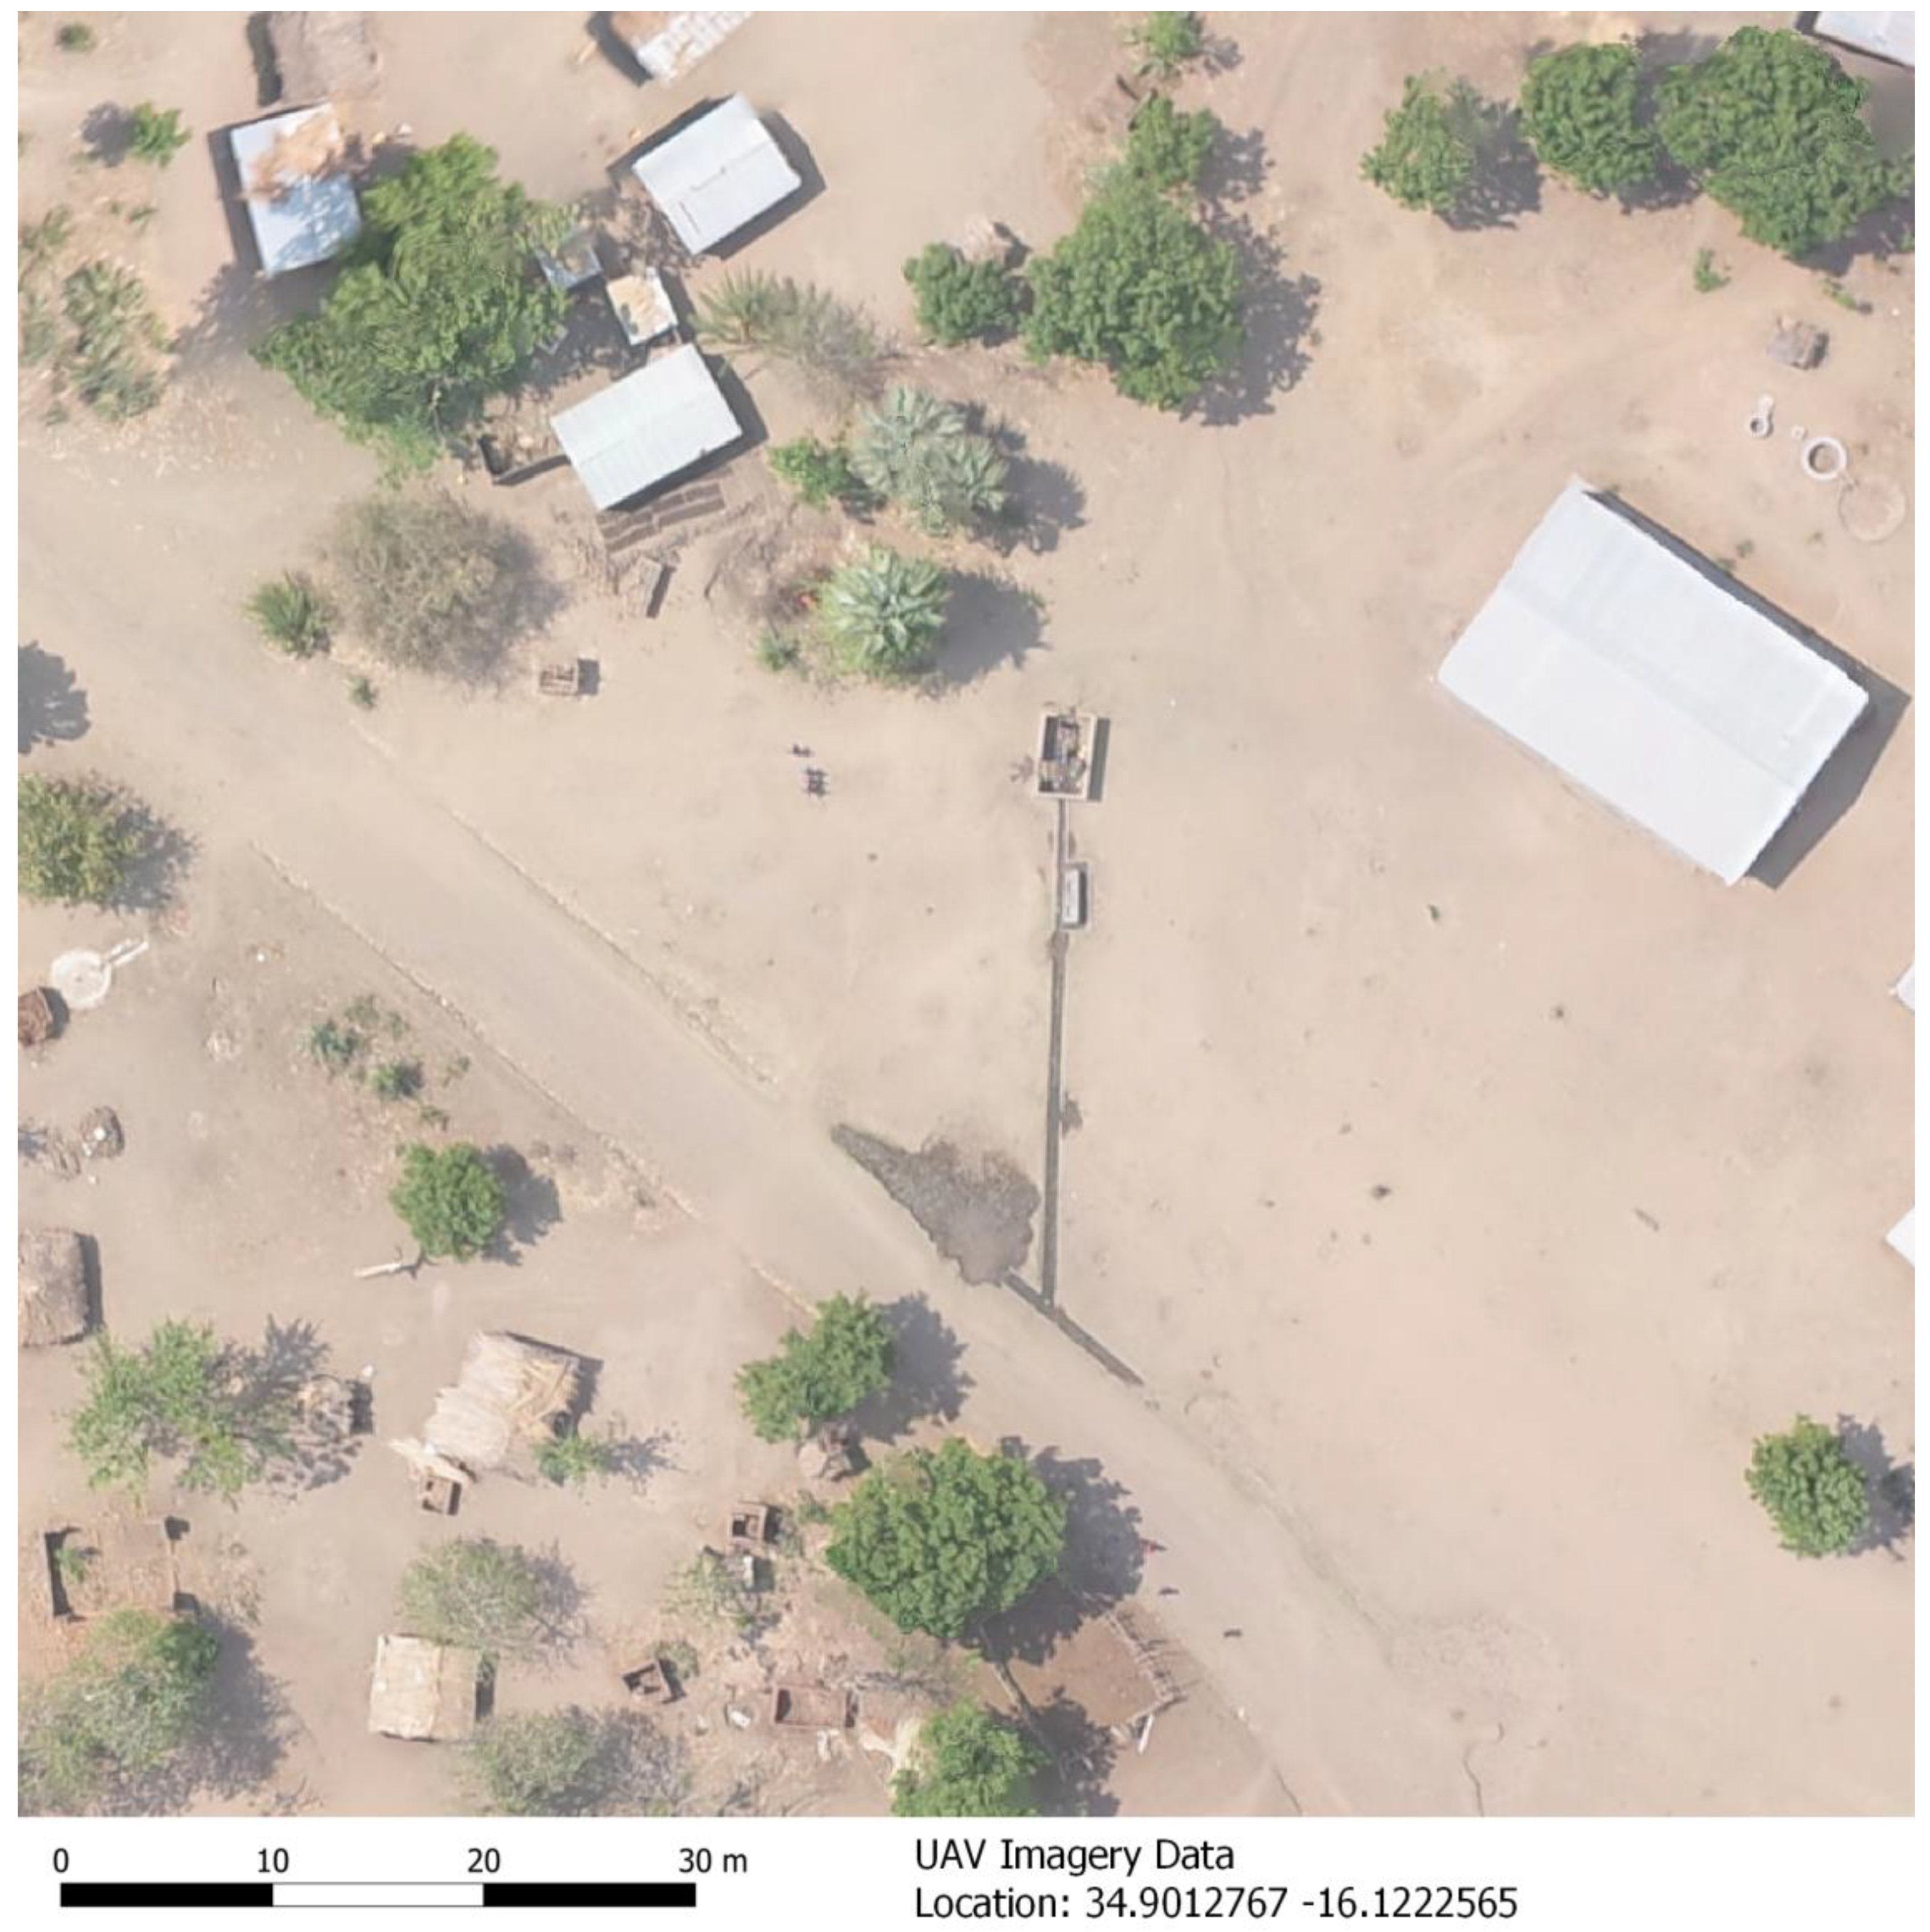
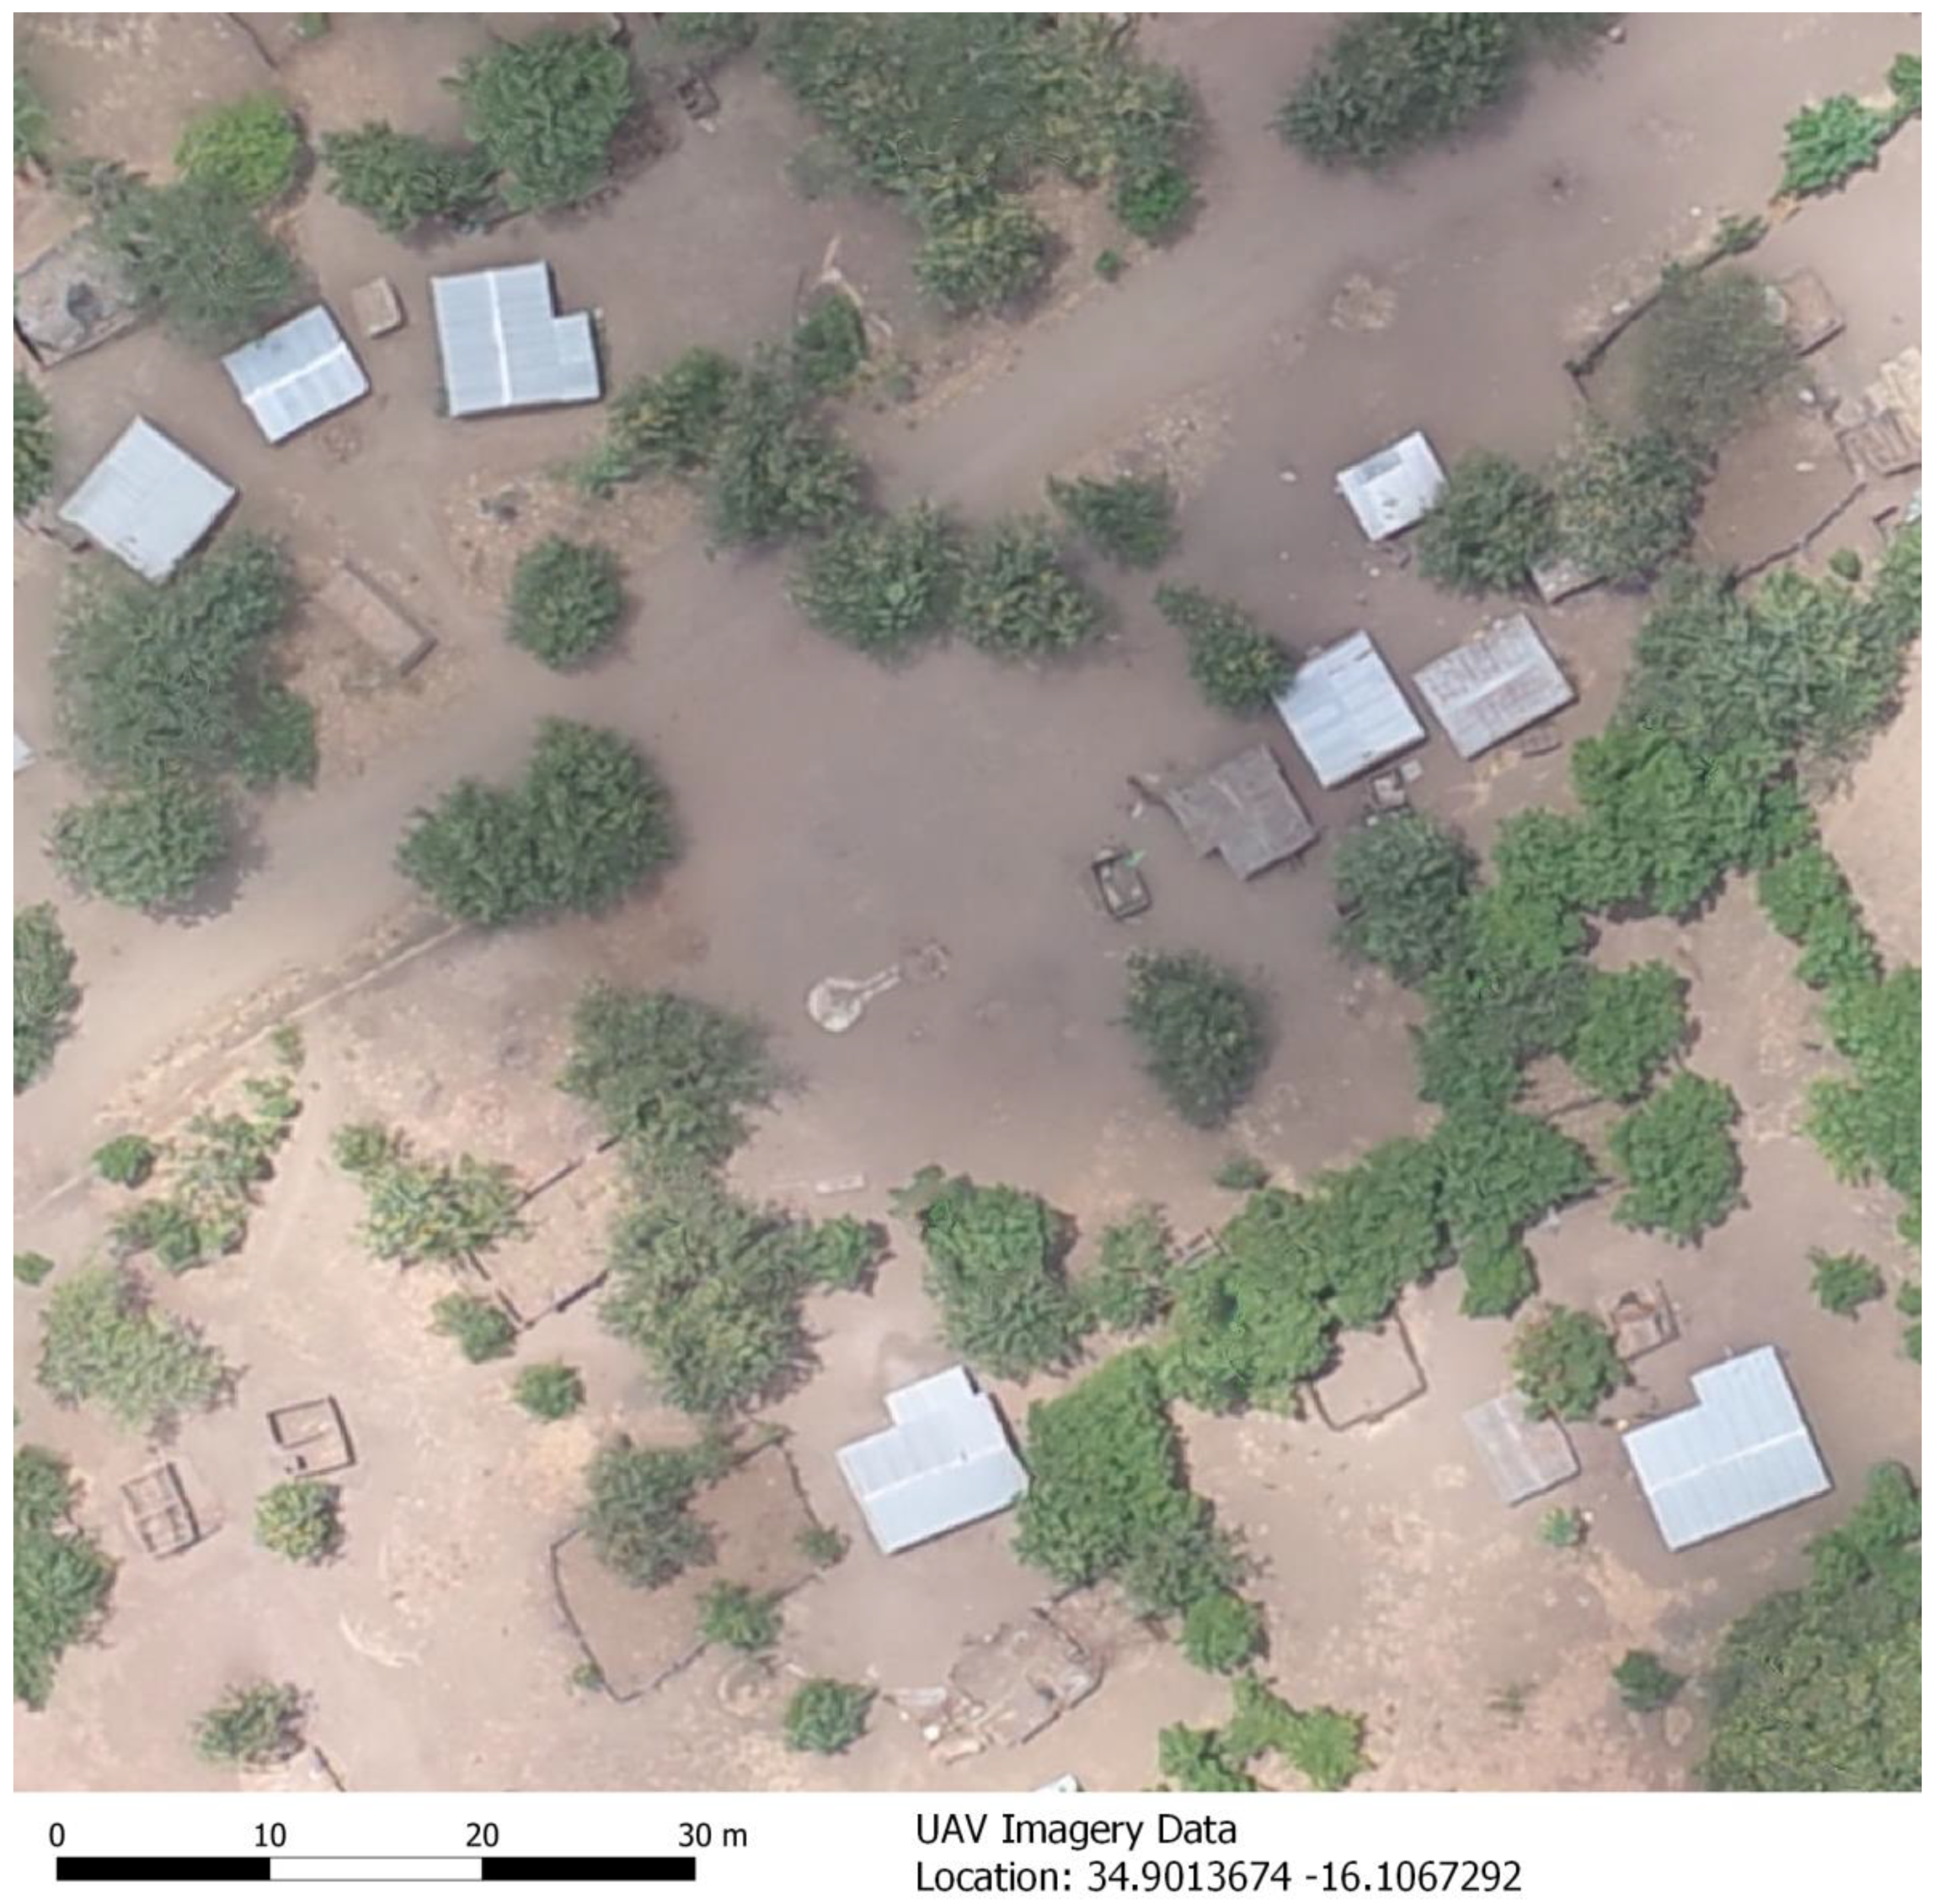
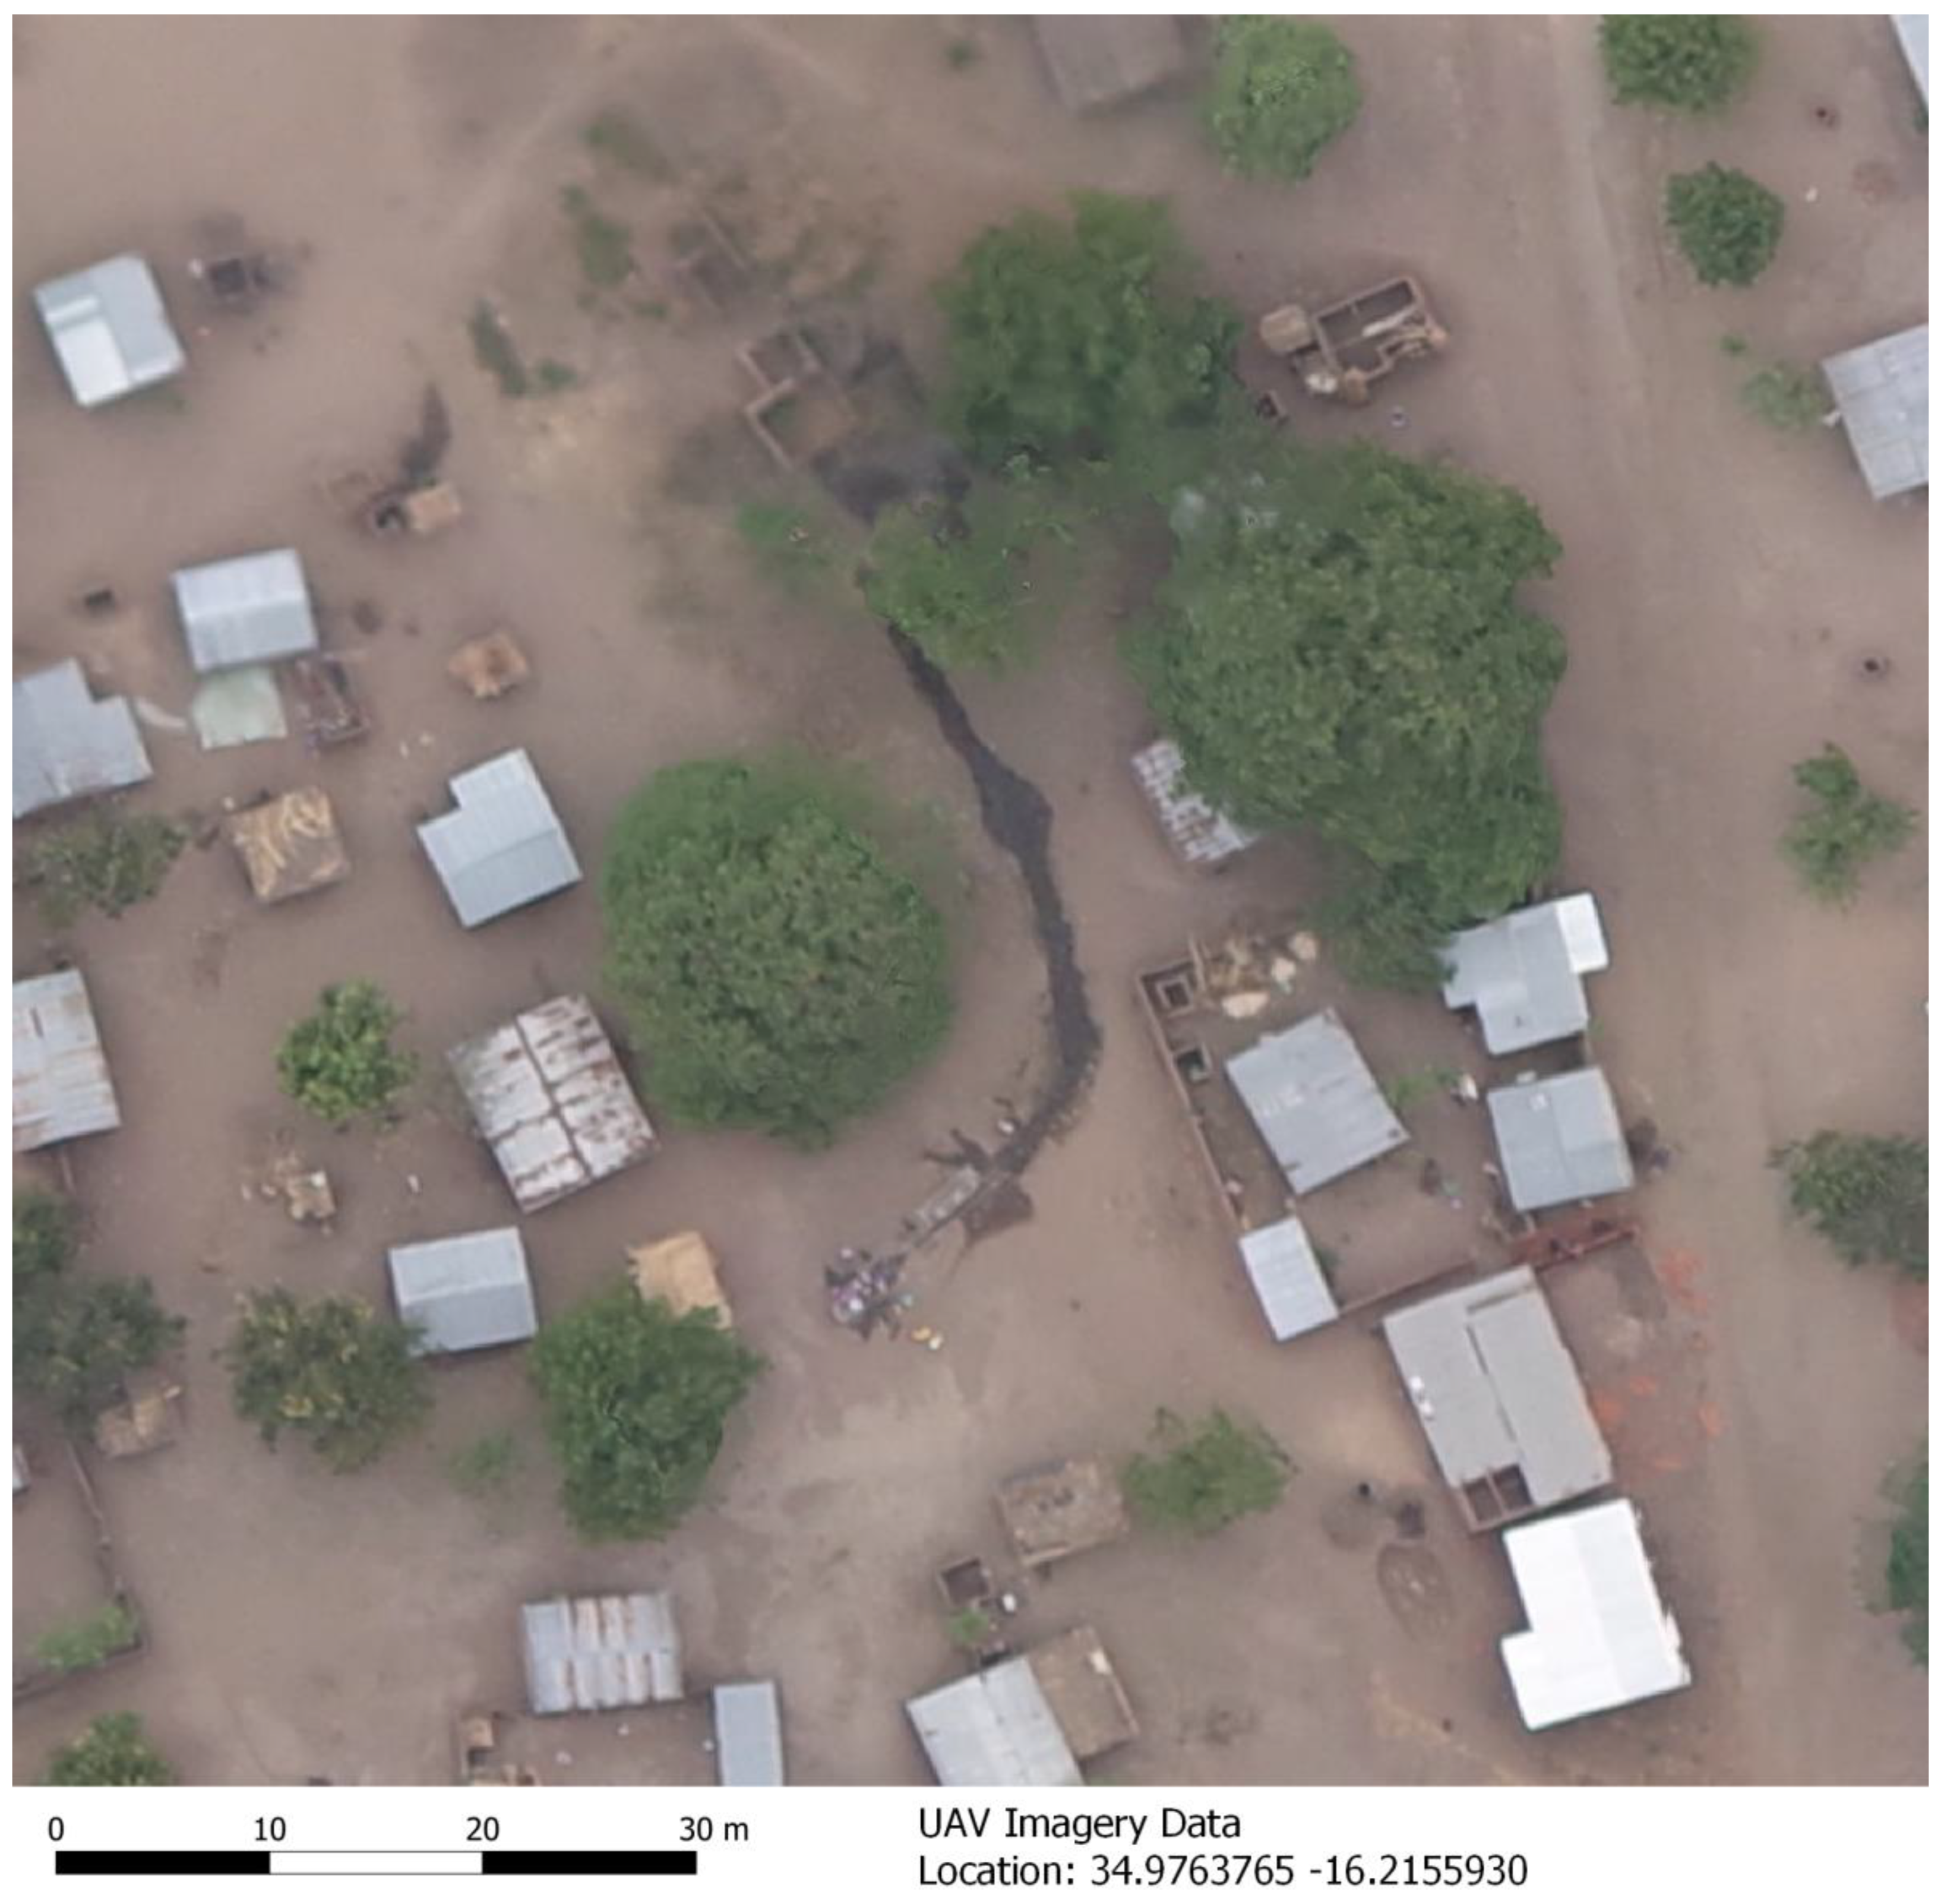
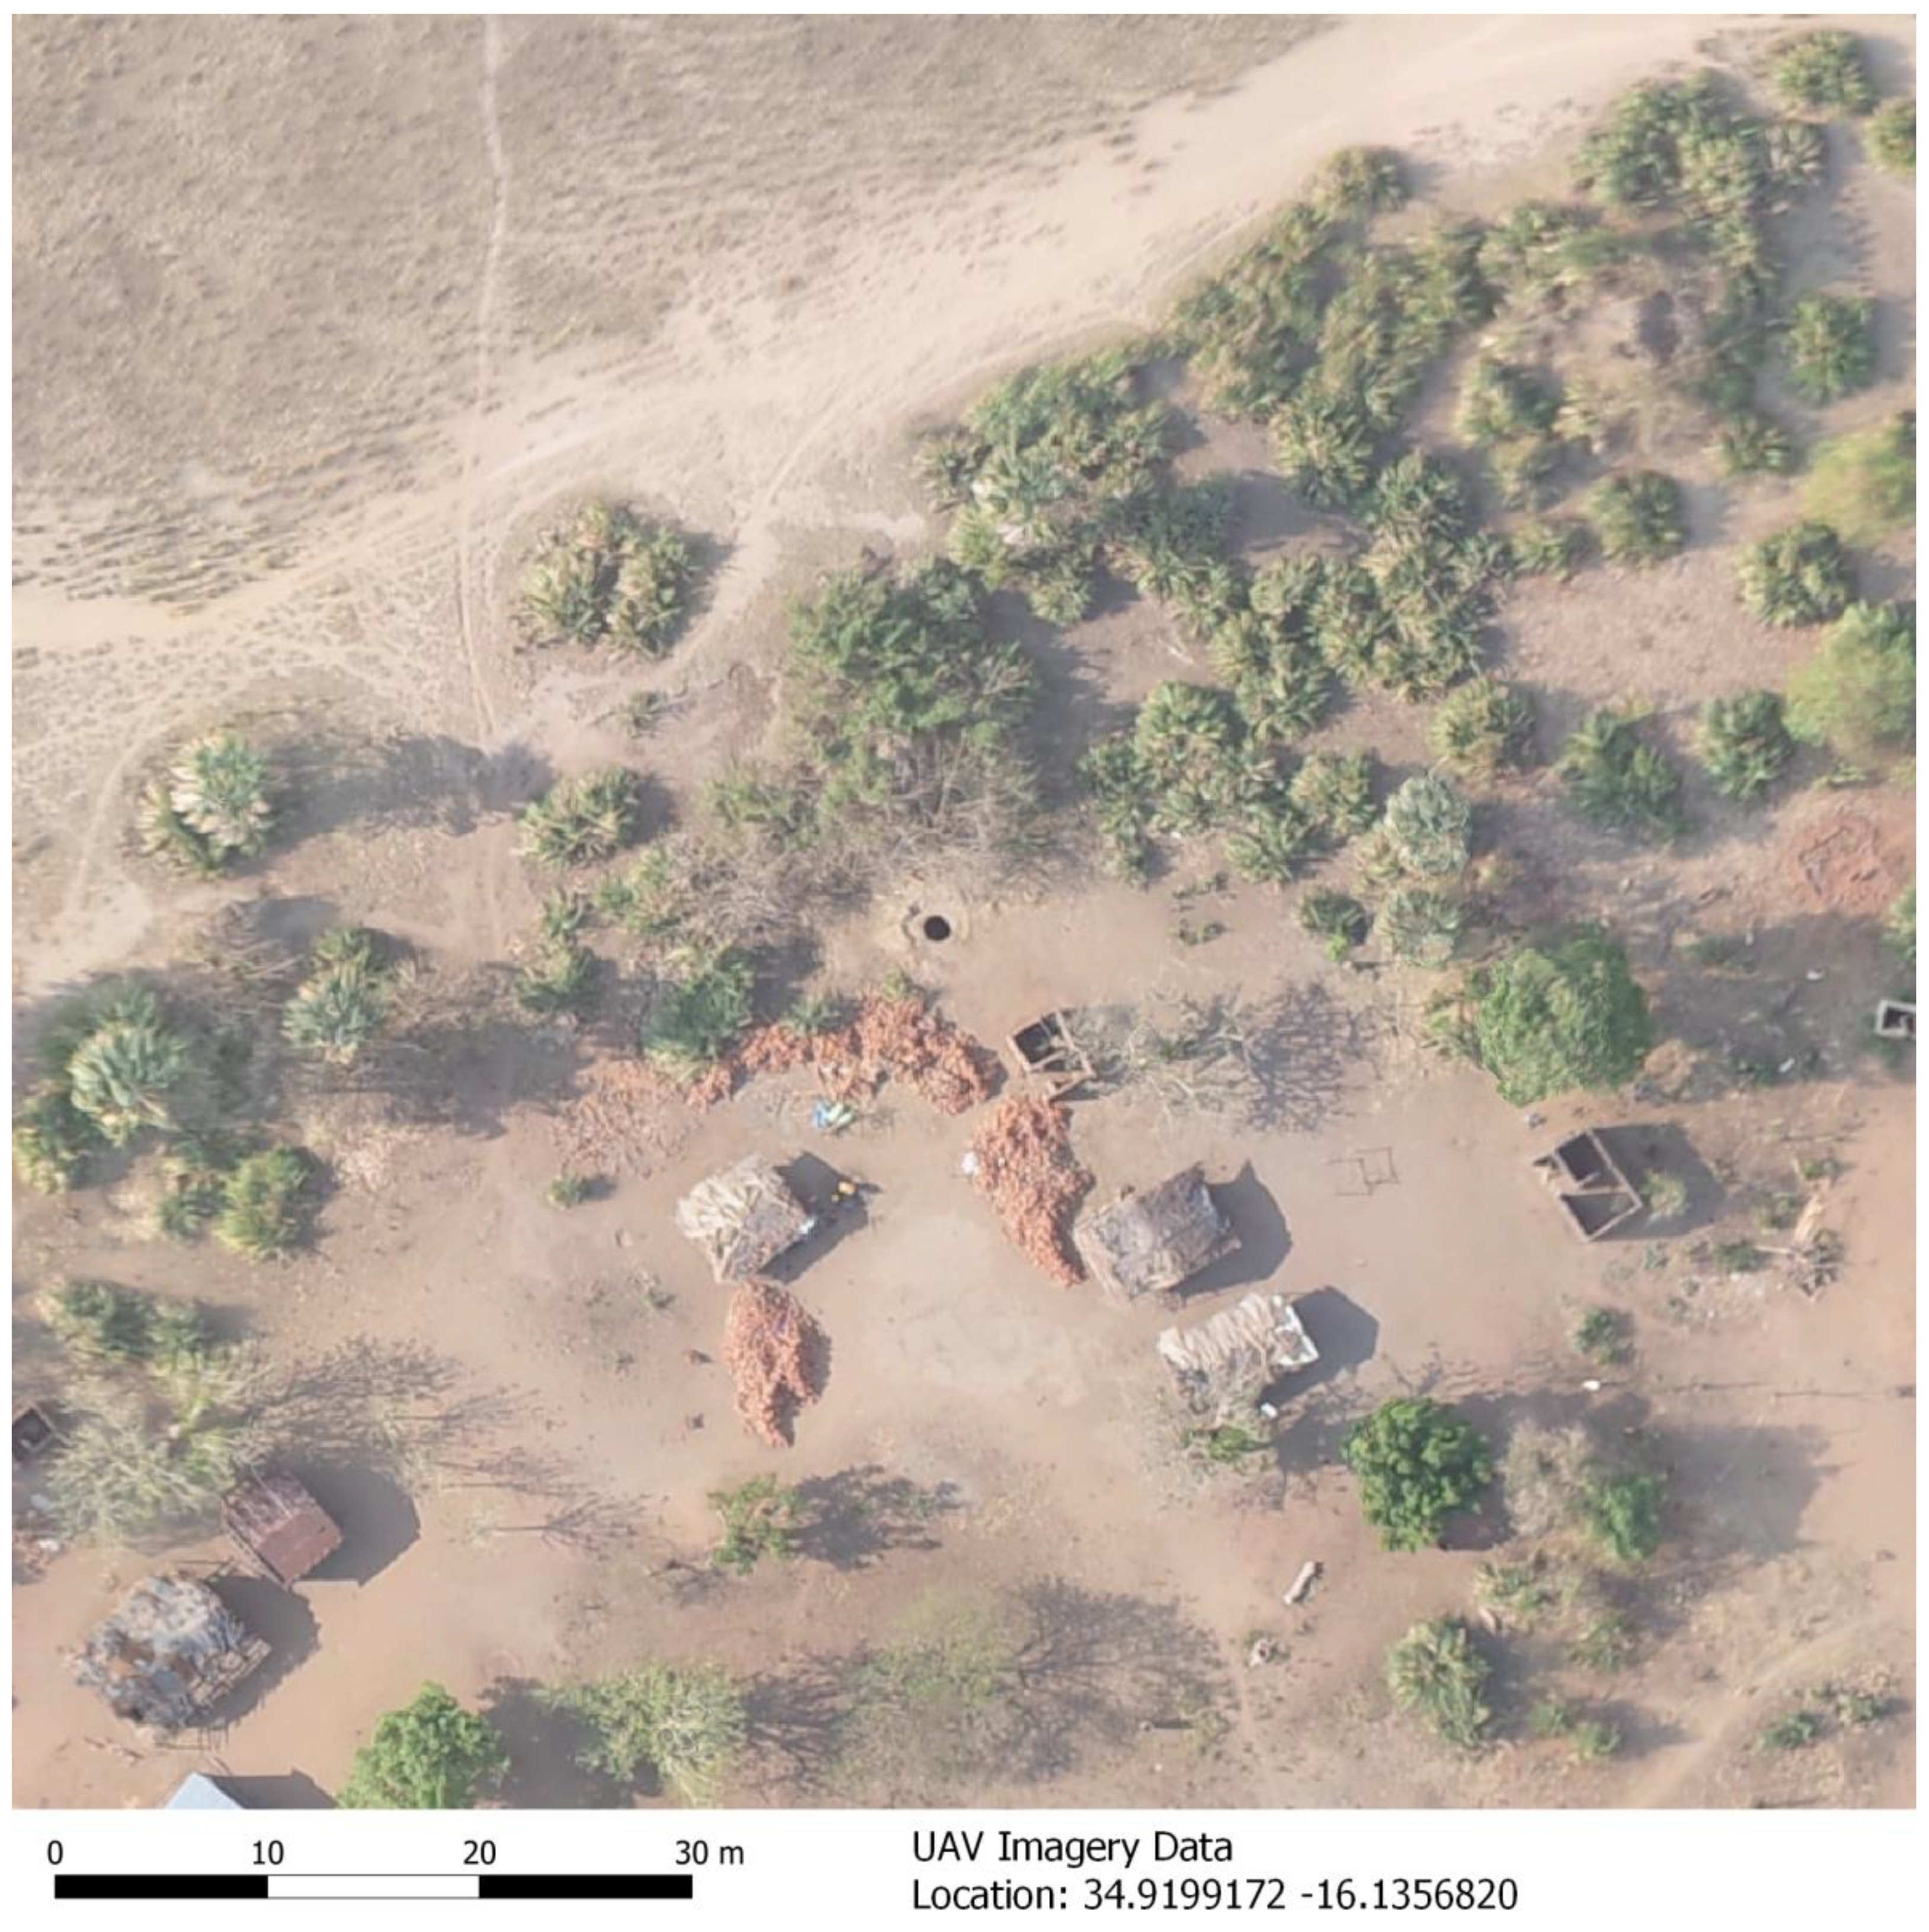
3.2.1. Visual Inspection
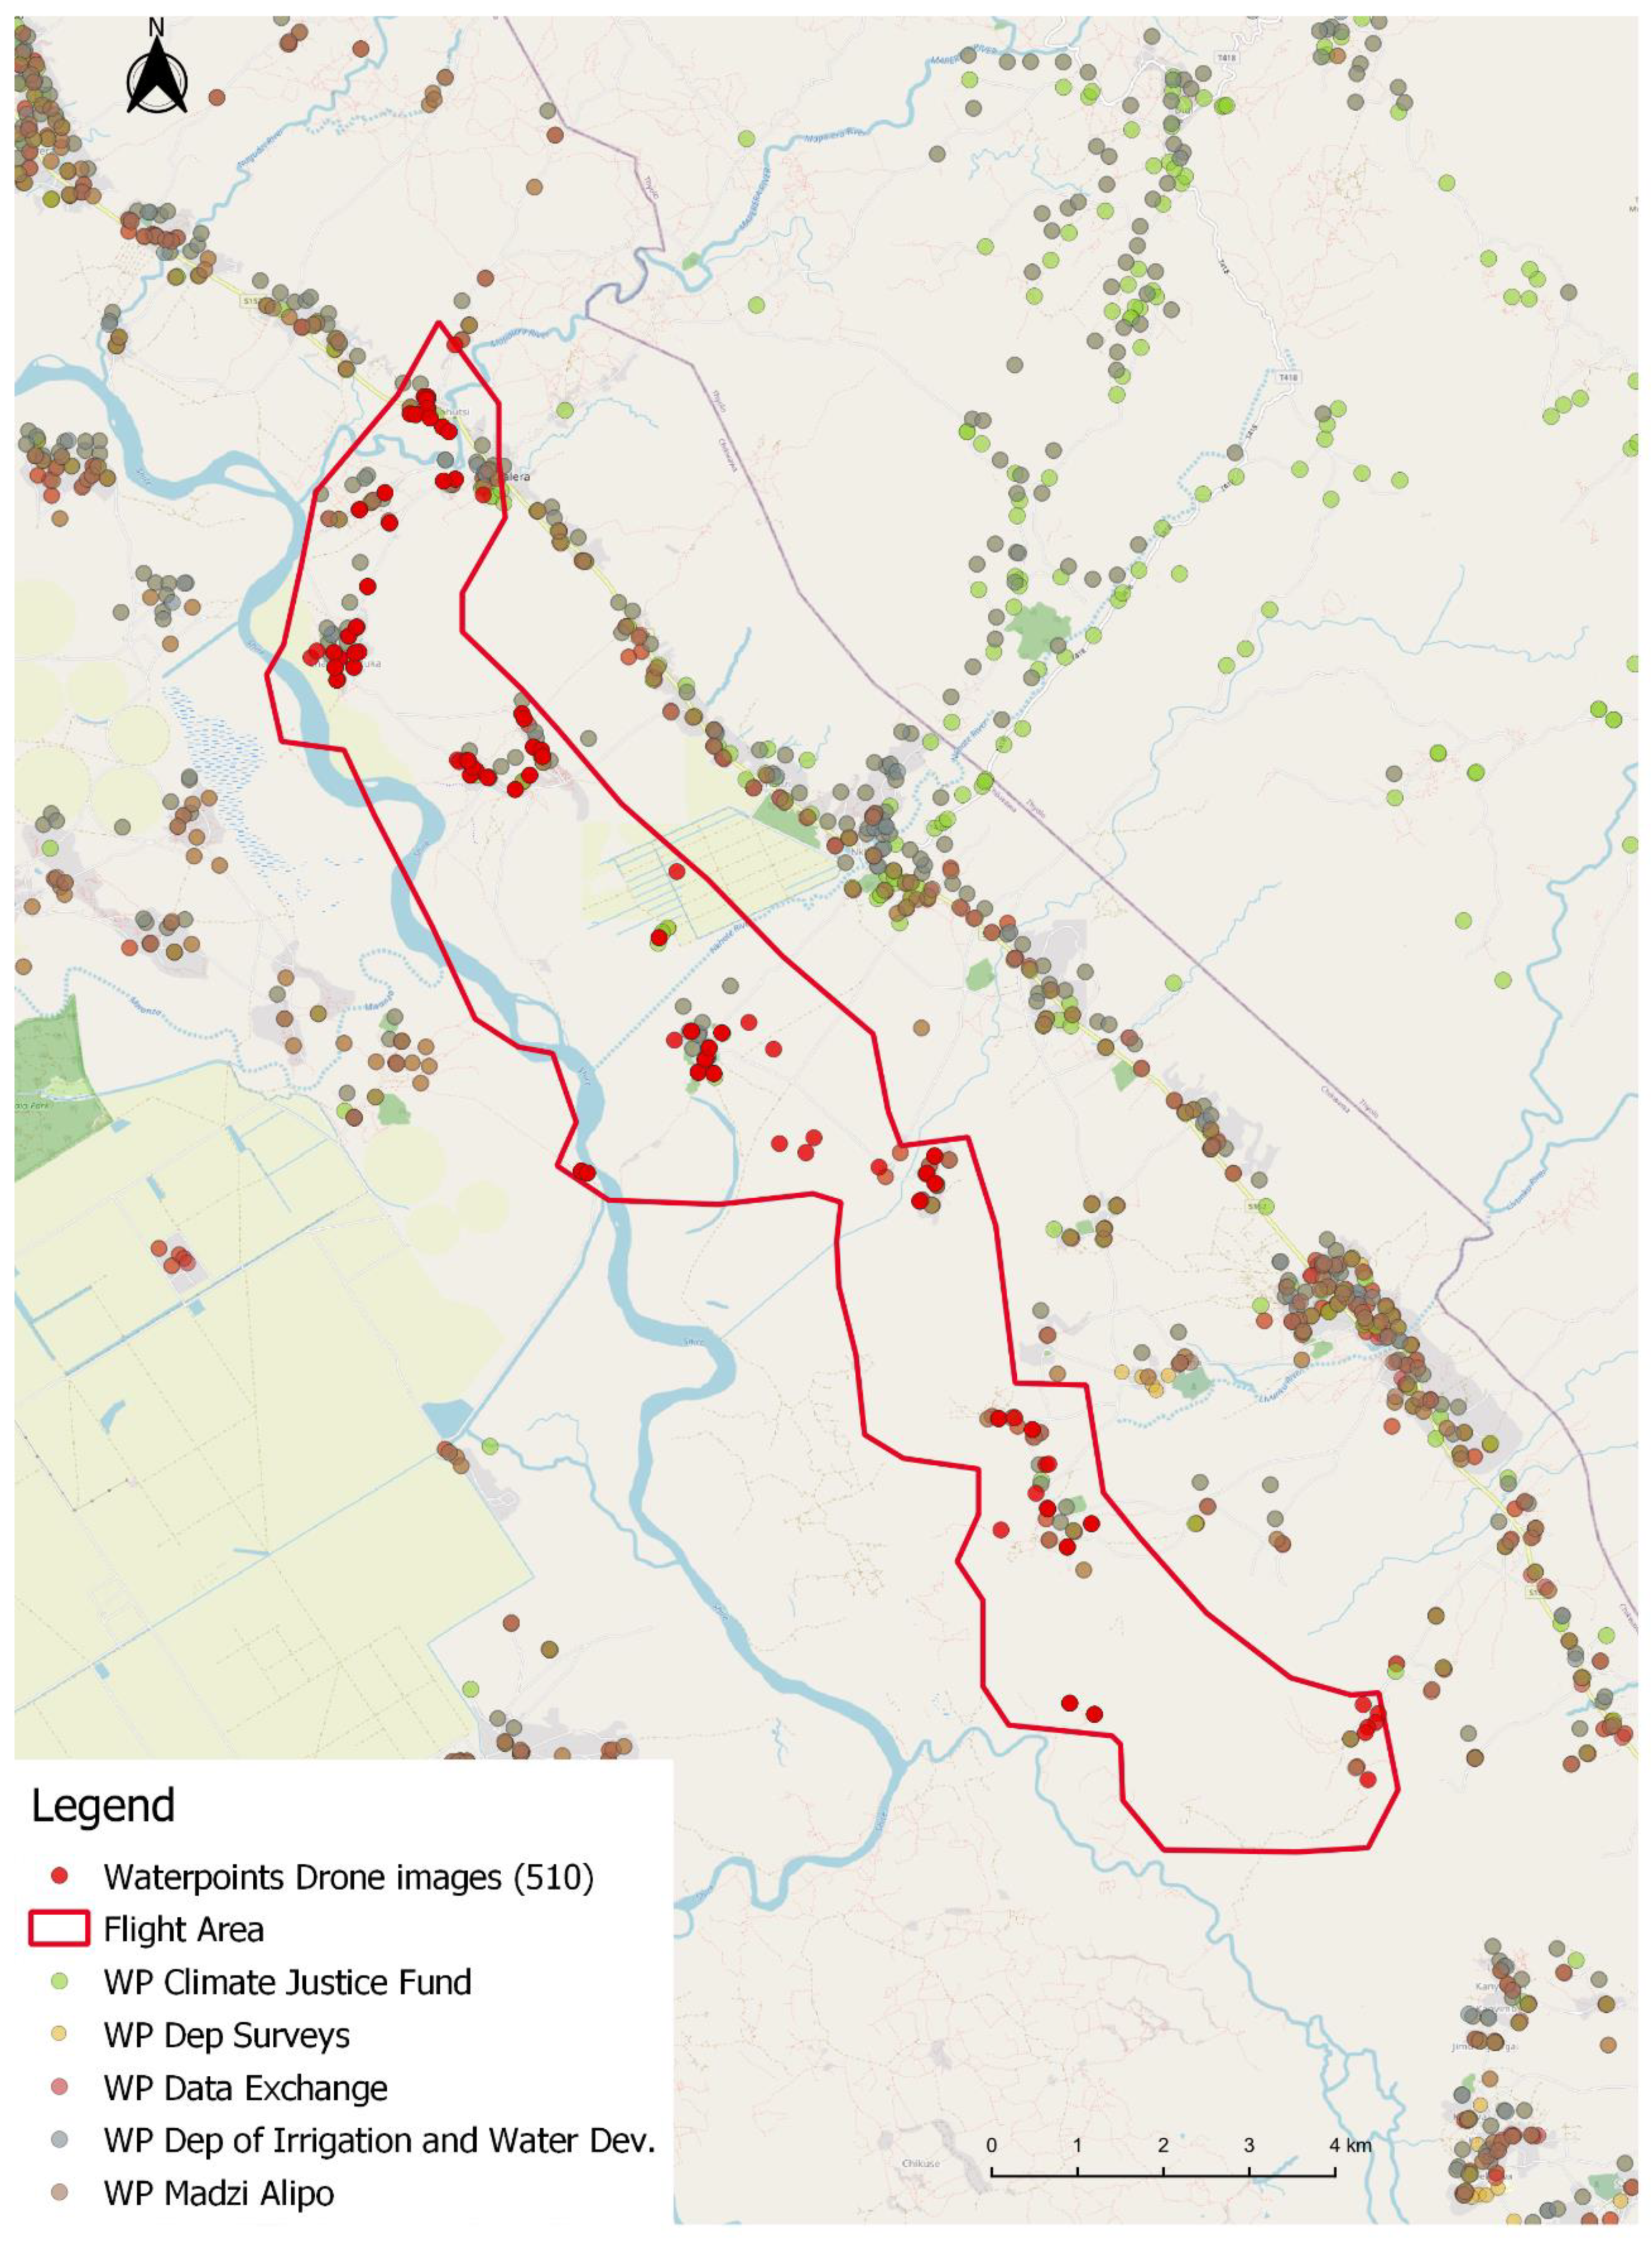
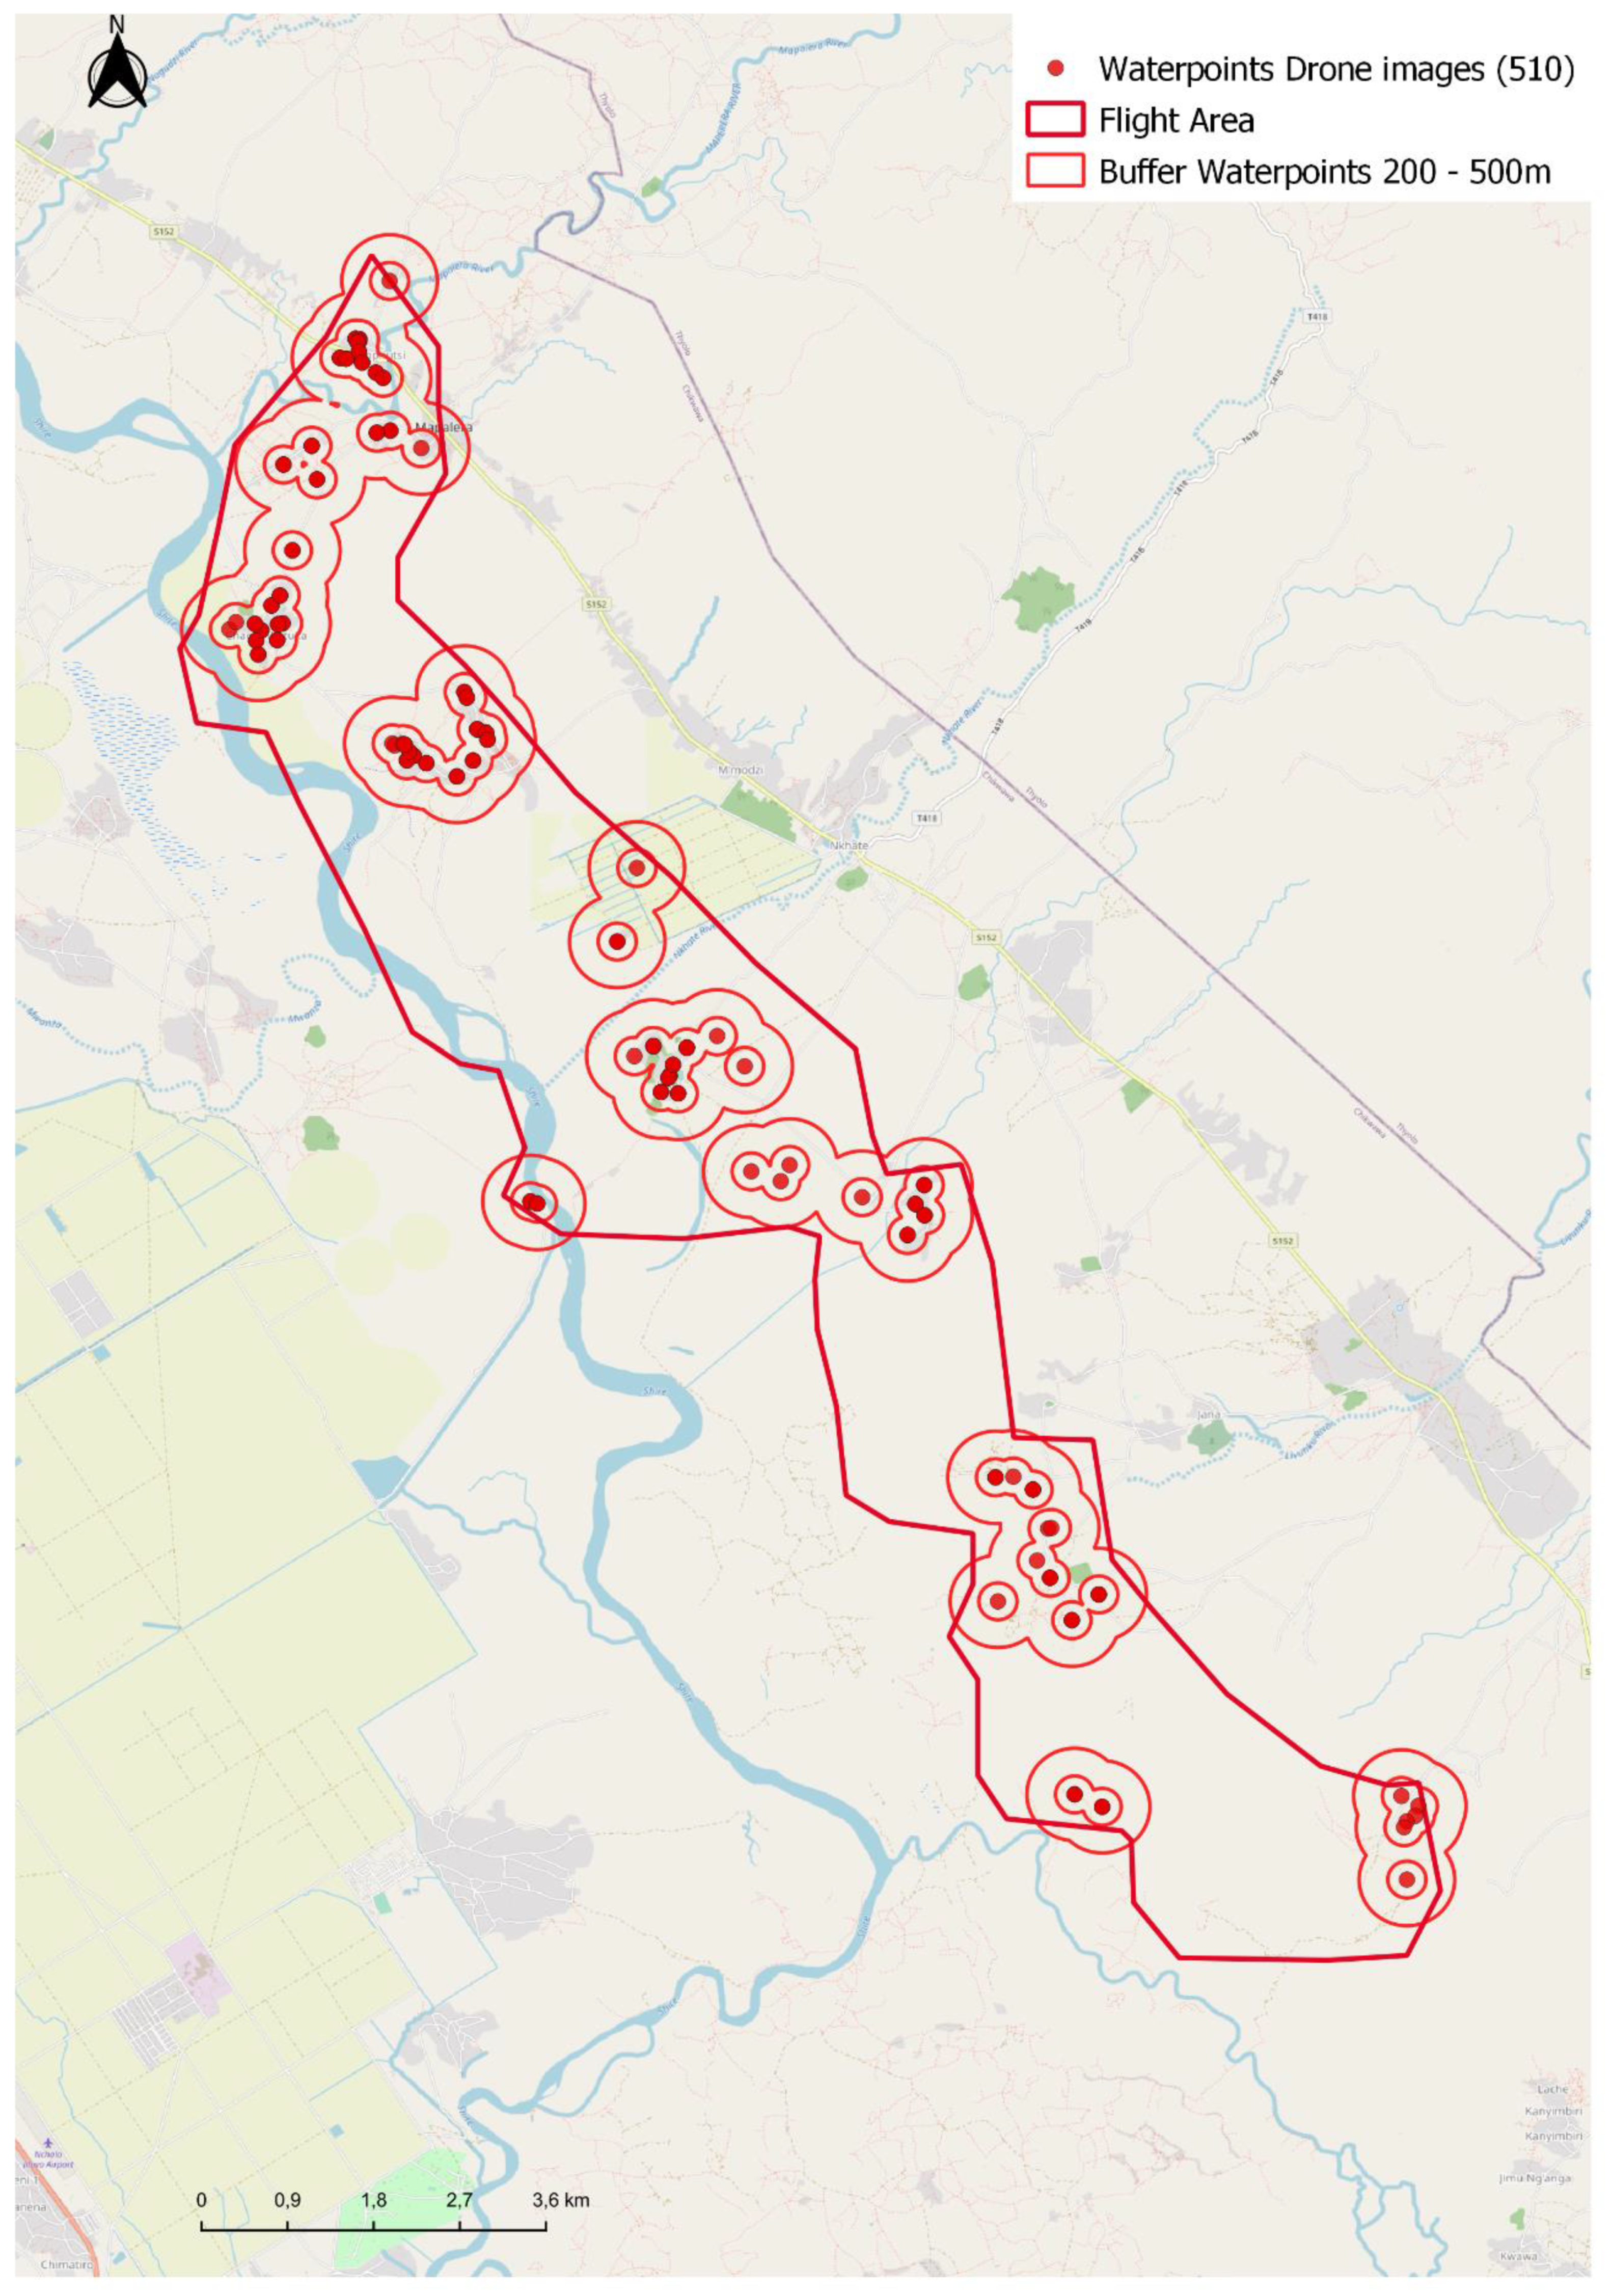
3.2.2. Contrasting UAV Imagery with the Data on Water Points from other Organizations
4. Discussion
5. Conclusions
Author Contributions
Funding
Conflicts of Interest
References
- Metadata Indicator SDG 6. Available online: https://unstats.un.org/sdgs/metadata (accessed on 30 November 2019).
- Fritz, S.; See, L.; Carlson, T.; Haklay, M.M.; Oliver, J.L.; Fraisl, D.; Wehn, U. Citizen science and the United Nations sustainable development goals. Nat. Sustain. 2019, 2, 922–930. [Google Scholar] [CrossRef]
- Kitchin, R.; Lauriault, T.P. Small data in the era of big data. GeoJournal 2015, 80, 463–475. [Google Scholar] [CrossRef]
- See, L.; Fritz, S.; Moorthy, I.; Danylo, O.; van Dijk, M.; Ryan, B. Using Remote Sensing and Geospatial Information for Sustainable Development. In From Summits to Solutions: Innovations in Implementing the Sustainable Development Goals; Desai, R., Kato, H., Kharas, H., McArthur, J.W., Eds.; Brookings Institution Press: Washington, DC, USA, 2018. [Google Scholar]
- Walz, Y.; Min, A.; Dall, K.; Duguru, M.; Villagran de Leon, J.-C.; Graw, V.; Dubovyk, O.; Sebesvari, Z.; Jordaan, A.; Post, J. Monitoring progress of the Sendai Framework using a geospatial model: The example of people affected by agricultural droughts in Eastern Cape, South Africa. Prog. Disaster Sci. 2020, 5, 100062. [Google Scholar] [CrossRef]
- Lemmens, R.; Lungo, J.; Georgiadou, Y.; Verplanke, J. Monitoring rural water points in Tanzania with mobile phones: The evolution of the SEMA app. ISPRS Int. J. Geo-Inf. 2017, 6, 316. [Google Scholar] [CrossRef]
- Fraisl, D.; Campbell, J.; See, L.; Wehn, U.; Wardlaw, J.; Gold, M.; Moorthy, I.; Arias, R.; Piera, J.; Oliver, J.L.; et al. Mapping citizen science contributions to the UN sustainable development goals. Sustain. Sci. 2020, 2020, 1–17. [Google Scholar]
- Anderson, K.; Ryan, B.; Sonntag, W.; Kavvada, A.; Friedl, L. Earth observation in service of the 2030 Agenda for Sustainable Development. Geo Spat. Inf. Sci. 2017, 20, 77–96. [Google Scholar] [CrossRef]
- Global Partnership for Sustainable Development Data GPSDD Using Citizen-Generated Data to monitor the SDGs. Available online: http://www.data4sdgs.org/sites/default/files/2017-09/Making%20Use%20of%20Citizen-Generated%20Data%20-%20Data4SDGs%20Toolbox%20Module.pdf (accessed on 29 July 2020).
- Scholz, S.; Knight, P.; Eckle, M.; Marx, S.; Zipf, A. Volunteered Geographic Information for Disaster Risk Reduction—The Missing Maps Approach and Its Potential within the Red Cross and Red Crescent Movement. Remote Sens. 2018, 10, 1239. [Google Scholar] [CrossRef]
- World Health Organization WHO. Safely Managed Drinking Water—Thematic Report On Drinking Water. Available online: https://www.who.int/water_sanitation_health/publications/safely-managed-drinking-water/en/ (accessed on 7 October 2020).
- Van den Homberg, M.; Susha, I. Characterizing data ecosystems to support official statistics with open mapping data for reporting on sustainable development goals. ISPRS Int. J. Geo-Inf. 2018, 7, 456. [Google Scholar] [CrossRef]
- Verplanke, J.; Georgiadou, Y. Wicked Water Points: The Quest for an Error Free National Water Point Database. ISPRS Int. J. Geo-Inf. 2017, 6, 244. [Google Scholar] [CrossRef]
- UN-Water. Overview 2019–2022 Data Collection Process and Timeline for SDG 6 Global Indicators. Available online: https://www.sdg6monitoring.org/activities/overview-2019-2022-data-collection-process-and-timeline-for-sdg-6-global-indicators/ (accessed on 29 April 2020).
- UN-Water SDG 6 Data Portal. Available online: https://www.sdg6data.org/ (accessed on 29 April 2020).
- Malawi 2020 Voluntary National Review Report for Sustainable Development Goals. 2020. Available online: https://sustainabledevelopment.un.org/content/documents/26317MalawiVNRReport.pdf (accessed on 7 October 2020).
- Community Risk Assessment Dashboard. Available online: https://dashboard.510.global/#!/ (accessed on 7 October 2020).
- Chirwa, I. Presented at the United Nations Regional Workshop on the 2020 World Programme on Population and Housing Censuses: International Standards and Contemporary Technologies. Available online: https://unstats.un.org/unsd/demographic-social/meetings/2017/lusaka--regional-workshop-on-2020-census/docs/s09-02-Malawi.pptx (accessed on 7 October 2020).
- Data4SDG: Characterizing the Data Supply Dimension of Data Ecosystems. Available online: https://rodekruis.github.io/Data4SDG_Malawi/ (accessed on 7 October 2020).
- ICF. 2018. Available online: https://dhsprogram.com/What-We-Do/GPS-Data-Collection.cfm (accessed on 1 November 2018).
- Albuquerque, J.P.D.; Herfort, B.; Eckle, M. The tasks of the crowd: A typology of tasks in geographic information crowdsourcing and a case study in humanitarian mapping. Remote Sens. 2016, 8, 859. [Google Scholar] [CrossRef]
- Ma, L.; Liu, Y.; Zhang, X.; Ye, Y.; Yin, G.; Johnson, B.A. Deep learning in remote sensing applications: A meta-analysis and review. ISPRS J. Photogram. Remote Sens. 2019, 152, 166–177. [Google Scholar] [CrossRef]
- ArcGIS. Available online: https://livingatlas.arcgis.com/en/browse/#d=2&srt=recent&cont=esriOnly&q=malawi%20and%20owner%3Aesri%20and%20tags%3Ademographics (accessed on 30 November 2019).
- The Water Point Data Exchange. Available online: https://www.waterpointdata.org/ (accessed on 30 November 2019).
- Buying Satellite Imagery: Pricing Information for High Resolution Satellite Imagery. Available online: http://www.landinfo.com/satellite-imagery-pricing.html (accessed on 30 November 2019).
- Espey, J.; Swanson, E.; Badiee, S.; Christensen, Z.; Fischer, A.; Levy, M.; Yetman, G.; de Sherbinin, A.; Chen, R.; Qiu, Y.; et al. Data for Development: A Needs Assessment for SDG Monitoring and Statistical Capacity Development. Available online: https://www.sdsntrends.org/research/2015/7/15/data-for-development-a-needs-assessment-for-sdg-monitoring-and-statistical-capacity-development (accessed on 7 October 2020).
- OpenAerialMap. Available online: https://openaerialmap.org/ (accessed on 30 November 2019).


| Service Level | Definition |
|---|---|
| Safely managed | Drinking water from an improved water source which is located on premises, available when needed and free of faecal and priority contamination. |
| Basic | Drinking water from an improved source provided collection time is not more than 30 min for a roundtrip including queuing. |
| Limited | Drinking water from an improved source where collection time exceeds over 30 min for a roundtrip to collect water, including queuing. |
| Unimproved | Drinking water from an unprotected dug well or unprotected spring |
| No service | Drinking water collected directly from a river, dam, lake, pond, stream, canal or irrigation channel |
| Data Provider | Number of Data Provider Water Points in UAV Area | Match with Water Points Identified on UAV Imagery within 15 m | 50 m | 100 m | 200 m | 200 m (Outside UAV Area) | 500 m | 500 m (Outside UAV Area) |
|---|---|---|---|---|---|---|---|---|
| Madzi Alipo | 52 | 20 | 29 | 36 | 45 | 1 | 54 | 2 |
| DoIW | 41 | 0 | 1 | 8 | 18 | 0 | 43 | 2 |
| CJF | 38 | 15 | 17 | 24 | 32 | 0 | 40 | 2 |
| WPDx | 57 | 23 | 29 | 37 | 49 | 1 | 59 | 2 |
| Dept of Surveys | 99 | 22 | 31 | 45 | 69 | 1 | 103 | 4 |
| Total | 287 | 80 | 107 | 150 | 213 | 3 | 299 | 12 |
| Explanation | Number |
|---|---|
| Total number of water points | 266 |
| Match with existing databases within 15 m | 80 |
| Without match within 15 m to existing databases | 137 |
| Protection of water point | |
| Protected | 67 |
| Un-protected | 80 |
| Unknown | 119 |
| Functionality of water point | |
| Functional | 68 |
| Non-functional | 10 |
| Unknown | 188 |
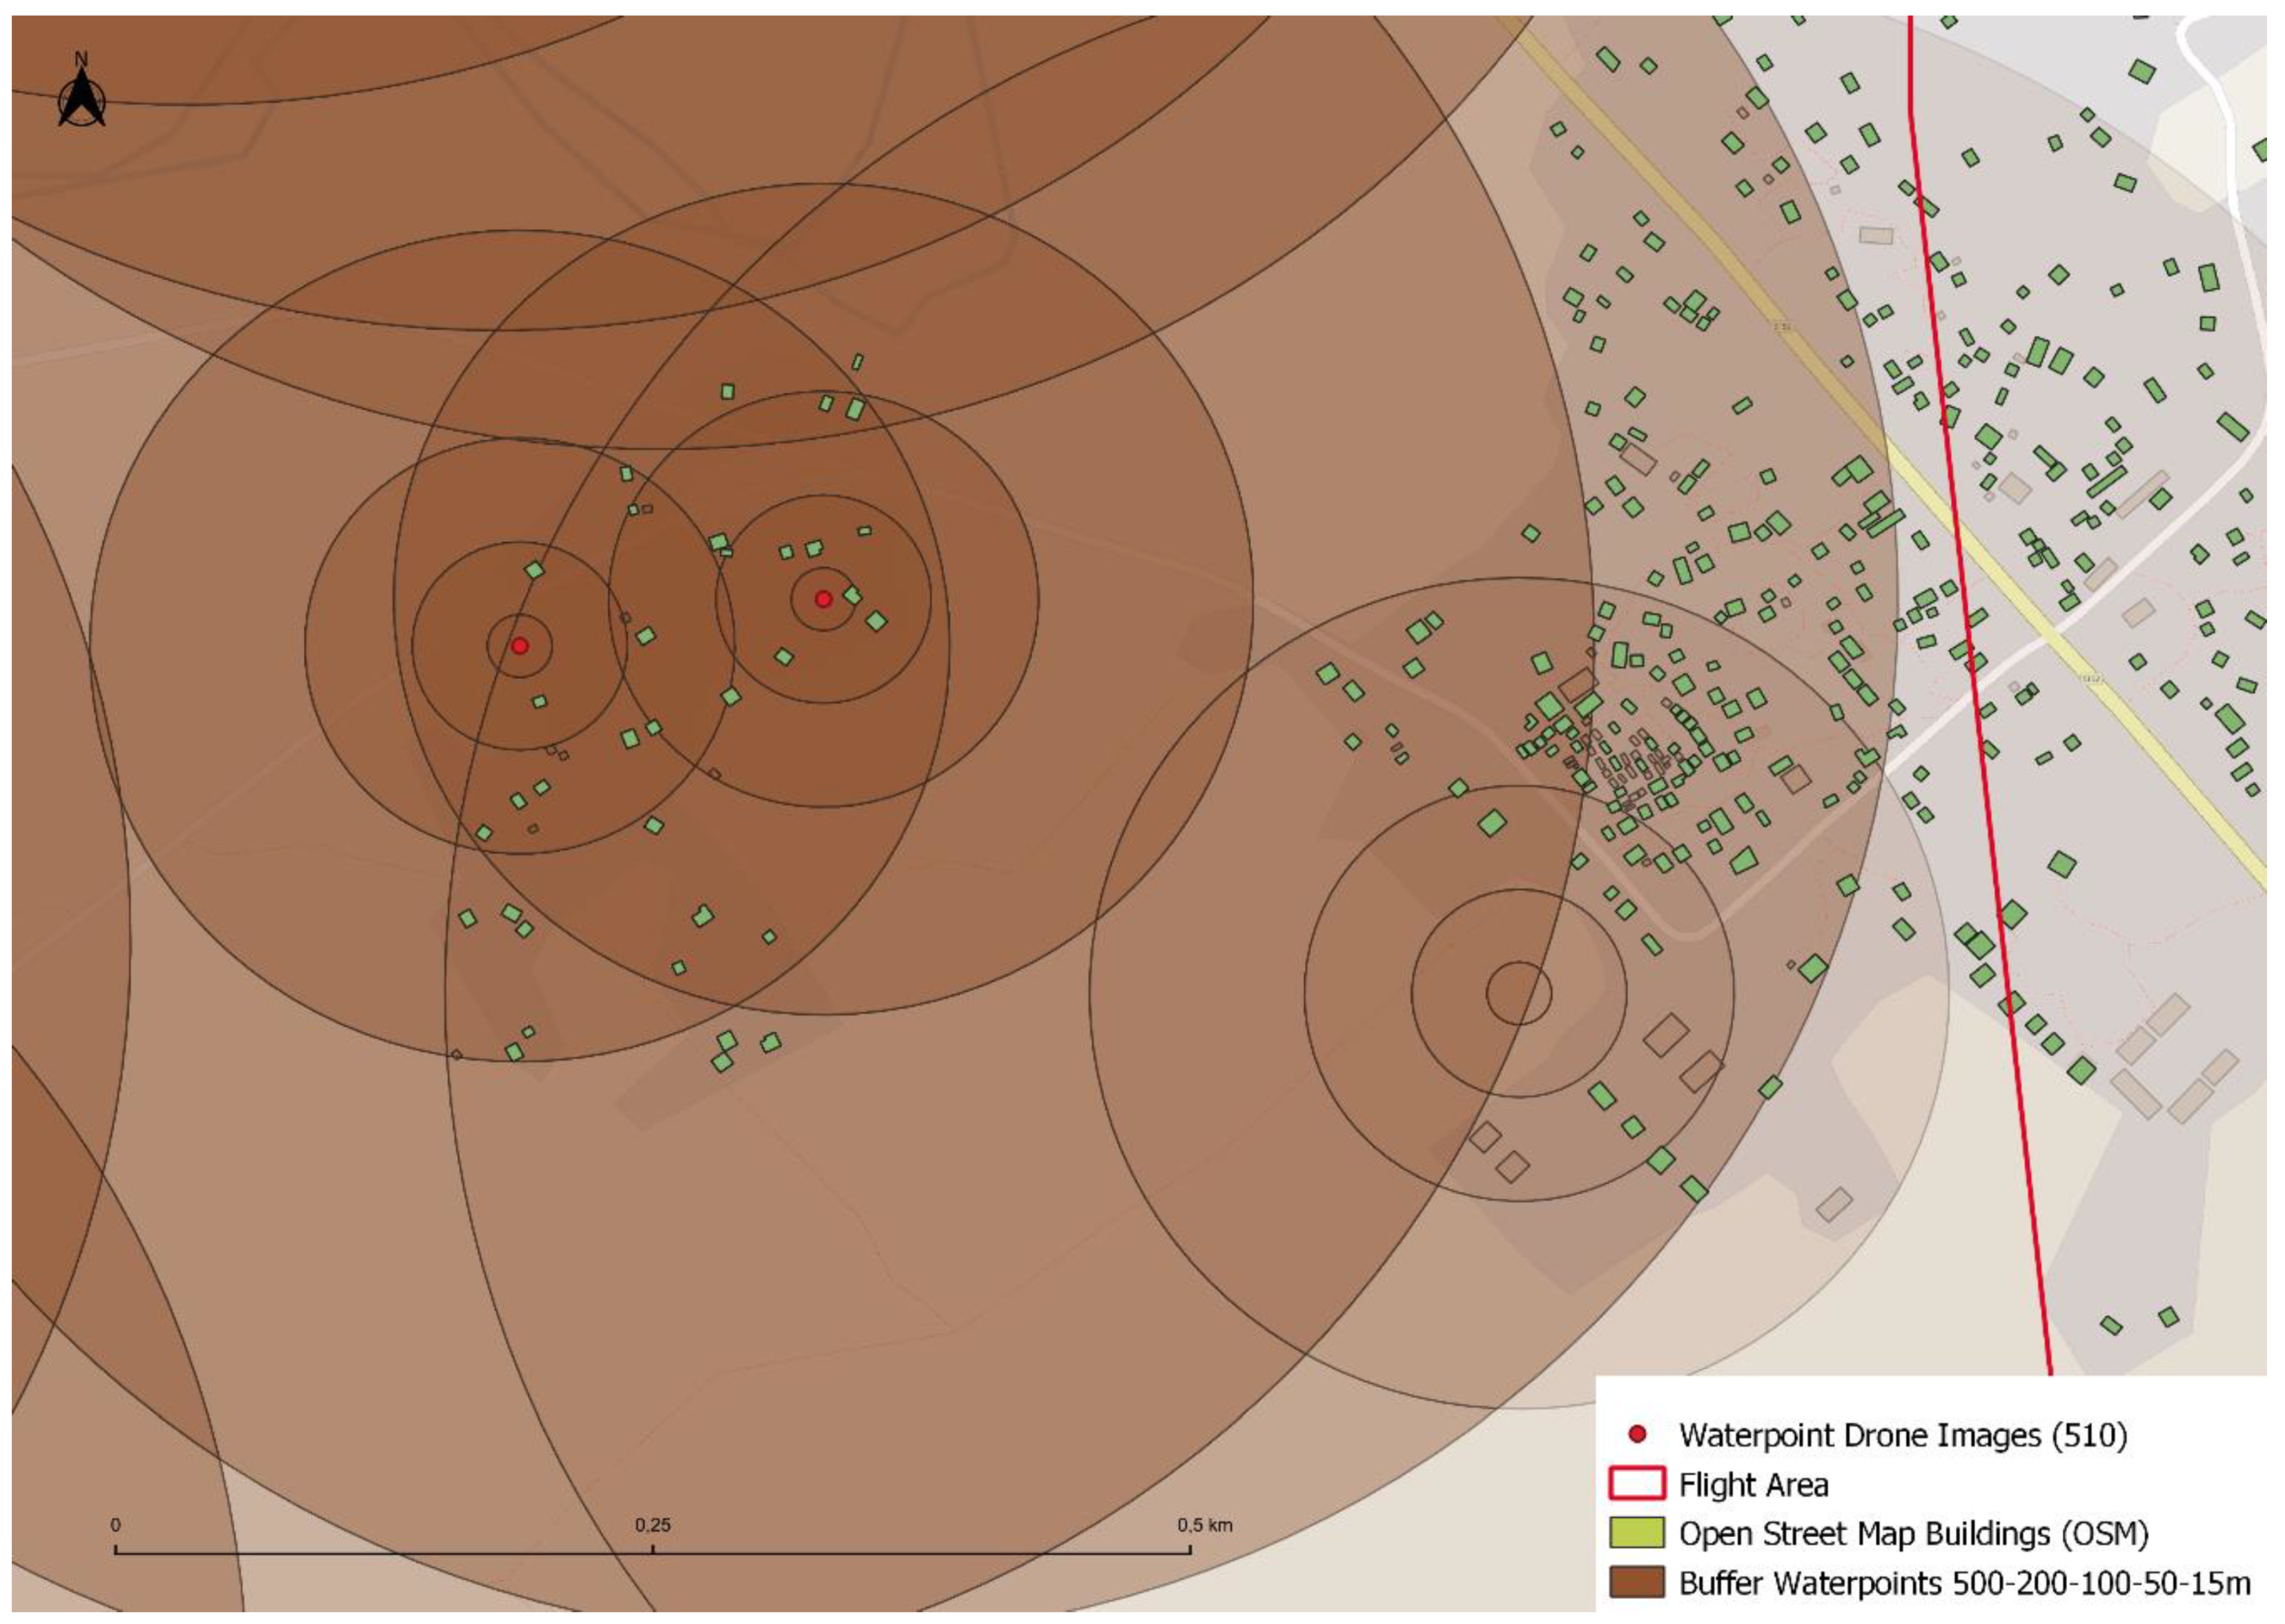
| Radius around Water Point (m) | Number of OSM Buildings | ||
|---|---|---|---|
| Ground Surface of Building | |||
| All Sizes | >15 | ||
| Whole UAV image | 4963 | 3614 | 3518 |
| 15 | 34 | 23 | 23 |
| 50 | 578 | 416 | 409 |
| 100 | 1730 | 1314 | 1286 |
| 200 | 3145 | 2428 | 2383 |
| 500 | 4407 | 3463 | 3390 |
| >500 | 556 | 151 | 128 |
| Attributes | Data Source | ||
|---|---|---|---|
| Data acquisition | UAV (11 cm), Satellite imagery (30 cm) | Satellite imagery (50 cm) | Field survey |
| Data analysis | Visual inspection, GIS | OpenStreetMap, GIS | GIS |
| GPS location | Between 11 and 30 cm | 50 cm | With the accuracy of GPS device |
| Access | Walled/non-walled | Not collected | |
| Install year | Not possible to identify from the imagery | Collected in some surveys | |
| Installer/funder | |||
| Management of the water point | |||
| Free or paid service | |||
| Water quality | |||
| Number of users per water point | If imagery is taken at a certain time of the day, the number of persons around the water point could be counted. | Buildings can be traced and then uploaded in OSM. By overlaying with buildings in OSM as a proxy for the number of users. | Not collected |
| Type of water point | Protected/non-protected/unknown | Not possible | Electric or hand pump, open or piped water |
| Functionality | Possible | Collected in some surveys | |
| Visit time | Time of drone flight or overpass of satellite | Date when buildings traced by volunteers | When field survey is done |
| Reporter | Digital volunteer | Digital volunteer | Enumerator of organization |
© 2020 by the authors. Licensee MDPI, Basel, Switzerland. This article is an open access article distributed under the terms and conditions of the Creative Commons Attribution (CC BY) license (http://creativecommons.org/licenses/by/4.0/).
Share and Cite
van den Homberg, M.; Crince, A.; Wilbrink, J.; Kersbergen, D.; Gumbi, G.; Tembo, S.; Lemmens, R. Combining UAV Imagery, Volunteered Geographic Information, and Field Survey Data to Improve Characterization of Rural Water Points in Malawi. ISPRS Int. J. Geo-Inf. 2020, 9, 592. https://doi.org/10.3390/ijgi9100592
van den Homberg M, Crince A, Wilbrink J, Kersbergen D, Gumbi G, Tembo S, Lemmens R. Combining UAV Imagery, Volunteered Geographic Information, and Field Survey Data to Improve Characterization of Rural Water Points in Malawi. ISPRS International Journal of Geo-Information. 2020; 9(10):592. https://doi.org/10.3390/ijgi9100592
Chicago/Turabian Stylevan den Homberg, Marc, Arjen Crince, Jurg Wilbrink, Daniël Kersbergen, Gumbi Gumbi, Simon Tembo, and Rob Lemmens. 2020. "Combining UAV Imagery, Volunteered Geographic Information, and Field Survey Data to Improve Characterization of Rural Water Points in Malawi" ISPRS International Journal of Geo-Information 9, no. 10: 592. https://doi.org/10.3390/ijgi9100592
APA Stylevan den Homberg, M., Crince, A., Wilbrink, J., Kersbergen, D., Gumbi, G., Tembo, S., & Lemmens, R. (2020). Combining UAV Imagery, Volunteered Geographic Information, and Field Survey Data to Improve Characterization of Rural Water Points in Malawi. ISPRS International Journal of Geo-Information, 9(10), 592. https://doi.org/10.3390/ijgi9100592