Development of an Object-Based Interpretive System Based on Weighted Scoring Method in a Multi-Scale Manner

Abstract
1. Introduction
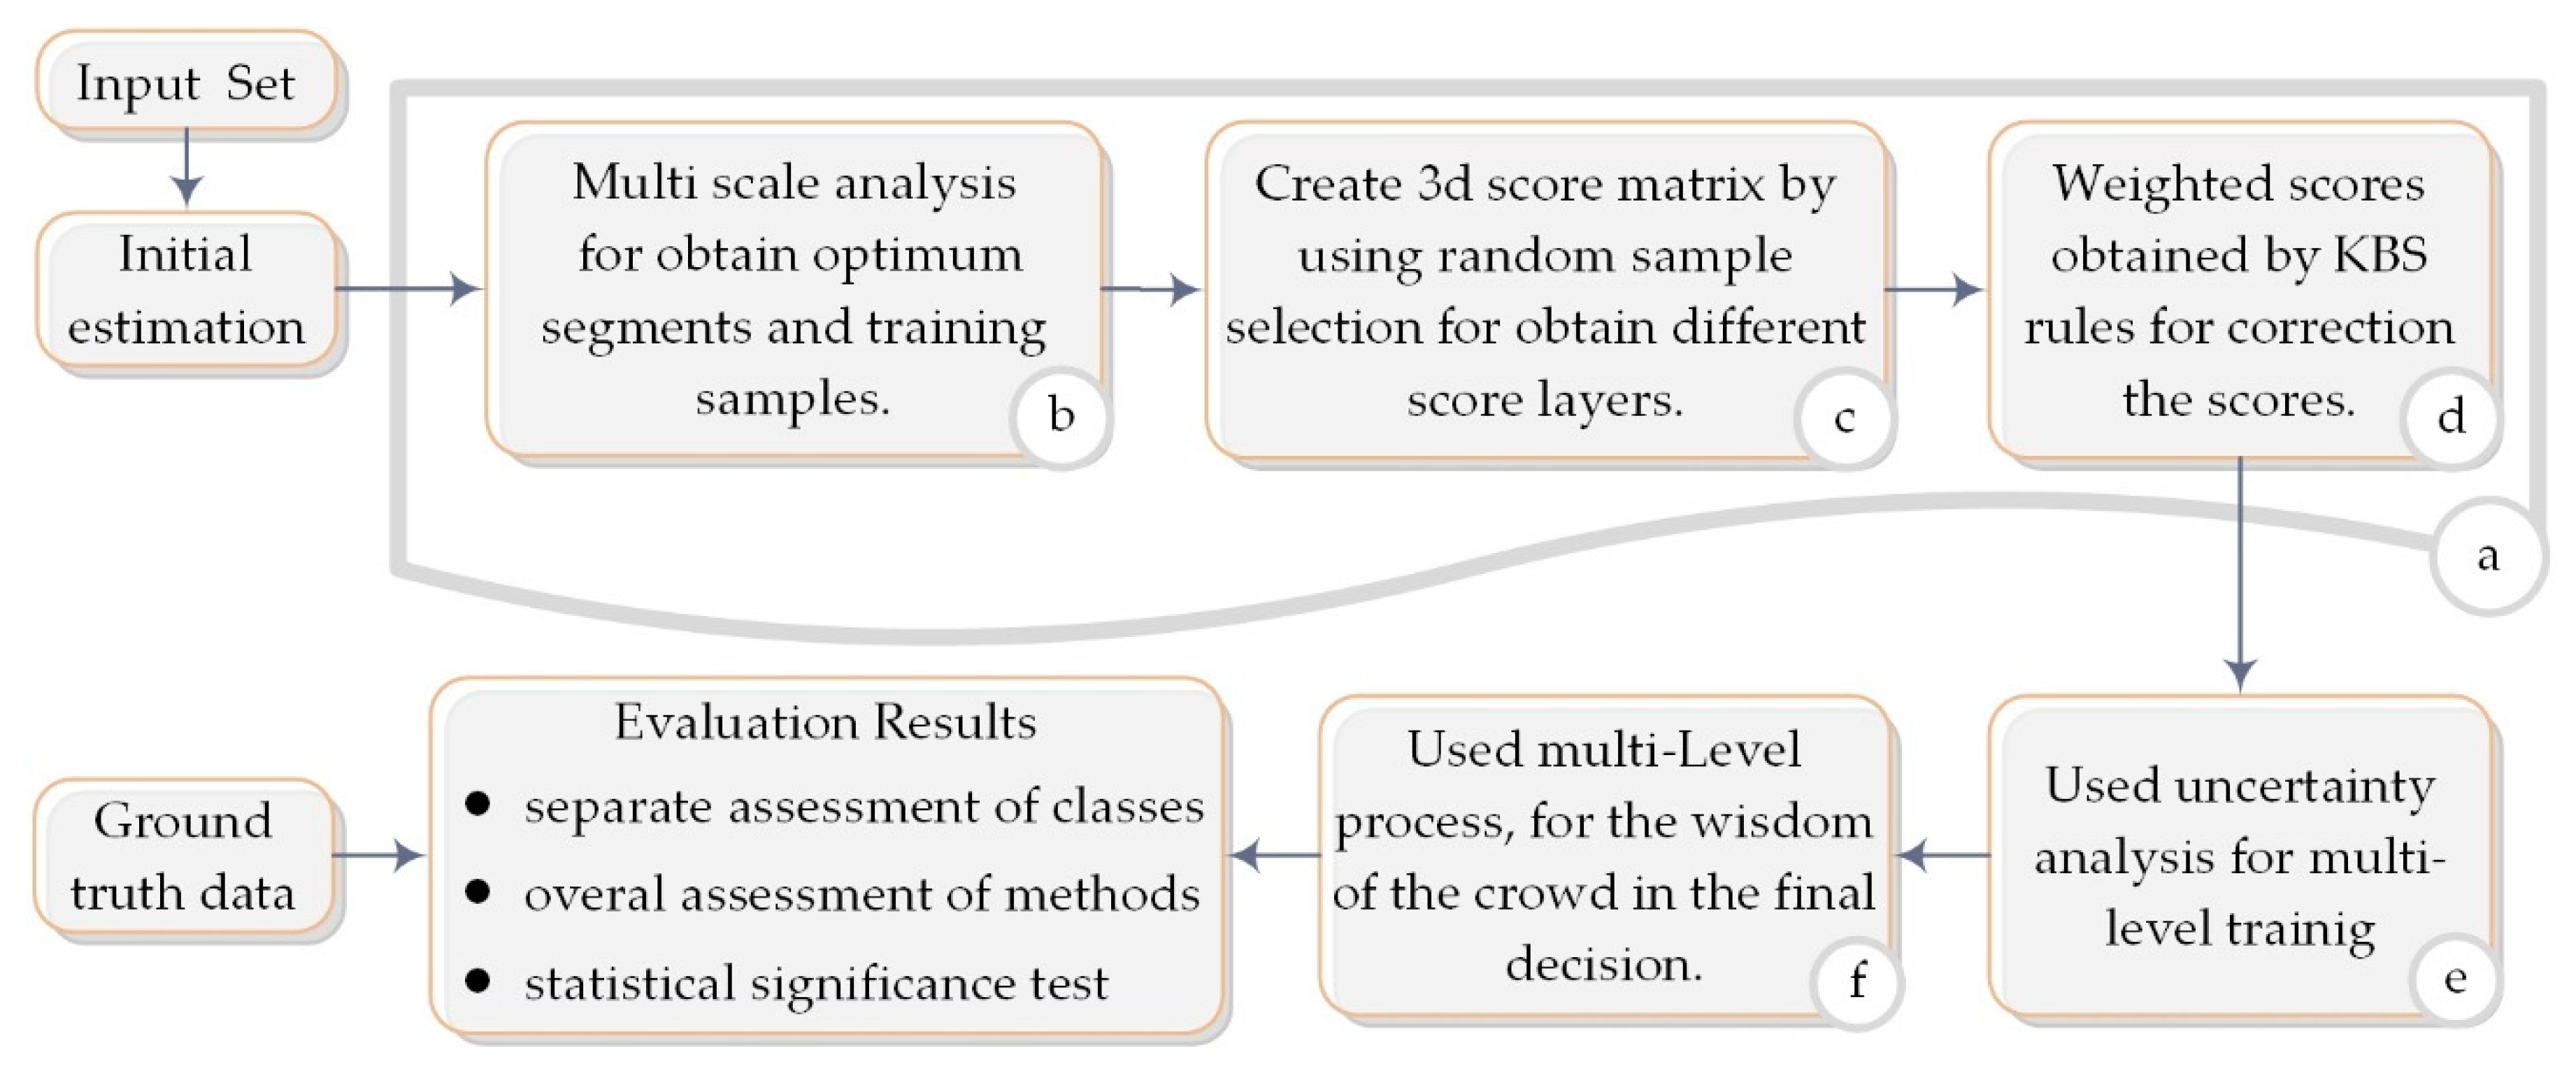
2. Proposed Method
2.1. Initial Estimation
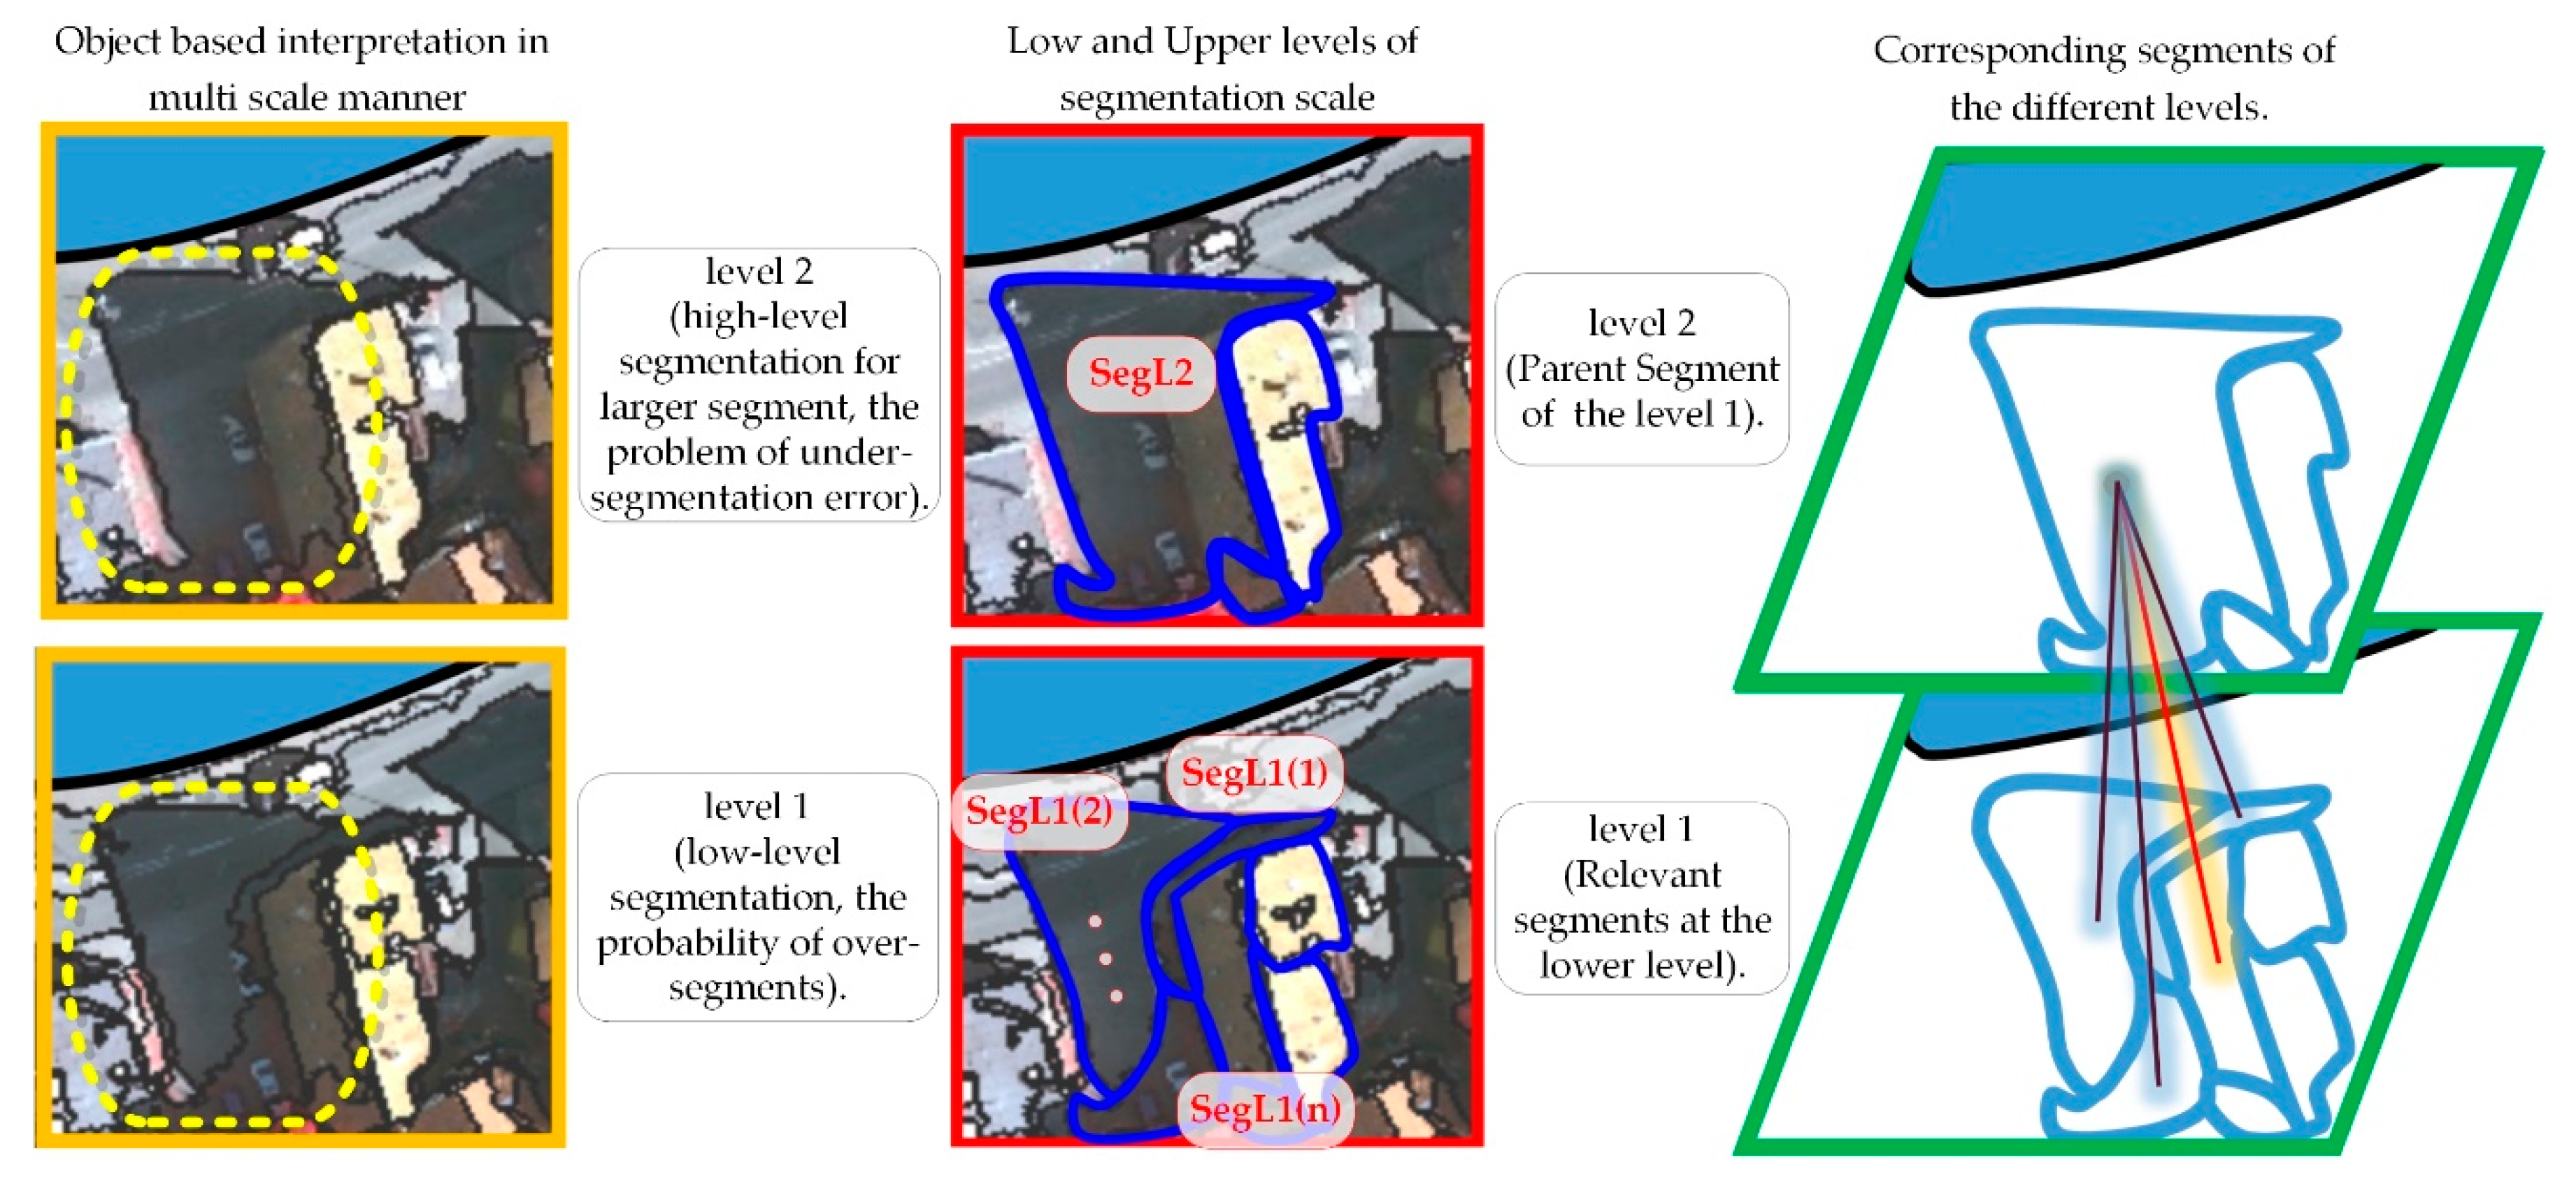
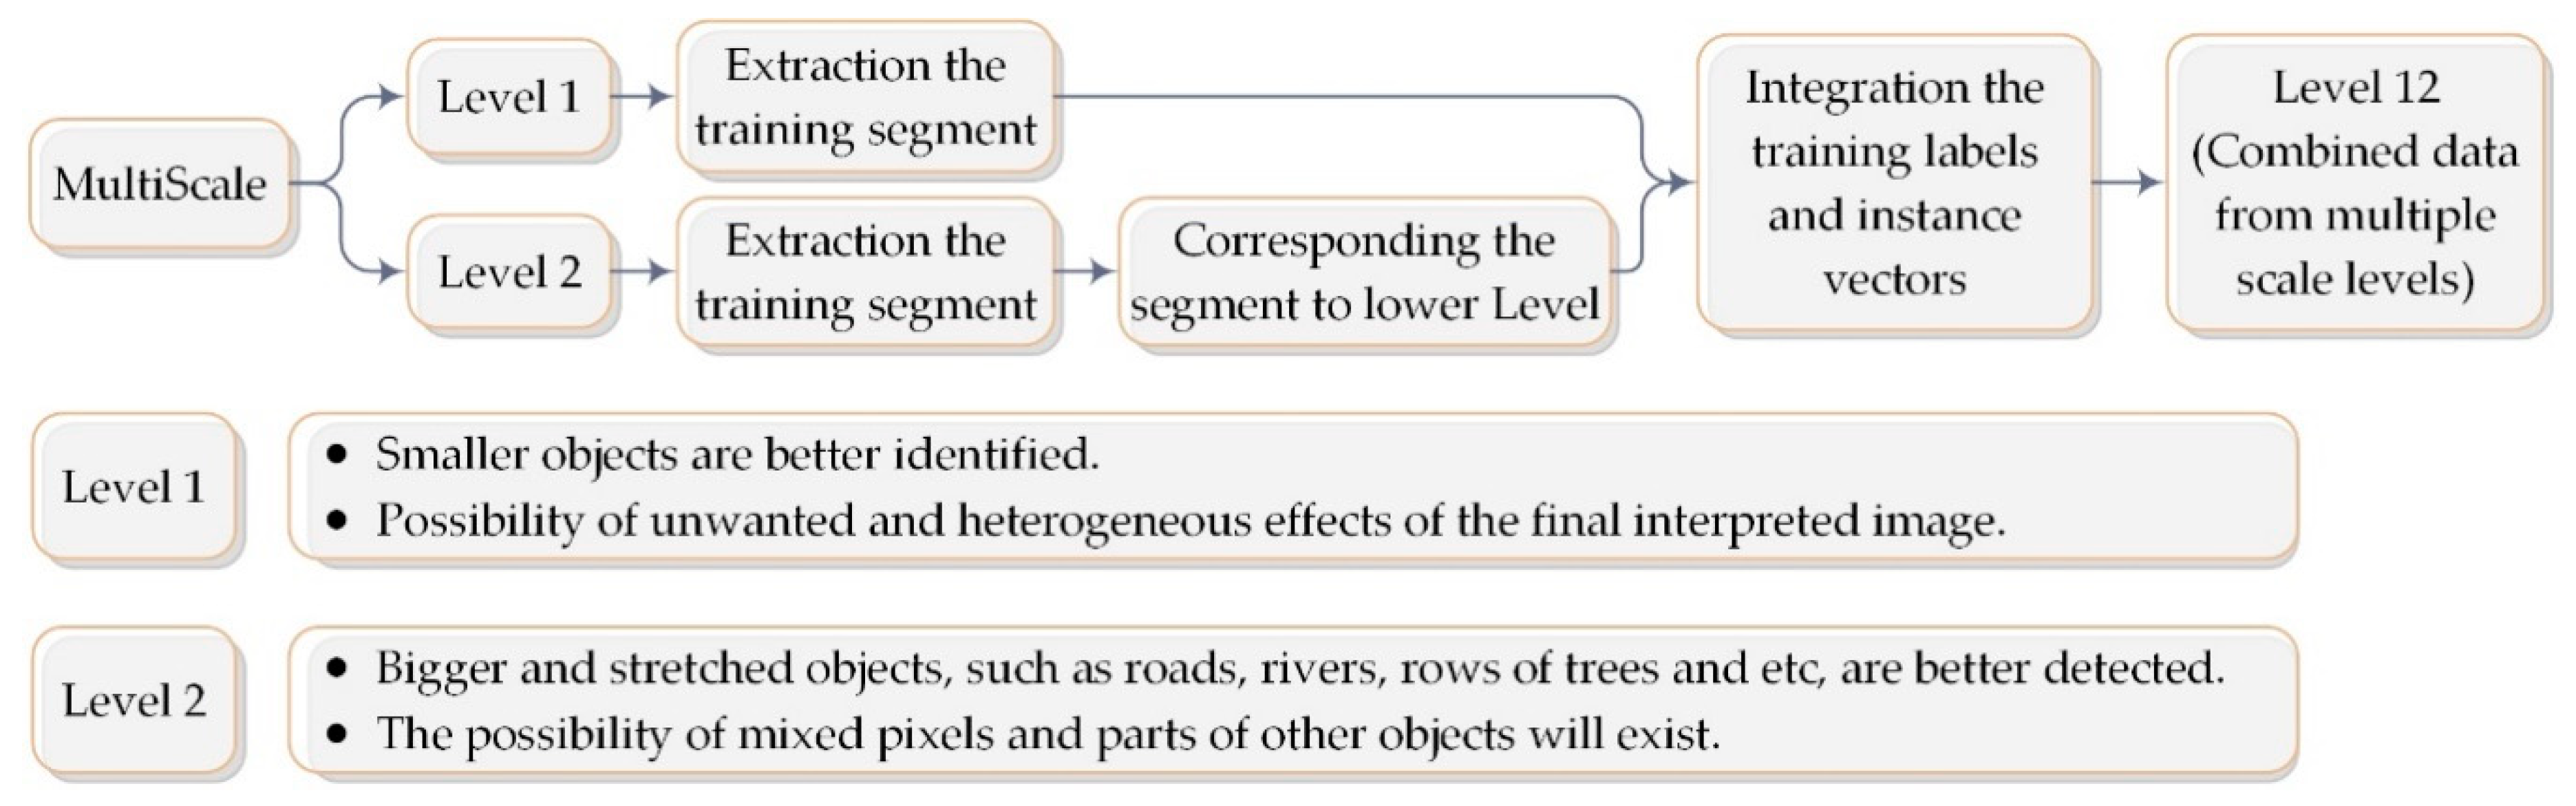
2.2. Multi Scale
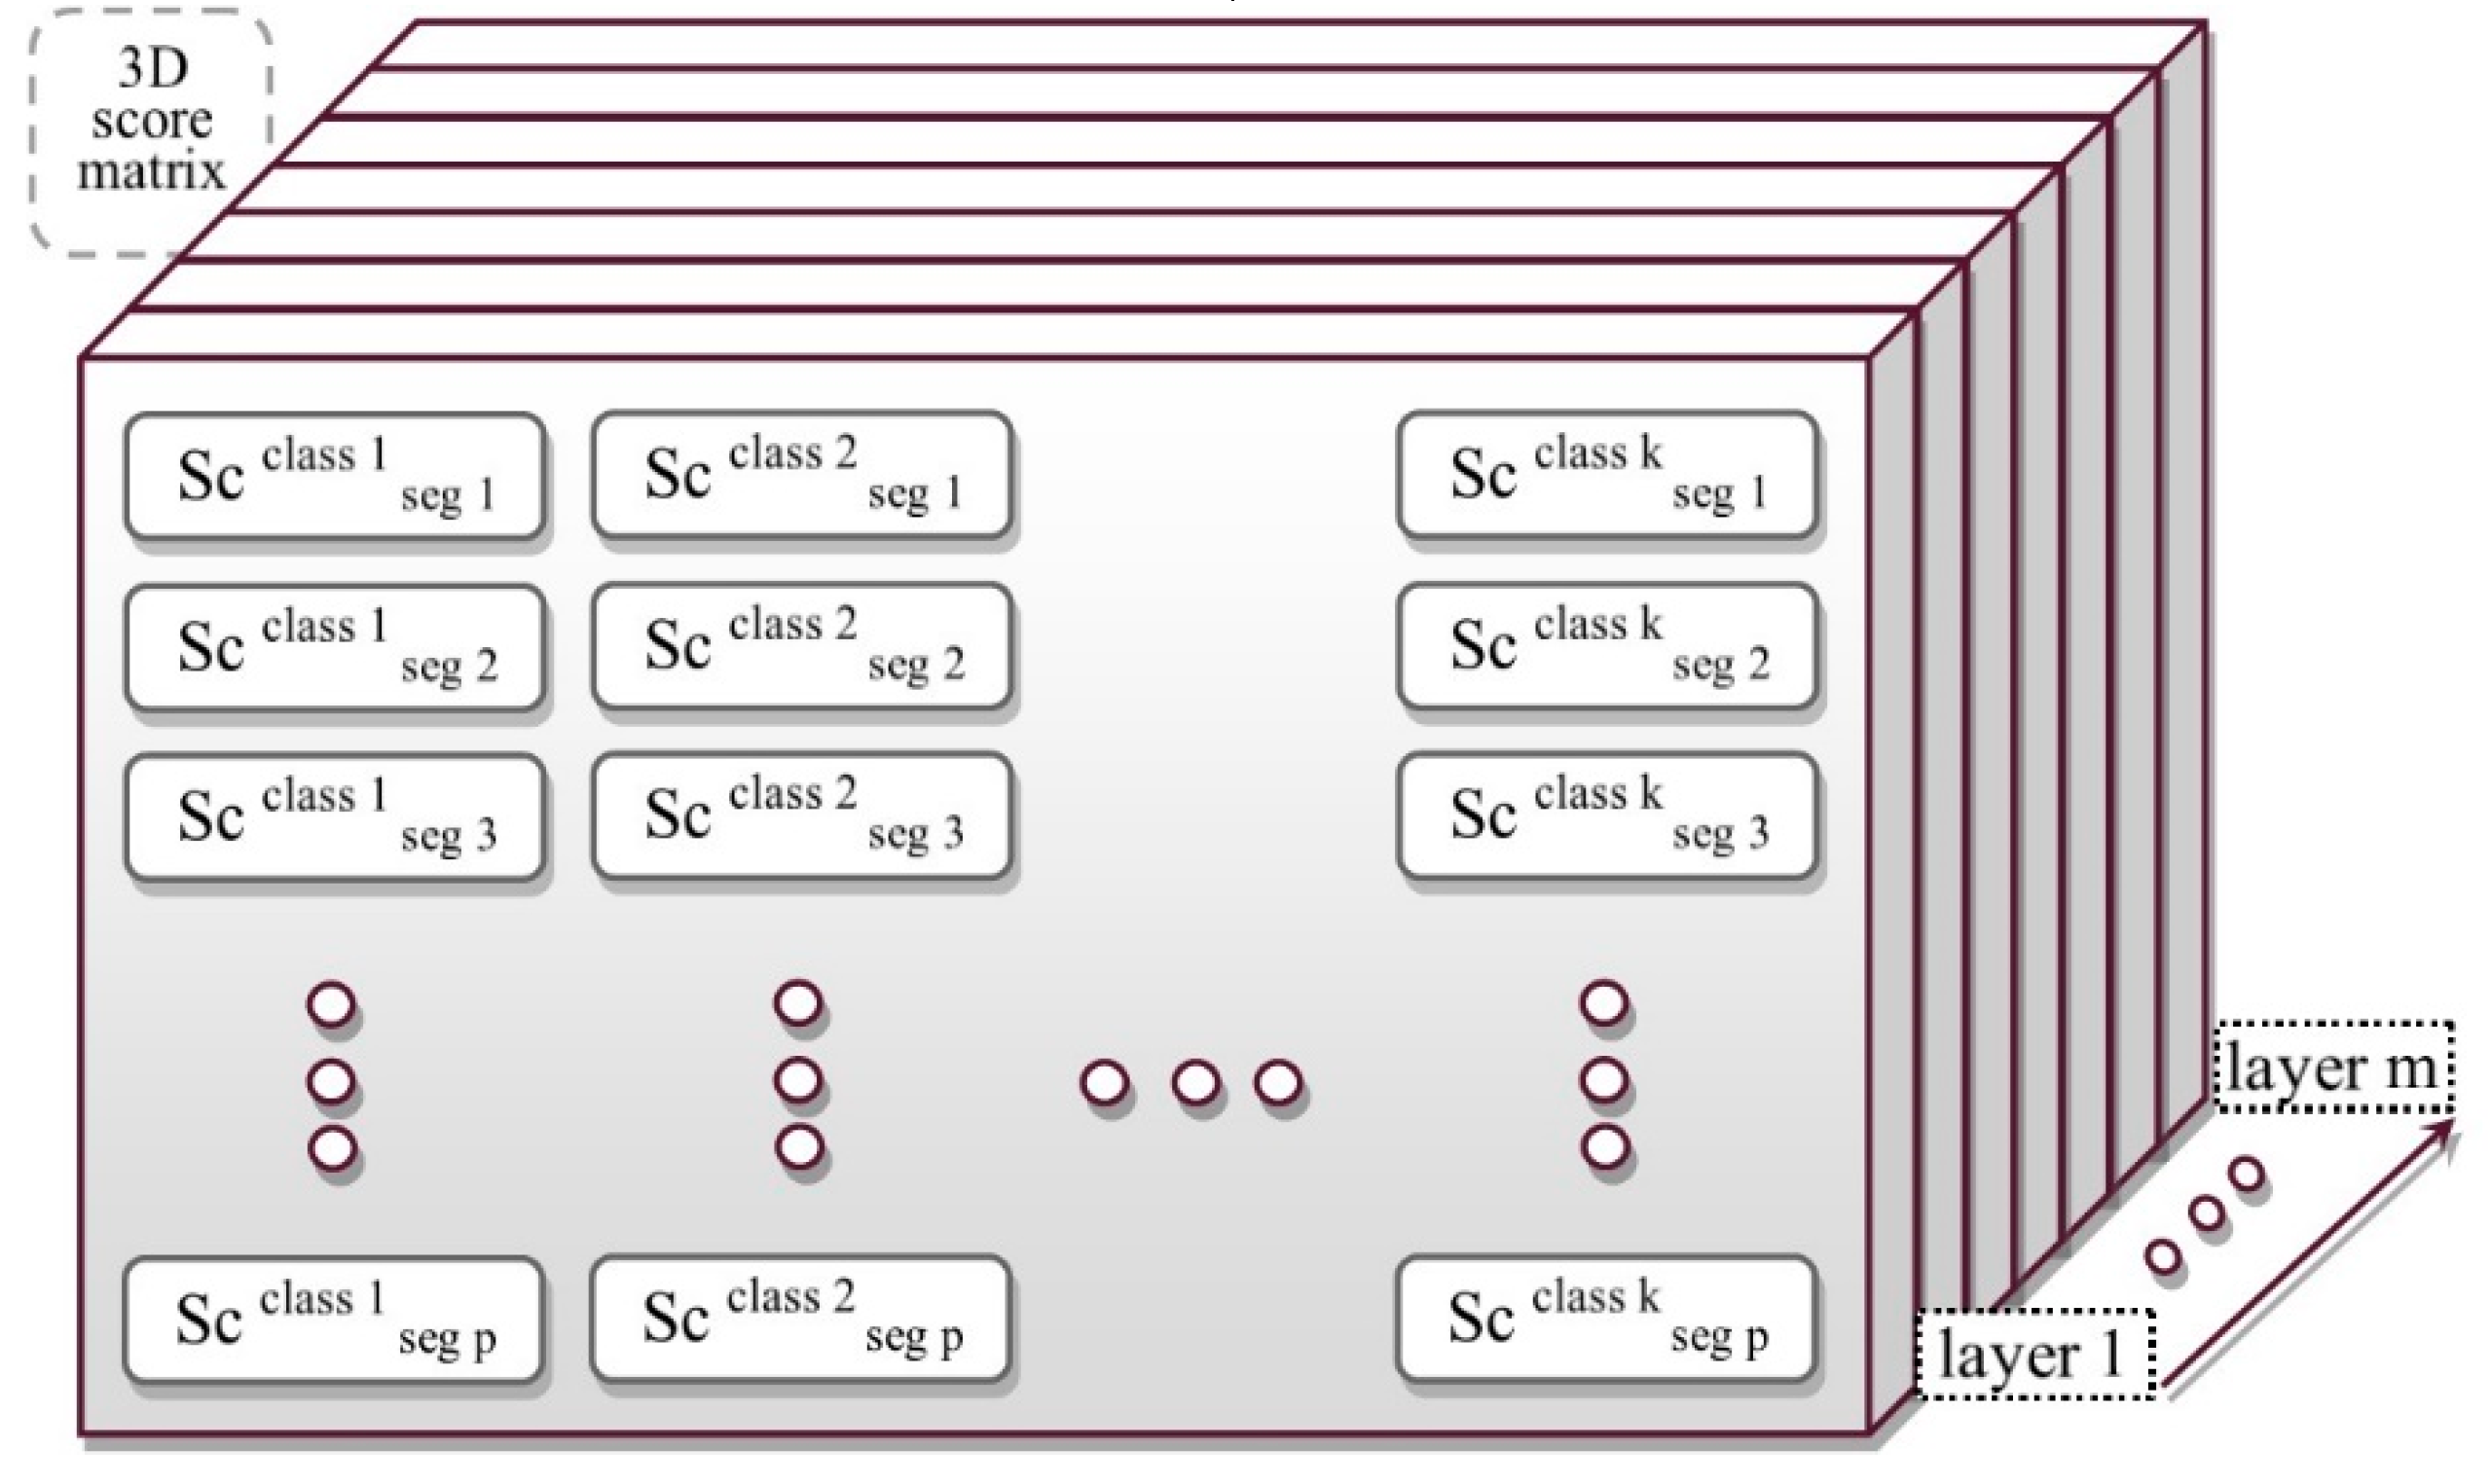
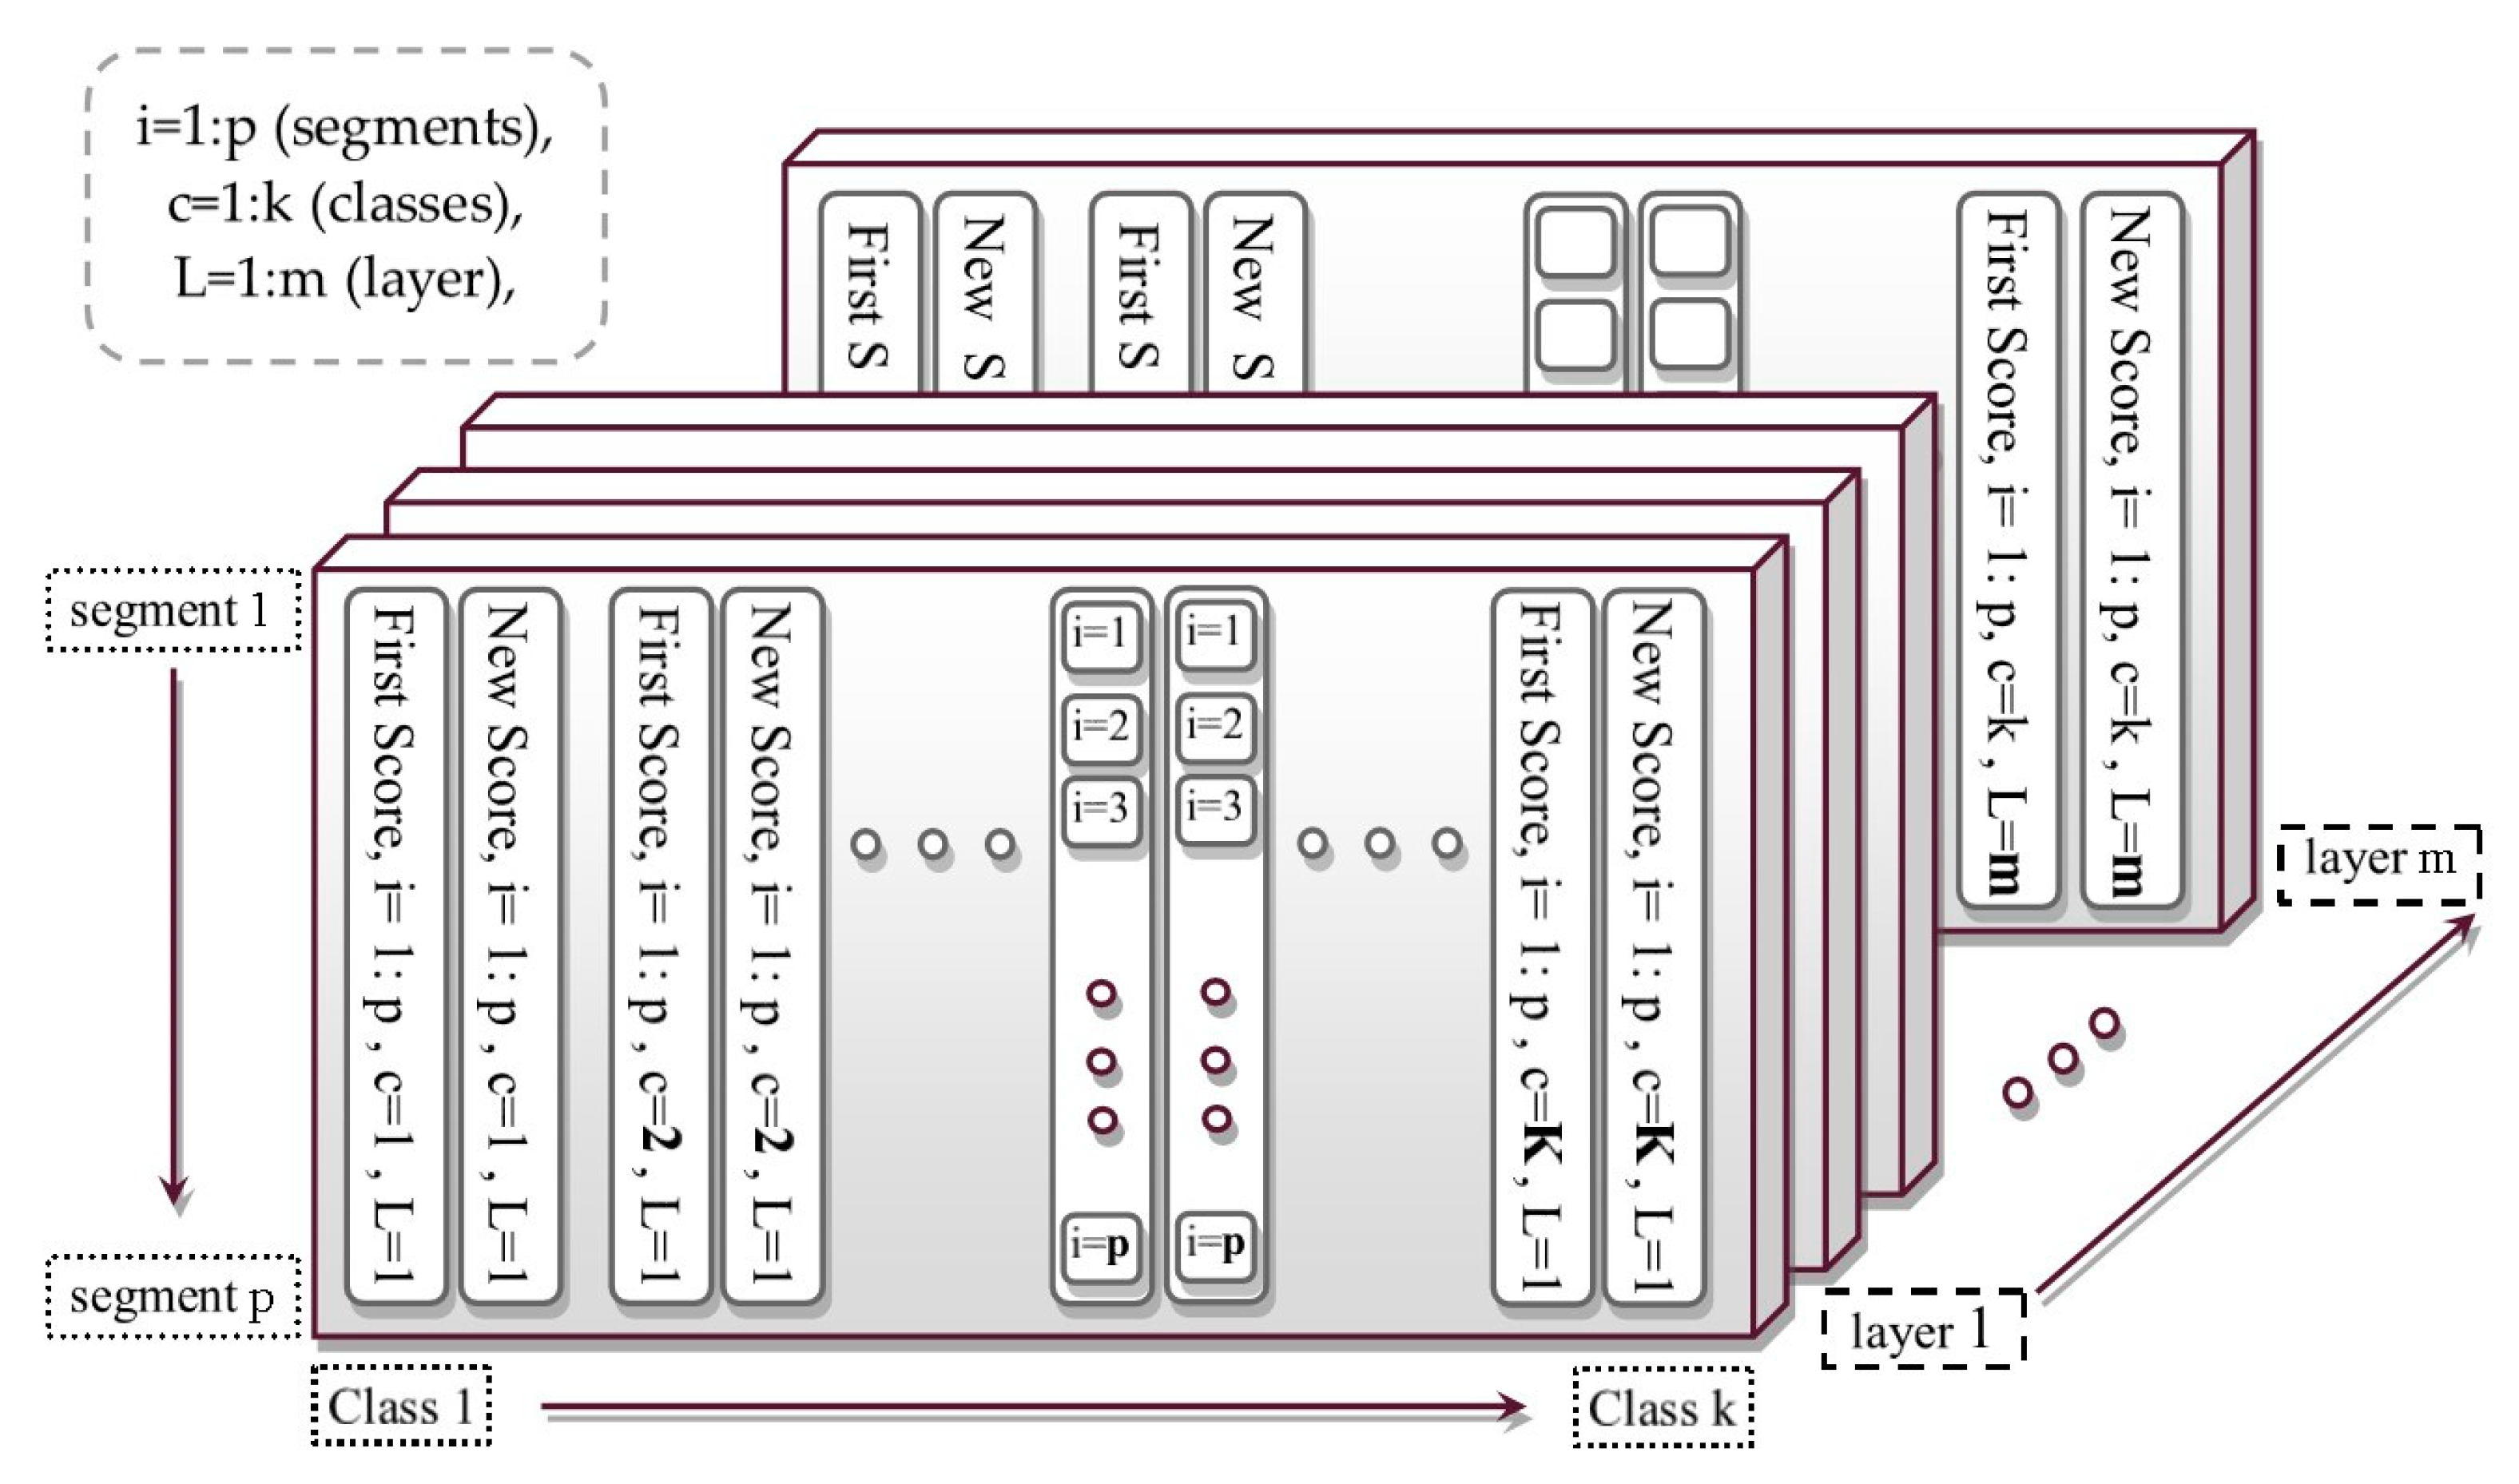
2.3. 3D Score Matrix
2.4. Weighted Scores
2.5. Uncertainty Analysis
2.6. Final Decision
2.7. Accuracy Evaluation
3. Implementation and Results
3.1. Implementation
3.2. Results
4. Discussion
5. Conclusions
- In this process, the selection of training samples was performed in a layered form. This was done to create various opportunities for system training. In addition, we were able to make an optimum decision based on the comparison of the scores of layers and collective wisdom. The use of the SVM method in each layer can be well suited to the mentioned conditions in the object-based classification in order to make a maximum-margin separation between the classes.
- In addition to dealing with probable defects as well as mixed segments in the samples, the KBS was used as an effective weight on the scores. In the employed KBS system, by considering the neighboring effect in the spatial domain, the spatial effect was also entered in the analysis in addition to the spectral data.
- The use of weighted scores for all layers (instead of the labels) reduces the effect of similar scores in an observation and mixed classes, which improved the decision-making process.
- In terms of object-based image classification, the varied sizes of segmentation objects caused sampling difficulties in the process of object-based classification. Accordingly, in the proposed method, training samples were extracted in the combined scale level.
- Another relevant challenge is the need to integrate the spatial and spectral information to take advantage of the complementarities that both sources of information can provide. In the used KBS system, by considering the neighboring effect in the spatial domain, in addition to the spectral data, the spatial effect as a weight was also entered into the analysis.
- Ultimately, for the final decision, the total score (instead of the resulting labels) obtained from the integration of different modes was incorporated, thus decreasing the effect of similar scores and mixed classes that weakened the decision-making process.
Author Contributions
Funding
Conflicts of Interest
References
- Ma, L.; Fu, T.; Blaschke, T.; Li, M.; Tiede, D.; Zhou, Z.; Ma, X.; Chen, D. Evaluation of feature selection methods for object-based land cover mapping of unmanned aerial vehicle imagery using random forest and support vector machine classifiers. ISPRS Int. J. Geo Inf. 2017, 6, 51. [Google Scholar] [CrossRef]
- Ma, L.; Li, M.; Ma, X.; Cheng, L.; Du, P.; Liu, Y. A review of supervised object-based land-cover image classification. ISPRS J. Photogramm. Remote Sens. 2017, 130, 277–293. [Google Scholar] [CrossRef]
- Blaschke, T.; Hay, G.J.; Kelly, M.; Lang, S.; Hofmann, P.; Addink, E.; Feitosa, R.Q.; van der Meer, F.; van der Werff, H.; van Coillie, F. Geographic object-based image analysis–towards a new paradigm. ISPRS J. Photogramm. Remote Sens. 2014, 87, 180–191. [Google Scholar] [CrossRef] [PubMed]
- Millard, K.; Richardson, M. On the importance of training data sample selection in random forest image classification: A case study in peatland ecosystem mapping. Remote Sens. 2015, 7, 8489–8515. [Google Scholar] [CrossRef]
- Costa, H.; Foody, G.M.; Boyd, D.S. Using mixed objects in the training of object-based image classifications. Remote Sens. Environ. 2017, 190, 188–197. [Google Scholar] [CrossRef]
- Li, M.; Ma, L.; Blaschke, T.; Cheng, L.; Tiede, D. A systematic comparison of different object-based classification techniques using high spatial resolution imagery in agricultural environments. Int. J. Appl. Earth Obs. Geoinf. 2016, 49, 87–98. [Google Scholar] [CrossRef]
- Belgiu, M.; Drăguţ, L. Random forest in remote sensing: A review of applications and future directions. ISPRS J. Photogramm. Remote Sens. 2016, 114, 24–31. [Google Scholar] [CrossRef]
- Salah, M. A survey of modern classification techniques in remote sensing for improved image classification. J. Geomat. 2017, 11, 1–21. [Google Scholar]
- Huang, C.; Davis, L.; Townshend, J. An assessment of support vector machines for land cover classification. Int. J. Remote Sens. 2002, 23, 725–749. [Google Scholar] [CrossRef]
- Pal, M.; Mather, P. Support vector machines for classification in remote sensing. Int. J. Remote Sens. 2005, 26, 1007–1011. [Google Scholar] [CrossRef]
- Pal, M. Random forest classifier for remote sensing classification. Int. J. Remote Sens. 2005, 26, 217–222. [Google Scholar] [CrossRef]
- Adam, E.; Mutanga, O.; Odindi, J.; Abdel-Rahman, E.M. Land-use/cover classification in a heterogeneous coastal landscape using RapidEye imagery: Evaluating the performance of random forest and support vector machines classifiers. Int. J. Remote Sens. 2014, 35, 3440–3458. [Google Scholar] [CrossRef]
- Zhang, C.; Xie, Z. Object-based vegetation mapping in the Kissimmee River watershed using HyMap data and machine learning techniques. Wetlands 2013, 33, 233–244. [Google Scholar] [CrossRef]
- Maxwell, A.; Strager, M.; Warner, T.; Zegre, N.; Yuill, C. Comparison of NAIP orthophotography and RapidEye satellite imagery for mapping of mining and mine reclamation. GISci. Remote Sens. 2014, 51, 301–320. [Google Scholar] [CrossRef]
- Maxwell, A.E.; Warner, T.A.; Strager, M.P.; Pal, M. Combining RapidEye satellite imagery and Lidar for mapping of mining and mine reclamation. Photogramm. Eng. Remote Sens. 2014, 80, 179–189. [Google Scholar] [CrossRef]
- Maxwell, A.; Warner, T.; Strager, M.; Conley, J.; Sharp, A. Assessing machine-learning algorithms and image-and lidar-derived variables for GEOBIA classification of mining and mine reclamation. Int. J. Remote Sens. 2015, 36, 954–978. [Google Scholar] [CrossRef]
- Ghosh, A.; Fassnacht, F.E.; Joshi, P.K.; Koch, B. A framework for mapping tree species combining hyperspectral and LiDAR data: Role of selected classifiers and sensor across three spatial scales. Int. J. Appl. Earth Obs. Geoinf. 2014, 26, 49–63. [Google Scholar] [CrossRef]
- Chan, J.C.W.; Paelinckx, D. Evaluation of Random Forest and Adaboost tree-based ensemble classification and spectral band selection for ecotope mapping using airborne hyperspectral imagery. Remote Sens. Environ. 2008, 112, 2999–3011. [Google Scholar] [CrossRef]
- Khatami, R.; Mountrakis, G.; Stehman, S.V. A meta-analysis of remote sensing research on supervised pixel-based land-cover image classification processes: General guidelines for practitioners and future research. Remote Sens. Environ. 2016, 177, 89–100. [Google Scholar] [CrossRef]
- Russell, S.J.; Norvig, P. Artificial Intelligence: A Modern Approach; Pearson Education Limited: Kuala Lumpur, Malaysia, 2016. [Google Scholar]
- Bekkar, M.; Alitouche, T.A. Imbalanced data learning approaches review. Int. J. Data Min. Knowl. Manag. Process 2013, 3, 15–33. [Google Scholar] [CrossRef]
- Liu, Y.; Huang, L. A novel ensemble support vector machine model for land cover classification. Int. J. Distrib. Sens. Netw. 2019, 15, 1–9. [Google Scholar] [CrossRef]
- Huang, X.; Zhang, L. An SVM ensemble approach combining spectral, structural, and semantic features for the classification of high-resolution remotely sensed imagery. IEEE Trans. Geosci. Remote Sens. 2012, 51, 257–272. [Google Scholar] [CrossRef]
- Liu, W.; Gopal, S.; Woodcock, C.E. Uncertainty and confidence in land cover classification using a hybrid classifier approach. Photogramm. Eng. Remote Sens. 2004, 70, 963–971. [Google Scholar] [CrossRef]
- Lu, D.; Weng, Q. A survey of image classification methods and techniques for improving classification performance. Int. J. Remote Sens. 2007, 28, 823–870. [Google Scholar] [CrossRef]
- Rougier, S.; Puissant, A.; Stumpf, A.; Lachiche, N. Comparison of sampling strategies for object-based classification of urban vegetation from Very High Resolution satellite images. Int. J. Appl. Earth Obs. Geoinf. 2016, 51, 60–73. [Google Scholar] [CrossRef]
- Huang, Q.; Wu, G.; Chen, J.; Chu, H. Automated remote sensing image classification method based on FCM and SVM. In Proceedings of the 2012 2nd International Conference on Remote Sensing, Environment and Transportation Engineering, Nanjing, China, 1–3 June 2012; pp. 1–4. [Google Scholar]
- Yu, X.; Zhou, W.; He, H. A method of remote sensing image auto classification based on interval type-2 fuzzy c-means. In Proceedings of the 2014 IEEE International Conference on Fuzzy Systems (FUZZ-IEEE), Beijing, China, 6–11 July 2014; pp. 223–228. [Google Scholar]
- Lia, Q.; Baob, W.; Lic, X.; Lid, B. High Resolution Remote Sensing Image Classification based on SVM and FCM. In Proceedings of the 2015 2nd International Conference on Electrical, Computer Engineering and Electronics (ICECEE 2015), Jinan, China, 29–31 May 2015; pp. 1271–1278. [Google Scholar]
- Kiani, A.; Ebadi, H.; Ahmadi, F.F.; Masoumi, S. Design and Implementation of an Expert Interpreter System for Intelligent Acquisition of Spatial Data from Aerial or Remotely Sensed Images. Measurement 2014, 47, 676–685. [Google Scholar] [CrossRef]
- Huete, A.R. A soil-adjusted vegetation index (SAVI). Remote Sens. Environ. 1988, 25, 295–309. [Google Scholar] [CrossRef]
- Axelsson, P. DEM generation from laser scanner data using adaptive TIN models. Int. Arch. Photogramm. Remote Sens. 2000, 33, 111–118. [Google Scholar]
- Gerke, M. Normalized DSM-Heights Encoded in Dm-See Report for Details. Available online: https://www.researchgate.net/profile/Markus_Gerke/publication (accessed on 1 December 2014).
- Otsu, N. A threshold selection method from gray-level histograms. IEEE Trans. Syst. Man. Cybern. 1979, 9, 62–66. [Google Scholar] [CrossRef]
- Benz, U.C.; Hofmann, P.; Willhauck, G.; Lingenfelder, I.; Heynen, M. Multi-resolution, object-oriented fuzzy analysis of remote sensing data for GIS-ready information. ISPRS J. Photogramm. Remote Sens. 2004, 58, 239–258. [Google Scholar] [CrossRef]
- Drăguţ, L.; Csillik, O.; Eisank, C.; Tiede, D. Automated parameterisation for multi-scale image segmentation on multiple layers. ISPRS J. Photogramm. Remote Sens. 2014, 88, 119–127. [Google Scholar] [CrossRef] [PubMed]
- Allwein, E.L.; Schapire, R.E.; Singer, Y. Reducing multiclass to binary: A unifying approach for margin classifiers. J. Mach. Learn. Res. 2000, 1, 113–141. [Google Scholar]
- Escalera, S.; Pujol, O.; Radeva, P. On the decoding process in ternary error-correcting output codes. IEEE Trans. Pattern Anal. Mach. Intell. 2010, 32, 120–134. [Google Scholar] [CrossRef] [PubMed]
- Ning, J.; Zhang, L.; Zhang, D.; Wu, C. Interactive image segmentation by maximal similarity based region merging. Pattern Recognit. 2010, 43, 445–456. [Google Scholar] [CrossRef]
- Carletta, J. Assessing agreement on classification tasks: The kappa statistic. Comput. Linguist. 1996, 22, 249–254. [Google Scholar]
- de Leeuw, J.; Jia, H.; Yang, L.; Liu, X.; Schmidt, K.; Skidmore, A. Comparing accuracy assessments to infer superiority of image classification methods. Int. J. Remote Sens. 2006, 27, 223–232. [Google Scholar] [CrossRef]
- Foody, G.M. Thematic map comparison. Photogramm. Eng. Remote Sens. 2004, 70, 627–633. [Google Scholar] [CrossRef]
- Mushore, T.D.; Mutanga, O.; Odindi, J.; Dube, T. Assessing the potential of integrated Landsat 8 thermal bands, with the traditional reflective bands and derived vegetation indices in classifying urban landscapes. Geocarto Int. 2017, 32, 886–899. [Google Scholar] [CrossRef]
- Rottensteiner, F.; Sohn, G.; Gerke, M.; Wegner, J.D. ISPRS Test Project on Urban Classification and 3D Building Reconstruction. Commission III-Photogrammetric Computer Vision and Image Analysis, Working Group III/4-3D Scene Analysis. 2013. Available online: http://www.cvlibs.net/projects/autonomous_vision_survey/literature/Rottensteiner2013.pdf (accessed on 1 January 2016).
- Chandra, A.; Yao, X. Evolving hybrid ensembles of learning machines for better generalisation. Neurocomputing 2006, 69, 686–700. [Google Scholar] [CrossRef]
- van der Linden, S.; Rabe, A.; Held, M.; Jakimow, B.; Leitão, P.J.; Okujeni, A.; Schwieder, M.; Suess, S.; Hostert, P. The EnMAP-Box—A toolbox and application programming interface for EnMAP data processing. Remote Sens. 2015, 7, 11249–11266. [Google Scholar] [CrossRef]
- Waske, B.; van der Linden, S.; Oldenburg, C.; Jakimow, B.; Rabe, A.; Hostert, P. ImageRF—A user-oriented implementation for remote sensing image analysis with Random Forests. Environ. Model. Softw. 2012, 35, 192–193. [Google Scholar] [CrossRef]
- Freund, Y.; Schapire, R.E. Experiments with a new boosting algorithm. In Proceedings of the Thirteenth International Conference on Machine Learning (ICML’96), Bari, Italy, 3–6 July 1996; pp. 148–156. [Google Scholar]
- Maxwell, A.E.; Warner, T.A.; Fang, F. Implementation of machine-learning classification in remote sensing: An applied review. Int. J. Remote Sens. 2018, 39, 2784–2817. [Google Scholar] [CrossRef]
- Rogan, J.; Franklin, J.; Stow, D.; Miller, J.; Woodcock, C.; Roberts, D. Mapping land-cover modifications over large areas: A comparison of machine learning algorithms. Remote Sens. Environ. 2008, 112, 2272–2283. [Google Scholar] [CrossRef]
- Pal, M.; Mather, P. Some issues in the classification of DAIS hyperspectral data. Int. J. Remote Sens. 2006, 27, 2895–2916. [Google Scholar] [CrossRef]
- Radoux, J.; Lamarche, C.; Van Bogaert, E.; Bontemps, S.; Brockmann, C.; Defourny, P. Automated training sample extraction for global land cover mapping. Remote Sens. 2014, 6, 3965–3987. [Google Scholar] [CrossRef]
- Chen, D.; Stow, D. The effect of training strategies on supervised classification at different spatial resolutions. Photogramm. Eng. Remote Sens. 2002, 68, 1155–1162. [Google Scholar]
- Foody, G.M.; Mathur, A. Toward intelligent training of supervised image classifications: Directing training data acquisition for SVM classification. Remote Sens. Environ. 2004, 93, 107–117. [Google Scholar] [CrossRef]


| Test Image | Evaluation Parameters | Base | Majority Voting | Proposed Method |
|---|---|---|---|---|
| I | Kappa coefficient | 65.52 | 68.82 | 77.65 |
| Overall accuracy | 78.61 | 80.94 | 86.33 | |
| II | K.CO. | 68.73 | 71.77 | 76.32 |
| O.A. | 77.55 | 79.54 | 82.62 | |
| III | K.CO. | 62.89 | 62.53 | 65.22 |
| O.A. | 72.45 | 72.34 | 74.70 | |
| IV | K.CO. | 56.70 | 66.73 | 75.81 |
| O.A. | 68.63 | 75.02 | 81.93 | |
| V | K.CO. | 66.59 | 66.87 | 71.36 |
| O.A. | 75.05 | 75.28 | 78.74 |
| Test Image | Class | Base | Majority Voting | Proposed Method |
|---|---|---|---|---|
| IV | Building | 62.53 | 78.84 | 86.83 |
| Grass land | 49.60 | 53.07 | 63.14 | |
| Tree | 84.20 | 83.96 | 86.43 | |
| Water body | 41.52 | 72.52 | 76.00 | |
| Road & Parking | 70.09 | 73.29 | 81.76 | |
| V | Building | 82.47 | 82.20 | 86.84 |
| Grass land | 64.49 | 66.25 | 70.80 | |
| Tree | 72.51 | 72.31 | 73.73 | |
| Road & Parking | 76.76 | 76.85 | 79.89 |
| Test Image | Evaluation Parameters | RF | AdaBoost | RF | AdaBoost | RF | AdaBoost |
|---|---|---|---|---|---|---|---|
| #Tree | =100 | #Tree | =150 | #Tree | =200 | ||
| I | K.CO. | 68.08 | 65.53 | 67.1 | 63.56 | 67.56 | 63.4 |
| O.A. | 80.37 | 78.52 | 79.81 | 77.28 | 80.04 | 77.16 | |
| II | K.CO. | 70.91 | 67.02 | 71.28 | 66.04 | 70.08 | 64.94 |
| O.A. | 78.85 | 76.31 | 79.17 | 75.57 | 78.24 | 74.78 | |
| III | K.CO. | 61.84 | 62.99 | 61.64 | 62.35 | 61.57 | 62.44 |
| O.A. | 71.59 | 72.61 | 71.44 | 72.09 | 71.39 | 72.18 | |
| IV | K.CO. | 66.32 | 60.94 | 66.92 | 62.15 | 65.91 | 63.34 |
| O.A. | 74.91 | 71.12 | 75.62 | 71.98 | 74.7 | 72.59 | |
| V | K.CO. | 65.78 | 66.37 | 67.57 | 67.18 | 66.13 | 67.03 |
| O.A. | 74.55 | 74.86 | 75.85 | 75.51 | 74.81 | 75.39 |
| Test Image | Eva. Par. 1 | Pr. M. 2 | #Tree | Op. SVM 4 | RF | #Tree | AdaBoost | #Tree |
|---|---|---|---|---|---|---|---|---|
| Pr. Layer 3 | Best 5 | Best | ||||||
| I | K.CO. | 77.65 | 102 | 66.84 | 68.08 | 100 | 65.53 | 100 |
| O.A. | 86.33 | 79.55 | 80.37 | 78.52 | ||||
| II | K.CO. | 76.32 | 100 | 71.53 | 71.28 | 150 | 67.02 | 100 |
| O.A. | 82.62 | 79.51 | 79.17 | 76.31 | ||||
| III | K.CO. | 65.22 | 100 | 63.83 | 61.84 | 100 | 62.99 | 100 |
| O.A. | 74.70 | 73.19 | 71.59 | 72.61 | ||||
| IV | K.CO. | 75.81 | 158 | 68.01 | 66.92 | 150 | 63.34 | 200 |
| O.A. | 81.93 | 76.35 | 75.62 | 72.59 | ||||
| V | K.CO. | 71.36 | 152 | 67.61 | 67.57 | 150 | 67.18 | 150 |
| O.A. | 78.74 | 75.79 | 75.85 | 75.51 |
| Test Image | Eva. Par. | Without Multi-Layers 1 | Without Multi-Level 2 | Proposed Method |
|---|---|---|---|---|
| III | K.CO. | 63.14 | 64.86 | 65.31 |
| O.A. | 72.78 | 74.39 | 74.77 | |
| Mc. Test 3 | 180 | 50 | ||
| IV | K.CO. | 74.37 | 75.49 | 78.23 |
| O.A. | 80.76 | 81.41 | 83.50 | |
| Mc. Test | 210 | 210 |
| #Layer | Evaluation Parameters | RF | Adaboost | Other Methods | ||
|---|---|---|---|---|---|---|
| 100 | K.CO. | 60.44 | 61.36 | Op. SVM | K.CO. | 61.87 |
| O.A. | 70.96 | 71.55 | O.A. | 71.67 | ||
| Mc. Test | 230 | 240 | Mc. Test | 190 | ||
| 150 | K.CO. | 60.28 | 61.89 | All Maj. Vote | K.CO. | 60.10 |
| O.A. | 70.84 | 71.96 | O.A. | 70.71 | ||
| Mc. Test | 250 | 190 | Mc. Test | 260 | ||
| 200 | K.CO. | 60.05 | 61.54 | base | K.CO. | 60.36 |
| O.A. | 70.66 | 71.73 | O.A. | 70.56 | ||
| Mc. Test | 260 | 200 | Mc. Test | 240 | ||
© 2019 by the authors. Licensee MDPI, Basel, Switzerland. This article is an open access article distributed under the terms and conditions of the Creative Commons Attribution (CC BY) license (http://creativecommons.org/licenses/by/4.0/).
Share and Cite
Kiani, A.; Ebadi, H.; Farnood Ahmadi, F. Development of an Object-Based Interpretive System Based on Weighted Scoring Method in a Multi-Scale Manner. ISPRS Int. J. Geo-Inf. 2019, 8, 398. https://doi.org/10.3390/ijgi8090398
Kiani A, Ebadi H, Farnood Ahmadi F. Development of an Object-Based Interpretive System Based on Weighted Scoring Method in a Multi-Scale Manner. ISPRS International Journal of Geo-Information. 2019; 8(9):398. https://doi.org/10.3390/ijgi8090398
Chicago/Turabian StyleKiani, Abbas, Hamid Ebadi, and Farshid Farnood Ahmadi. 2019. "Development of an Object-Based Interpretive System Based on Weighted Scoring Method in a Multi-Scale Manner" ISPRS International Journal of Geo-Information 8, no. 9: 398. https://doi.org/10.3390/ijgi8090398
APA StyleKiani, A., Ebadi, H., & Farnood Ahmadi, F. (2019). Development of an Object-Based Interpretive System Based on Weighted Scoring Method in a Multi-Scale Manner. ISPRS International Journal of Geo-Information, 8(9), 398. https://doi.org/10.3390/ijgi8090398